A Farming System Approach to Exploring Drivers of Food Insecurity Among Farm Households in Developing Countries: The Case Study of Mozambique
Abstract
1. Introduction
1.1. Background
1.2. A Farming System Approach to Food Insecurity
2. Materials and Methods
2.1. Study Area
2.2. Data
2.2.1. Farming System Typology
2.2.2. Food Insecurity: Drivers, Perceived Causes, and Coping Strategies
2.3. Statistical Analysis
3. Results
3.1. A Farming System Approach to Explore Food Insecurity
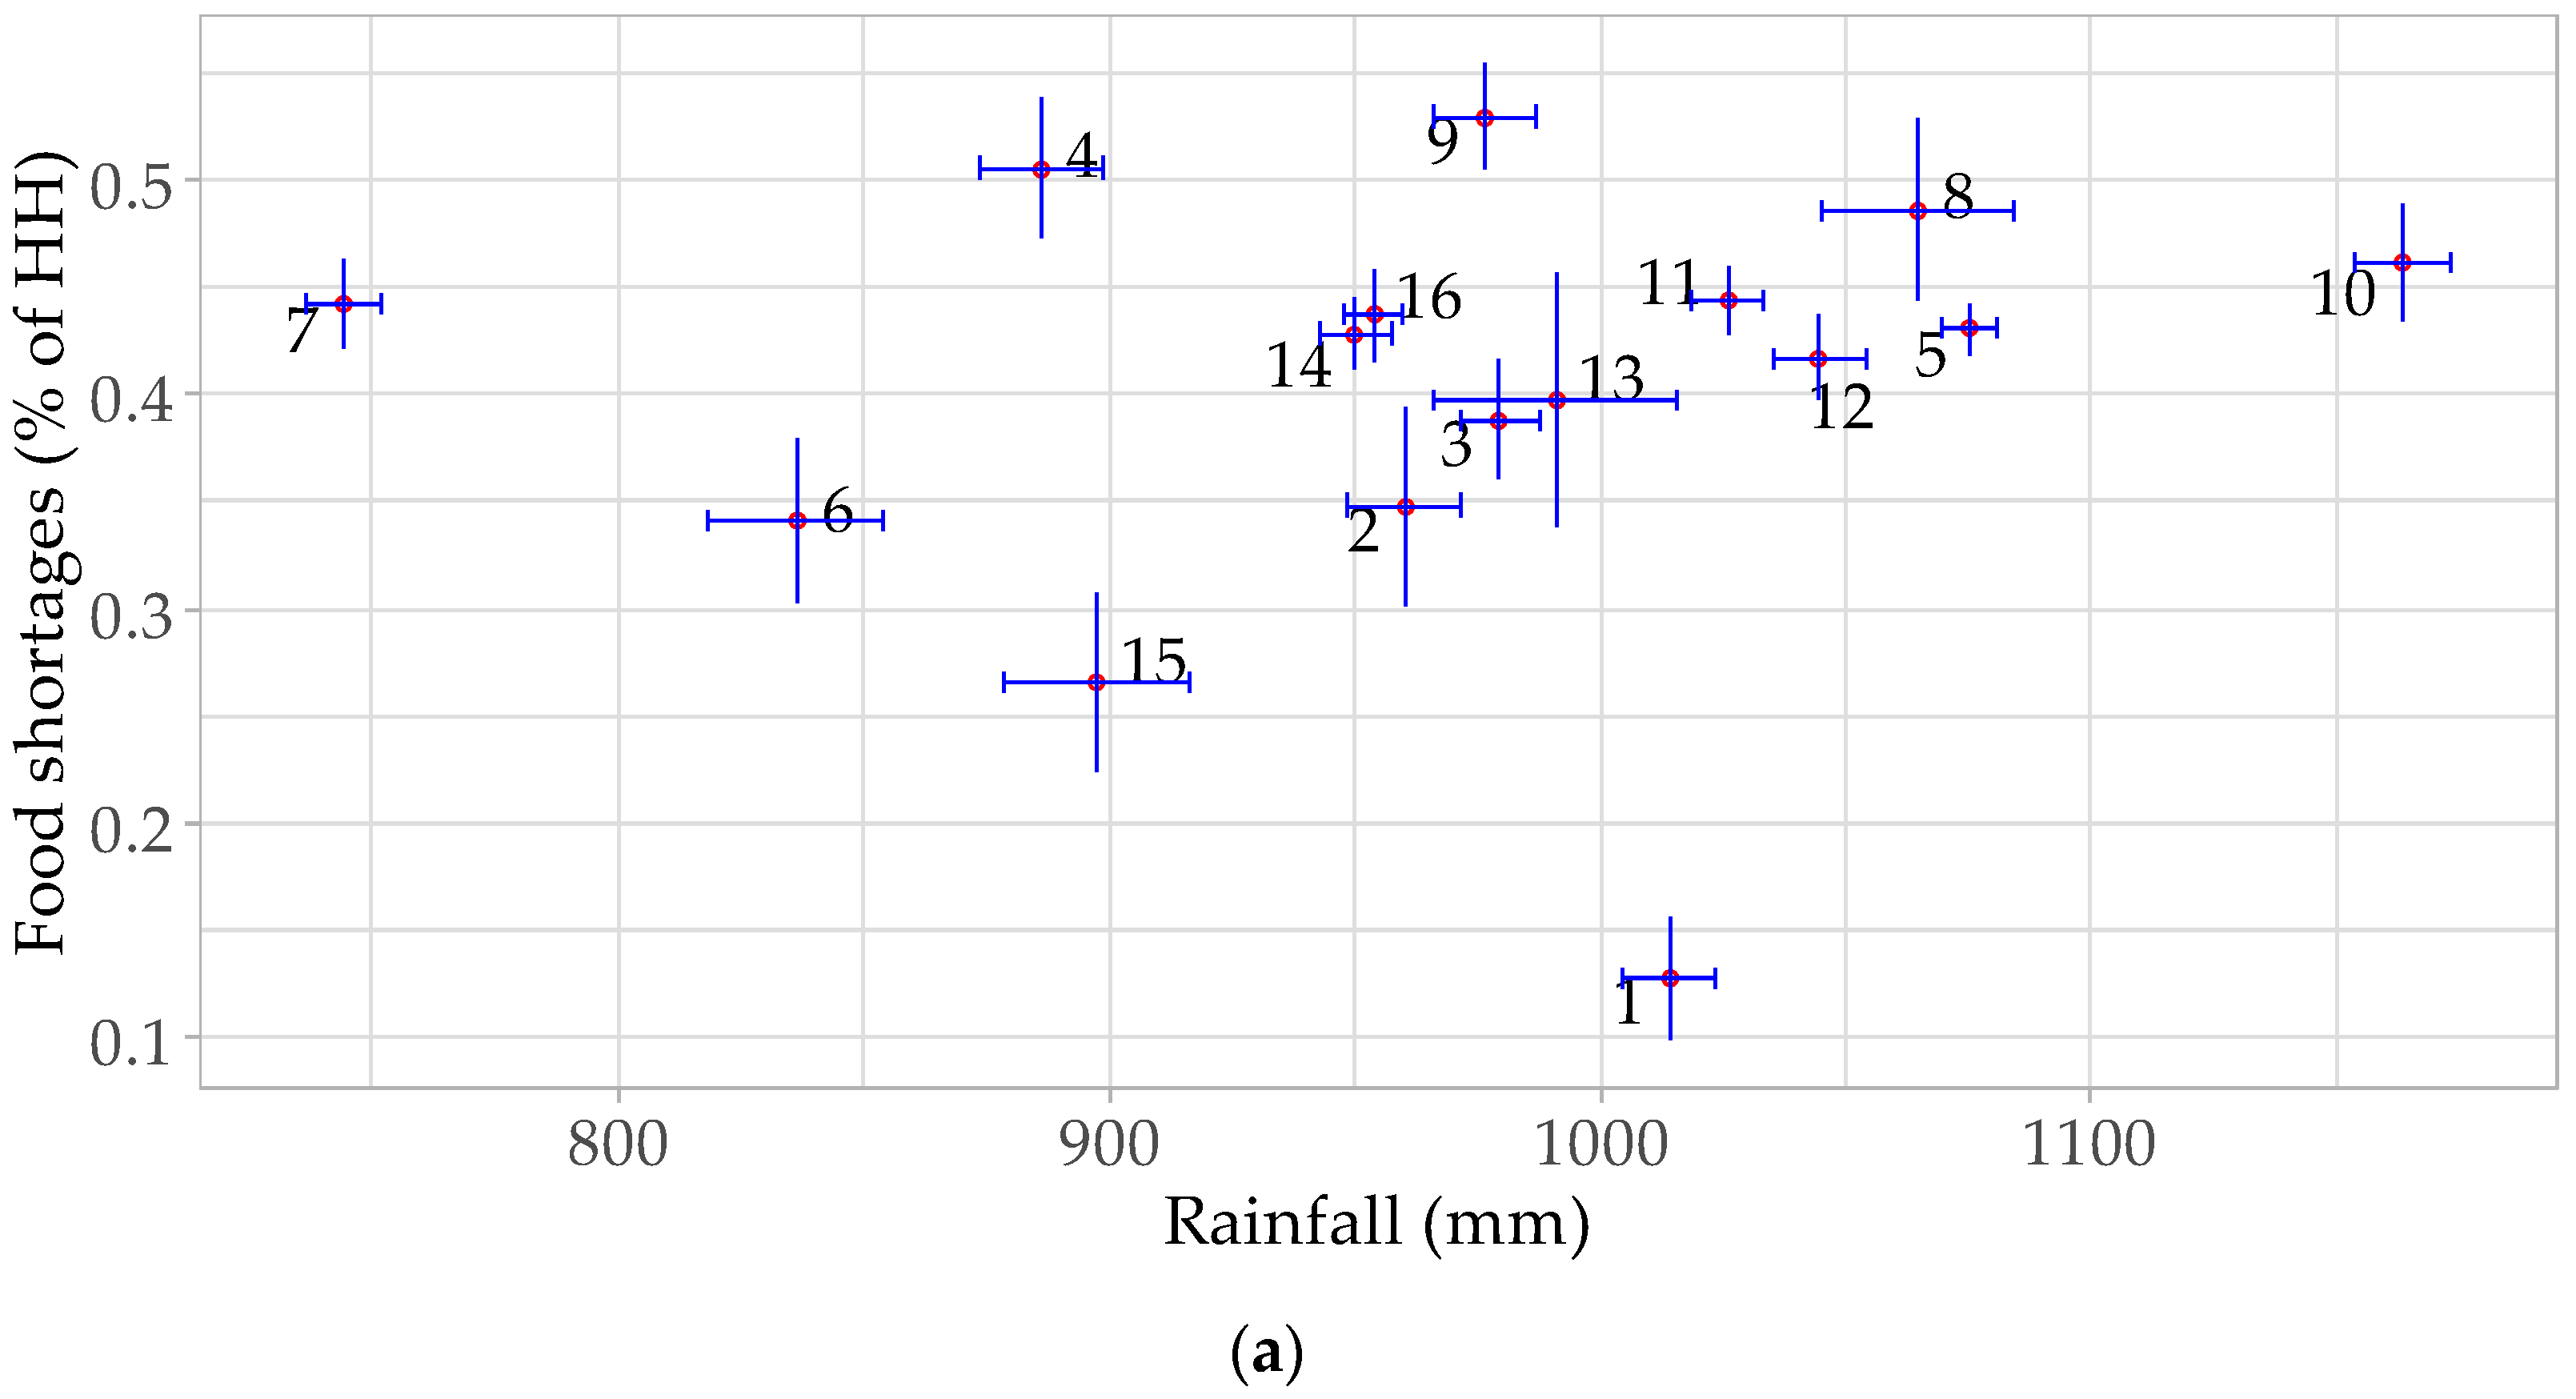
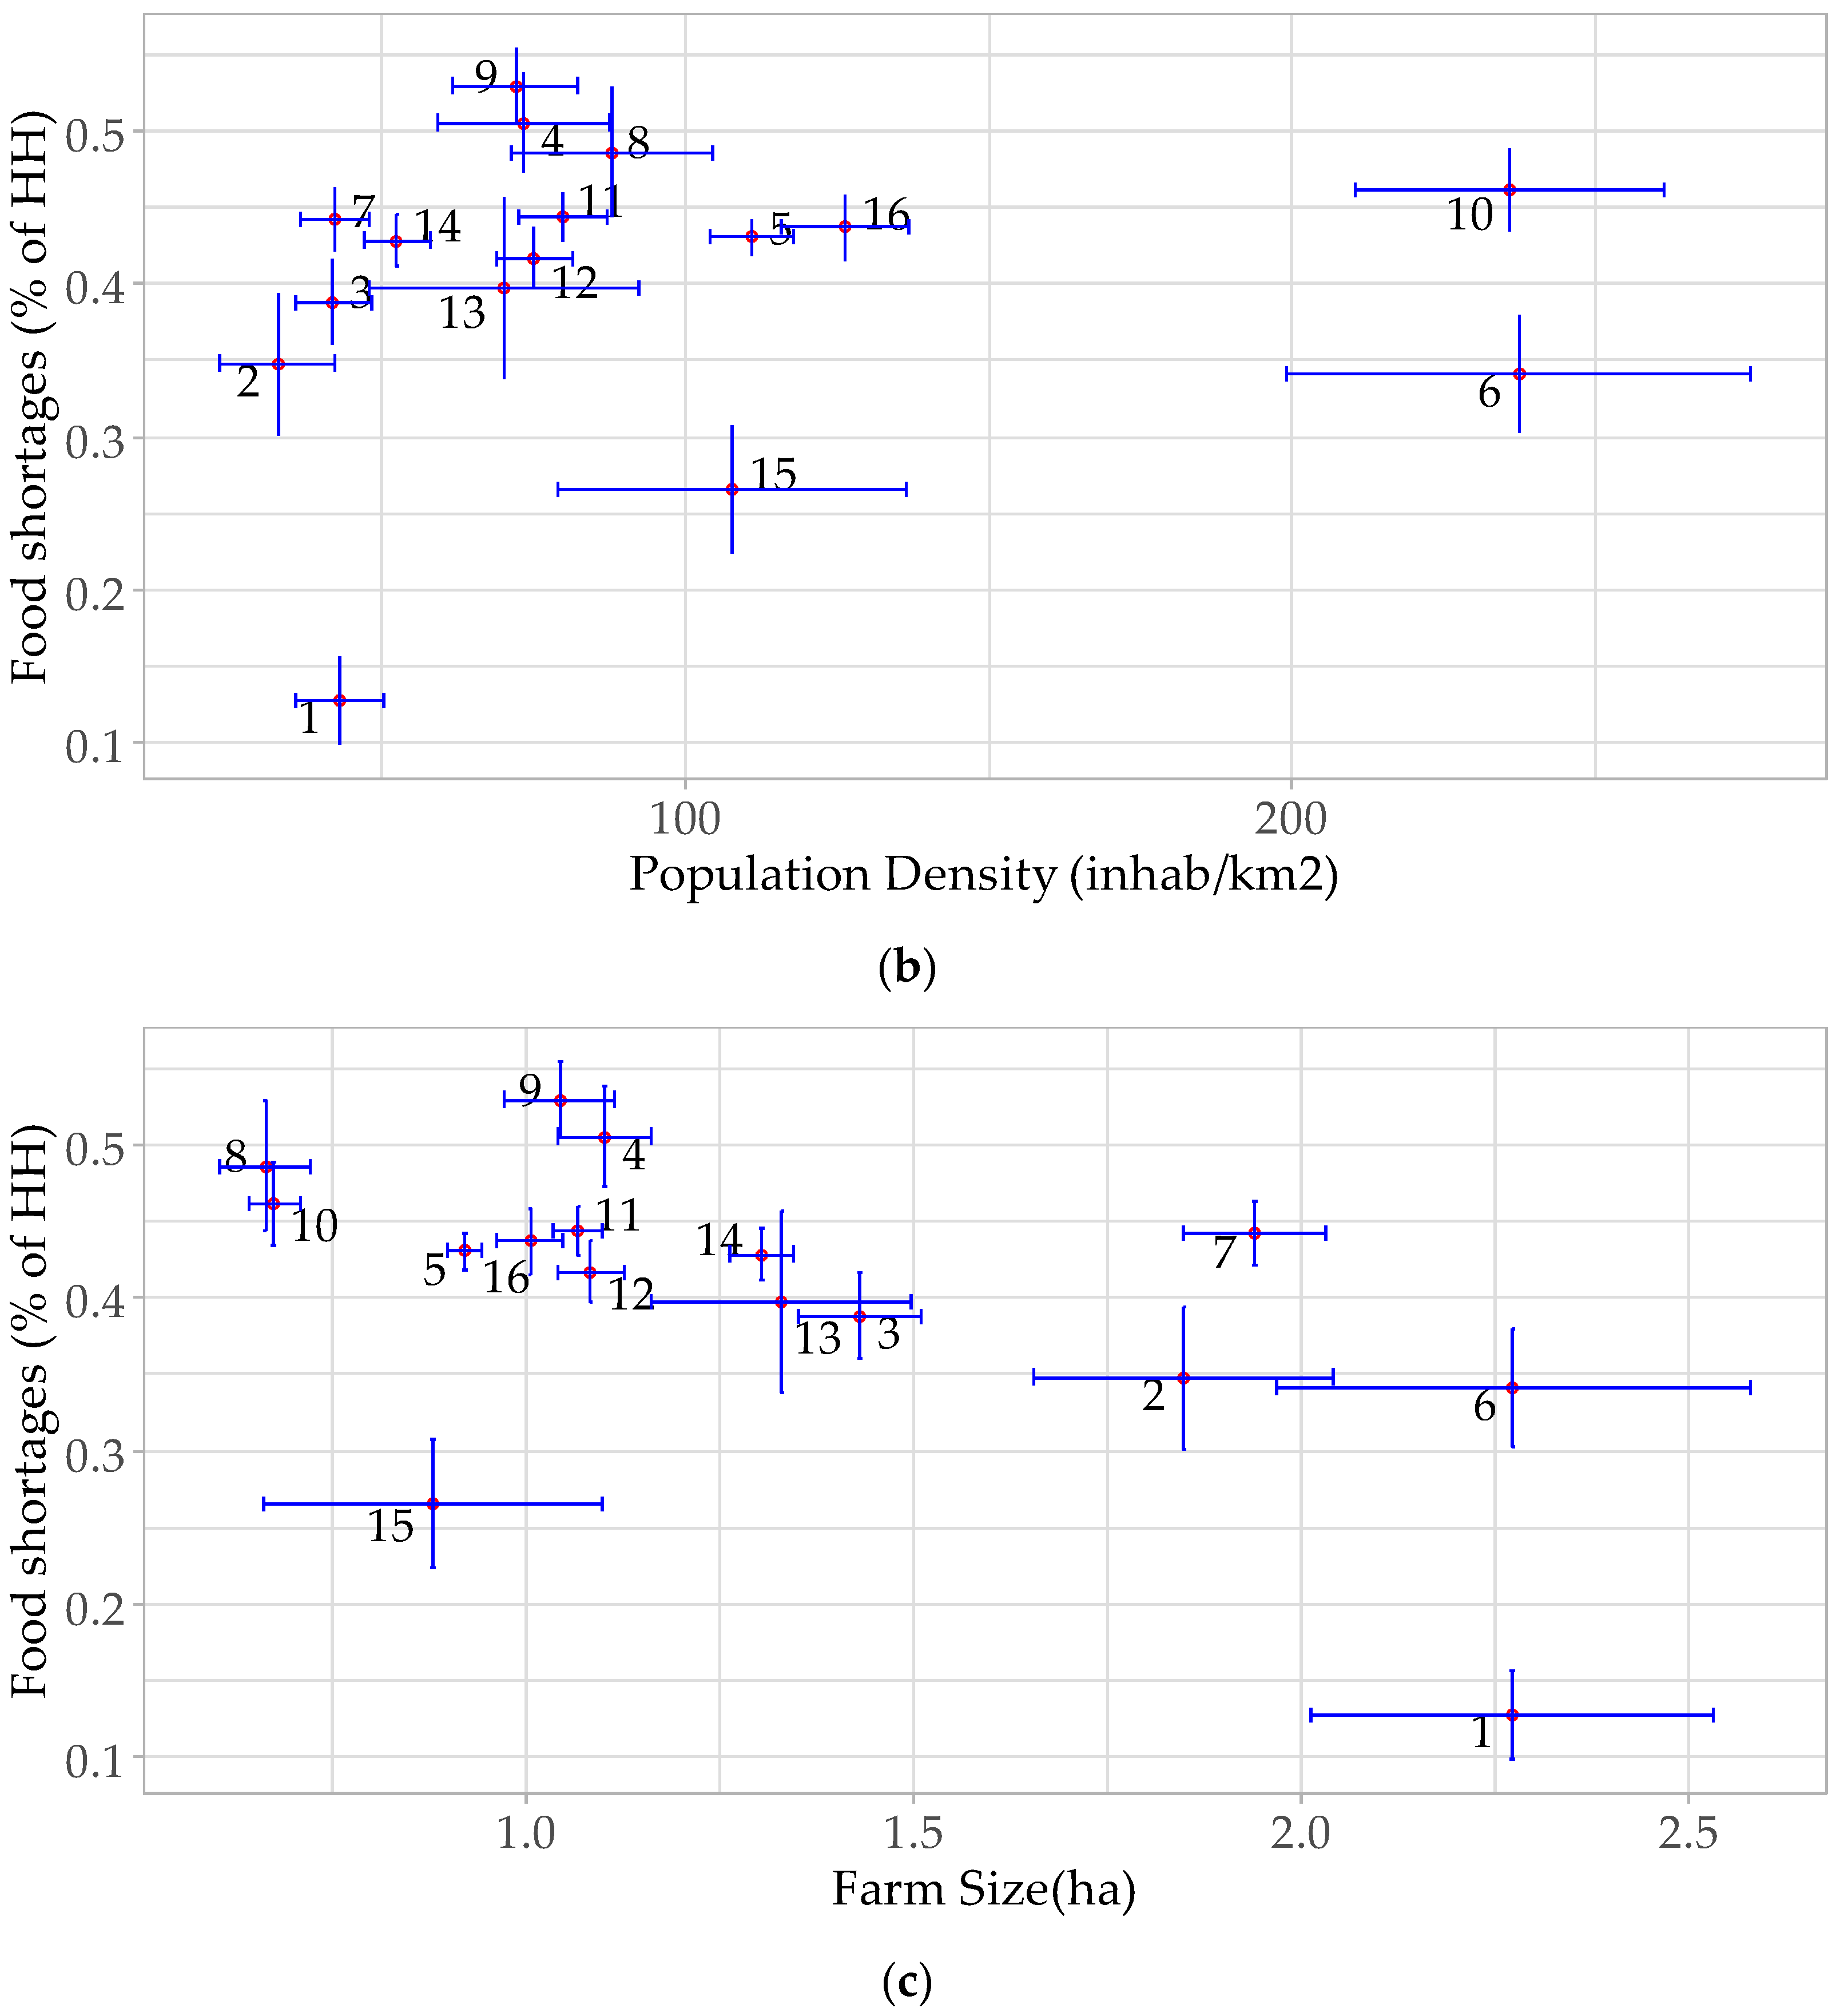
3.1.1. The Drivers of Food Insecurity
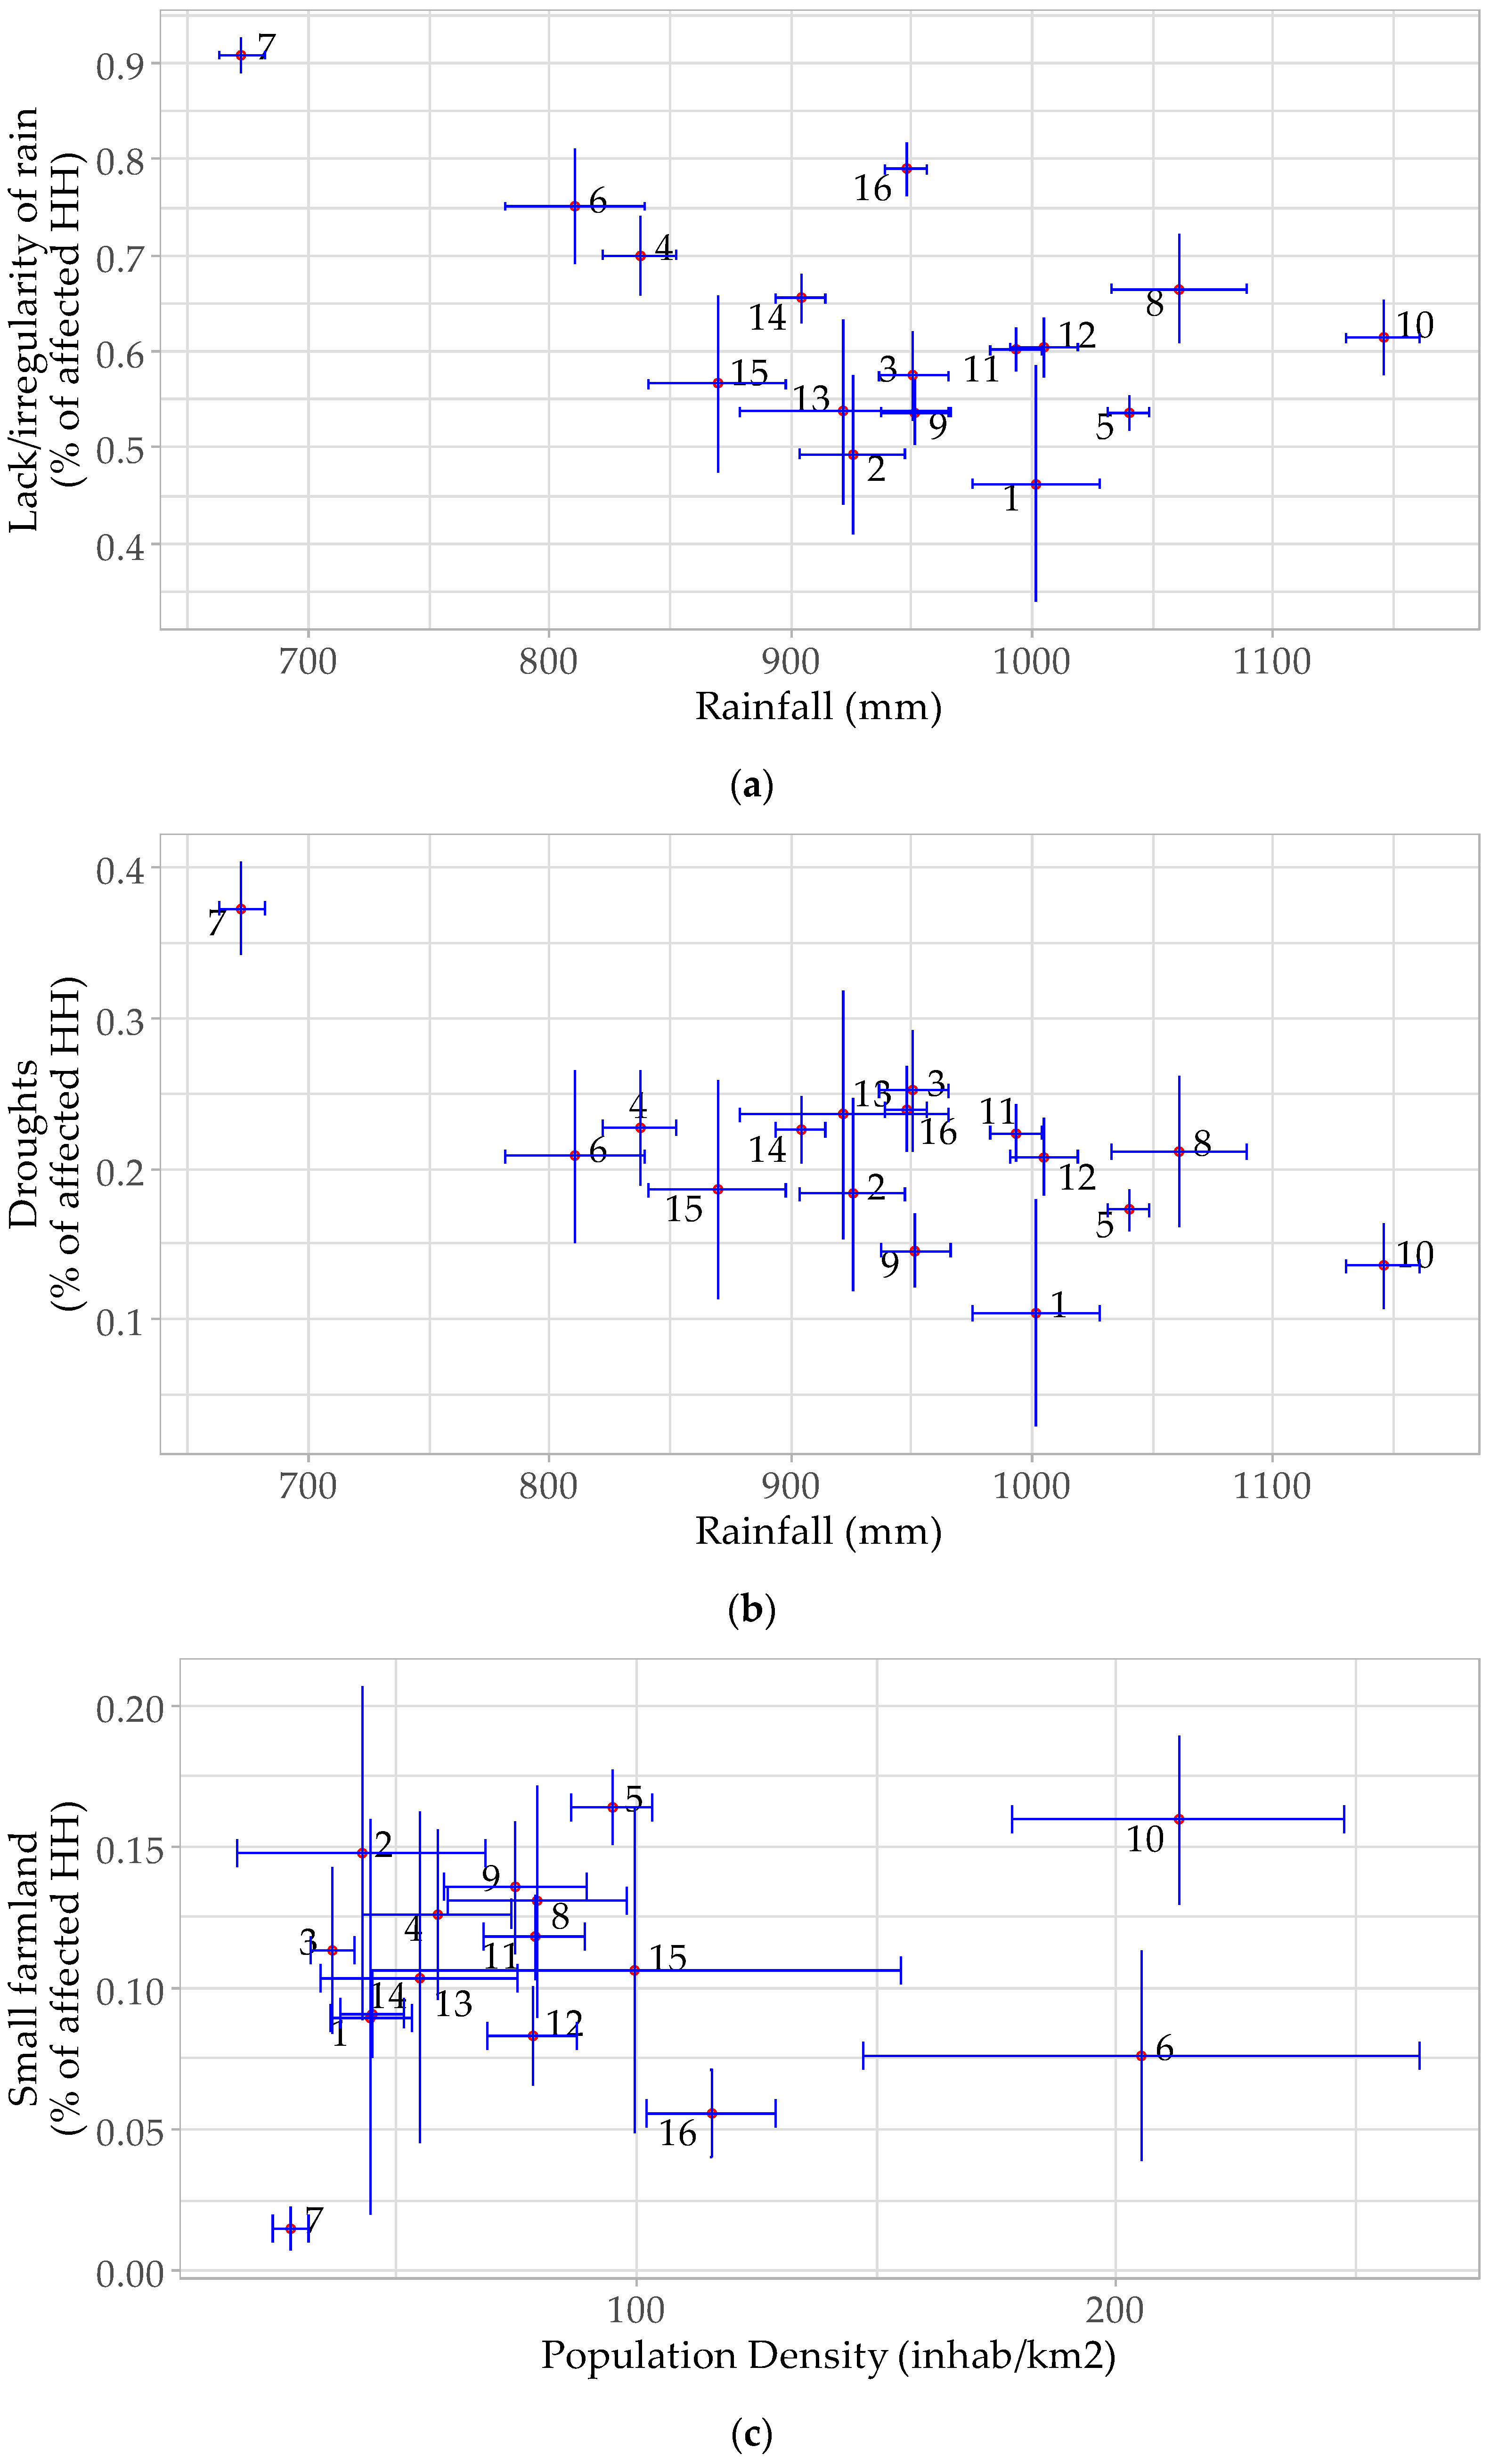
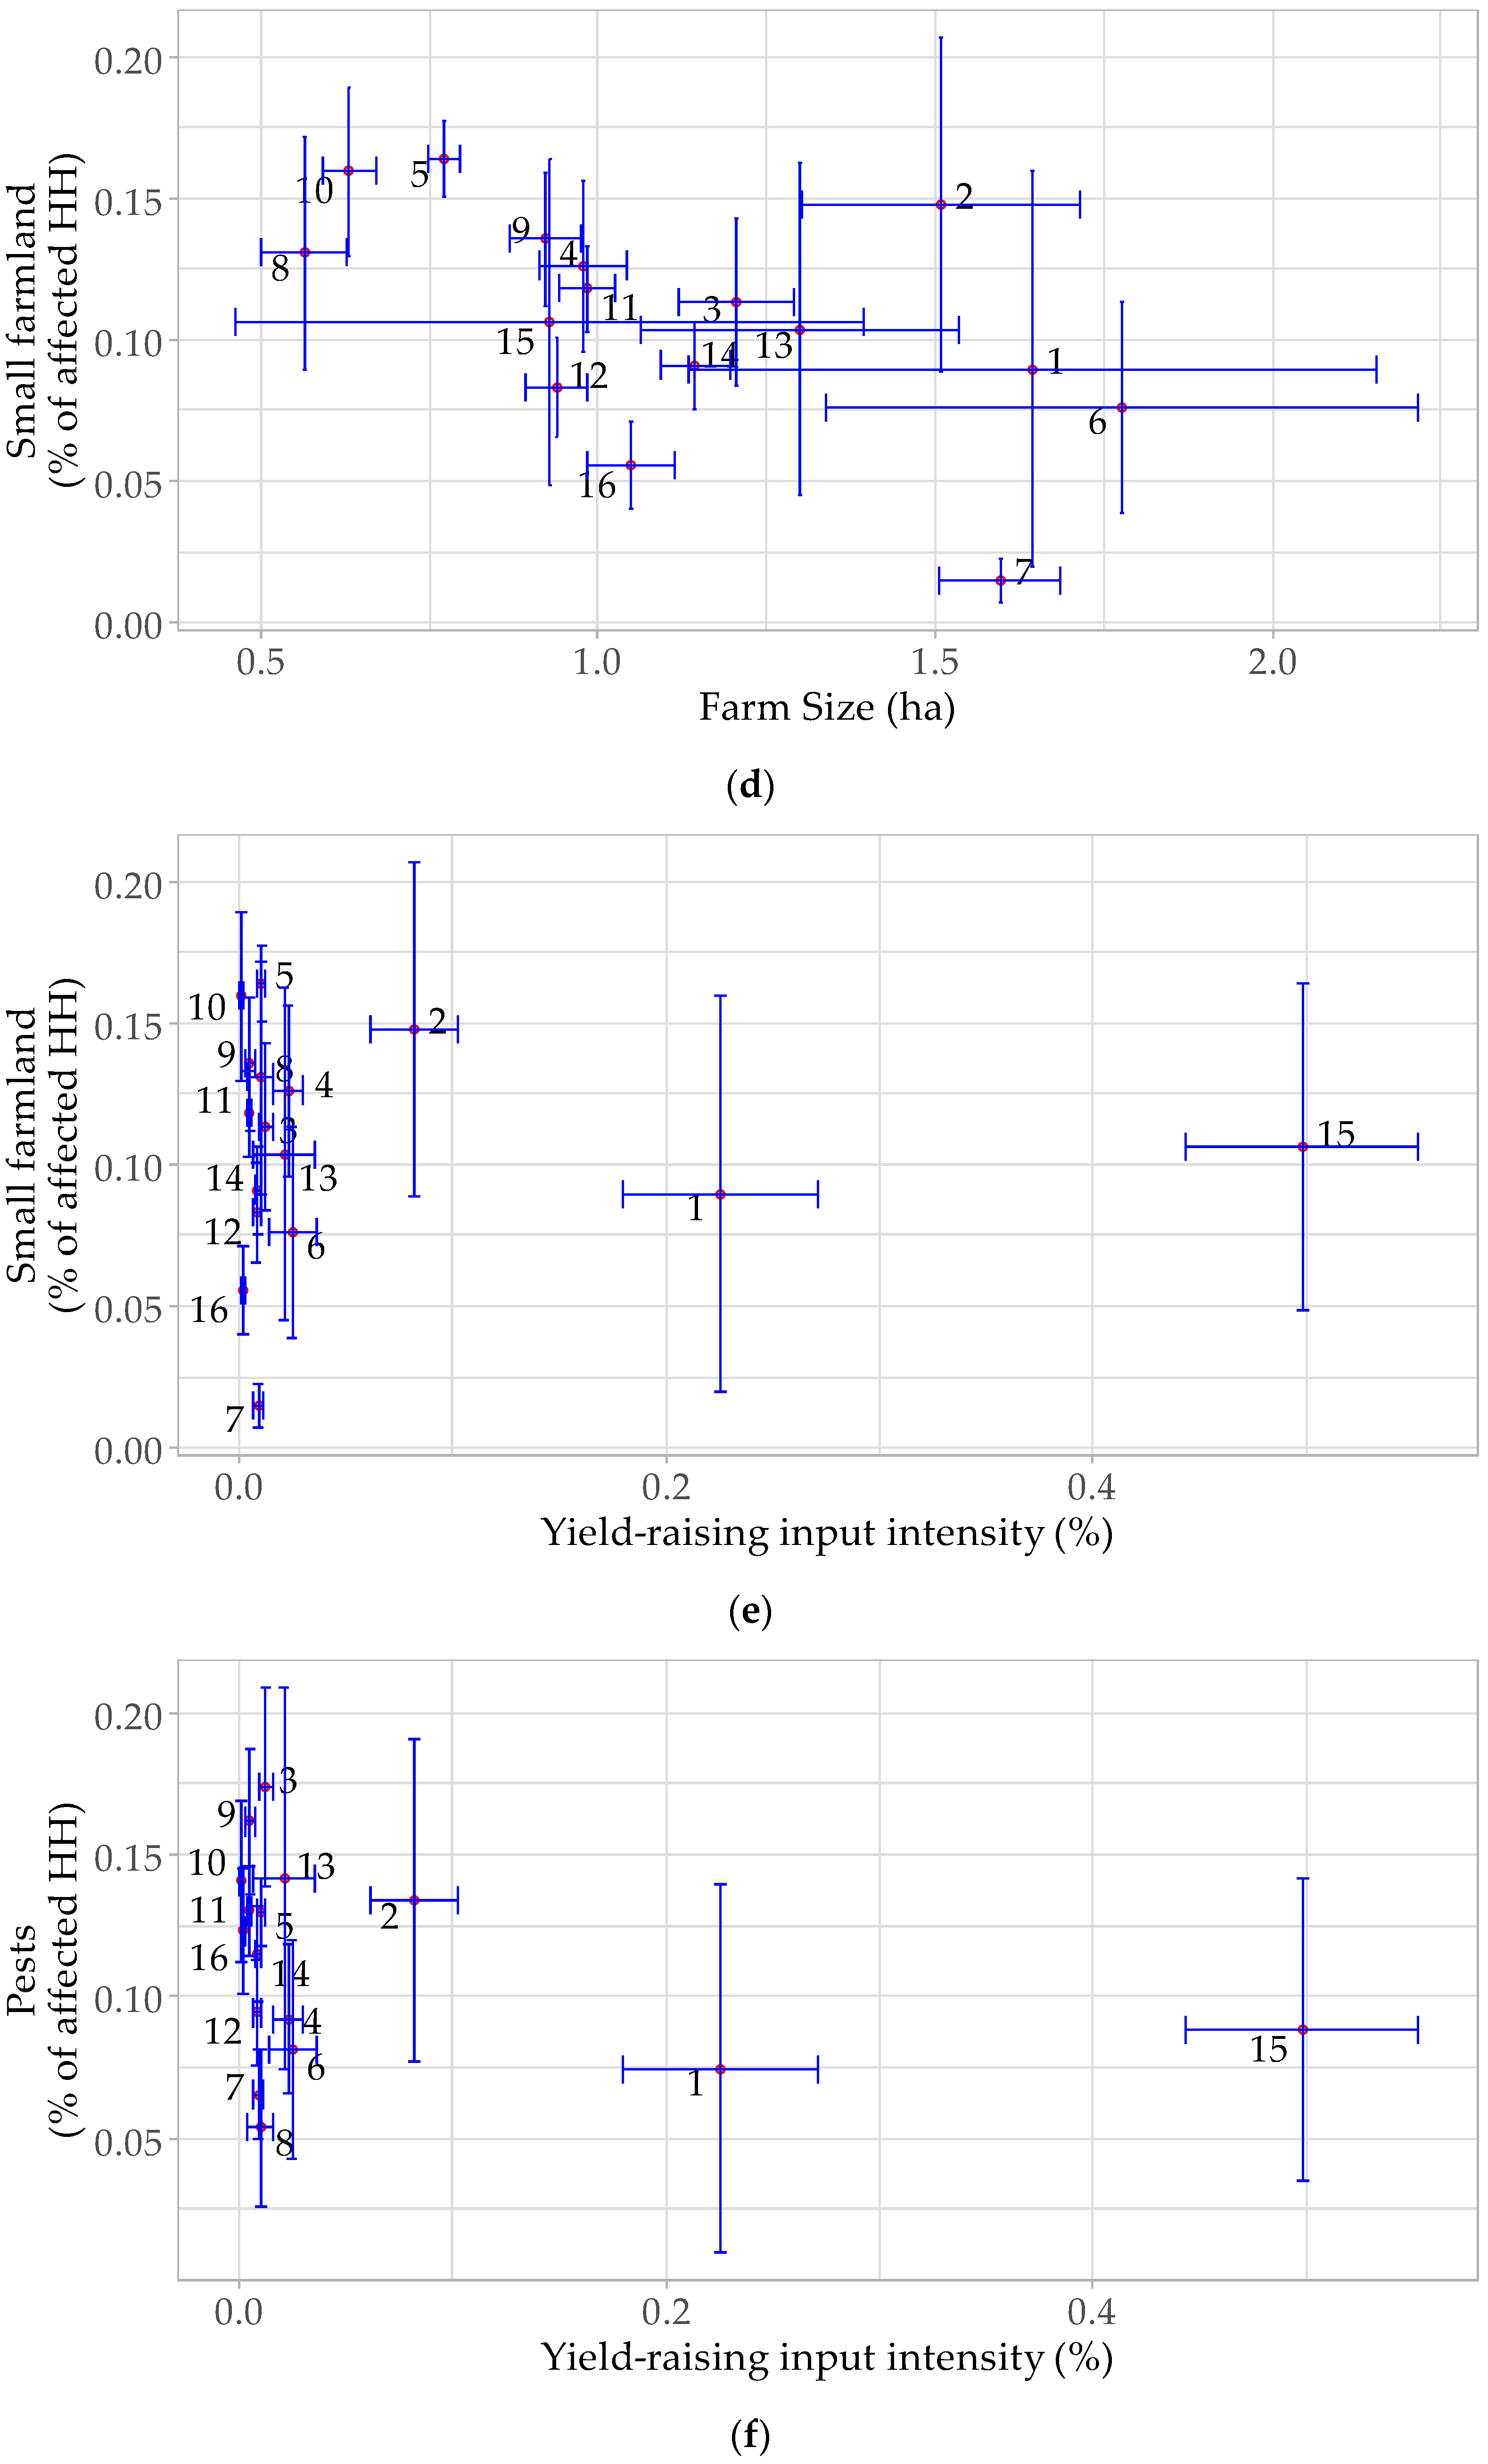
3.1.2. Perceived Causes of Food Shortages and the Drivers of Food Insecurity
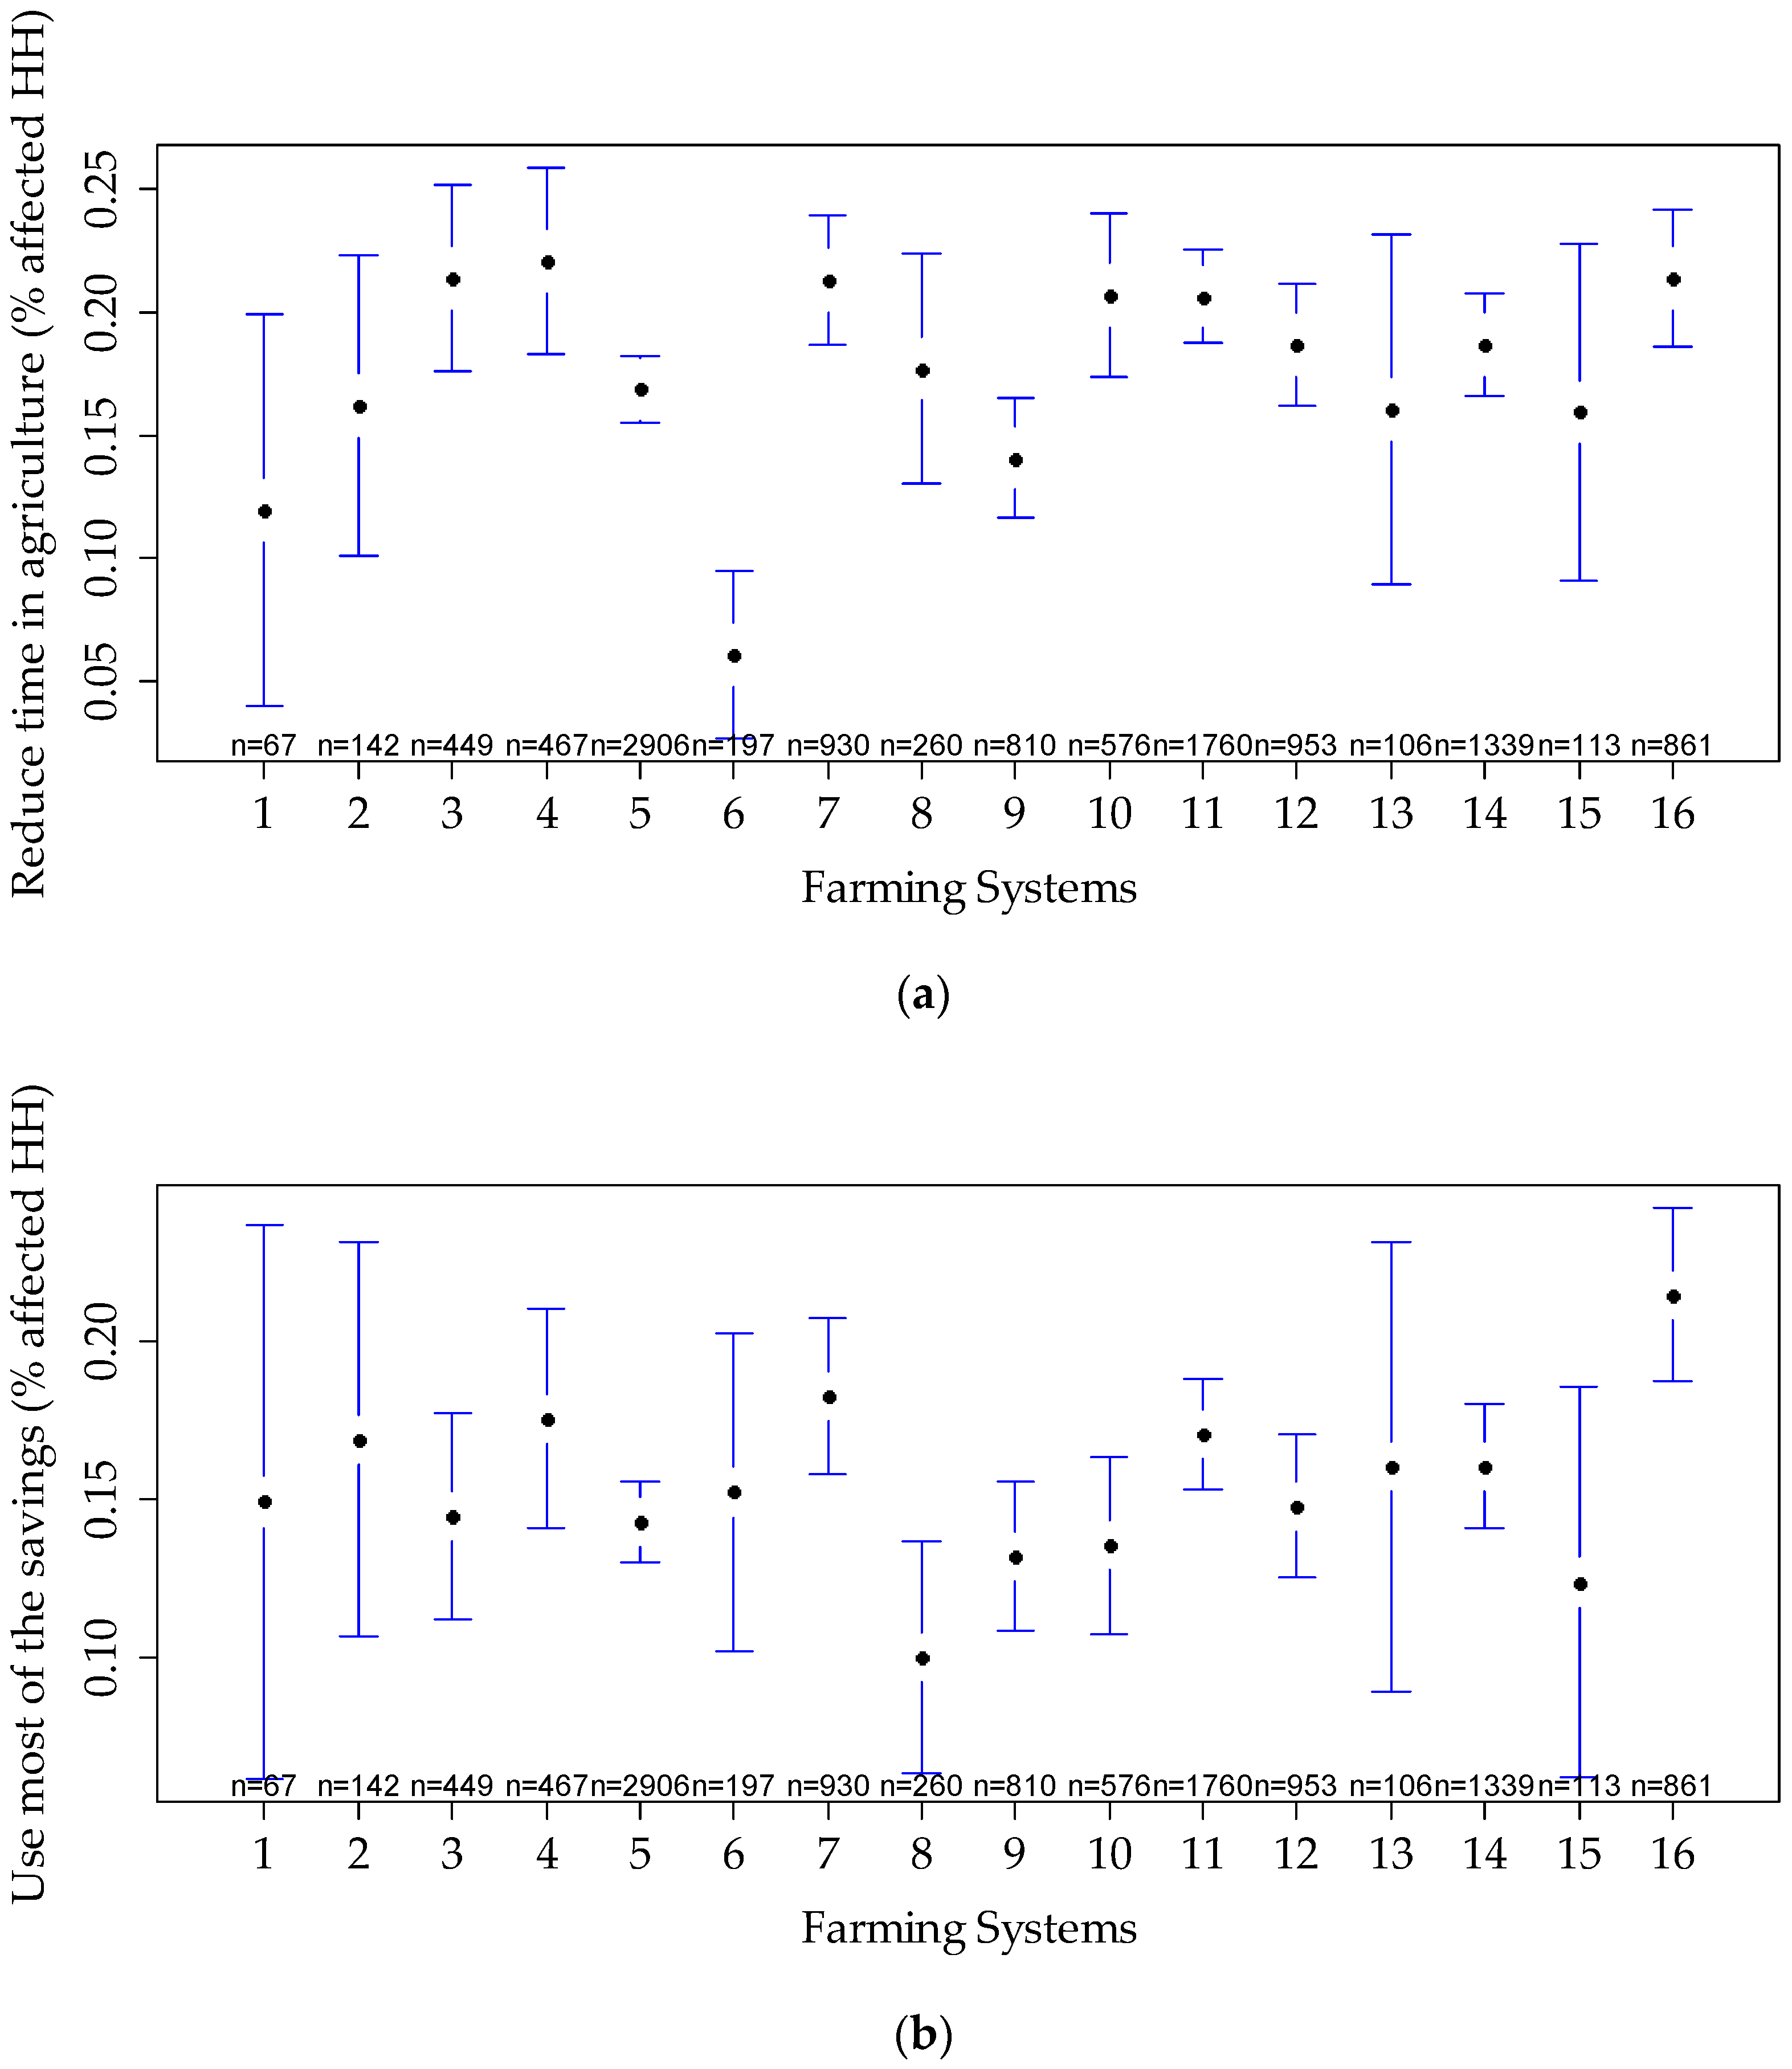
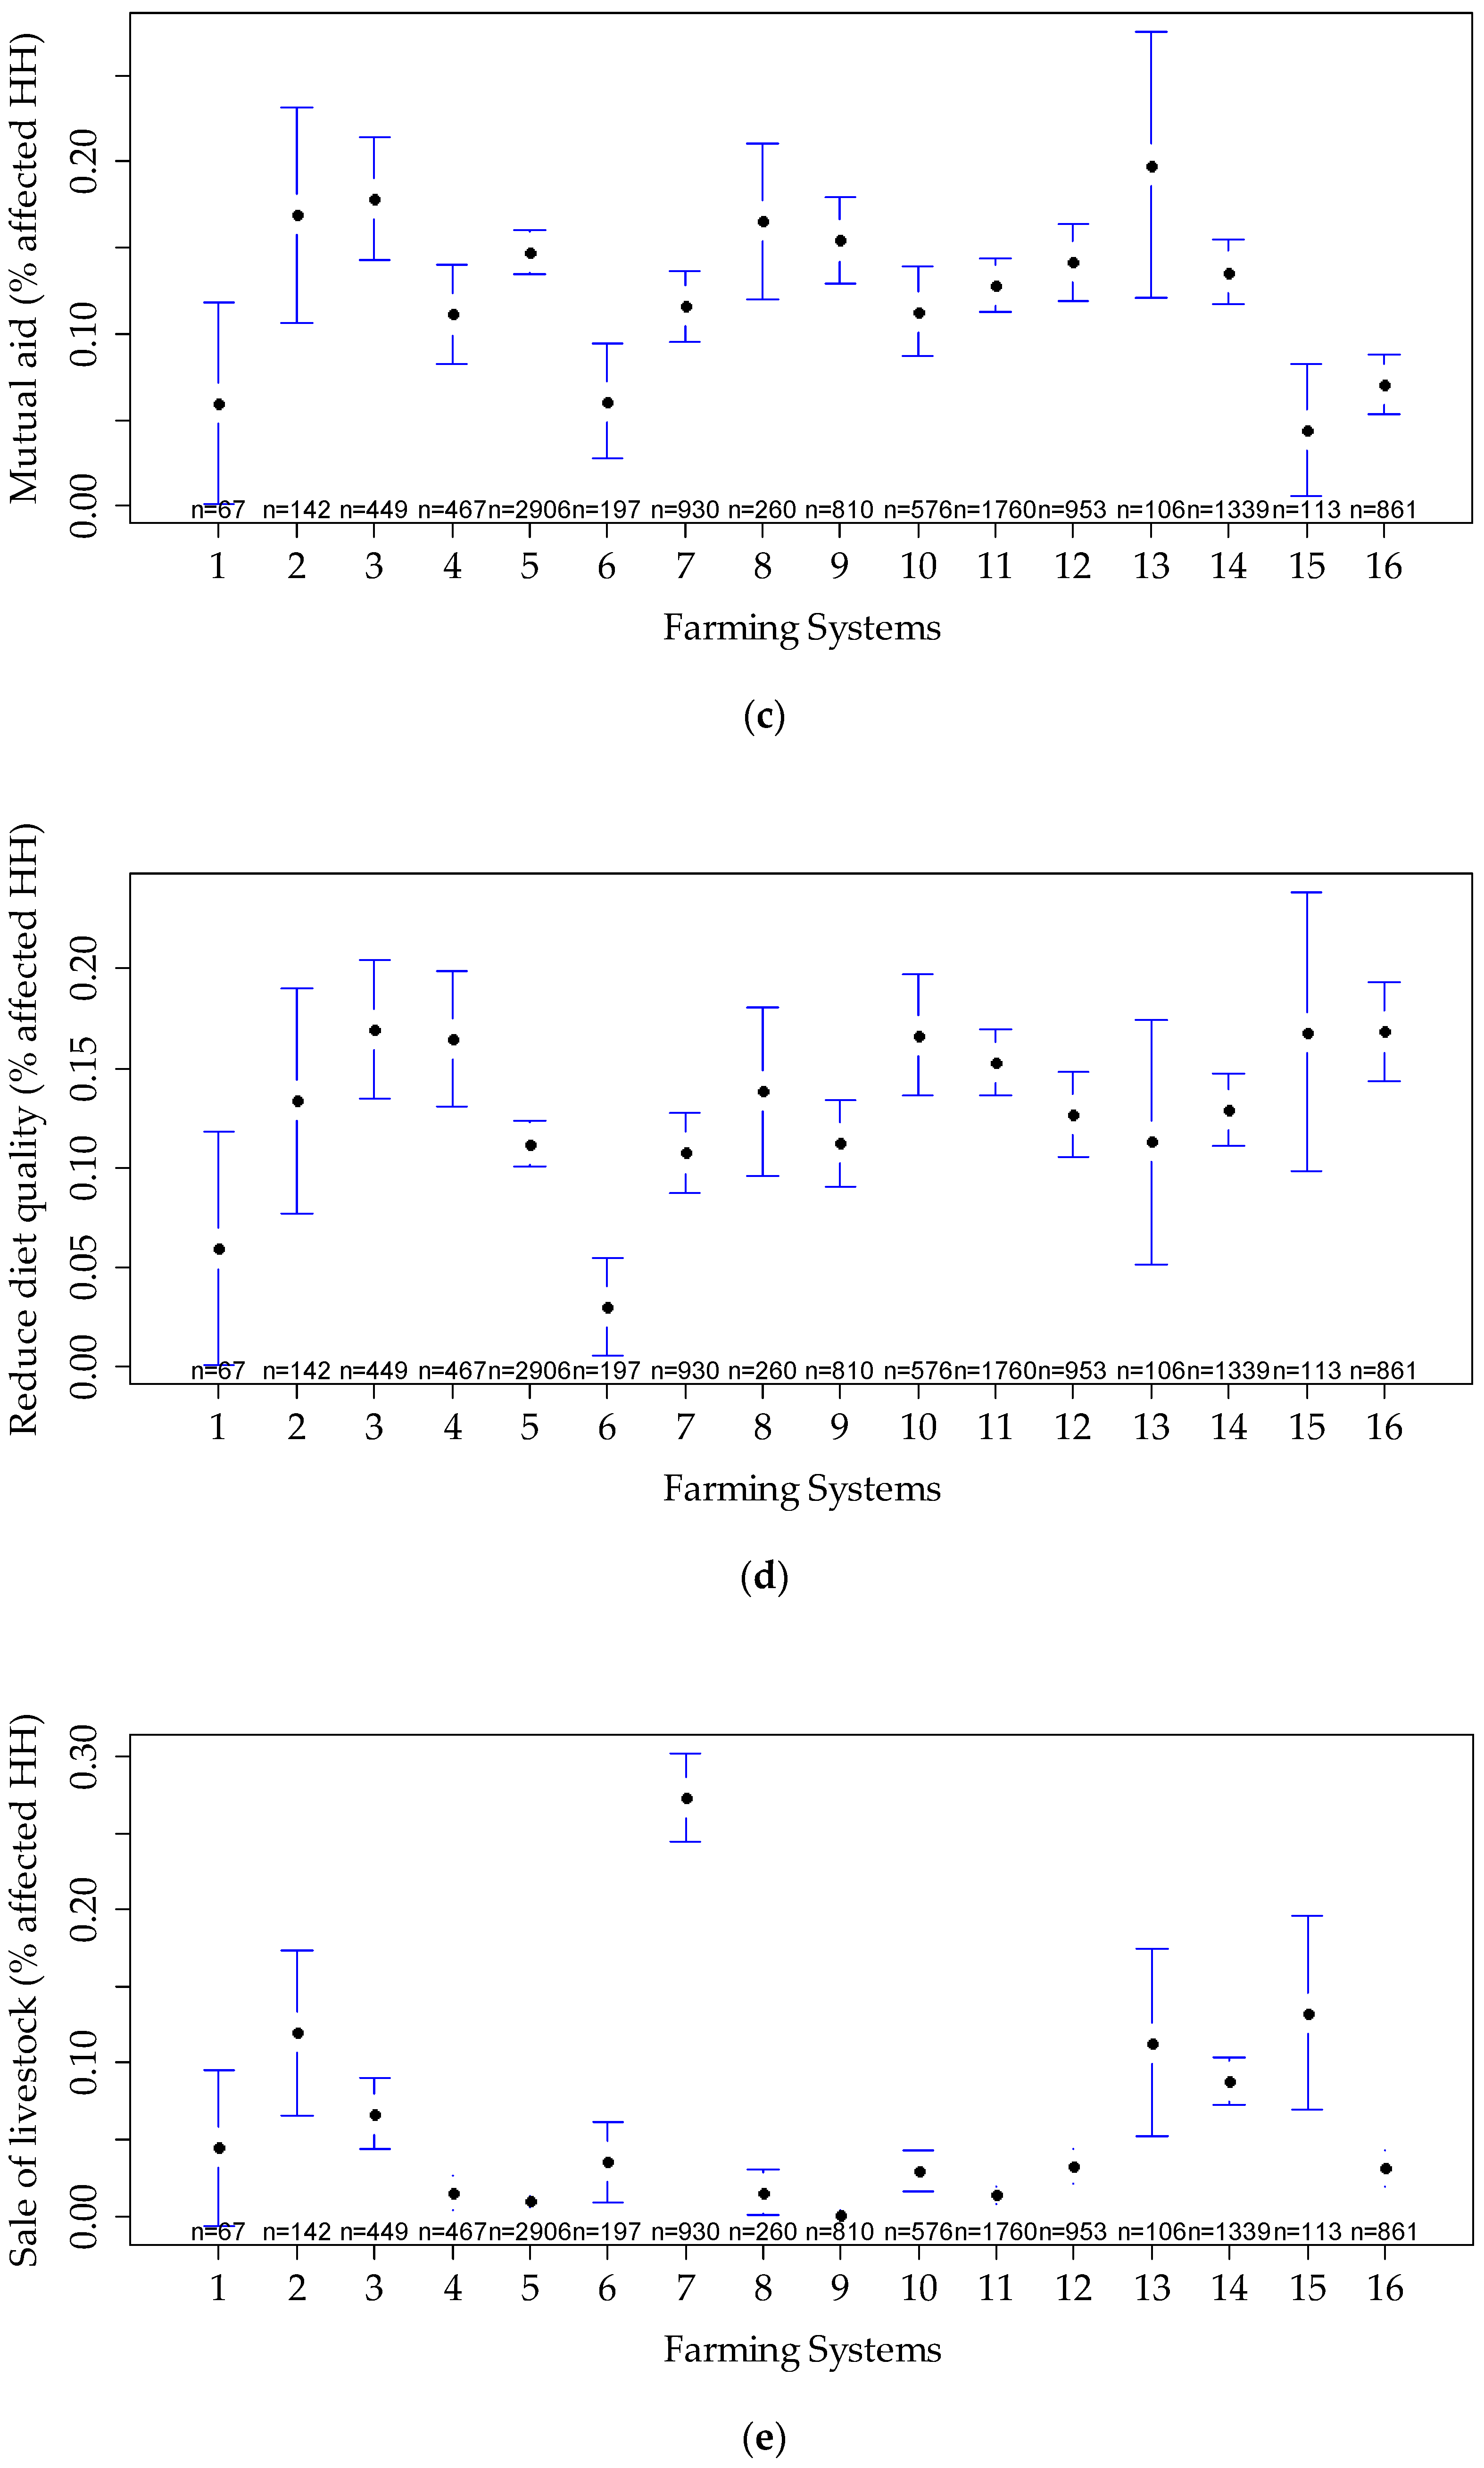
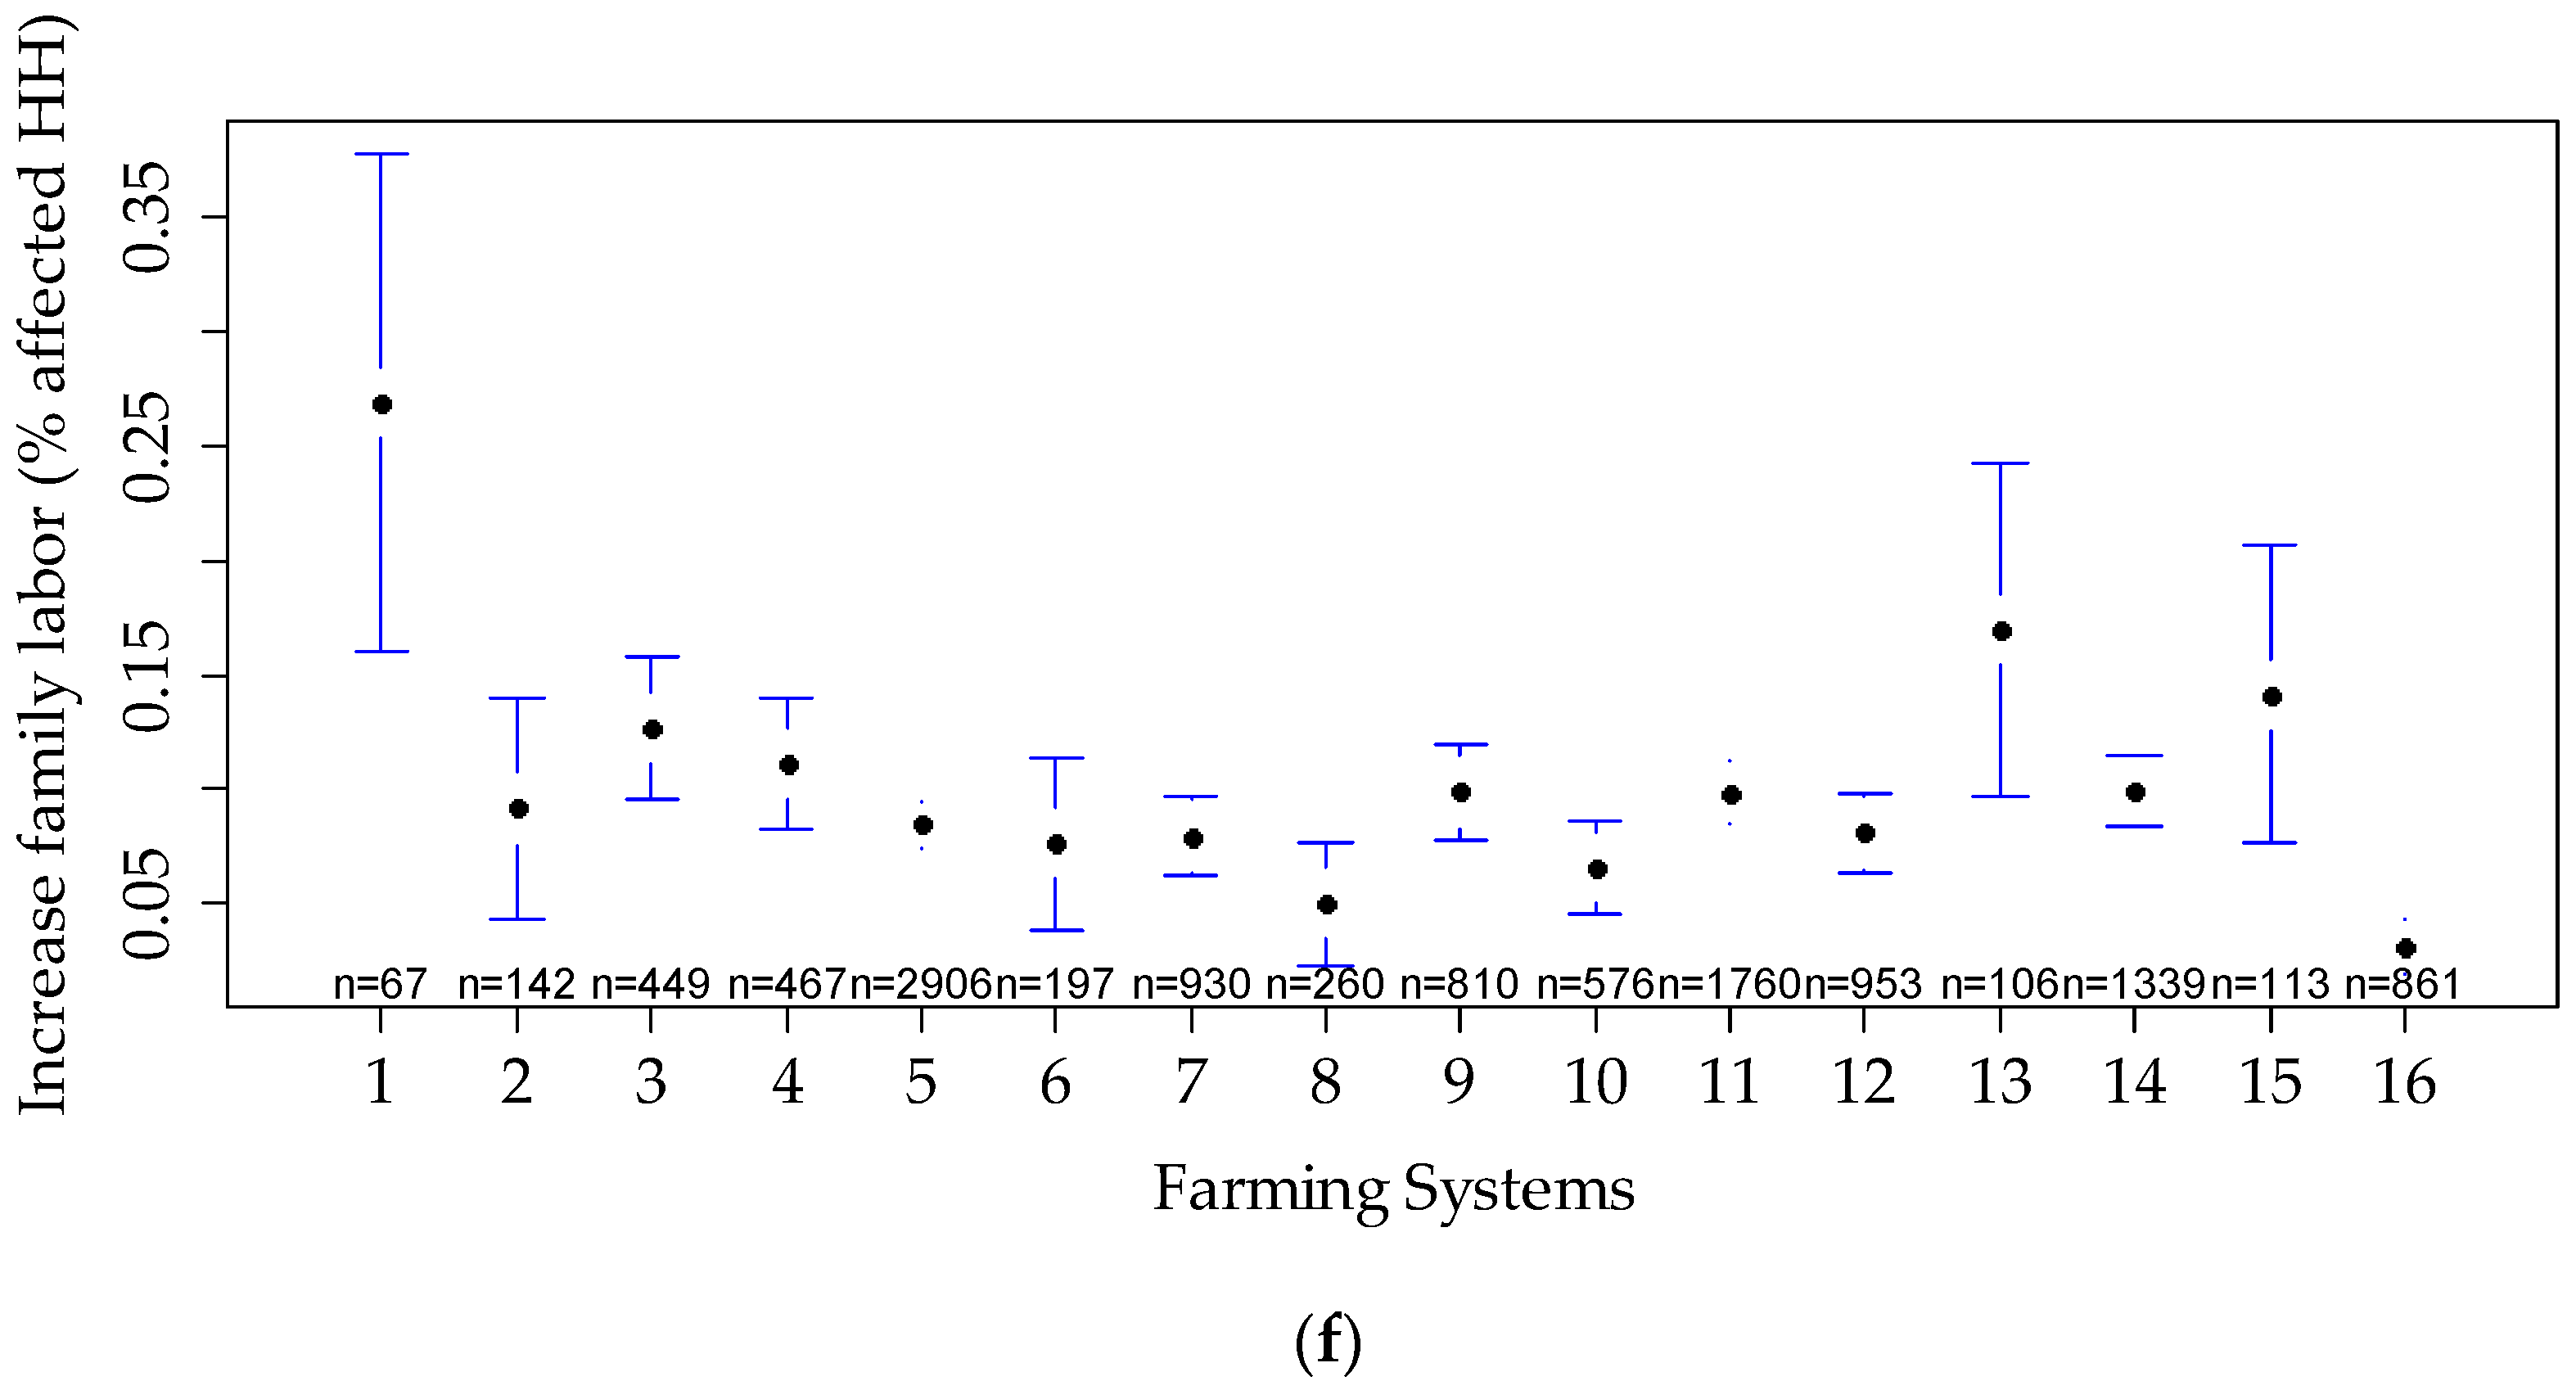
3.1.3. Coping Strategies Adopted by Farmers to Face Food Shortages
4. Discussion
4.1. A Farming System Approach to Explore the Drivers of Food Insecurity
4.2. Exploring Coping Strategies Adopted by Farm Households Across Farming Systems
4.3. Contributing to Policy Design in Targeting Food Insecure Farm Households in Developing Countries
5. Conclusions
Author Contributions
Funding
Data Availability Statement
Acknowledgments
Conflicts of Interest
Appendix A
| Variables | Description (Crops/Livestock) | |
|---|---|---|
| Land use/cover | Annual Crops (proportion of total arable area) | Maize |
| Rice | ||
| Sorghum+ (includes Millet) | ||
| Cassava | ||
| Sweet Potato | ||
| Cowpea | ||
| Beans | ||
| Groundnut | ||
| Sesame | ||
| Cotton | ||
| Tobacco | ||
| Hort1 (Pumpkin, Watermelon and Okra) | ||
| Hort2 (Tomato, Kale, Onion, Potato, Lettuce, and Cabbage) | ||
| Hort3 (Cucumber, Yam, Green beans, Garlic, Carrot, Pepper, and Eggplant) | ||
| Other annual crops (e.g., peas, sunflower, soy, sugarcane, wheat, ginger) | ||
| Permanent Crops (PERM) (proportion of total fruit tree stems) | Mango | |
| Cashew | ||
| Coconut | ||
| Citrus (Orange, Lemon, Tangerine, and Grapefruit) | ||
| Other Fruits (Papaya, Maçanica, Mafurra, Guava, Avocado, Jambalão, Peach, Litchi, and Apple) | ||
| Proportion of equivalent arable area with permanent crops | ||
| Livestock Variables | Livestock (proportion in total standard livestock units) | Bovine |
| Goats | ||
| Swine | ||
| Small Livestock (Chickens, Ducks, Bush chicken, Turkeys, Rabbits, and Geese) | ||
| Sheep | ||
| Livestock density (number of standard livestock units per hectare of arable area) | ||
| Output Diversification | Gross Product (proportion of total output, i.e., Total Gross Product—TGP (a)) | Annual Basic Food Crops (STAPLES) |
| Horticultural Crops (HORT) | ||
| Cash Crops (CASH) | ||
| Cashew | ||
| Coconut | ||
| Livestock | ||
| Economic Intensity [output (MZN) per hectare of arable area] | ||
| Yield-raising input intensity (proportion of arable area) | Irrigation | |
| Pesticide | ||
| Fertilizer | ||
| Manure | ||
| Labor and labor-saving inputs | Labor productivity—output (MZN) per labor unit (b) | |
| Labor intensity—labor units per hectare of arable area | ||
| Bovine traction use: 1—yes; 0—otherwise | ||
| Tractors use indicator: 1—yes; 0—otherwise | ||
| ZONES | FS1 | FS2 | FS3 | FS4 | FS5 | FS6 | FS7 | FS8 | FS9 | FS10 | FS11 | FS12 | FS13 | FS14 | FS15 | FS16 |
|---|---|---|---|---|---|---|---|---|---|---|---|---|---|---|---|---|
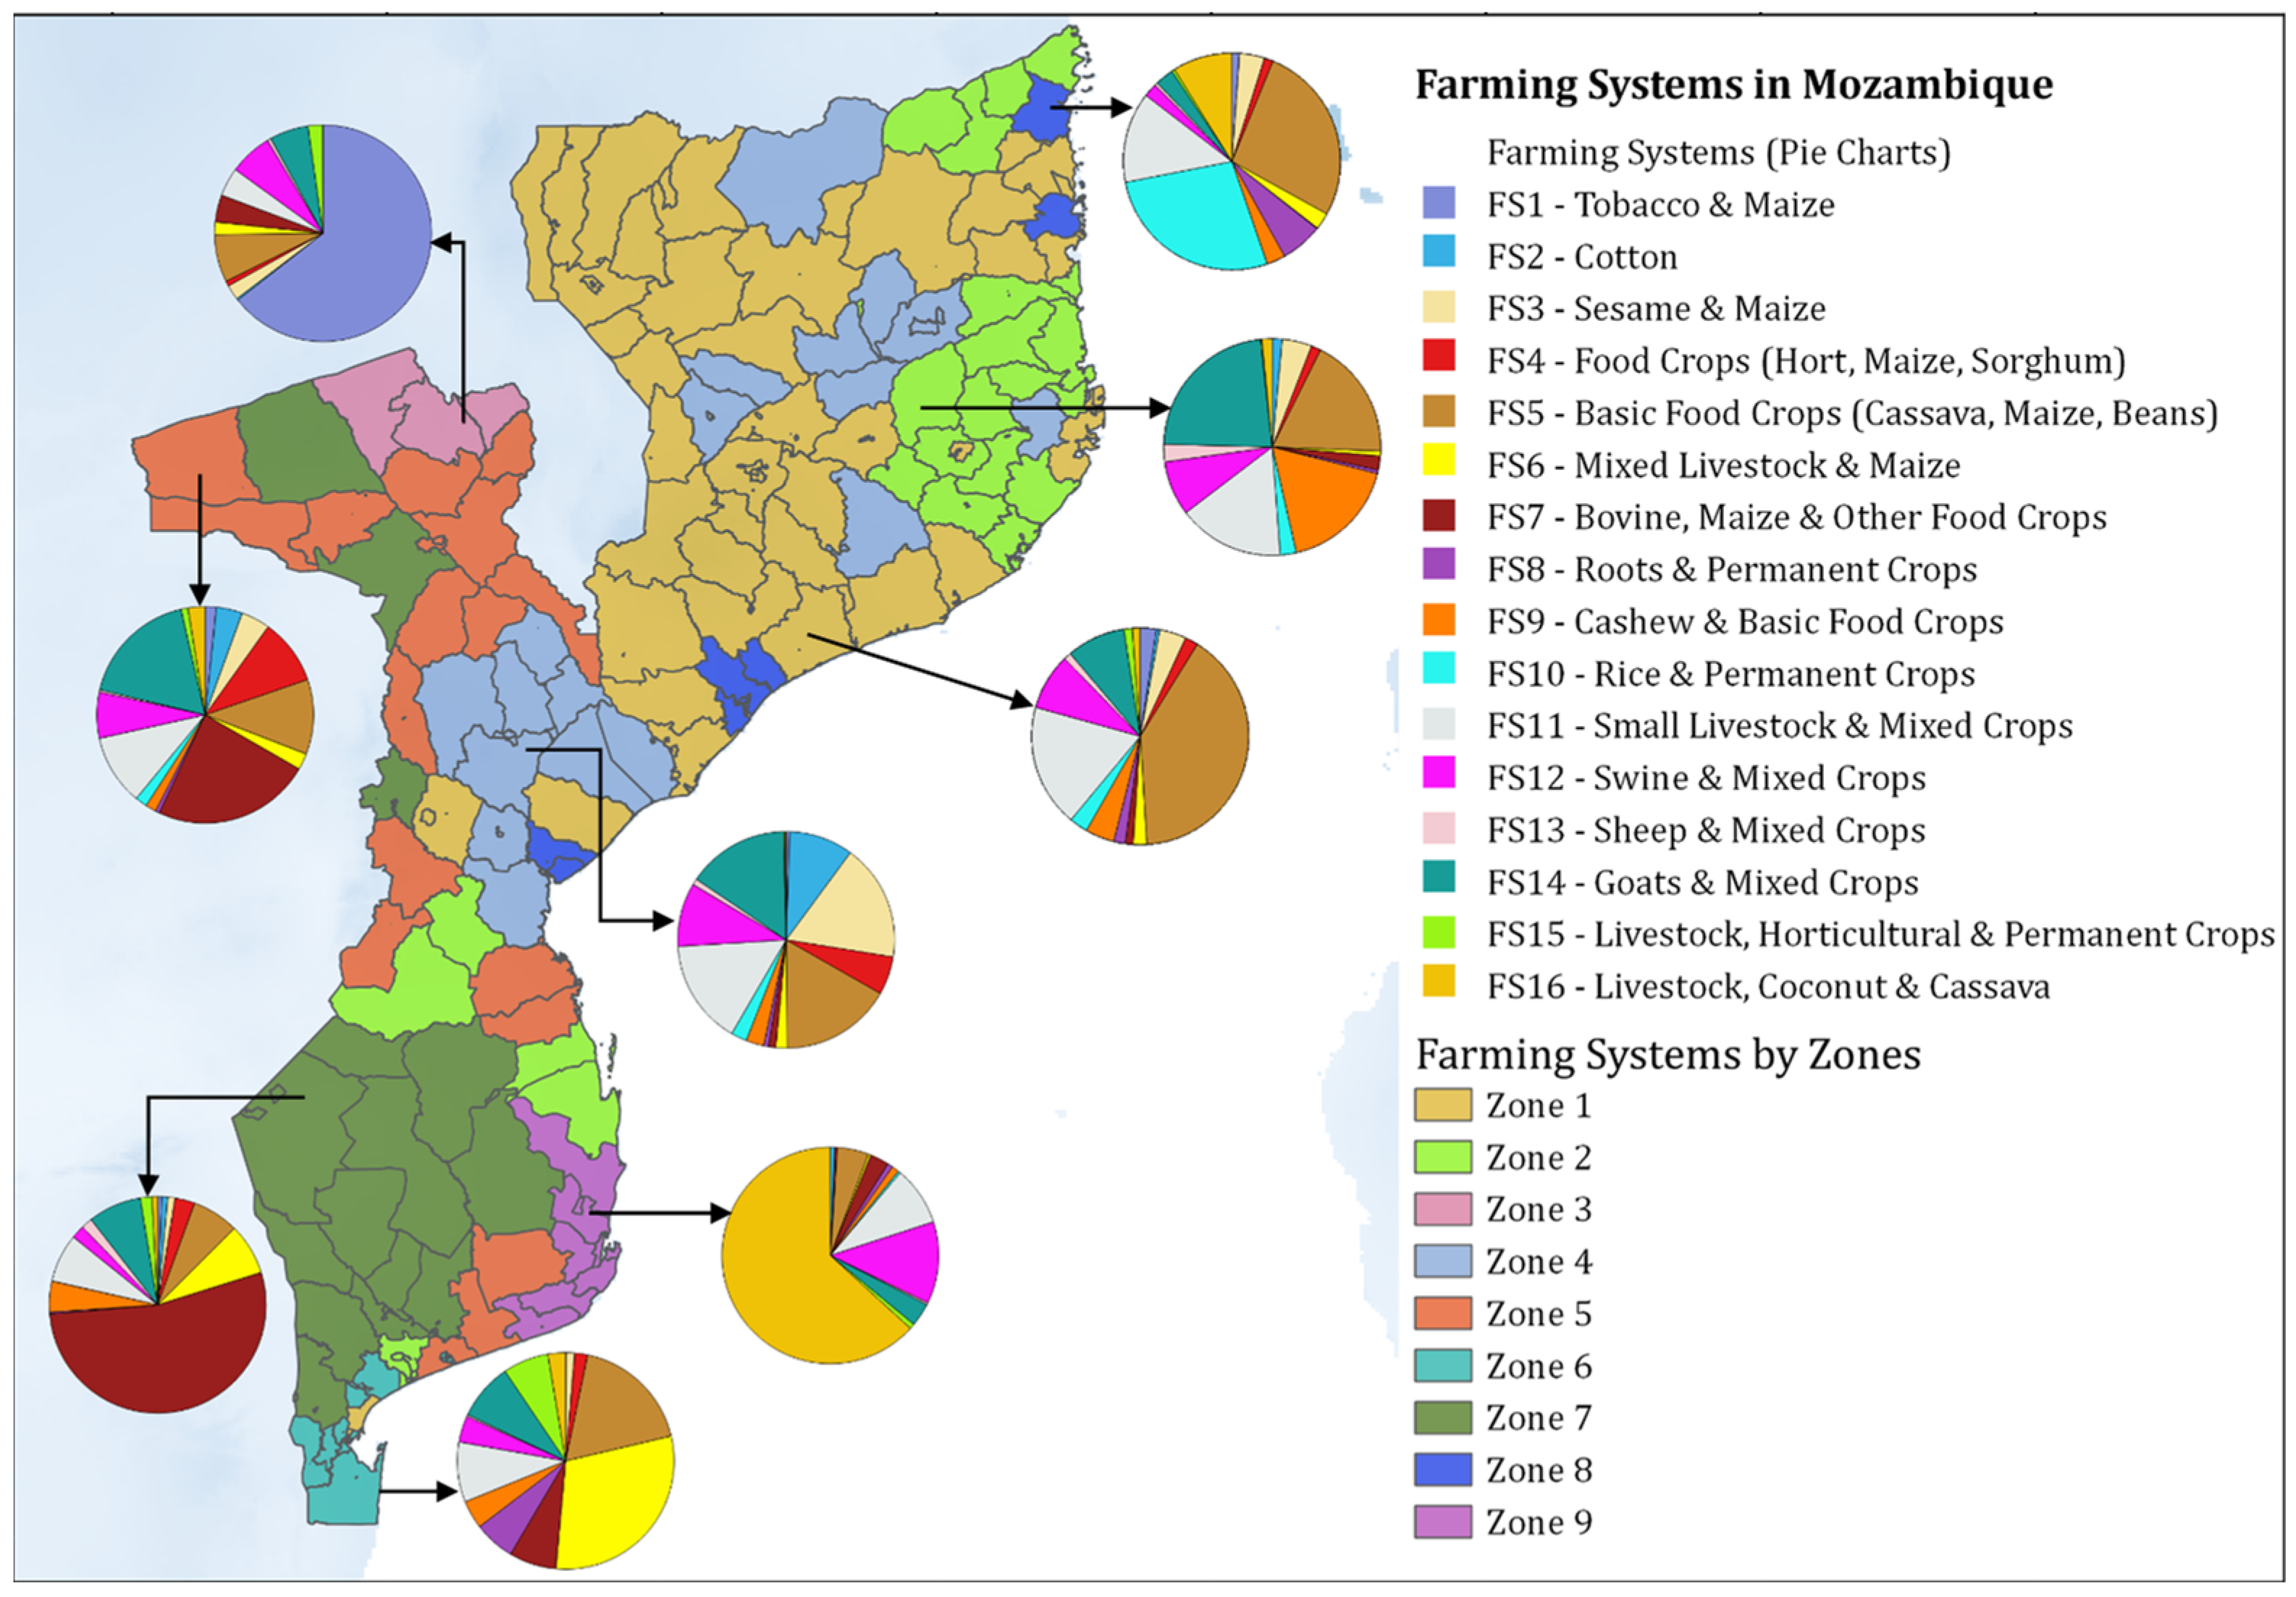
| 1 | 0.024 | 0.005 | 0.040 | 0.020 | 0.402 | 0.020 | 0.012 | 0.017 | 0.043 | 0.028 | 0.183 | 0.084 | 0.011 | 0.088 | 0.012 | 0.011 |
| 2 | 0.000 | 0.015 | 0.044 | 0.014 | 0.183 | 0.007 | 0.021 | 0.005 | 0.175 | 0.024 | 0.158 | 0.082 | 0.026 | 0.229 | 0.002 | 0.015 |
| 3 | 0.644 | 0.003 | 0.023 | 0.008 | 0.071 | 0.019 | 0.040 | 0.000 | 0.000 | 0.000 | 0.043 | 0.064 | 0.005 | 0.058 | 0.022 | 0.000 |
| 4 | 0.005 | 0.096 | 0.174 | 0.057 | 0.166 | 0.017 | 0.011 | 0.007 | 0.027 | 0.024 | 0.157 | 0.095 | 0.009 | 0.152 | 0.002 | 0.002 |
| 5 | 0.017 | 0.039 | 0.043 | 0.099 | 0.112 | 0.024 | 0.237 | 0.006 | 0.016 | 0.018 | 0.105 | 0.069 | 0.004 | 0.177 | 0.010 | 0.025 |
| 6 | 0.000 | 0.001 | 0.013 | 0.019 | 0.181 | 0.301 | 0.071 | 0.061 | 0.042 | 0.000 | 0.090 | 0.039 | 0.003 | 0.085 | 0.068 | 0.026 |
| 7 | 0.006 | 0.009 | 0.011 | 0.030 | 0.070 | 0.076 | 0.535 | 0.003 | 0.046 | 0.000 | 0.072 | 0.020 | 0.017 | 0.080 | 0.017 | 0.008 |
| 8 | 0.011 | 0.000 | 0.037 | 0.013 | 0.269 | 0.025 | 0.001 | 0.063 | 0.028 | 0.272 | 0.135 | 0.020 | 0.005 | 0.028 | 0.004 | 0.089 |
| 9 | 0.000 | 0.007 | 0.001 | 0.003 | 0.047 | 0.004 | 0.028 | 0.008 | 0.011 | 0.003 | 0.088 | 0.122 | 0.003 | 0.035 | 0.008 | 0.632 |
| Variable | Description | Formula | Var. Code | Name of the Variable to Extract | Source of Data |
|---|---|---|---|---|---|
| Specialization | MAX (WGPg) | WGPg | Weight of crop group or livestock type g in Total Gross Product | 2009–2010 Agricultural Census | |
| Market Integration | Proportion of sales in total output (%) | (TSale/TGP)*100 | TSale | Total farm sales (MZN): TSale = CropSale + LivSale | |
| CropSale—total farm crop sales | |||||
| LivSale—total livestock sales | |||||
| TGP | Total Gross Product (MZN): TGP = GPC + GPLiv | ||||
| GPC—Total Crop GP | |||||
| GPLiv—Total Livestock GP | |||||
| Yield-raising input intensity | AVERAGE (WYInputi) | WYInputi | Proportion of arable area using yield-raising input i (i = pesticides, fertilizers, manure, and irrigation) | ||
| Labor-saving input intensity | AVERAGE (LBSavInputj) | LBSavInputj | Use of labor-saving inputs j (j = animal traction, plows, tractors, etc.) | ||
| Rainfall | Average annual rainfall (mm) | Ʃ pr (i) | pr (i) | Rainfall of month i (i = 1, …, 12) (mm) | WorldClim (average period 1970–2000) |
| Farm size | Farm size (ha) | FArea | FArea | Farm area (all parcels) (ha) | 2009–2010 Agricultural Census |
| Population Density | Population density (inhabitants/km2) | POP/APA | POP | Population by administrative post (inhabitants) | National Statistical Institute |
| APA | Administrative post area (km2) |
| Variable | Description | Mean | SD |
|---|---|---|---|
| Food Shortage | The farm household experienced food shortages (1—yes, 0—no) | 0.43 | 0.49 |
| Drivers | |||
| Specialization | Maximum contribution of a specific crop or livestock group for the total output (%) | 0.79 | 0.22 |
| Market Integration | Proportion of sales in total output (%) | 0.09 | 0.19 |
| Yield-raising inputs | Proportion of the farmland that uses yield-raising inputs (%) | 0.02 | 0.09 |
| Labor-saving inputs | Proportion of labor-saving inputs used, considering the set of available labor-saving inputs (%) | 0.07 | 0.14 |
| Population density | Population density (inhabitants/km2) | 91 | 246 |
| Rainfall | Average annual rainfall (mm) | 995 | 231 |
| Farm size | Farm size (ha) | 1.2 | 1.4 |
| Perceived causes of food shortages (1–yes, 0–no) | |||
| Cause_LackRain | Lack or irregularity of rain | 0.27 | 0.44 |
| Cause_Droughts | Droughts | 0.09 | 0.29 |
| Cause_Pests | Pests | 0.05 | 0.22 |
| Cause_SmallFarmland | Small farmland | 0.05 | 0.22 |
| Strategies to alleviate food shortages (1–yes, 0–no) | |||
| Strat_ReducedAgricActiv | Reduce the time spent practicing agricultural activities to dedicate it to other activities | 0.08 | 0.27 |
| Strat_Savings | Use most of the household savings | 0.07 | 0.25 |
| Strat_MutualAid | Increase the practice of mutual aid with other families | 0.06 | 0.23 |
| Strat_DietQuality | Significantly reduce the quality of the diet | 0.06 | 0.23 |
| Strat_LivestockSale | Sale of large animals such as cattle, goats and pigs | 0.02 | 0.14 |
| Strat_FamilyLabor | Increase family labor in the farm | 0.04 | 0.19 |

References
- Von Grebmer, K.; Bernstein, J.; Resnick, D.; Wiemers, M.; Reiner, L.; Bachmeier, M.; Hanano, A.; Towey, O.; Chéilleachair, R.N.; Foley, C.; et al. Global Hunger Index: Food Systems Transformation and Local Governance; Welthungerhilfe: Bonn, Germany; Concern Worldwide: Dublin, Ireland, 2022; ISBN 978-1-9161928-9-8. [Google Scholar]
- FAO; IFAD; UNICEF; WFP; WHO. The State of Food Security and Nutrition in the World 2024—Financing to End Hunger, Food Insecurity and Malnutrition in All Its Forms; FAO: Rome, Italy; IFAD: Rome, Italy; UNICEF: New York, NY, USA; WFP: Rome, Italy; WHO: Geneva, Switzerland, 2024. [Google Scholar]
- Dixon, J.; Gulliver, A.; Gibbon, D. Farming Systems and Poverty: Improving Farmers’ Livelihoods in a Changing World; Hall, M., Ed.; FAO: Rome, Italy; World Bank: Washington, DC, USA, 2001. [Google Scholar]
- Ford, J.; Berrang-Ford, L.; Bunce, A.; Mckay, C.; Irwin, M.; Pearce, T. The Status of Climate Change Adaptation in Africa and Asia. Reg. Environ. Chang. 2015, 15, 801–814. [Google Scholar] [CrossRef]
- University of Notre Damme Notre Dame Global Adaptation Initiative: Country Index. Available online: https://gain.nd.edu/our-work/country-index/rankings/ (accessed on 26 January 2024).
- Sen, A. Food, Economics and Entitlements; World Institute for Development Economics Research: Helsinki, Finland, 1986. [Google Scholar]
- Hoeffler, H. The Political Economy of Agricultural Policies in Africa: History, Analytical Concepts and Implications for Development Cooperation. Q. J. Int. Agric. 2011, 50, 29–53. [Google Scholar]
- Abbas, M.; Ribeiro, P.F.; Santos, J.L. Farming System Change under Different Climate Scenarios and Its Impact on Food Security: An Analytical Framework to Inform Adaptation Policy in Developing Countries. Mitig. Adapt. Strateg. Glob Chang. 2023, 28, 43. [Google Scholar] [CrossRef]
- Garrity, D.; Dixon, J.; Boffa, J.-M. Understanding African Farming Systems: Science and Policy Implications. In Proceedings of the Food Security in Africa: Bridging Research and Practice, Sydney, Australia, 29–30 November 2012. [Google Scholar]
- Misselhorn, A.A. What Drives Food Insecurity in Southern Africa? A Meta-Analysis of Household Economy Studies. Glob. Environ. Chang. 2005, 15, 33–43. [Google Scholar] [CrossRef]
- Mkandawire, P.; Aguda, N.D. Characteristics and Determinants of Food Insecurity in Sub-Saharan Africa. In Environment and Health in Sub-Saharan Africa: Managing an Emerging Crisis; Springer: Dordrecht, The Netherlands; Berlin/Heidelberg, Germany; London, UK; New York, NY, USA, 2009; pp. 3–23. ISBN 978-1-4020-9381-4. [Google Scholar]
- Chagomoka, T.; Unger, S.; Drescher, A.; Glaser, R.; Marschner, B.; Schlesinger, J. Food Coping Strategies in Northern Ghana. A Socio-Spatial Analysis along the Urban–Rural Continuum. Agric. Food Secur. 2016, 5, 4. [Google Scholar] [CrossRef]
- Kansiime, M.K.; van Asten, P.; Sneyers, K. Farm Diversity and Resource Use Efficiency: Targeting Agricultural Policy Interventions in East Africa Farming Systems. NJAS—Wagening. J. Life Sci. 2018, 85, 32–41. [Google Scholar] [CrossRef]
- Mascarenhas, A.; Odero-Ogwel, L.A.; Masakhalia, Y.F.O.; Biswas, A.K. Land Use Policies and Farming Systems: Kenya, Tanzania, Zambia and Mozambique. Land Use Policy 1986, 3, 286–303. [Google Scholar] [CrossRef]
- Kuivanen, K.S.; Alvarez, S.; Michalscheck, M.; Adjei-Nsiah, S.; Descheemaeker, K.; Mellon-Bedi, S.; Groot, J.C.J. Characterising the Diversity of Smallholder Farming Systems and Their Constraints and Opportunities for Innovation: A Case Study from the Northern Region, Ghana. NJAS—Wagening. J. Life Sci. 2016, 78, 153–166. [Google Scholar] [CrossRef]
- Tittonell, P.; Muriuki, A.; Shepherd, K.D.; Mugendi, D.; Kaizzi, K.C.; Okeyo, J.; Verchot, L.; Coe, R.; Vanlauwe, B. The Diversity of Rural Livelihoods and Their Influence on Soil Fertility in Agricultural Systems of East Africa—A Typology of Smallholder Farms. Agric. Syst. 2010, 103, 83–97. [Google Scholar] [CrossRef]
- Abbas, M. A Farming System Approach to Support Food Policies under Climate Change in Developing Countries: The Case of Mozambique. Ph.D. Thesis, Lisbon University, Lisbon, Portugal, 2022. [Google Scholar]
- Liwenga, E. Food Insecurity and Coping Strategies in Semiarid Areas: The Case of Mvimu in Central Tanzania. Ph.D. Thesis, Stockholm University, Stockholm, Sweden, 2003. [Google Scholar]
- Maxwell, D.; Caldwell, R.; Langworthy, M. Measuring Food Insecurity: Can an Indicator Based on Localized Coping Behaviors Be Used to Compare across Contexts? Food Policy 2008, 33, 533–540. [Google Scholar] [CrossRef]
- Norman, D.W.; Worman, F.D.; Siebert, J.D.; Modiakgotla, E. The Farming Systems Approach to Development and Appropriate Technology Generation; FAO, Ed.; FAO: Rome, Italy, 1995; ISBN 9251036446. [Google Scholar]
- Köbrich, C. The Construction and Use of Compromise Programming Models to Measure the Impact of Development Policies on the Sustainability of Peasant Farming Systems in Central Chile. Ph.D. Thesis, The University of Reading, Reading, UK, 1997. [Google Scholar]
- Boere, E.; Aline, M.; Bocquého, G.; Garbero, A.; Krisztin, T.; Havlik, P.; Elhaut, T. Developing Country-Wide Farming System Typologies; International Fund for Agricultural Development (IFAD): Rome, Italy, 2018; ISBN 9789290728566. [Google Scholar]
- Massawe, G.D. Farming Systems and Household Food Security in Tanzania: The Case of Mvomero and Kishapu Districts. Ph.D. Thesis, University College Dublin, Dublin, Ireland, 2016. [Google Scholar]
- Mnenwa, R.; Maliti, E. A Comparative Analysis of Poverty Incidence in Farming Systems of Tanzania; Research on Poverty Alleviation (REPOA): Dar es Salaam, Tanzania, 2010. [Google Scholar]
- Thornton, P.K.; van de Steeg, J.; Notenbaert, A.; Herrero, M. The Impacts of Climate Change on Livestock and Livestock Systems in Developing Countries: A Review of What We Know and What We Need to Know. Agric. Syst. 2009, 101, 113–127. [Google Scholar] [CrossRef]
- Thornton, P.; Jones, P.; Alagarswamy, G.; Andresen, J.; Herrero, M. Adapting to Climate Change: Agricultural System and Household Impacts in East Africa. Agric. Syst. 2010, 103, 73–82. [Google Scholar] [CrossRef]
- Ribeiro, P.F.; Santos, J.L. Exploring the Effects of Climate Change on Farming System Choice: A Farm-Level Space-for-Time Approach. Land 2023, 12, 2113. [Google Scholar] [CrossRef]
- Tittonell, P.; Bruzzone, O.; Solano-Hernández, A.; López-Ridaura, S.; Easdale, M.H. Functional Farm Household Typologies through Archetypal Responses to Disturbances. Agric. Syst. 2020, 178, 102714. [Google Scholar] [CrossRef]
- Santos, J.L.; Moreira, F.; Ribeiro, P.F.; Canadas, M.J.; Novais, A.; Lomba, A. A Farming Systems Approach to Linking Agricultural Policies with Biodiversity and Ecosystem Services. Front. Ecol. Environ. 2021, 19, 168–175. [Google Scholar] [CrossRef]
- Mbanze, A.A.; Viera da Silva, C.; Ribeiro, N.S.; Silva, J.F.; Santos, J.L. A Livelihood and Farming System Approach for Effective Conservation Policies in Protected Areas of Developing Countries: The Case Study of the Niassa National Reserve in Mozambique. Land Use Policy 2020, 99, 105056. [Google Scholar] [CrossRef]
- MEF. Estratégia Nacional de Desenvolvimento (ENDE) 2025–2040; Ministério da Economia e Finanças: Maputo, Mozambique, 2024.
- MINAG. Plano Estratégico Para o Desenvolvimento Do Sector Agrário: PEDSA 2011–2020; Ministry of Agriculture: Maputo, Mozambique, 2010.
- INE. Censo Agro-Pecuário 2009–2010: Resultados Definitivos—Moçambique; Instituto Nacional de Estatistica: Maputo, Mozambique, 2011.
- MASA. Anuário de Estatísticas Agrárias 2015; Ministry of Agriculture and Food Security: Maputo, Moçambique, 2016.
- World Bank. Mozambique: Analysis of Public Expenditure in Agriculture; World Bank: Washington, DC, USA, 2011; Volume I. [Google Scholar]
- Mosca, J.; Nova, Y. Agricultura: Assim, Não é Possível Reduzir a Pobreza Em Moçambique; Observador Rural: Maputo, Mozambique, 2019. [Google Scholar]
- SETSAN. Relatório de Estudo de Base de Segurança Alimentar e Nutricional Em 2013 Em Moçambique; SETSAN: Maputo, Mozambique, 2014. [Google Scholar]
- IPC. Análise IPC Da InsegurançaAlimentar Aguda: Novembro 2021–Setembro 2022; IPC: Maputo, Mozambique, 2021. [Google Scholar]
- Abbas, M. Segurança Alimentar Pós-Colheita 2022: 50% Da População Em Situação de Insegurança Alimentar Aguda? Destaque Rural; Observatório do Meio Rural: Maputo, Mozambique, 2023. [Google Scholar]
- INE. Relatório Final Do Inquérito Sobre Orçamento Familiar—IOF 2022; Instituto Nacional de Estatistica: Maputo, Mozambique, 2023.
- Andersen, E.; Elbersen, B.; Godeschalk, F.; Verhoog, D. Farm Management Indicators and Farm Typologies as a Basis for Assessments in a Changing Policy Environment. J. Environ. Manag. 2007, 82, 353–362. [Google Scholar] [CrossRef]
- Fick, S.E.; Hijmans, R.J. WorldClim 2: New 1km Spatial Resolution Climate Surfaces for Global Land Areas. Int. J. Climatol. 2017, 37, 4302–4315. [Google Scholar] [CrossRef]
- Dedehouanou, S.F.A.; McPeak, J. Diversify More or Less? Household Income Generation Strategies and Food Security in Rural Nigeria. J. Dev. Stud. 2020, 56, 560–577. [Google Scholar] [CrossRef]
- Meertens, H.C.C.; Fresco, L.O.; Stoop, W.A. Agriculture Ecosystems & Enwonment Farming Systems Dynamics: Impact of Increasing Population Density and the Availability of Land Resources on Changes in Agricultural Systems. The Case of Sukumaland, Tanzania. Ecosyst. Environ. 1996, 56, 203–215. [Google Scholar] [CrossRef]
- Boserup, E. The Impact of Population Growth on Agricultural Output. Source Q. J. Econ. 1975, 89, 257–270. [Google Scholar] [CrossRef]
- Jayne, T.S.; Muyanga, M. Land Constraints in Kenya’s Densely Populated Rural Areas: Implications for Food Policy and Institutional Reform. Food Secur. 2012, 4, 399–421. [Google Scholar] [CrossRef][Green Version]
- Stephens, E.; Jones, A.; Parsons, D. Agricultural Systems Research and Global Food Security in the 21st Century: An Overview and Roadmap for Future Opportunities. Agric. Syst. 2018, 163, 1–6. [Google Scholar] [CrossRef]
- Mango, N.; Makate, C.; Mapemba, L.; Sopo, M. The Role of Crop Diversification in Improving Household Food Security in Central Malawi. Agric. Food Secur. 2018, 7, 7. [Google Scholar] [CrossRef]
- Campi, M.; Dueñas, M.; Fagiolo, G. Specialization in Food Production Affects Global Food Security and Food Systems Sustainability. World Dev. 2021, 141, 105411. [Google Scholar] [CrossRef]
- Makate, C.; Wang, R.; Makate, M.; Mango, N. Crop Diversification and Livelihoods of Smallholder Farmers in Zimbabwe: Adaptive Management for Environmental Change. SpringerPlus 2016, 5, 1135. [Google Scholar] [CrossRef]
- Maggio, G.; Sitko, N.J.; Ignaciuk, A. Cropping System Diversification in Eastern and Southern Africa: Identifying Policy Options to Enhance Productivity and Build Resilience; FAO: Rome, Italy, 2018. [Google Scholar]
- Lukanu, G.; Green, M.; Greenfield, P.; Worth, S. Farmers’ Cash Crop Cultivation Decisions in Southern Niassa Province, Mozambique. Dev. South Afr. 2004, 21, 531–554. [Google Scholar] [CrossRef]
- Bruna, N. Competitividade Do Algodão Em Moçambique; Observador Rural; Observatório do Meio Rural: Maputo, Mozambique, 2014. [Google Scholar]
- Mosca, J. Sector Familiar da Agricultura (3.9 Milhóes de Famílias): Cada Vez Mais Pobres e Marginalizados. In Razões Económicas, Institucionais, Ideológicas e Políticas e Interesses Externos; Destaque Rural; Observatório do Meio Rural: Maputo, Mozambique, 2019. [Google Scholar]
- FEWSNET; SETSAN. Moçambique—Descrição Das Zonas de Formas de Vida; FEWSNET: Washington, DC, USA; SETSAN: Maputo, Mozambique, 2014. [Google Scholar]
- Paganini, N.; da Ouana, R.F. Mercados Locais Na Cidade e Província de Maputo: Relatório de Pesquisa Qualitativa; Observatório do Meio Rural: Maputo, Mozambique, 2019. [Google Scholar]
- Brito, R.; Holman, E. Responding to Climate Change in Mozambique: Theme 6—Agriculture; Observatório do Meio Rural: Maputo, Mozambique, 2012. [Google Scholar]
- Marques, M.; Mafalacusser, J.; Brito, R.; Metzger, M.; Tadross, M. Assessing Future Impacts of Climate Change on Land Use and Land Cover: Actual and Potential Agricultural Land Use. In INGC Climate Change Report: Study on the Impact of Climate Change on Disaster Risk in Mozambique; Asante, K., Brundrit, G., Epstein, P., Fernandes, A., Marques, M.R., Mavume, A., Metzger, M., Patt, A., Queface, A., Sanchez del Valle, R., et al., Eds.; INGC: Maputo, Mozambique, 2009; pp. 89–117. [Google Scholar]
- INE. Estatísticas e Indicadores Sociais, 2013–2014; Instituto Nacional de Estatistica: Maputo, Mozambique, 2015.
- Béringuier, M. Diagnosis of Agrarian Dynamics on the Eastern Slope of Mount Namuli & Analysis of Agricultural Practices into Deforestation Dynamics and Definition of an Agricultural Accompaniment; Nitidae: Maputo, Mozambique, 2019. [Google Scholar]
- Abbas, M. (In)Segurança Alimentar e Território Em Moçambique: Discursos Políticos e Práticas. Rev. NERA 2017, 20, 106–131. [Google Scholar] [CrossRef]
- Yohannes, G.; Wolka, E.; Bati, T.; Yohannes, T. Household Food Insecurity and Coping Strategies among Rural Households in Kedida Gamela District, Kembata Tembaro Zone, Southern Ethiopia: Mixed methods Concurrent Triangulation Design. BMC Nutr. 2023, 9, 4. [Google Scholar] [CrossRef]
- Tsegaye, A.T.; Tariku, A.; Worku, A.G.; Abebe, S.M.; Yitayal, M.; Awoke, T.; Alemu, K.; Biks, G.A. Reducing Amount and Frequency of Meal as a Major Coping Strategy for Food Insecurity. Arch. Public Health 2018, 76, 56. [Google Scholar] [CrossRef]
- Farzana, F.D.; Rahman, A.S.; Sultana, S.; Raihan, M.J.; Haque, M.A.; Waid, J.L.; Choudhury, N.; Ahmed, T. Coping Strategies Related to Food Insecurity at the Household Level in Bangladesh. PLoS ONE 2017, 12, e0171411. [Google Scholar] [CrossRef] [PubMed]
- Lasse, N.; Abbas, M. Determinantes Da Escassez de Alimentos e Estratégias de Sobrevivência No Sector Familiar Nos Distritos de Nicoadala, Morrumbala e Gurué; Destaque Rural Nº 258; Observatório do Meio Rural: Maputo, Mozambique, 2023. [Google Scholar]
- Moore, N.; Alagarswamy, G.; Pijanowski, B.; Thornton, P.; Lofgren, B.; Olson, J.; Andresen, J.; Yanda, P.; Qi, J. East African Food Security as Influenced by Future Climate Change and Land Use Change at Local to Regional Scales. Clim. Chang. 2012, 110, 823–844. [Google Scholar] [CrossRef]
- Ume, C. The Role of Improved Market Access for Small-Scale Organic Farming Transition: Implications for Food Security. J. Clean. Prod. 2023, 387, 135889. [Google Scholar] [CrossRef]
- Bahta, Y.T.; Musara, J.P. Diversity of Food Insecurity Coping Strategies among Livestock Farmers in Northern Cape Province of South Africa. Climate 2023, 11, 82. [Google Scholar] [CrossRef]
- Ouédraogo, M.; Zougmoré, R.; Moussa, A.S.; Partey, S.T.; Thornton, P.K.; Kristjanson, P.; Ndour, N.Y.B.; Somé, L.; Naab, J.; Boureima, M.; et al. Markets and Climate Are Driving Rapid Change in Farming Practices in Savannah West Africa. Reg. Environ. Chang. 2017, 17, 437–449. [Google Scholar] [CrossRef]
- Otekunrin, O.A.; Otekunrin, O.A.; Sawicka, B.; Pszczółkowski, P. Assessing Food Insecurity and Its Drivers among Smallholder Farming Households in Rural Oyo State, Nigeria: The HFIAS Approach. Agriculture 2021, 11, 1189. [Google Scholar] [CrossRef]

| Farming System | Description |
|---|---|
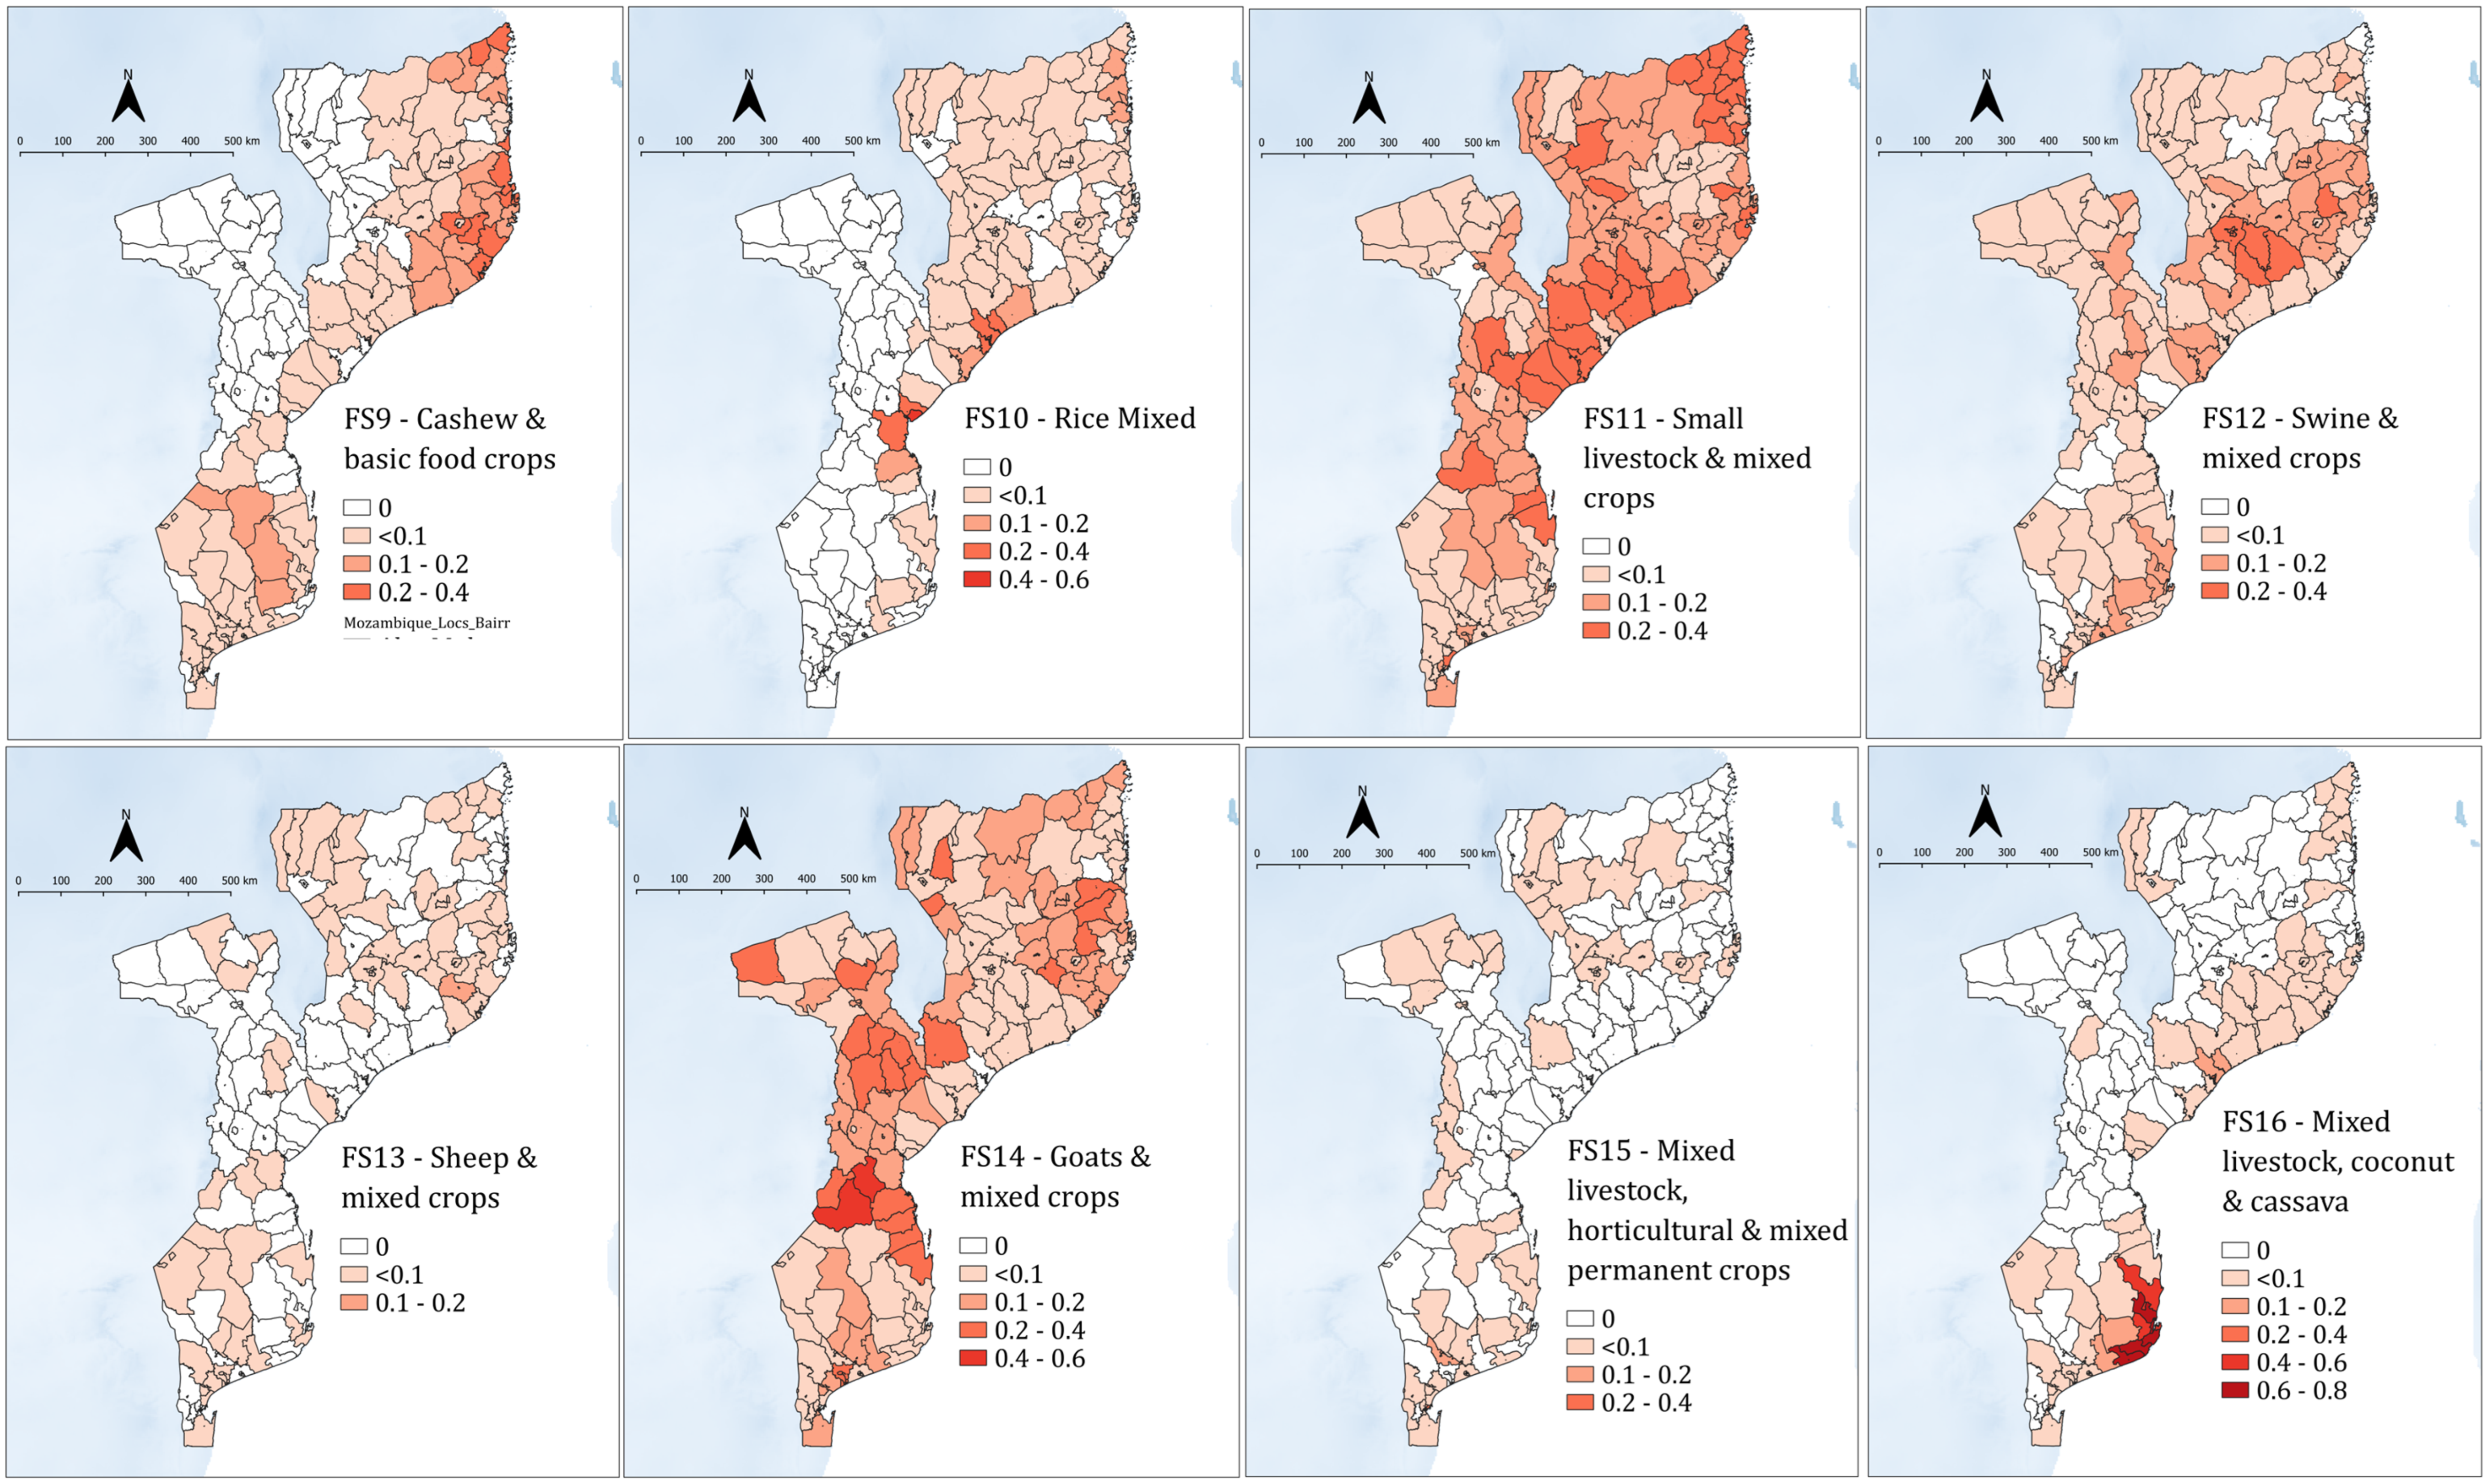
| FS1. Tobacco and Maize | A market-oriented FS (on avg. 35% of the output is sold), where farmland is mostly composed by tobacco (40%), maize, and beans (36% collectively), using yield-raising inputs such as fertilizers and pesticides (on avg. applied on 55% and 14% of farmland, respectively). Low livestock density (0.60) including chickens and goats. Farms are mostly managed by men (85%), with a farm size of 2.3 hectares (ha), and the household usually has 5 members. |
| FS2. Cotton | Farmland is mostly dedicated to cotton (57%), other crops include maize, sorghum, and beans (covering together 26% of the farmland). On avg. about 1/4 of the area uses pesticides. Low livestock intensity (0.88), including small and large livestock (e.g., chickens and cattle). Integrated in the market. The farm size is 1.8 ha and the household has usually 5 members. Farms are mostly managed by men (87%). |
| FS3. Sesame and Maize | Maize and sesame occupy, on avg., 31% and 27% of the farmland, respectively. Other crops include beans, cassava, sorghum, and others. Low livestock-density (0.55), with chickens and goats. Farm households do not use yield-raising inputs. Integrated in the market. On average, farm size is 1.4 ha and the household has usually 5 members. Farms are mostly managed by men (77%). |
| FS4. Food Crops | Farmland is mostly dedicated to horticultural crops (32%), maize (26%), sorghum (18%), and beans (9%). Very low livestock density (0.20), with only a few chickens. Does not use yield-raising inputs. On average, the farm size is 1.1 ha, with 5 household members and 41% of farms are managed by women. |
| FS5. Basic Food Crops | Most of the farmland is used to produce cassava, Leguminosae (beans and groundnuts), and maize; with the lowest livestock density (0.14). Farm households do not use yield-raising and labor-saving inputs while 40% of farms are managed by women and have, on average, 1 ha and a household size of 5 members. |
| FS6. Mixed Livestock and Maize | On avg. 3/4 of the area is dedicated to food crops such as maize, Leguminosae, and cassava. Nevertheless, this is one of the few FS that also produces horticultural crops and rice (occupying on avg. 10% and 6% of the farmland). Livestock density is higher (2.40), with a variety of animals, including chickens (14 on avg.), bovine (6), goats (4), pigs and sheep (1 of each). Most farm households use tractors (96%) and some use bovine traction (43%). Farm size is about 2.3 ha, and the household has on avg. 7 members while 44% of farms are managed by women. |
| FS7. Bovine, Maize, and Other Food Crops | Farmland is dedicated mostly to food crops, including maize (46%), horticultural crops (15%), beans (13%), cassava (11%), groundnuts (8%), and rice (6%). The highest livestock density (6.12), with mostly cattle and 87% of farms use bovine traction. Mostly managed by men (70%), with farm size of 2 ha, and the largest household (on avg. 8 members). |
| FS8. Roots and Mixed Permanent Crops | Farmland is mostly dedicated to roots and tubers (e.g., sweet potato and cassava)—on avg. 3/4 of the farmland. Permanent crops occupy ca. 1/4 of equivalent farmland (e.g., mango trees). Low livestock density (0.78). Farm size is less than 1 ha and 46% of farms are managed by women. The household size is 5. |
| FS9. Cashew and Mixed Basic Food Crops | Most farmland is dedicated to cassava (40%), Leguminosae (beans and groundnuts, 30%), and cereals (maize and sorghum, 26%). On avg. 27% of equivalent farmland has permanent crops, with ca. 80% being cashew trees. Extremely low livestock density (0.18) and 38% of farms are managed by women, with a farm size of 1 ha, and the smallest household size (4 members). |
| FS10. Rice and Mixed (Permanent Crops and Livestock) | On average 93% of the farmland is dedicated to rice and 17% of equivalent farmland includes permanent crops, with half of it with coconut and mango trees. Low livestock density (0.76). Farm size is less than 1 ha and 45% of farms are managed by women, with households of 5 members. |
| FS11. Small Livestock and Mixed Crops | The farmland is dedicated mostly to food crops (maize, cassava, Leguminosae, and sorghum), with a few mango and cashew trees. Low livestock density (0.32) including only chickens. Farm size is 1.1 ha and 35% of farms are managed by women, with households of 5 members. |
| FS12. Swine and Mixed Crops | Like FS11, but with higher livestock density (0.87), including, in addition to chickens, also pigs. |
| FS13. Sheep and Mixed Crops | Like FS11 in terms of food and permanent crops produced. Medium livestock intensity (1.46), including sheep, chickens, and goats. Farm size is 1.3 ha and 77% of farms are managed by men, with households of 6 members. |
| FS14. Goats and Mixed Crops | Like FS13, but with slightly less livestock density (1.28) including only goats and chickens. Farms are managed mostly by men (69%). |
| FS15. Mixed Livestock, Horticultural, and Mixed Permanent Crops | The farmland is largely irrigated (86%), dedicated mostly to horticultural crops (on avg. 73%), with 27% of equivalent farmland with mango and other fruit trees. High livestock density (2.95) including a variety of animals, such as chickens, bovine, goats, and pigs. Integrated in the market, with intensive use of yield-raising inputs (37% of farmland uses pesticides, 43% fertilizers, and 54% manure). Farms are mostly managed by men (74%), with a farm size of 1 ha, and household size of 6 people. |
| FS16. Mixed Livestock, Coconut, and Cassava | The farmland is dedicated mostly to cassava (50%) and Leguminosae (30%). Permanent crops occupy almost 90% of equivalent farmland, with more than half of the area with coconut trees. High livestock density (2.54), including chickens, bovine, goats, and pigs with 60% of farms using bovine traction. Farms are managed mostly by women (51%), with farm size of 1 ha, and household size is 6 people. |
Disclaimer/Publisher’s Note: The statements, opinions and data contained in all publications are solely those of the individual author(s) and contributor(s) and not of MDPI and/or the editor(s). MDPI and/or the editor(s) disclaim responsibility for any injury to people or property resulting from any ideas, methods, instructions or products referred to in the content. |
© 2024 by the authors. Licensee MDPI, Basel, Switzerland. This article is an open access article distributed under the terms and conditions of the Creative Commons Attribution (CC BY) license (https://creativecommons.org/licenses/by/4.0/).
Share and Cite
Abbas, M.; Ribeiro, P.F.; Santos, J.L. A Farming System Approach to Exploring Drivers of Food Insecurity Among Farm Households in Developing Countries: The Case Study of Mozambique. Agronomy 2024, 14, 2608. https://doi.org/10.3390/agronomy14112608
Abbas M, Ribeiro PF, Santos JL. A Farming System Approach to Exploring Drivers of Food Insecurity Among Farm Households in Developing Countries: The Case Study of Mozambique. Agronomy. 2024; 14(11):2608. https://doi.org/10.3390/agronomy14112608
Chicago/Turabian StyleAbbas, Máriam, Paulo Flores Ribeiro, and José Lima Santos. 2024. "A Farming System Approach to Exploring Drivers of Food Insecurity Among Farm Households in Developing Countries: The Case Study of Mozambique" Agronomy 14, no. 11: 2608. https://doi.org/10.3390/agronomy14112608
APA StyleAbbas, M., Ribeiro, P. F., & Santos, J. L. (2024). A Farming System Approach to Exploring Drivers of Food Insecurity Among Farm Households in Developing Countries: The Case Study of Mozambique. Agronomy, 14(11), 2608. https://doi.org/10.3390/agronomy14112608


