Article

Response of Soil Moisture to Precipitation at Different Smash-Ridging Tillage Depths in Typical Sugarcane Fields in Guangxi, China

1
Collaborative Innovation Center for Water Pollution Control and Water Safety in Karst Area, Guilin University of Technology, Guilin 541006, China
2
Guangxi Key Laboratory of Theory and Technology for Environmental Pollution Control, Guilin University of Technology, Guilin 541006, China
3
Institute of Economic Crops, Guangxi Academy of Agricultural Sciences, Nanning 530007, China
4
Institute of Microbiology, Guangxi Academy of Agricultural Sciences, Nanning 530007, China
*
Authors to whom correspondence should be addressed.
Agronomy 2024, 14(11), 2576; https://doi.org/10.3390/agronomy14112576
Submission received: 27 September 2024 / Revised: 24 October 2024 / Accepted: 30 October 2024 / Published: 1 November 2024
(This article belongs to the Special Issue Soil Health and Properties in a Changing Environment)

Abstract

:
The purpose of this study was to identify the optimal smash-ridging tillage depth in sugarcane fields in Guangxi, China, in order to improve soil moisture conditions. Three treatments were implemented in sugarcane cultivation areas, with smash-ridging tillage depths of 20 cm, 40 cm, and 60 cm. The dynamics of soil moisture were monitored at depths of 5 cm, 20 cm, and 40 cm to investigate their response to precipitation. The results indicated that the F40 treatment had the highest mean soil moisture content. The F40 treatment exhibited a 29.85% increase in percent area of significant coherence (PASC) compared to the F20 treatment and an 8.23% increase in PASC compared to the F60 treatment. These results indicated that the F40 treatment exhibited the most significant vertical exchange. Under the same precipitation conditions, the F20 and F40 treatments exhibited a quicker soil moisture response to precipitation than the F60 treatment. The mean soil moisture replenishment (SMR) of the F40 treatment was 0.94% and 11.02% higher than that of the F20 and F60 treatments, respectively. Following the torrential rainfall event, the F40 treatment exhibited the slowest recession rate of soil moisture, indicating a greater capacity for water retention. Therefore, the smash-ridging tillage depth of 40 cm resulting in the best responsiveness to precipitation was recommended for sugarcane cultivation in Guangxi, China, which effectively improved soil moisture exchanges.

1. Introduction

Soil moisture is a critical factor for stable crop growth and plays an essential role in crop development [1,2]. Precipitation; evaporation; and soil properties (e.g., density, porosity, and texture) all contribute to the internal dynamics of soil moisture [3,4,5]. Soil moisture is a critical link between precipitation, surface water, and groundwater, which regulates the evapotranspiration and photosynthesis of vegetation, thereby impacting the water, energy, and geo-biochemical cycles [6,7,8]. Additionally, fluctuations in evapotranspiration and plant transpiration have a direct impact on the redistribution of surface precipitation [9,10]. Variations in precipitation serve as a key mechanism for replenishing soil moisture, significantly impacting regional moisture patterns [11]. Consequently, it is imperative to examine the correlation between precipitation and soil moisture.
The response of soil moisture to precipitation has been the subject of extensive research and discussion by a multitude of scholars [12,13]. Different amounts of precipitation, along with its intensity and other characteristics, affect the infiltration and storage of soil moisture throughout the soil layer [14]. The response of soil moisture content to precipitation at different depths is subject to spatial variations. As the precipitation intensity increases, soil moisture replenishment and migration depth decrease for comparable precipitation amounts [15]. Furthermore, the impact of precipitation on soil moisture replenishment is also influenced by soil permeability and moisture storage capacity. The response of soil moisture to precipitation is collectively determined by vegetation cover, precipitation attributes, and their interactions [16]. Heavy rainfall events can intensify fluctuations in soil moisture, whereas extended periods of drought heighten water stress for crop growth. Concurrently, soil moisture content plays a significant role in determining the precipitation infiltration capacity and influencing runoff processes [17,18]. When the soil moisture content is low in drought regions, precipitation typically results in increased surface runoff. Conversely, when the soil moisture content is high, it more easily infiltrates deeper into the soil [19].
In contemporary agricultural production, human intervention frequently involves the use of tillage to improve the soil environment and facilitate the growth of crops. However, tillage practices have an impact on the physical and chemical properties of the soil, temporarily loosening large pores and ultimately influencing the soil’s response to precipitation [20,21,22]. Sun et al. [23] discovered that the soil’s ability to retain natural precipitation could be improved by both deep tillage and loosening, which, in turn, could increase crop yields and the efficacy of precipitation use, particularly during dry years. Yankov and Drumev [24] noted that tillage demonstrates a more pronounced response to precipitation, accumulating a greater amount of water in the soil profile during periods of intense rainfall. The results of Czyż [25] showed that direct drilling practices increased the soil moisture content of the topsoil layer compared to conventional tillage. It was determined that the vertical rotary tillage treatment was more effective in utilizing precipitation following heavy rainfall than other treatments with varying tillage depths on maize fields [26]. By examining the spatial and temporal dynamics of soil moisture in dryland wheat under various tillage methods, researchers discovered that deep tillage enhances the efficiency of utilizing deep soil moisture and increases precipitation storage [27,28]. Guangxi’s sugarcane cultivation area exceeds 60% of China’s national sugarcane acreage. Nevertheless, 90% of the sugarcane in Guangxi is cultivated in dryland lacking irrigation conditions [29]. In recent years, a novel agricultural tillage technology known as “smash-ridging” has been implemented. A double screw auger is employed in this technology to accomplish vertical rotation and pulverization of the soil. During this process, the soil particles are naturally suspended, and a ridge is formed [30]. The depth of smash-ridging tillage can be determined by the growth requirements of the crops [31]. Previous research primarily concentrated on the impact of various tillage methods on soil moisture and rainfall response [24,25]. Research on differing depths of smash-ridging tillage just focused on aspects such as crop development and soil properties [32,33]. However, examining research on the soil moisture response to precipitation across different smash-ridging tillage depths remains lacking. Consequently, it is imperative to investigate the movement of soil moisture and its response to precipitation at different smash-ridging tillage depths in sugarcane fields, in order to more accurately ascertain the most appropriate smash-ridging tillage depth for sugarcane.
This study focused on sugarcane cultivation in the Guangxi region of China, investigating the dynamic variations in soil moisture and its vertical distribution under different smash-ridging tillage depths, using data from precipitation and soil moisture content monitoring. The study aimed to (1) explore the dynamic variations in soil moisture and its vertical exchange under three tillage depths, (2) assess the response of soil moisture content to varying precipitation across different tillage depths, and (3) analyze the characteristics of soil moisture replenishment following different precipitation events. The study hypothesized that increasing the depth of smash-ridging tillage in sugarcane cultivation would lead to a more pronounced response of soil moisture to precipitation in the Guangxi region of China, resulting in a more timely and effective water replenishment process.

2. Materials and Method

2.1. Experiment Area

The study site was situated at the Lijian Base of the Guangxi Academy of Agricultural Sciences in the Wuming District (23°99′ N, 108°02′ E) of Nanning City, Guangxi Zhuang Autonomous Region, China. The Lijian Scientific Research Base is located on a terrain that slopes from the northwest to the southeast, with a mean altitude of 120 m. The climate of this region is subtropical monsoon, with a mean annual temperature of 22 °C, 1200–1800 mm of precipitation, 79% relative humidity, and 1800 h of total annual sunshine. In the spring and autumn, it is susceptible to droughts, while the summer is characterized by hot and rainy weather. The study area is predominantly hilly, featuring slightly acidic soil pH levels that range from 5.0 to 6.5. The soil type consists of red soil derived from quaternary shallow metamorphic rocks.

2.2. Experiment Design and Field Management

In this experiment, three treatments of differing smash-ridging tillage depths were implemented: a 20 cm tillage depth treatment (F20), a 40 cm tillage depth treatment (F40), and a 60 cm tillage depth treatment (F60). Each treatment was 15 m × 5 m in dimension, with a spacing of approximately 1.3 m. The sugarcane variety used in the study was Guiliu 05-136. Consistent fertilization conditions were maintained for each treatment.
At each treatment, three replicate profiles were randomly selected, resulting in a total of nine profiles. Each soil profile measured 50 cm in length, 50 cm in width, and 60 cm in depth. Representative depths of 5, 20, and 40 cm were chosen for data measurement in the soil layers of 0–10 cm, 10–30 cm, and 30–50 cm, respectively. A Theta-probe moisture sensor (Type ML3, Devices, Cambridge, UK) was horizontally embedded at each depth to monitor soil moisture dynamics, with measurements taken at one-hour intervals. These probes were calibrated for the specific soil conditions using the gravimetric method. The study was conducted from July to October 2022. Before installing the monitors, undisturbed soil samples (100 cm3 cylinders, n = 7) were collected from each layer (0–10 cm, 10–30 cm, and 30–50 cm) for laboratory analysis. Bulk density was determined by air drying the samples in an oven at 105 °C [34]. Soil texture was analyzed using a Malvern laser particle size analyzer [35], and soil organic matter was assessed through dilution thermo-colorimetry with potassium dichromate [36].
A VantagePRO2 portable automatic weather station in the study area continuously recorded meteorological data throughout the test period. Based on the criteria for precipitation intensity set by the National Meteorological Disaster Prevention and Mitigation Standardization Technical Committee [37], the study area received a total precipitation of 361.5 mm during the observation period, categorized into four different precipitation types, as shown in Table 1.

2.3. Data Processing and Analysis

2.3.1. Coefficient of Variation of Soil Moisture

The coefficient of variation (CV), the standard deviation (SD), and the relative variation (δij) among different soil moisture measurements were employed [38]. These could reflect the degree of soil moisture movement within each soil layer.
The SD of soil moisture can be obtained by the formula
S D M i = 1 N 1 j = 1 N M i j M i ¯
where M i j is the soil moisture content (cm3·cm−3) at position i and j time, and N is the number of sample points. M i ¯ is the temporal mean of the soil moisture content across all positions at the time j , and it can be represented by the formula
M i ¯ = 1 N i = 1 N M i j
The CV of soil moisture can be calculated by the formula
C V = S D M i M i ¯ × 100 %

2.3.2. Wavelet Coherency Analysis

This study employed wavelet coherence analysis to investigate the correlations of soil moisture between different soil layers. The soil moisture data underwent preprocessing to generate two time series in the same time domain. Then wavelet coherence analysis was separately conducted to examine the response variation and correlation of the series. The correlation between the moisture of neighboring soil layers was investigated by the interconversion relationship and the degree of correlation. This study employed wavelet coherence analysis to investigate the correlations between soil moisture. The moisture data underwent preprocessing to generate two time series in the same time domain. Then, wavelet coherence analysis was separately conducted to examine the response variation and correlation of the series. The correlation between the moisture of neighboring soil layers was investigated by the interconversion relationship and the degree of correlation. The Morlet wavelet transform (ω = 6) and wavelet coherence toolbox [39] were used in our study. The wavelet coherence between the two spatial series ( X and Y ) can be defined as described by Grinsted et al. [39]:
R i 2 s = S s 1 W i X Y s 2 S s 1 W i X s 2 · S s 1 W i Y s 2
where W i X Y ( S ) is the interactive wavelet power of the spatial series X and Y . W i X and W i Y are the wavelet coefficients of the spatial series X and Y . S is a smoothing operator. The wavelet coherence value is 0–1, which represents the local information of the linear relationship between the two processes.

2.3.3. Soil Moisture Replenishment

To assess the response characteristics of soil moisture to precipitation, the analysis of soil moisture replenishment, replenishment rate, and replenishment efficiency was conducted [40]. The following equations were employed to calculate the soil moisture content and related indices by the following equation:
Δ S M R i = S M R i ,   max S M R i ,   0
where S M R i is the soil moisture replenishment in the soil layer i due to precipitation (mm), S M R i , m a x is the maximum soil moisture storage in the soil layer i after precipitation (mm), and S M R i , 0 indicates the initial soil moisture storage in the soil layer i before precipitation (mm).
The soil moisture replenishment rate was calculated by the following equation:
Q / % = Δ S M R i P × 100
where Q is the soil moisture replenishment rate (%), and P is precipitation (mm).
The soil moisture replenishment efficiency was calculated by the following equation:
V = Δ S M R i t i max t i
where V is the soil moisture replenishment efficiency (mm·h−1), and t i m a x is the time at which the soil layer i reaches maximum soil moisture storage (h).
SPSS 20 (SPSS Inc., Chicago, IL, USA) was performed for the statistical analysis and Pearson correlation analysis. Wavelet coherency analysis was conducted using MATLAB R2016a (The MathWorks Inc., Natick, MA, USA) software with code written by Grinsted [39]. The figures were drawn by Origin 2018 (OriginLab, Northampton, MA, USA).

3. Results

3.1. Soil Physical and Chemical Properties

Table 2 shows the texture and bulk density had no significant differences. The F60 treatment exhibited no significant difference in total porosity. The soil porosity in the 10–30 cm layer of the F40 treatment exhibited significant differences compared to the other two layers, while the soil porosity in the 10–30 cm layer of the F20 treatment only showed a significant difference compared to the surface layer. Additionally, the soil organic matter content gradually declined with the increasing depth in all three treatments. The F20 treatment had the lowest organic matter content in the 30–50 cm soil layer compared to the other treatments.

3.2. Dynamic Variations in Soil Moisture Content

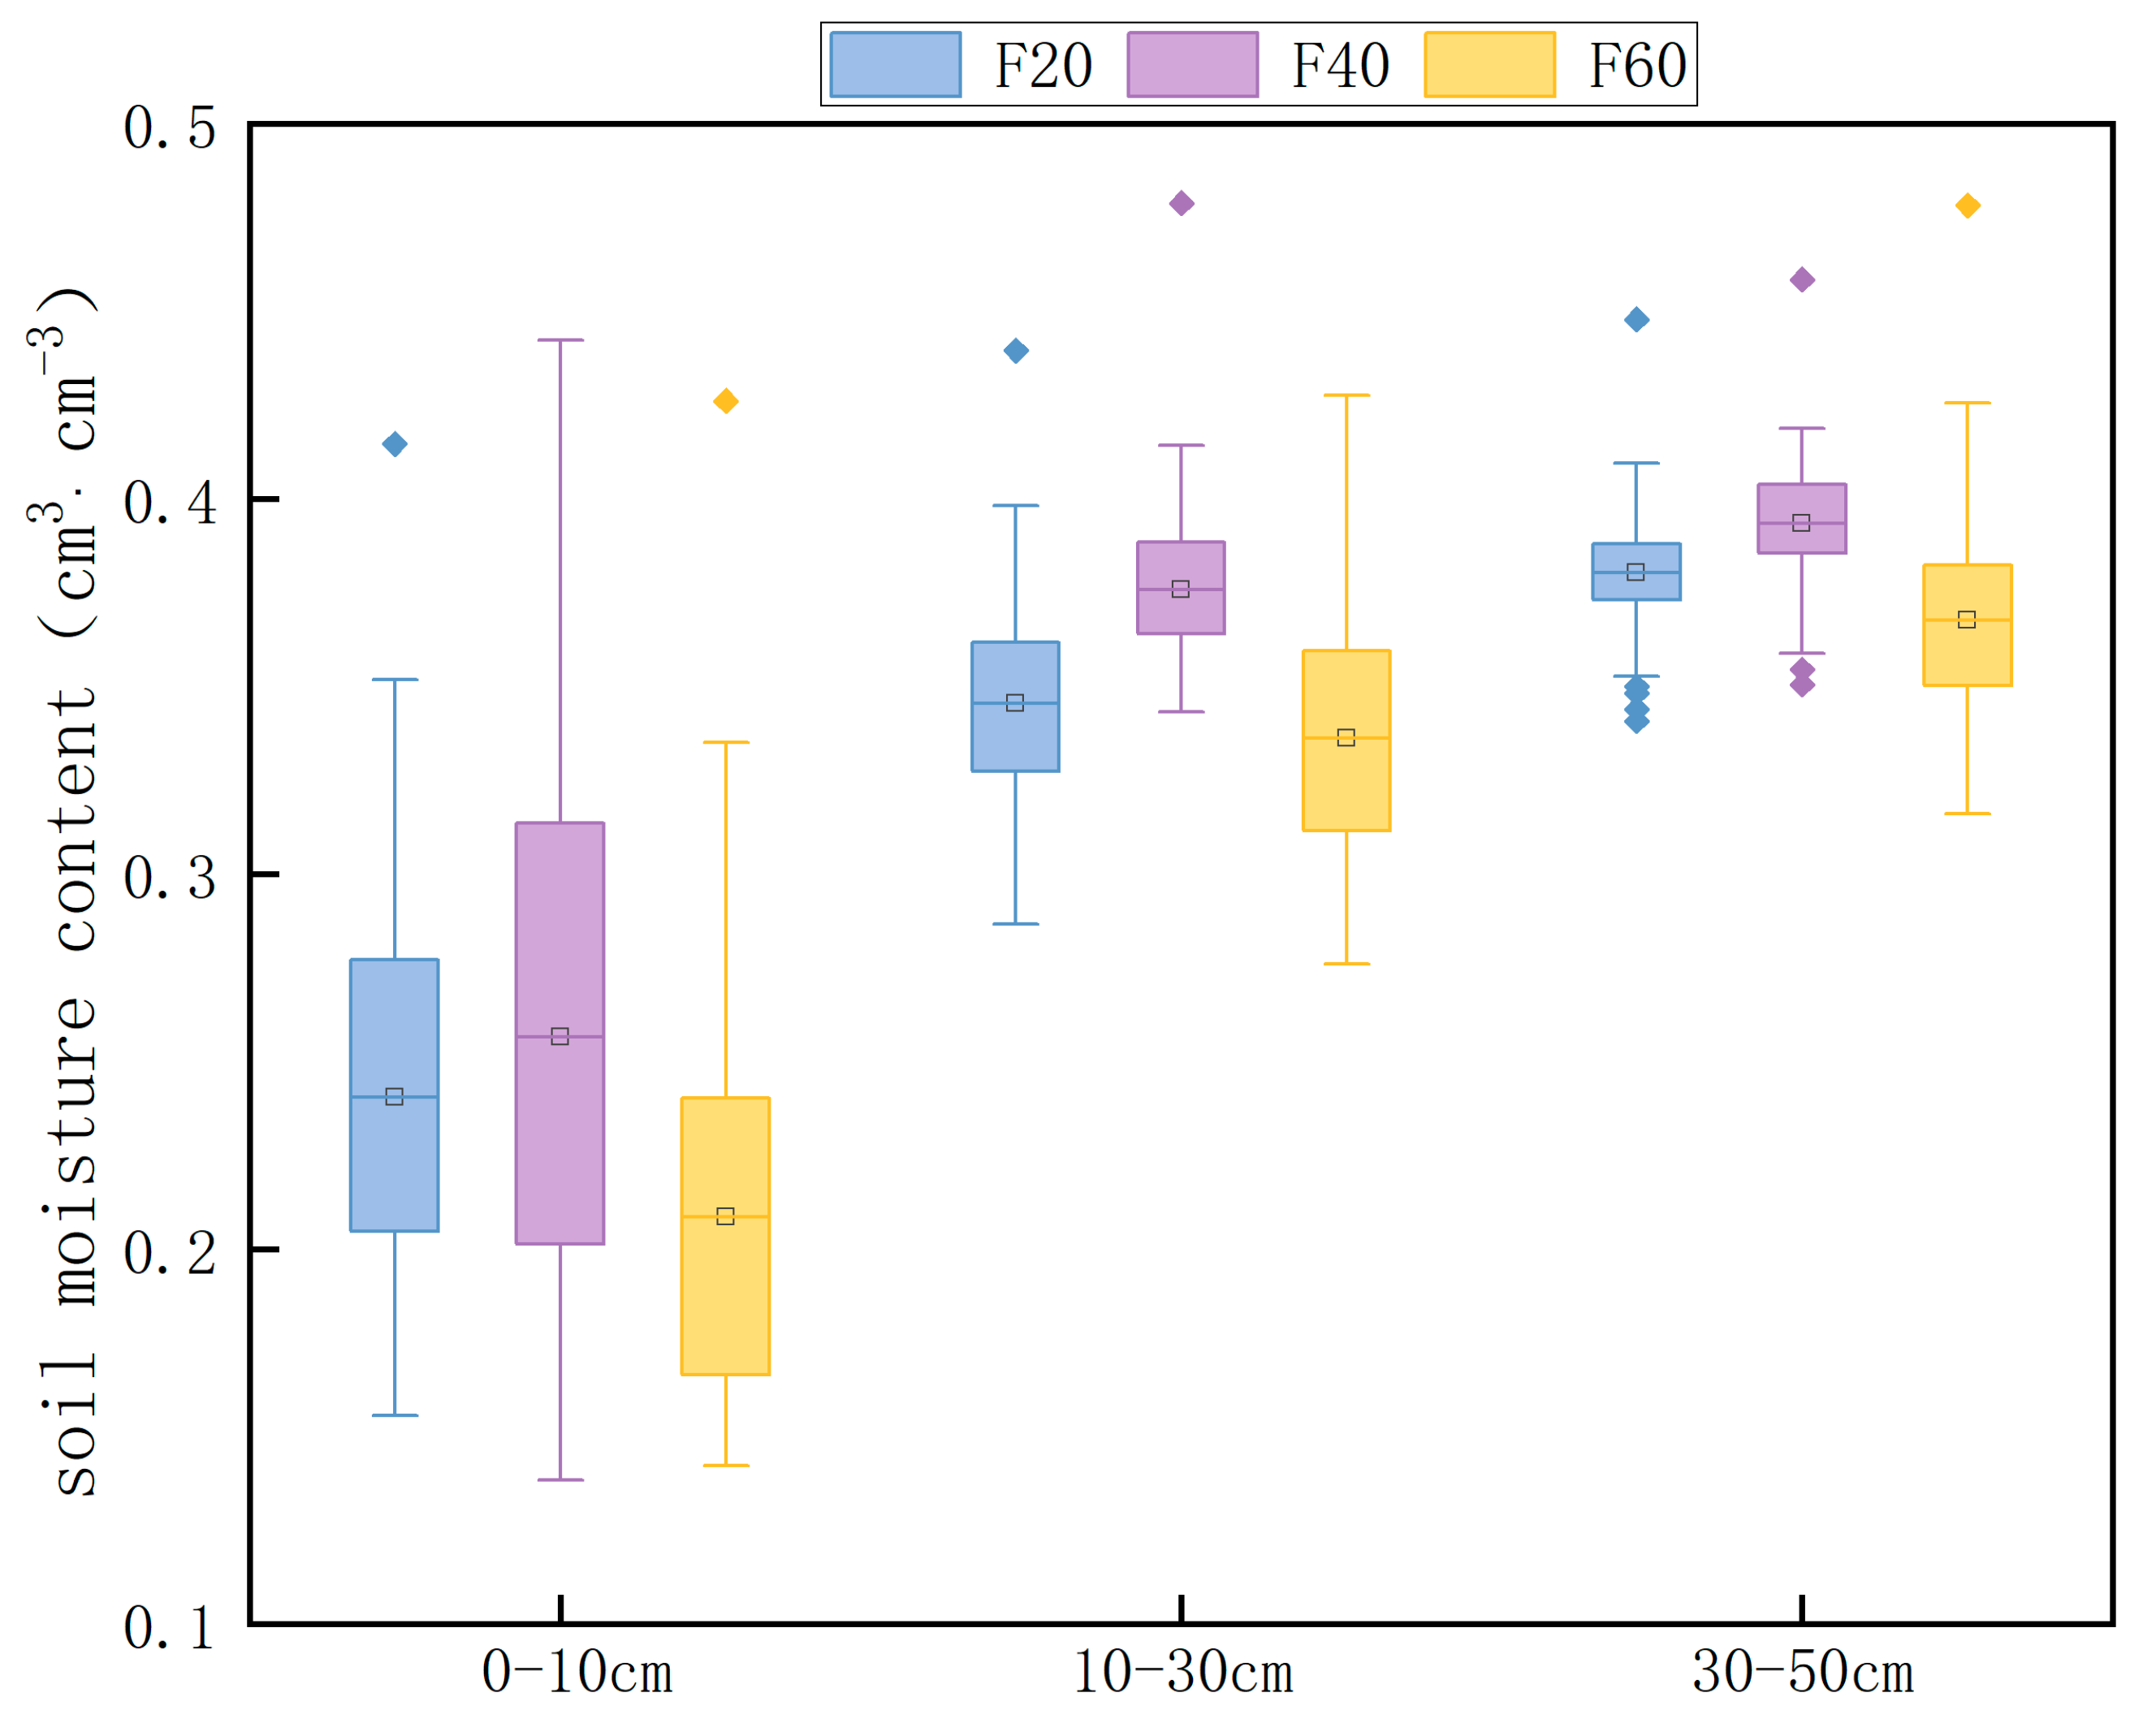
Figure 1 illustrates the temporal dynamics of the soil moisture content in the 0–50 cm soil layer under various treatments. Throughout the observation period, the soil moisture content exhibited similar trends to precipitation across all treatments. The most significant fluctuations in soil moisture were observed in the 0–10 cm layer for all three treatments, while the 30–50 cm layer showed minimal variation and remained relatively stable. Notably, the soil moisture content increased gradually with the depth in all treatments. The lowest soil moisture content among the three treatments was recorded in the 0–10 cm soil layer (Figure 2). The F40 treatment had the highest soil moisture content in the 10–30 cm layer, whereas the F20 and F60 treatments exhibited their highest moisture content in the 30–50 cm layer. Additionally, the mean moisture content in the 0–10 cm layer for the F40 treatment exceeded that of the F20 and F60 treatments by 2.45% and 6.3%, respectively. Below the 10 cm depth, the mean moisture content of the F40 treatment remained higher than that of the F20 and F60 treatments, although the growth rate decreased.
The coefficient of variation (CV) in soil moisture content decreased with the increasing soil depth across different tillage treatments. Surface soil moisture showed a significant response to precipitation, while deep soil moisture exhibited a notably weaker response. Notably, the CV for the F20 treatment was 3.27% and 4.28% lower than that of the F40 and F60 treatments, respectively, in the 0–10 cm soil layer (Table 3). In the layers below 10 cm, the CV for the F40 treatment was lower than that of the other two treatments, indicating greater stability in this treatment.

3.3. Vertical Exchange Trend of Soil Moisture

3.3.1. Wavelet Correlation of Soil Moisture at Different Depths

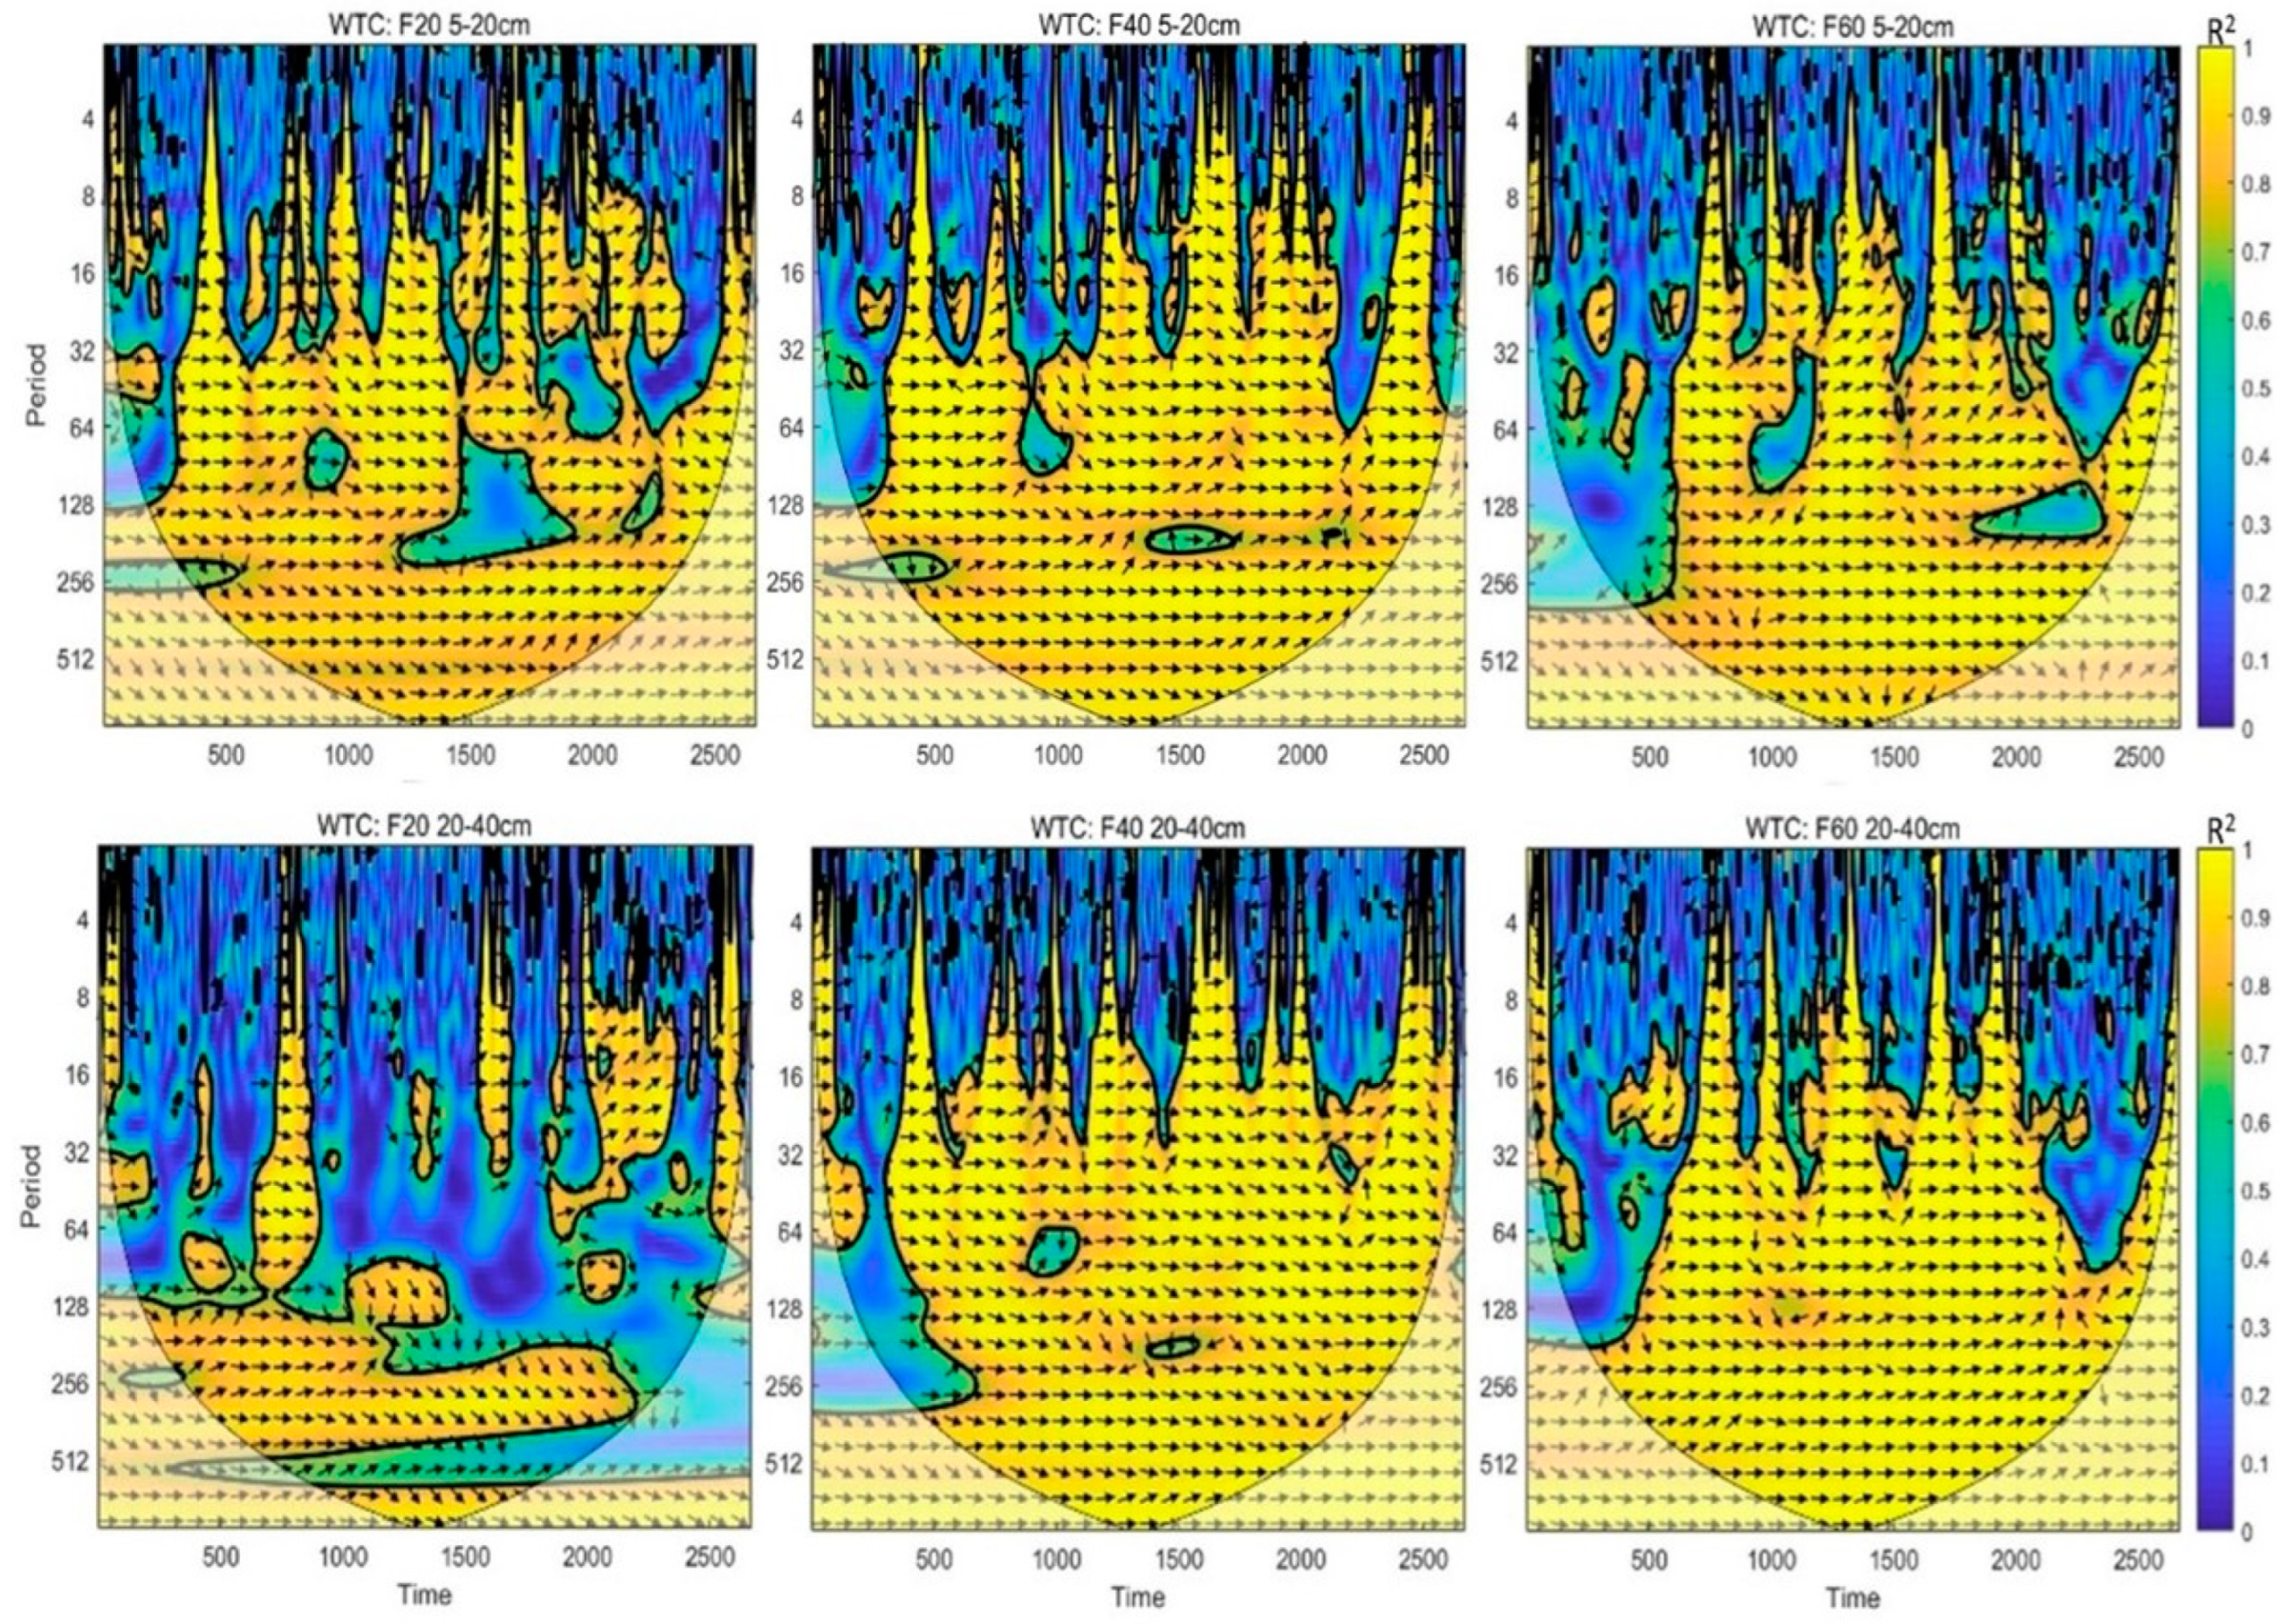
The soil moisture content from two adjacent depths within each treatment’s vertical profile was analyzed using wavelet coherence analysis (as shown in Figure 3). In the F20 treatment, the phase arrow consistently pointed to the lower right, indicating that changes in the upper soil layers preceded the changes in the lower soil moisture. For the F40 treatment, the phase arrow predominantly pointed to the right at the 5–20 cm depth, while it shifted to the lower right at the 20–40 cm depth. Similarly, in the F60 treatment, the phase arrow pointed to the right across the entire 0–50 cm soil layer, suggesting that changes in upper soil moisture occurred synchronously with those in lower soil moisture. In summary, the correlation between vertical soil moisture in the F40 and F60 treatments was stronger than in the F20 treatment.
Differences in the time domain changes in the correlation between soil moisture across different vertical depth combinations were observed. The coherence of each treatment was notably better from August to early October. This trend can be attributed to limited precipitation and high temperatures in July temperatures, which resulted in water infiltration occurring primarily in the shallow soil layers. In contrast, heavy and sustained precipitation from August to early October facilitated frequent moisture exchange, thereby enhancing continuity. This indicates that the coherence between vertical soil moisture profiles is significantly influenced by precipitation.

3.3.2. Variation in Vertical Exchange of Soil Moisture

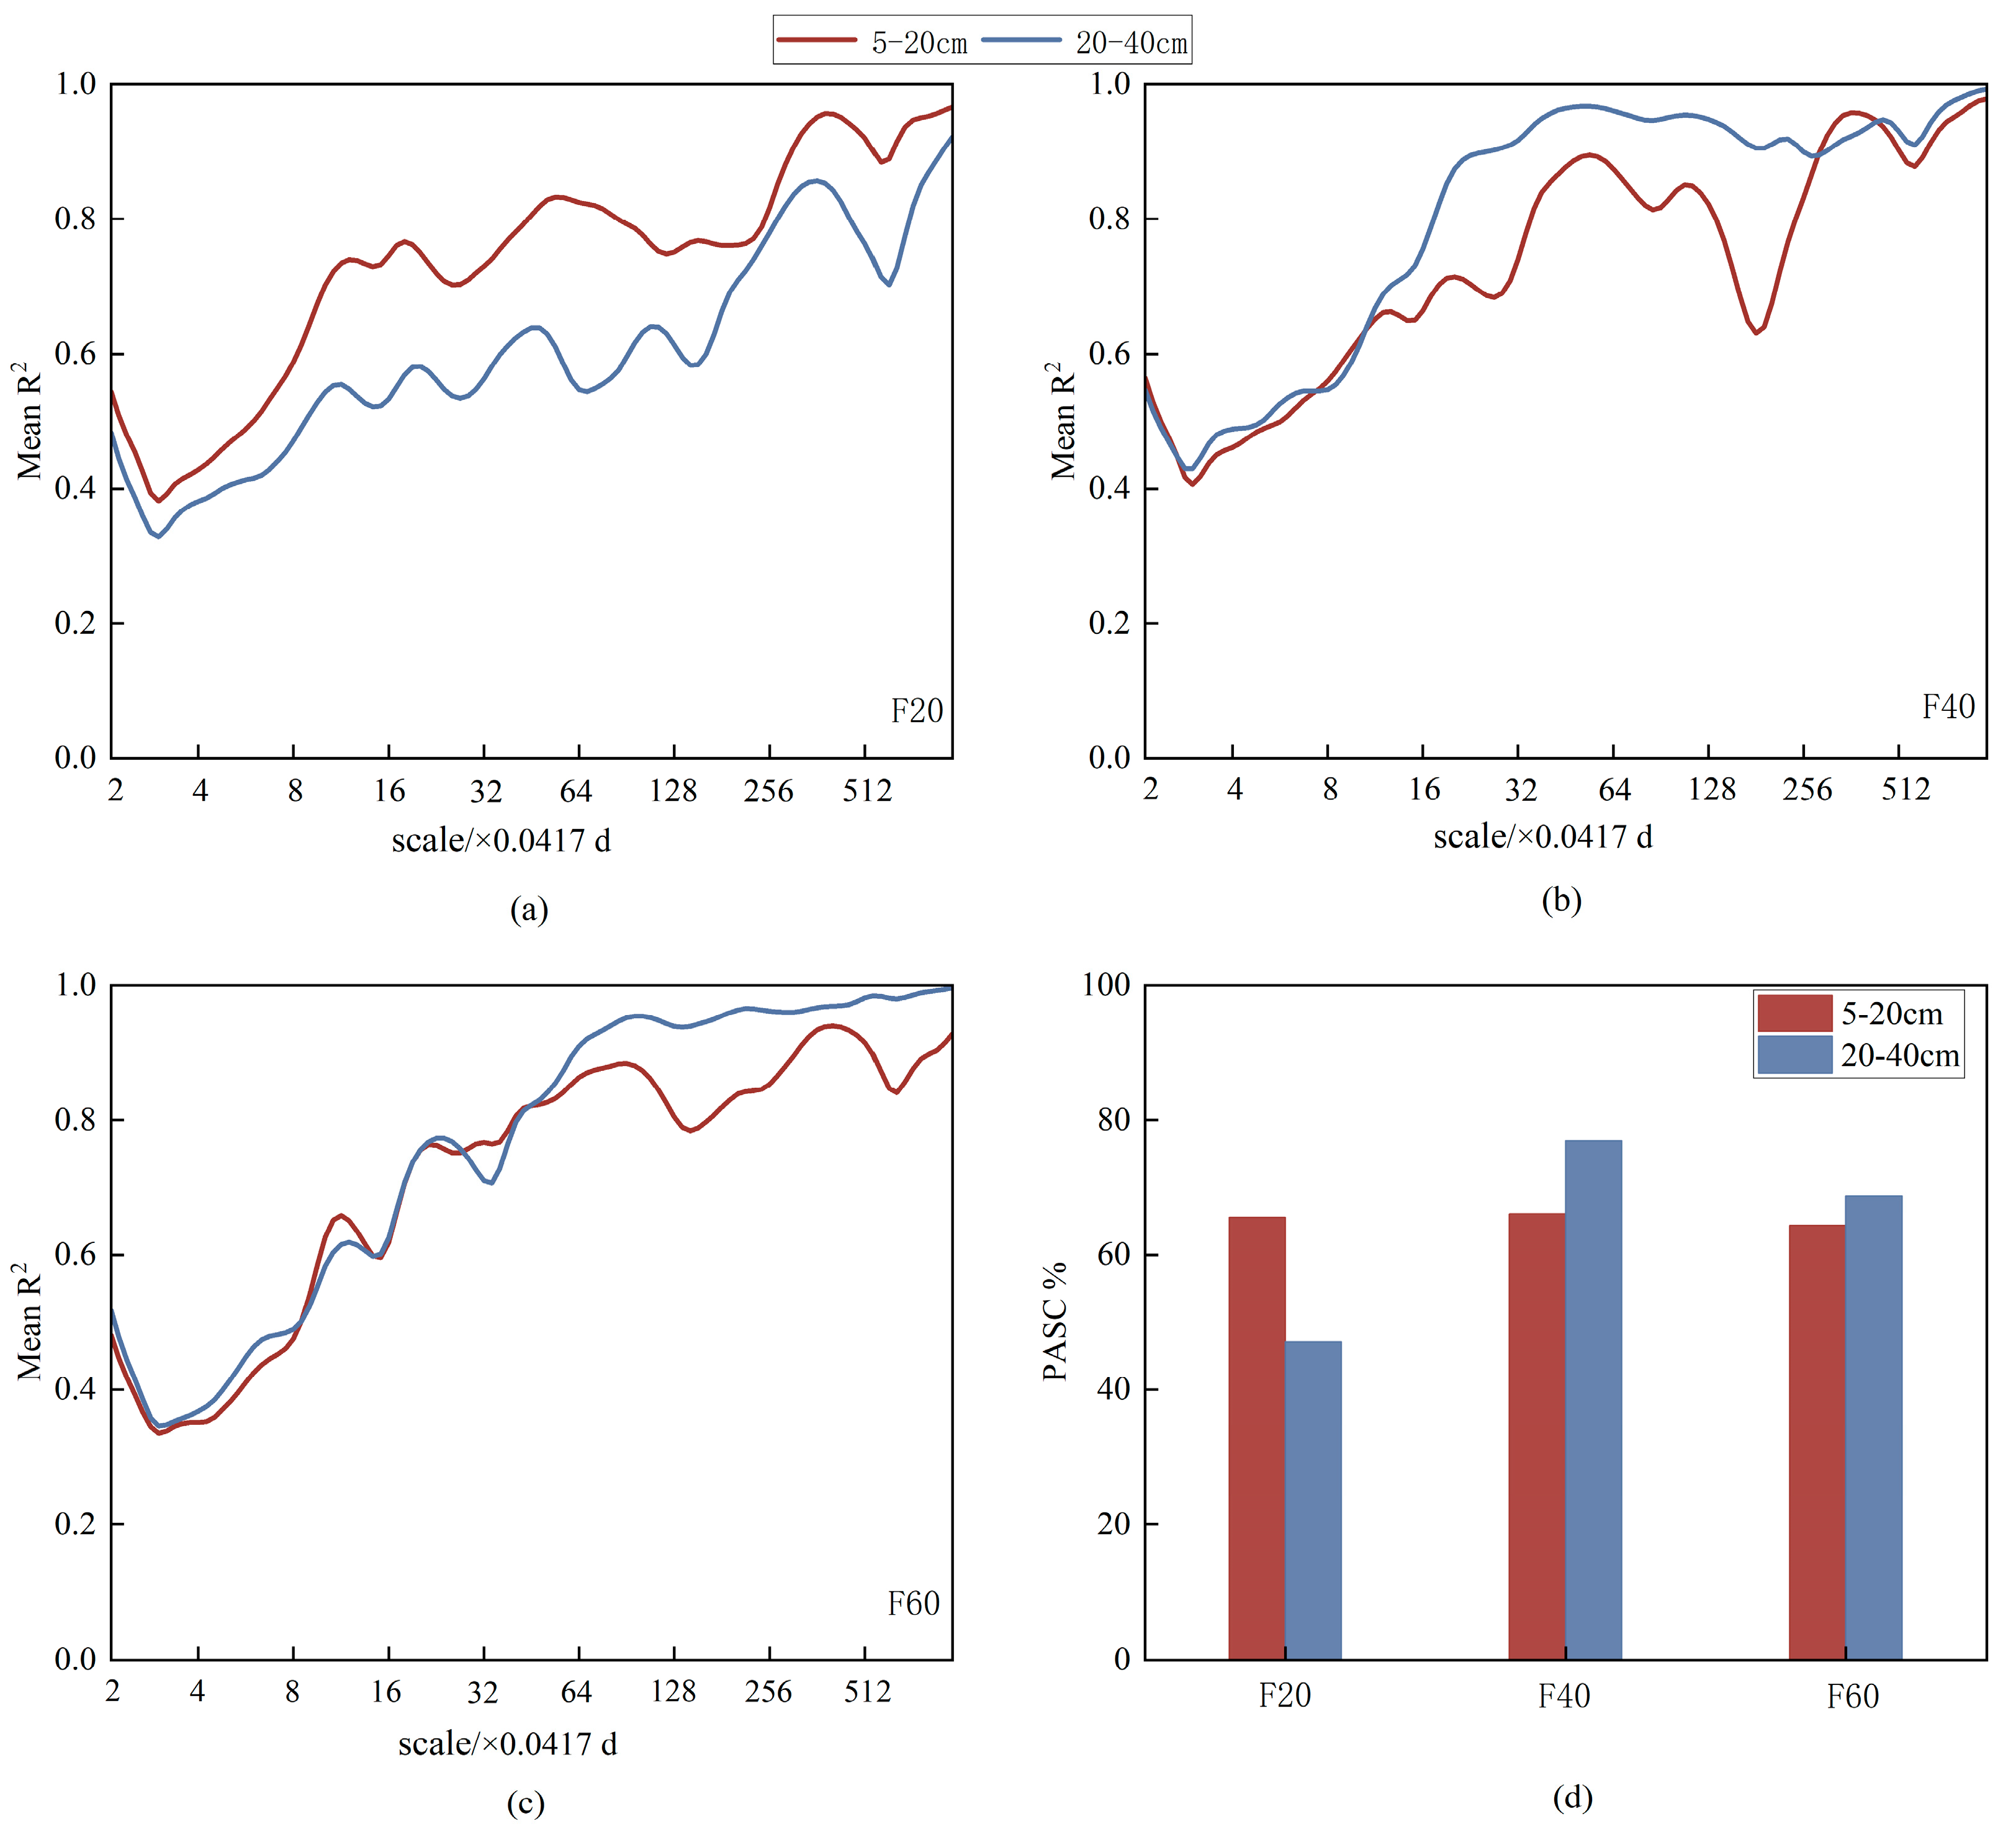
The mean correlation coefficient (MR2) for the 5–20 cm depth consistently remained higher than that for the 20–40 cm depth in the F20 treatment across the entire time scale (Figure 4a–c). However, in the F40 treatment, the MR2 for the 20–40 cm depth exceeded that for the 5–20 cm depth within the scale range of 16 × 0.0417 to 256 × 0.0417. The F60 treatment demonstrated a greater MR2 at the 5–20 cm depth compared to the 20–40 cm depth within the scale of 64 × 0.0417 to 1024 × 0.0417, indicating more frequent moisture exchange in these two treatments. The percent area of significant coherence (PASC) quantifies the level of correlation between soil moisture content sequences in two adjacent soil layers (Figure 4d). For the three treatments, the PASC ranged from 64.39% to 66.55% within the 5–20 cm depth, suggesting that different tillage depths similarly enhanced the exchange transformation between these layers. However, in the 20–40 cm depth, the PASC values for the F20 treatment decreased by 29.85% and 21.61% compared to the F40 and F60 treatments, respectively. The PASC value for the F40 treatment was 8.23% higher than that for the F60 treatment.

3.4. Response of Soil Moisture Content to Different Precipitation

3.4.1. Response of Soil Moisture to Light Rain

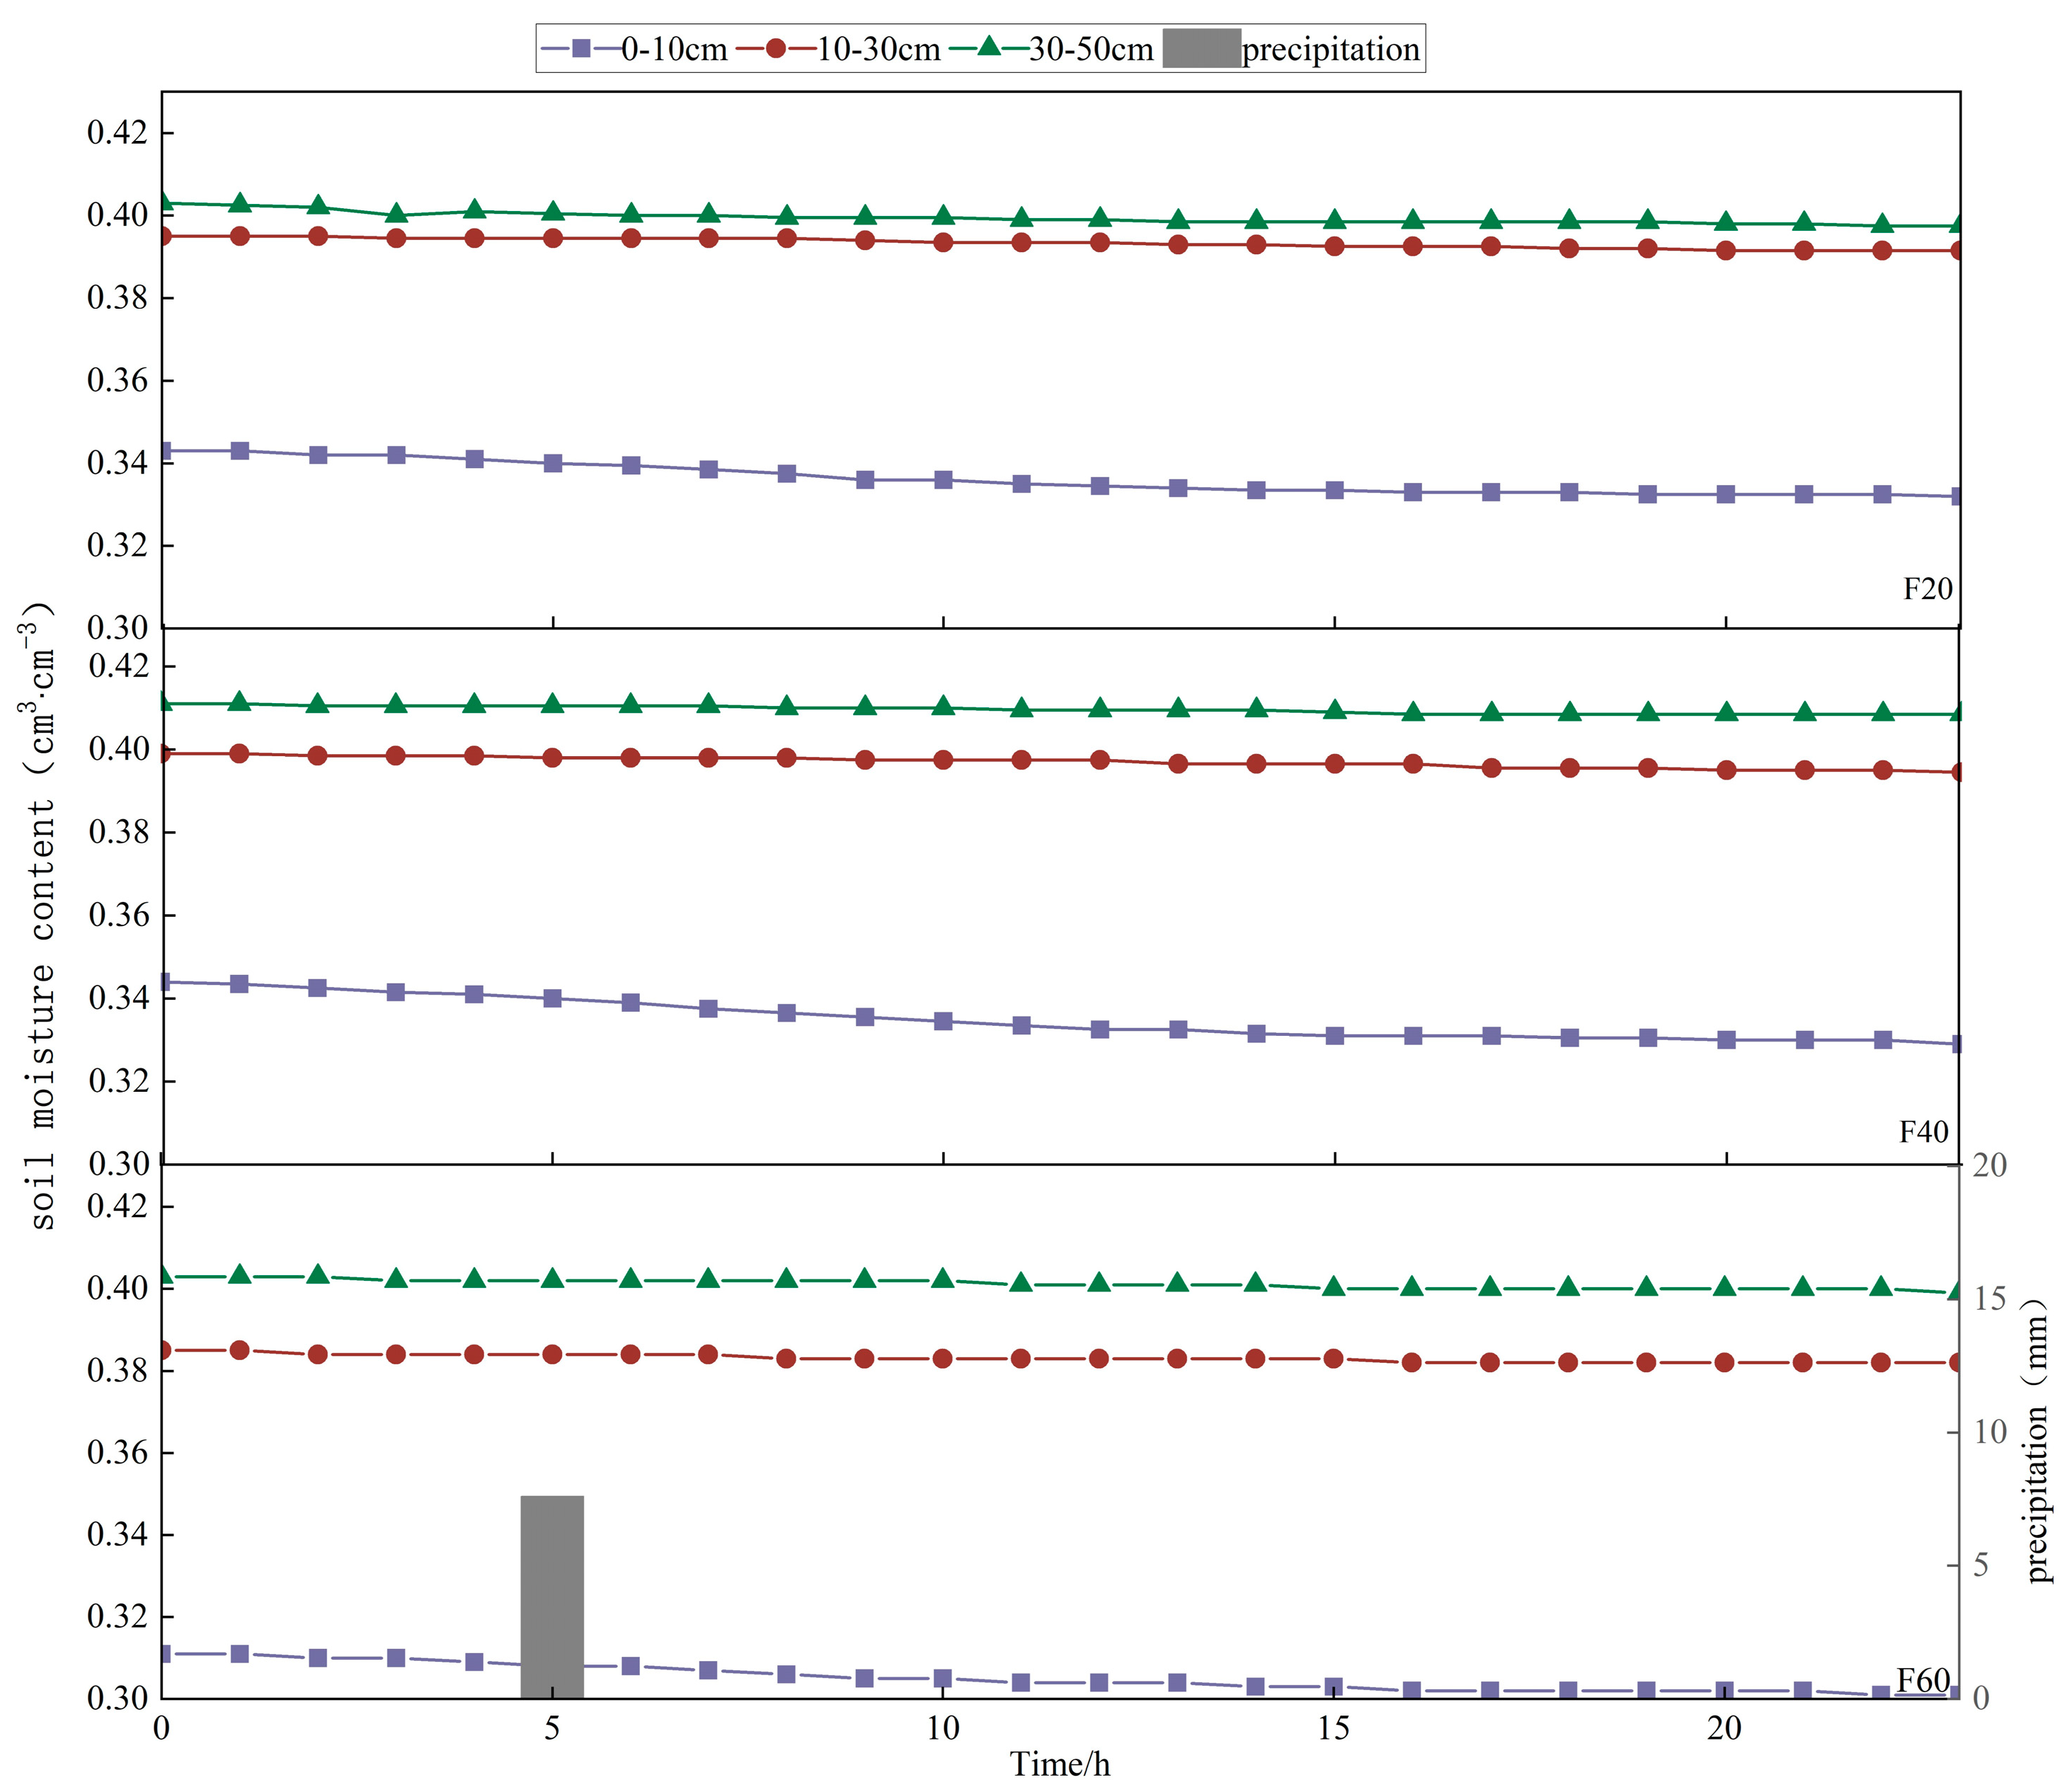
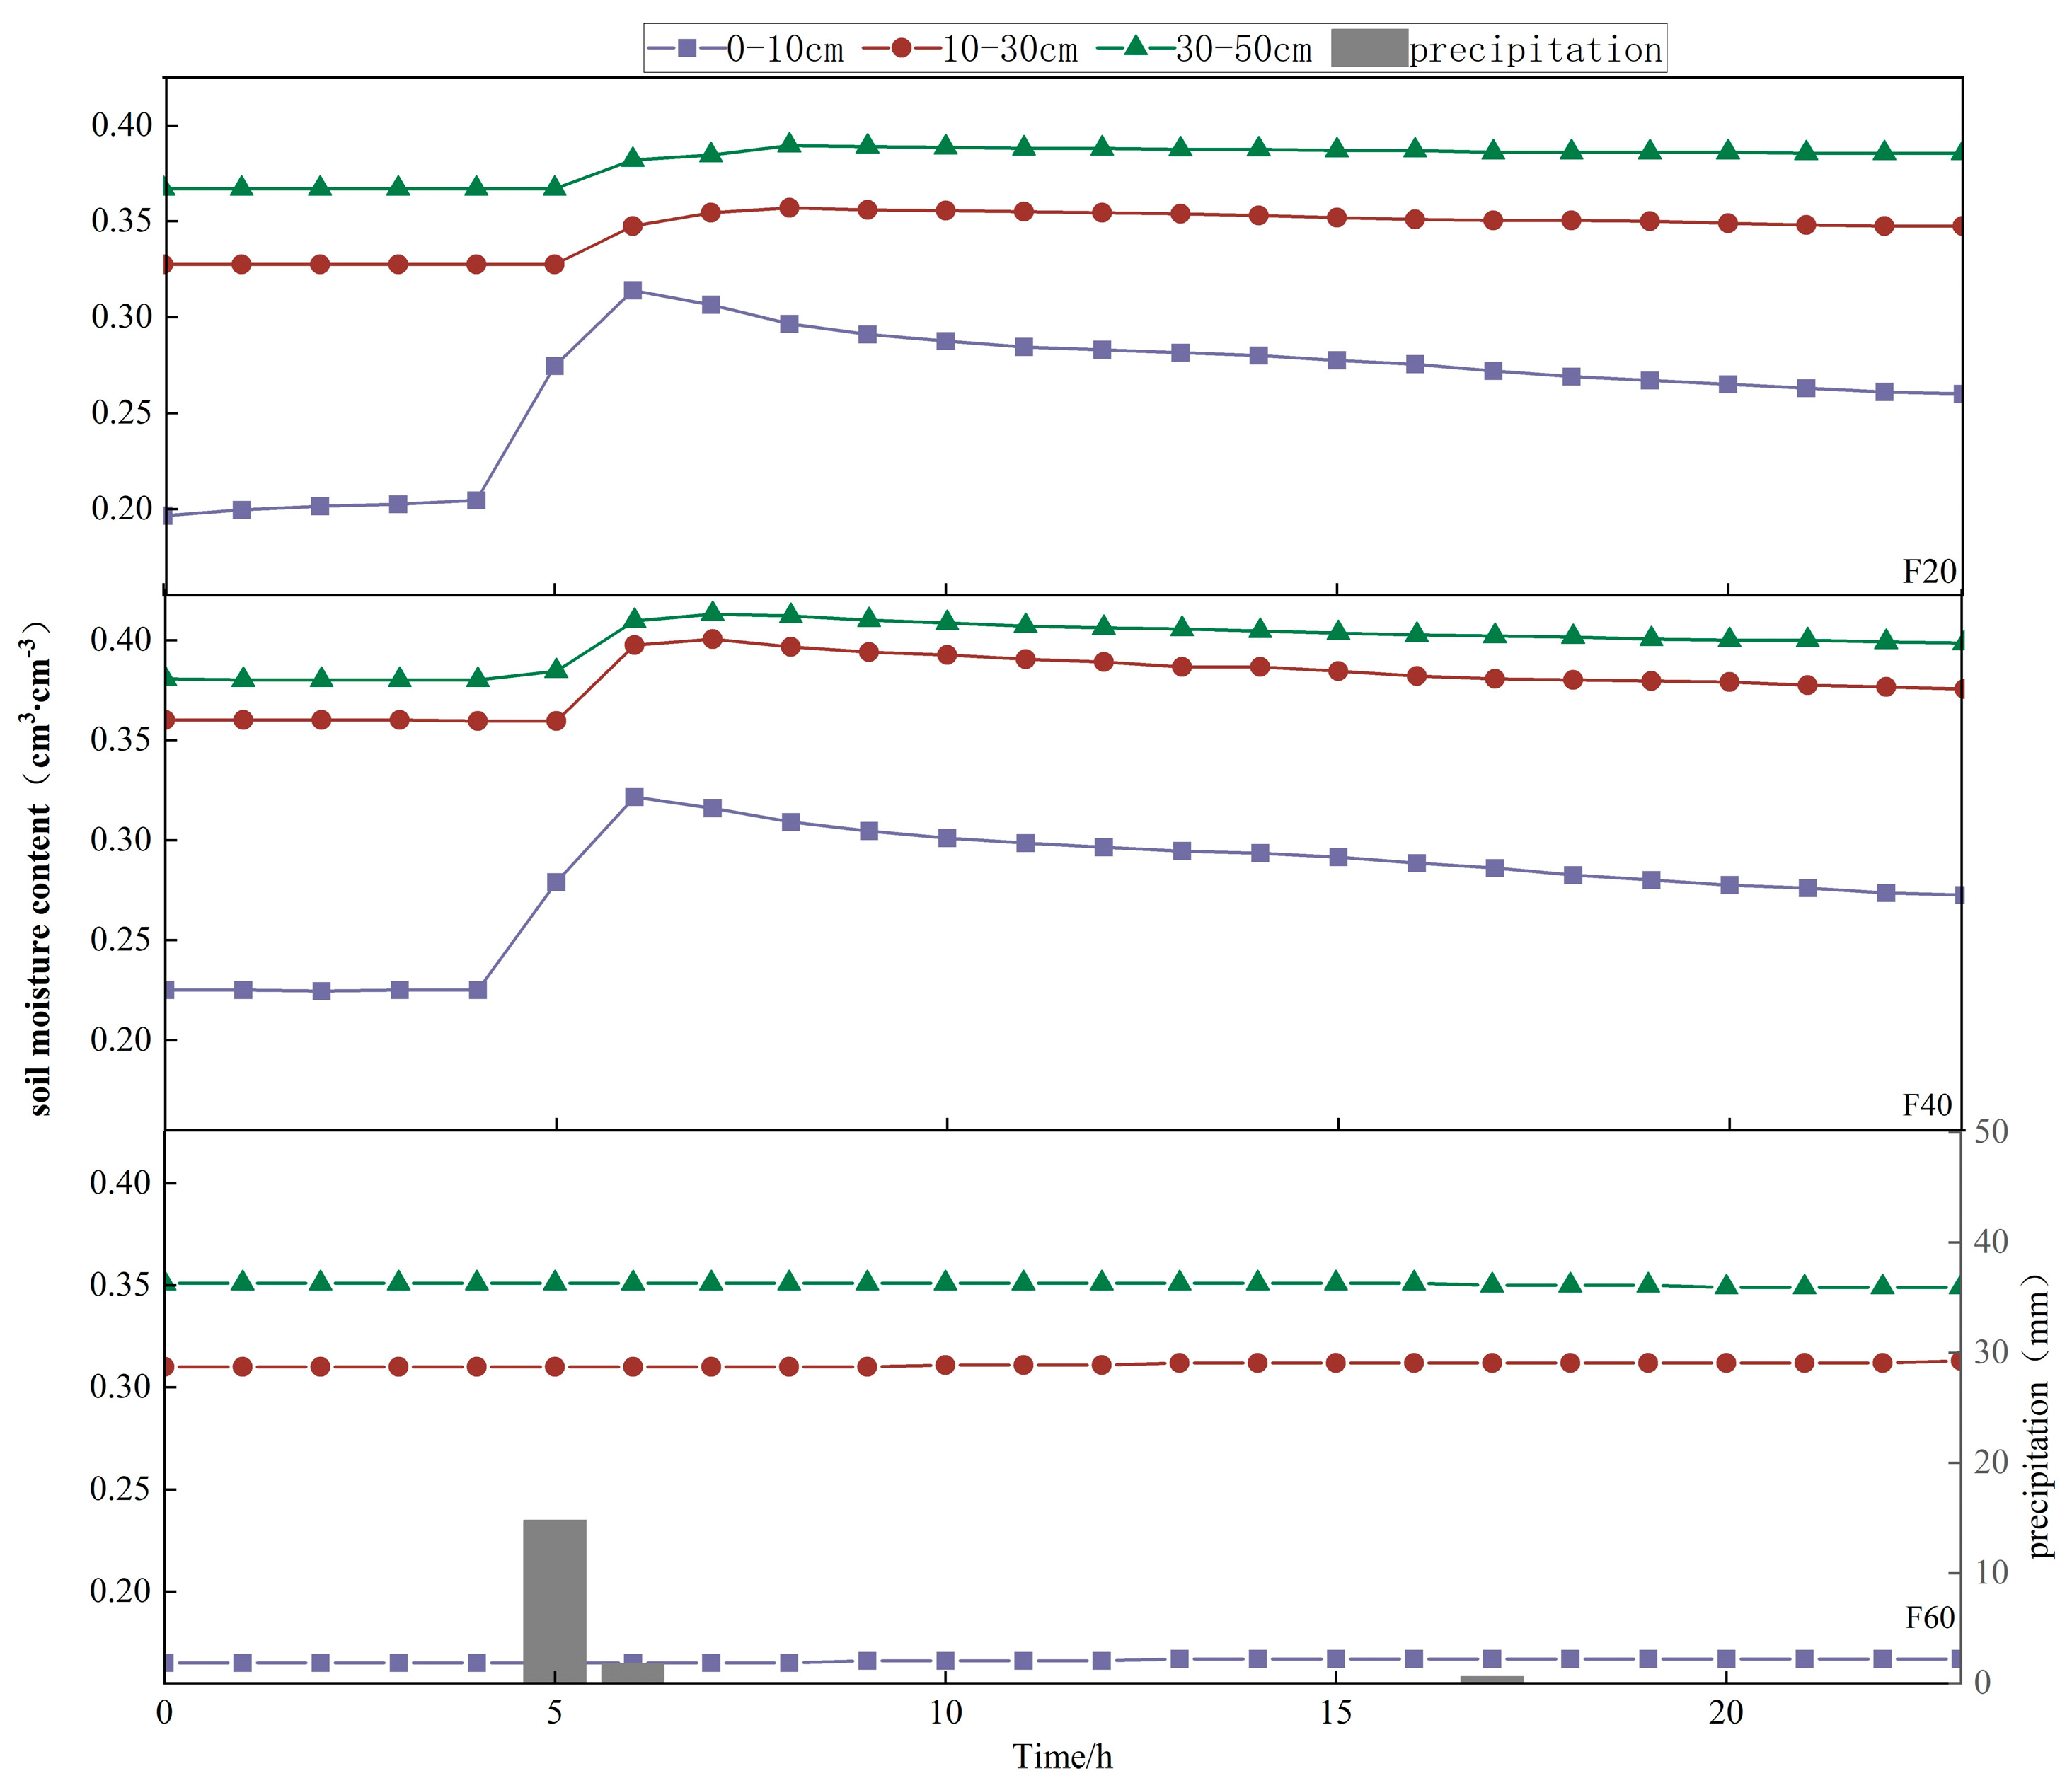
The small precipitation event occurred on July 8, resulting in a total precipitation of 7.6 mm within 1 h. During this event, the soil moisture across all layers in the three treatments exhibited minimal fluctuations in response to the precipitation (Figure 5).

3.4.2. Response of Soil Moisture to Moderate Rain

A moderate rain event on August 22 resulted in total precipitation of 17.2 mm, peaking at a maximum intensity of 14.8 mm h−1. Before this event, the study area primarily experienced rainfall events less than 10 mm. During the August rain, no significant change in soil moisture content was observed across all soil layers in the F60 treatment (Figure 6). In contrast, the F20 and F40 treatments responded to the peak intensity of 14.8 mm h−1. Specifically, the 0–10 cm layers in the F20 and F40 treatments showed an earlier or simultaneous response compared to deeper layers, leading to a rapid increase in soil moisture. The increase in soil moisture content ranged from 10.95% to 3.05% for the F20 treatment and from 9.65% to 3.3% for the F40 treatment. Consequently, the F20 and F40 treatments demonstrated superior infiltration recharge effects compared to the F60 treatment during moderate rain events.

3.4.3. Response of Soil Moisture to Heavy Rain

During the heavy rain event on September 2, the total precipitation reached 49.8 mm, with a maximum instantaneous intensity of 39.1 mm h−1. The F40 treatment in the 0–10 cm soil layer achieved peak soil moisture within the shortest 1 h (Figure 7). In contrast, the F20 and F60 treatments experienced delays of 1 h and 12 h, respectively, compared to the F40 treatment. Notably, the soil moisture content in the 0–10 cm layer of the F20 treatment increased by 3.05% relative to the F40 treatment and by 14% compared to the F60 treatment. The F60 treatment showed minimal soil moisture replenishment effect in the 10–30 cm layer, while the replenishment time and amount for the F20 and F40 treatments were similar. Additionally, no significant change in soil moisture content was observed in the 30–50 cm layer for the F60 treatment. Conversely, the F20 treatment reached its peak soil moisture value at 3 h, which was 1 h later than the F40 treatment.

3.4.4. Response of Soil Moisture to Torrential Rain

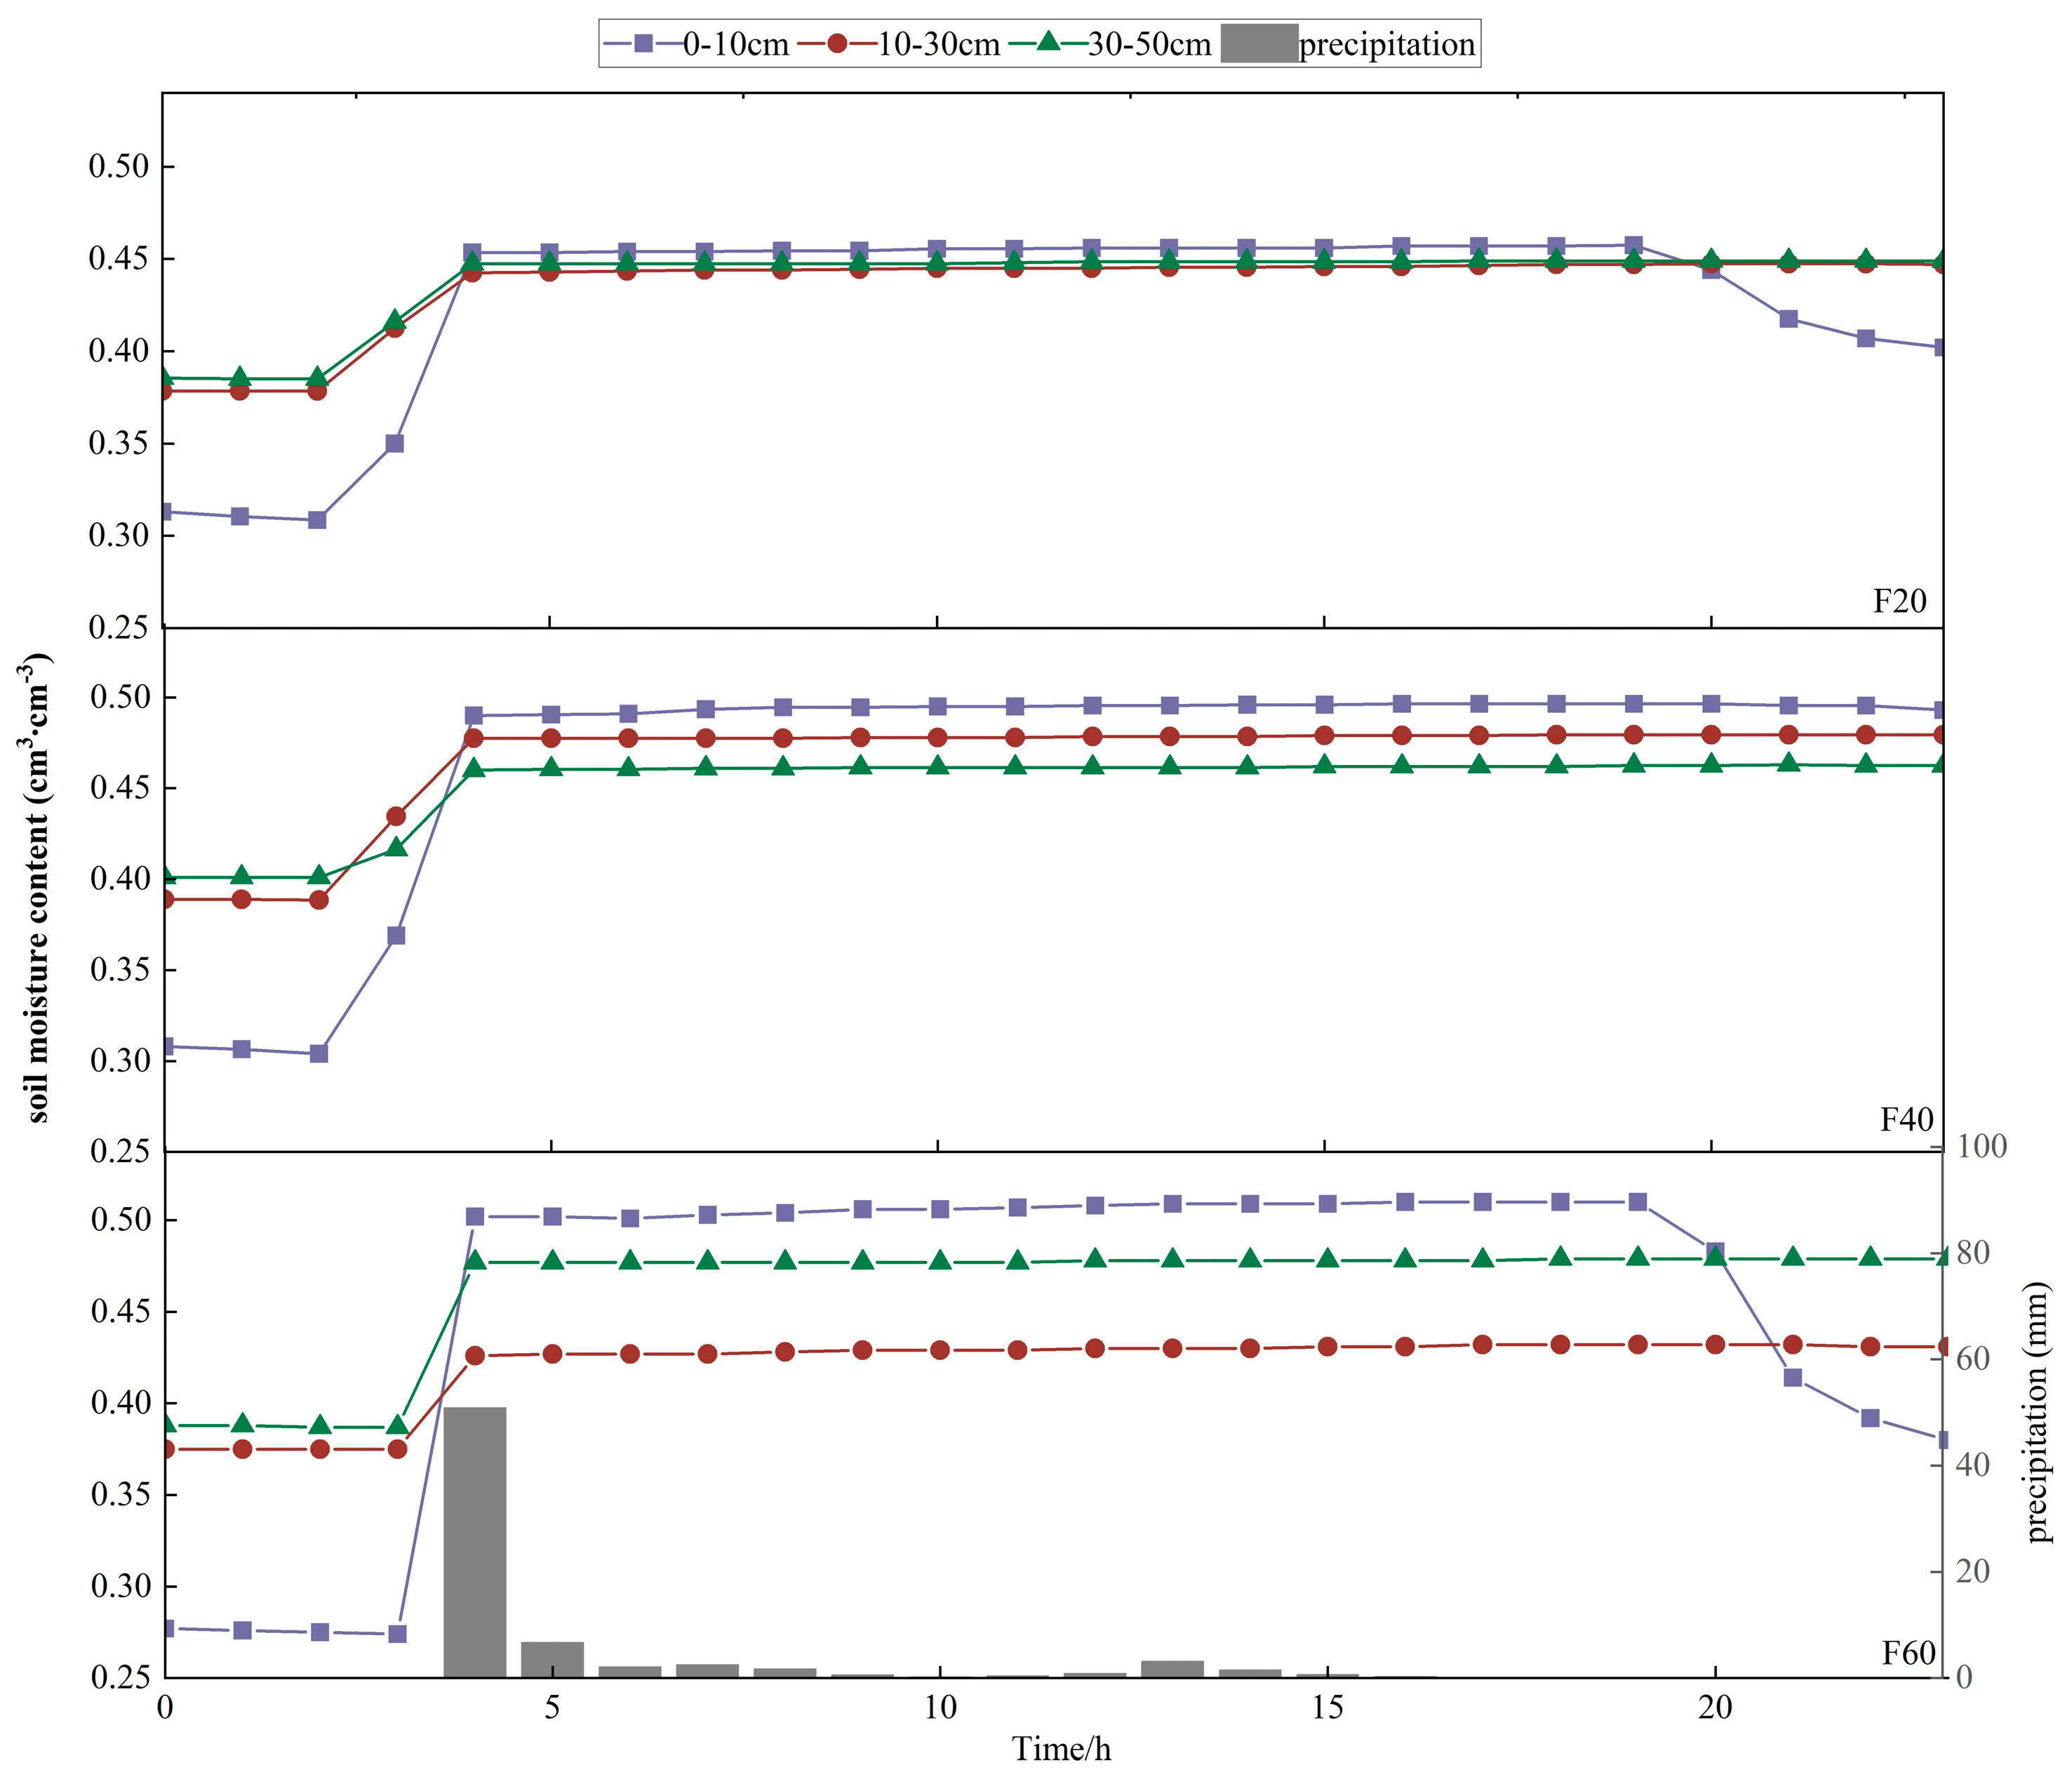
During the torrential rain event on July 5, the total cumulative precipitation reached 71.8 mm over 13 h, with a maximum instantaneous intensity of 50.9 mm h−1. Prior to this event, the initial soil moisture content was elevated due to moderate to heavy rainfall in the study area. All soil layers across the three treatments responded rapidly to the precipitation, although the response rate of the F60 treatment lagged slightly behind that of the F20 and F40 treatments (Figure 8). Notably, the F60 treatment experienced the largest overall increase in soil moisture content across all soil layers during this rain event. The increase in soil moisture content for the F20 treatment was slightly lower than that of the F40 treatment in each layer. Additionally, 4 h after the precipitation ended, the recession rate of soil moisture in the 0–10 cm layer was lower for the F40 treatment compared to the F20 and F60 treatments.

3.5. Response of Soil Moisture Replenishment Characteristics to Precipitation

As shown in Table 4, all soil layers across the three treatments effectively replenished water during heavy and torrential rain events. The mean SMR for the F40 treatment was 0.94% and 11.02% higher than that of the F20 and F60 treatments, respectively. During heavy rain, the F20 and F40 treatments achieved the highest replenishment rates, while the F60 treatment excelled during torrential rain. Moreover, the F40 treatment exhibited the highest mean effective soil moisture replenishment efficiency at 45.36%, in contrast to the F60 treatment, which recorded the lowest at 20.74%. In conclusion, the F40 treatment, with its superior SMR and replenishment efficiency, demonstrated a more favorable response to precipitation than the F20 and F60 treatments.

3.6. Correlation Analysis of Soil Parameters

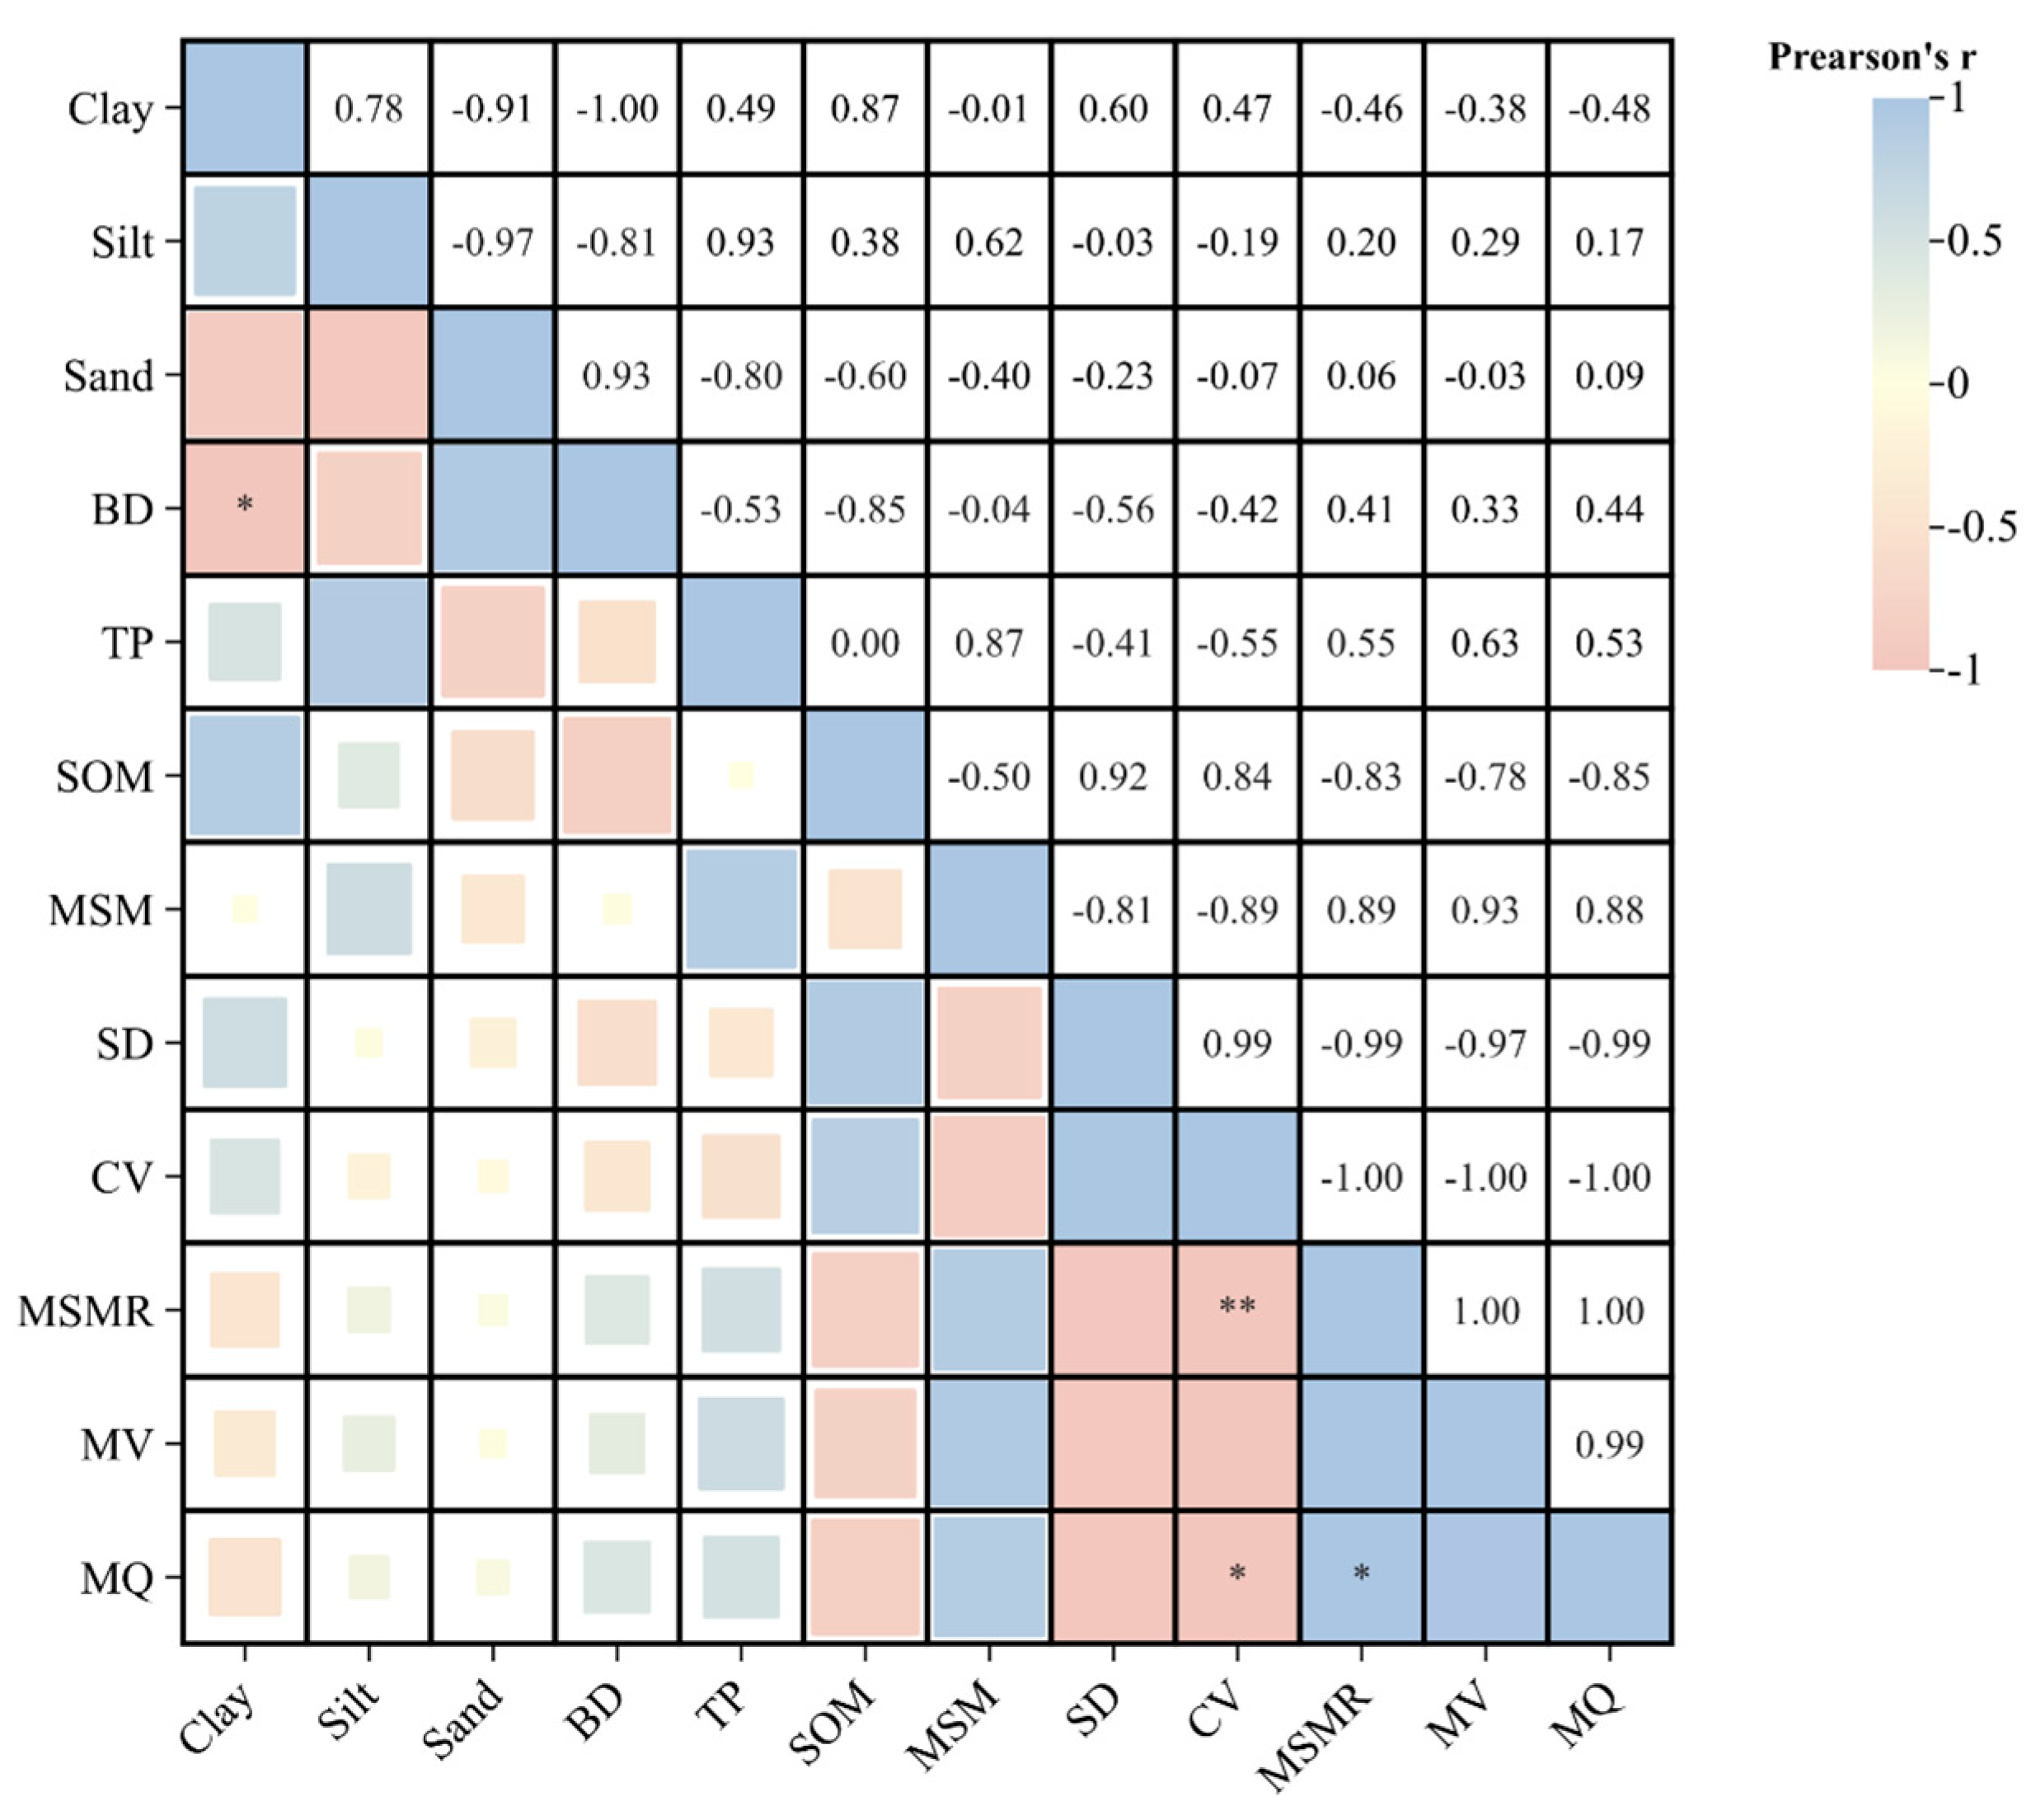
Figure 9 displays the Pearson correlation between the 12 parameters. Notably, clay exhibited a significant negative correlation with bulk density (p < 0.05). The coefficient of variation was highly significantly negatively correlated with soil moisture replenishment (p < 0.01) and significantly negatively correlated with soil moisture replenishment efficiency (p < 0.05). The mean soil moisture exhibited a negative correlation with the coefficient of variation. Soil organic matter displayed a positive correlation with the standard deviation.

4. Discussion

The changes in texture were mainly influenced by the region’s soil parent material, which may take a long time to manifest by different cultivations [41,42]. It was supposed to result in no significant differences in texture for our research. The significant difference in total porosity in the F40 treatment may suggest that this smash-tillage depth could bring the most pronounced tillage effect on the total porosity. The shallow tillage depth likely resulted in less disturbance and limited microbial activity in the deeper soil layers, which, in turn, slowed organic matter accumulation. Consequently, the F20 treatment exhibited the lowest organic matter content in the 30–50 cm soil layer. Research indicates that increased organic matter can bind soil particles, fostering conditions conducive to soil organisms, thereby enhancing pore space and boosting moisture retention [43]. The higher porosity facilitates improved soil water conductivity [44]. As a result, the F40 treatments showed a greater tillage effect.
Consistent with the findings of Wu et al. [45], the magnitude of soil moisture fluctuations in the three treatments decreased as the soil depth increased. The decrease in soil moisture content from mid-July to early August can be attributed to the lack of precipitation and high temperatures during this period, which rapidly reduced the moisture content in the surface soil. Studies have shown that temperature and soil evaporation have less impact on deep soil moisture content [46,47]. However, in this study, deep soil moisture was crucial for supplying moisture to support sugarcane growth, which led to a decrease in soil moisture content in the 0–50 cm layer during this period. Certain reports suggested that the higher CV value for soil moisture indicates a larger degree of fluctuation [48,49]. In comparison to the other treatments, the F40 treatment exhibited the lower CV below a 10 cm depth, indicating that its soil moisture is less susceptible to fluctuations induced by external factors, thereby maintaining a relatively stable state.
The F20 treatment had the least PASC at the 20–40 cm depth compared to the other treatments. Several studies demonstrated that an increase in tillage depth was beneficial for the further optimization of the soil structure, resulting in an increase in saturated hydraulic conductivity and aeration [50,51]. Wuest [52] also reported that the soil moisture storage capacity could be improved by increasing the depth of tillage. Therefore, the F40 and F60 treatments have higher PASC values at a depth of 20–40 cm and facilitate the exchange and transformation of soil moisture. The F40 treatment exhibited the highest PASC across the entire soil layer as a result of its highest initial moisture content. This may be due to the high initial soil moisture content or precipitation intensity exceeding the soil’s infiltration capacity, which could alter the moisture infiltration pathways and potentially activate preferential flow pathways [53]. This induced an increased exchange of soil moisture between the upper and lower layers, which was most pronounced in the F40 treatment.
The three treatments in this investigation did not exhibit a response to precipitation during the light rain event. This limited response can be attributed to the short duration and low intensity of the precipitation, which were insufficient to replenish soil moisture due to heightened evapotranspiration driven by elevated temperatures [19,54]. In contrast to the other treatments, the soil moisture content of the F60 treatment was insensitive to precipitation during moderate and heavy rain events. The soil layer in the F60 treatment was not effectively penetrated by precipitation due to the brief duration of precipitation events. The soil moisture content in all three treatments responded rapidly during torrential rain events. This was because the soil could still store moisture even after it had been absorbed by plants and lost to evaporation during periods of high precipitation intensity accompanied by prolonged rainfall [15]. Schwinning and Sala [55] found that large precipitation events can penetrate deeper into the soil, allowing the moisture to persist for several days.
This study revealed differences in the soil moisture content at various depths under the same precipitation conditions. The most significant alteration in soil moisture content and the earliest response to precipitation were observed in the 0–10 cm soil layer. This difference may be explained by the fact that precipitation has a more significant impact on the moisture content of the surface soil [56]. Nevertheless, the magnitude of the change in soil moisture content decreased as the depth of the soil increased, which required a higher intensity of precipitation to elicit a response [57]. In comparison to the F20 and F60 treatments, the F40 treatment exhibited a delayed rate of moisture recession in all layers and a better synchronization of soil moisture with precipitation. The principal reason was that the exchange of vertical soil water was more pronounced in the F40 treatment (Figure 3). The F40 treatment’s soil moisture could infiltrate rapidly during precipitation, resulting in a noticeable soil moisture process across all layers in response to precipitation.
Soil moisture replenishment significantly influenced surface vegetation patterns and the overall water cycle [58,59]. Additionally, it served as an invaluable tool for assessing and predicting the drought risk and soil moisture dynamics [60]. Hao et al. [61] discovered a positive correlation between replenishment depth and precipitation. A similar trend was observed across all treatments, where soil moisture replenishment effectively increased with the rising precipitation levels under varying conditions. The higher mean effective soil moisture replenishment in the F40 treatment (Figure 3 and Table 3) may be due to the deeper tillage depth loosening the topsoil and breaking up part of the plow pan, thereby reducing evaporation [62]. Additionally, the F40 treatment had a higher total porosity, creating optimal conditions for moisture-holding [63]. Throughout the study, the shallow plowing depth of the F20 treatment was inadequate for effective moisture retention. Under moderate and heavy rain conditions of a brief duration, the F60 treatment was susceptible to moisture loss and limited soil moisture recharge. In the long term, shallow tillage will impede moisture migration, restrict root growth, and result in a decrease in yield, as determined by Tian et al. [64]. According to certain reports, the 0–30 cm soil layers contained 60–70% of the crop roots [65]. Excessive tillage depth can lead to increased water and nutrient penetration into deeper soil layers, resulting in reduced moisture consumption and nutrient uptake by roots [63]. However, the tillage depth of 40 cm facilitated the easier penetration of precipitation into the soil, which, in turn, improved the replenishment of soil moisture following precipitation. The hypothesis of this study was refuted, indicating that a greater tillage depth does not necessarily lead to a more pronounced soil moisture response to precipitation or a more timely and effective moisture replenishment. Therefore, in the context of sugarcane fields without irrigation in Guangxi, a smash-ridging tillage depth of 40 cm is more suitable for storing soil moisture.

5. Conclusions

Few studies have been done on the effects of different smash-ridging tillage depths on soil moisture in the sugarcane fields of Guangxi. This study focused on the response of soil moisture to precipitation under different smash-ridging tillage depths in sugarcane fields. The F40 treatment exhibited the highest mean soil moisture content and the most outstanding percent area of significant coherence (PASC) in the 0–50 cm soil layer. The F40 treatment demonstrated superior soil moisture replenishment and precipitation synchronization in comparison to the F20 and F60 treatments. Furthermore, the F40 treatment exhibited the most progressive soil moisture depletion in the aftermath of torrential rain, underscoring its exceptional moisture-holding capacity. Therefore, the optimized soil moisture content in sugarcane cultivation was achieved by selecting a 40 cm smash-ridging tillage depth, which effectively enhances the soil’s responsiveness to precipitation and moisture exchange. The primary contribution of this study was the identification of the optimal smash-ridging tillage depth for sugarcane land in Guangxi, thereby ensuring that sugarcane growth is optimized by the optimal soil moisture conditions. However, a long-term smash-ridging tillage experiment is required to further elucidate the impact of a 40 cm tillage depth on sugarcane growth.

Author Contributions

Writing—original draft, Y.Z.; data curation and formal analysis, S.W.; funding acquisition, project administration, and writing—review and editing, L.G.; methodology, B.W.; resources and supervision, J.Z. All authors have read and agreed to the published version of the manuscript.

Funding

This work was funded by the National Natural Science Foundation of China (grant numbers 42067002 and 42267040) and the Science and Technology Planning Project of Guangxi, China (grant number AA20302020-2).

Data Availability Statement

The data presented in this study are available on request from the corresponding author.

Acknowledgments

We are grateful to the Guangxi Engineering Research Center for Comprehensive Treatment of Agricultural Non-point Source Pollution and Modern Industry College of Ecology and Environmental Protection, Guilin University of Technology.

Conflicts of Interest

The authors declare no conflicts of interest.

References

  1. Lin, H.; Bouma, J.; Wilding, L.P.; Richardson, J.L.; Kutílek, M.; Nielsen, D.R. Advances in Hydropedology. In Advances in Agronomy; Elsevier: Amsterdam, The Netherlands, 2005; Volume 85, pp. 1–89. ISBN 978-0-12-000783-7. [Google Scholar]
  2. Peng, F.; Mu, M.; Sun, G. Responses of Soil Moisture to Climate Change Based on Projections by the End of the 21st Century under the High Emission Scenario in the ‘Huang–Huai–Hai Plain’ Region of China. J. Hydro-Environ. Res. 2017, 14, 105–118. [Google Scholar] [CrossRef]
  3. Vereecken, H.; Kamai, T.; Harter, T.; Kasteel, R.; Hopmans, J.; Vanderborght, J. Explaining Soil Moisture Variability as a Function of Mean Soil Moisture: A Stochastic Unsaturated Flow Perspective. Geophys. Res. Lett. 2007, 34, 2007GL031813. [Google Scholar] [CrossRef]
  4. Yang, L.; Chen, L.; Wei, W.; Yu, Y.; Zhang, H. Comparison of Deep Soil Moisture in Two Re-Vegetation Watersheds in Semi-Arid Regions. J. Hydrol. 2014, 513, 314–321. [Google Scholar] [CrossRef]
  5. Zucco, G.; Brocca, L.; Moramarco, T.; Morbidelli, R. Influence of Land Use on Soil Moisture Spatial–Temporal Variability and Monitoring. J. Hydrol. 2014, 516, 193–199. [Google Scholar] [CrossRef]
  6. Daly, E.; Porporato, A. A Review of Soil Moisture Dynamics: From Rainfall Infiltration to Ecosystem Response. Environ. Eng. Sci. 2005, 22, 9–24. [Google Scholar] [CrossRef]
  7. Heathman, G.C.; Larose, M.; Cosh, M.H.; Bindlish, R. Surface and Profile Soil Moisture Spatio-Temporal Analysis during an Excessive Rainfall Period in the Southern Great Plains, USA. Catena 2009, 78, 159–169. [Google Scholar] [CrossRef]
  8. Oki, T.; Kanae, S. Global Hydrological Cycles and World Water Resources. Science 2006, 313, 1068–1072. [Google Scholar] [CrossRef]
  9. Chaney, N.W.; Roundy, J.K.; Herrera-Estrada, J.E.; Wood, E.F. High-Resolution Modeling of the Spatial Heterogeneity of Soil Moisture: Applications in Network Design. Water Resour. Res. 2015, 51, 619–638. [Google Scholar] [CrossRef]
  10. Vereecken, H.; Pachepsky, Y.; Simmer, C.; Rihani, J.; Kunoth, A.; Korres, W.; Graf, A.; Franssen, H.J.-H.; Thiele-Eich, I.; Shao, Y. On the Role of Patterns in Understanding the Functioning of Soil-Vegetation-Atmosphere Systems. J. Hydrol. 2016, 542, 63–86. [Google Scholar] [CrossRef]
  11. He, Z.; Zhao, W.; Liu, H.; Chang, X. The Response of Soil Moisture to Rainfall Event Size in Subalpine Grassland and Meadows in a Semi-Arid Mountain Range: A Case Study in Northwestern China’s Qilian Mountains. J. Hydrol. 2012, 420–421, 183–190. [Google Scholar] [CrossRef]
  12. A, Y.; Wang, G.; Sun, W.; Xue, B.; Kiem, A. Stratification Response of Soil Water Content during Rainfall Events under Different Rainfall Patterns. Hydrol. Process. 2018, 32, 3128–3139. [Google Scholar] [CrossRef]
  13. Reynolds, J.F.; Kemp, P.R.; Ogle, K.; Fernández, R.J. Modifying the ‘Pulse–Reserve’ Paradigm for Deserts of North America: Precipitation Pulses, Soil Water, and Plant Responses. Oecologia 2004, 141, 194–210. [Google Scholar] [CrossRef] [PubMed]
  14. Singh, N.K.; Emanuel, R.E.; McGlynn, B.L.; Miniat, C.F. Soil Moisture Responses to Rainfall: Implications for Runoff Generation. Water Resour. Res. 2021, 57, e2020WR028827. [Google Scholar] [CrossRef]
  15. Thomey, M.L.; Collins, S.L.; Vargas, R.; Johnson, J.E.; Brown, R.F.; Natvig, D.O.; Friggens, M.T. Effect of Precipitation Variability on Net Primary Production and Soil Respiration in a Chihuahuan Desert Grassland: Precipitation variability in desert grassland. Glob. Chang. Biol. 2011, 17, 1505–1515. [Google Scholar] [CrossRef]
  16. Jin, Z.; Guo, L.; Lin, H.; Wang, Y.; Yu, Y.; Chu, G.; Zhang, J. Soil Moisture Response to Rainfall on the Chinese Loess Plateau after a Long-term Vegetation Rehabilitation. Hydrol. Process. 2018, 32, 1738–1754. [Google Scholar] [CrossRef]
  17. Barbeta, A.; Mejía-Chang, M.; Ogaya, R.; Voltas, J.; Dawson, T.E.; Peñuelas, J. The Combined Effects of a Long-term Experimental Drought and an Extreme Drought on the Use of Plant-water Sources in a Mediterranean Forest. Glob. Chang. Biol. 2015, 21, 1213–1225. [Google Scholar] [CrossRef]
  18. Liu, H.; Lei, T.W.; Zhao, J.; Yuan, C.P.; Fan, Y.T.; Qu, L.Q. Effects of Rainfall Intensity and Antecedent Soil Water Content on Soil Infiltrability under Rainfall Conditions Using the Run Off-on-out Method. J. Hydrol. 2011, 396, 24–32. [Google Scholar] [CrossRef]
  19. Heisler-White, J.L.; Knapp, A.K.; Kelly, E.F. Increasing Precipitation Event Size Increases Aboveground Net Primary Productivity in a Semi-Arid Grassland. Oecologia 2008, 158, 129–140. [Google Scholar] [CrossRef]
  20. Berhe, F.T.; Fanta, A.; Alamirew, T.; Melesse, A.M. The Effect of Tillage Practices on Grain Yield and Water Use Efficiency. CATENA 2013, 100, 128–138. [Google Scholar] [CrossRef]
  21. Huang, G.; Chai, Q.; Feng, F.; Yu, A. Effects of Different Tillage Systems on Soil Properties, Root Growth, Grain Yield, and Water Use Efficiency of Winter Wheat (Triticum aestivum L.) in Arid Northwest China. J. Integr. Agric. 2012, 11, 1286–1296. [Google Scholar] [CrossRef]
  22. Šíp, V.; Vavera, R.; Chrpová, J.; Kusá, H.; Růžek, P. Winter Wheat Yield and Quality Related to Tillage Practice, Input Level and Environmental Conditions. Soil Tillage Res. 2013, 132, 77–85. [Google Scholar] [CrossRef]
  23. Sun, M.; Ren, A.; Gao, Z.; Wang, P.; Mo, F.; Xue, L.; Lei, M. Long-Term Evaluation of Tillage Methods in Fallow Season for Soil Water Storage, Wheat Yield and Water Use Efficiency in Semiarid Southeast of the Loess Plateau. Field Crop. Res. 2018, 218, 24–32. [Google Scholar] [CrossRef]
  24. Yankov, P.; Drumeva, M. Effect of Different Types of Soil Tillage for Sunflower on Some Soil Physical Characteristics. Part I: Soil Moisture. Helia 2021, 44, 59–72. [Google Scholar] [CrossRef]
  25. Czyż, E. Effects of Cultivation of Maize (Zea mays L.) in Monoculture and Crop Rotation on Some Soil Physical Properties. Soil Sci. Ann. 2011, 62, 12–24. [Google Scholar]
  26. Kwaad, F.J.P.M.; Van Mulligen, E.J. Cropping System Effects of Maize on Infiltration, Runoff and Erosion on Loess Soils in South-Limbourg (The Netherlands): A Comparison of Two Rainfall Events. Soil Technol. 1991, 4, 281–295. [Google Scholar] [CrossRef]
  27. Aixia, R.; Weifeng, Z.; Anwar, S.; Wen, L.; Pengcheng, D.; Ruixuan, H.; Peiru, W.; Rong, Z.; Jin, T.; Zhiqiang, G.; et al. Effects of Tillage and Seasonal Variation of Rainfall on Soil Water Content and Root Growth Distribution of Winter Wheat under Rainfed Conditions of the Loess Plateau, China. Agric. Water Manag. 2022, 268, 107533. [Google Scholar] [CrossRef]
  28. Yin, J.D.; Zhang, X.C.; Ma, Y.F.; Yu, X.F.; Hou, H.Z.; Wang, H.L.; Fang, Y.J. Vertical Rotary Sub-Soiling under Ridge–Furrow with Plastic Mulching System Increased Crops Yield by Efficient Use of Deep Soil Moisture and Rainfall. Agric. Water Manag. 2022, 271, 107767. [Google Scholar] [CrossRef]
  29. Chen, D.; Huang, Y.; Shen, D.; Zhou, W.; Ao, J.; Jiang, Y.; Huang, Z.; Munir, H.; Fahd, R. Effects of Seaweed Extracts on Promoting Growth and Improving Stress Resistance in Sugarcane. Asian Agric. Res 2019, 11, 69–76. [Google Scholar] [CrossRef]
  30. Wei, B.H.; Gan, X.Q.; Shen, Z.Y.; Ning, X.C.; Lu, L.Y.; Wei, G.P.; Li, Y.Y.; Hu, B.; Liu, B.; Wu, Y.Y. Yield Increase of Smash-Ridging Cultivation of Sugarcane. Sci. Agric. Sin. 2011, 44, 4544–4550. (In Chinese) [Google Scholar] [CrossRef]
  31. Wei, B.H.; Sheng, Z.Y.; Gan, X.Q.; Liu, B.; Lu, L.Y.; Hu, P.; Li, Y.Y.; Wu, Y.Y. Effects of fenlong cultivation on yield and quality of dryland crops. J. Agric. Sci. Technol. 2012, 14, 101–105. (In Chinese) [Google Scholar] [CrossRef]
  32. He, J.Y.; Shi, W.Y.; Liu, F.Y.; Ma, Q.M.; Yang, Y.; Yang, J.H.; Cui, X.W.; Chen, Y.Y. Effects of Fenlong cultivation on soil key physical properties in arid areas. Agric. Res. Arid Areas 2023, 41, 195–201+228. [Google Scholar]
  33. Zhang, J.; Li, F.; Liao, P.; Khan, A.; Hussain, I.; Iqbal, A.; Ali, I.; Wei, B.; Jiang, L. Smash Ridge Tillage Strongly Influence Soil Functionality, Physiology and Rice Yield. Saudi J. Biol. Sci. 2021, 28, 1297–1307. [Google Scholar] [CrossRef] [PubMed]
  34. Pan, L.; Chen, Y.; Xu, Y.; Li, J.; Lu, H. A Model for Soil Moisture Content Prediction Based on the Change in Ultrasonic Velocity and Bulk Density of Tillage Soil under Alternating Drying and Wetting Conditions. Measurement 2022, 189, 110504. [Google Scholar] [CrossRef]
  35. Svensson, D.N.; Messing, I.; Barron, J. An Investigation in Laser Diffraction Soil Particle Size Distribution Analysis to Obtain Compatible Results with Sieve and Pipette Method. Soil Tillage Res. 2022, 223, 105450. [Google Scholar] [CrossRef]
  36. Shamrikova, E.V.; Kondratenok, B.M.; Tumanova, E.A.; Vanchikova, E.V.; Lapteva, E.M.; Zonova, T.V.; Lu-Lyan-Min, E.I.; Davydova, A.P.; Libohova, Z.; Suvannang, N. Transferability between Soil Organic Matter Measurement Methods for Database Harmonization. Geoderma 2022, 412, 115547. [Google Scholar] [CrossRef]
  37. GB/T 28592-2012; National Meteorological Disaster Prevention and Mitigation Standardization Technical Committee. General Administration of Quality Supervision, Inspection and Quarantine of the People’s Republic of China. Standardization Administration of China: Beijing, China, 2012.
  38. Liang, Z.; Chen, X.; Wang, C.; Zhang, Z. Response of Soil Moisture to Four Rainfall Regimes and Tillage Measures under Natural Rainfall in Red Soil Region, Southern China. Water 2024, 16, 1331. [Google Scholar] [CrossRef]
  39. Grinsted, A.; Moore, J.C.; Jevrejeva, S. Application of the Cross Wavelet Transform and Wavelet Coherence to Geophysical Time Series. Nonlin. Process. Geophys. 2004, 11, 561–566. [Google Scholar] [CrossRef]
  40. Chen, H.; Zhang, W.; Wang, K.; Fu, W. Soil Moisture Dynamics under Different Land Uses on Karst Hillslope in Northwest Guangxi, China. Environ. Earth Sci. 2010, 61, 1105–1111. [Google Scholar] [CrossRef]
  41. Gan, L.; Peng, X.H.; Peth, S.; Horn, R. Effects of grazing intensity on soil thermal properties and heat flux under Leymus chinensis and Stipa grandis vegetation in Inner Mongolia, China. Soil Tillage Res. 2012, 118, 147–158. [Google Scholar] [CrossRef]
  42. Hartge, K.; Horn, R. The Physical Analysis of Soils Ferdinand (In German); Enke Verlag: Stuttgart, Germany, 1992. [Google Scholar]
  43. Adamu, G.K.; Aliyu, A.K. Determination of the influence of texture and organic matter on soil water holding capacity in and around Tomas Irrigation Scheme, Dambatta Local Government Kano State. Res. J. Environ. Earth Sci. 2012, 4, 1038–1044. [Google Scholar]
  44. Gao, H.; Yan, C.; Liu, Q.; Li, Z.; Yang, X.; Qi, R. Exploring Optimal Soil Mulching to Enhance Yield and Water Use Efficiency in Maize Cropping in China: A Meta-Analysis. Agric. Water Manag. 2019, 225, 105741. [Google Scholar] [CrossRef]
  45. Wu, W.; Geller, M.A.; Dickinson, R.E. The Response of Soil Moisture to Long-Term Variability of Precipitation. J. Hydrometeorol. 2002, 3, 604–613. [Google Scholar] [CrossRef]
  46. Schwartz, R.C.; Baumhardt, R.L.; Evett, S.R. Tillage Effects on Soil Water Redistribution and Bare Soil Evaporation throughout a Season. Soil Tillage Res. 2010, 110, 221–229. [Google Scholar] [CrossRef]
  47. TerAvest, D.; Carpenter-Boggs, L.; Thierfelder, C.; Reganold, J.P. Crop Production and Soil Water Management in Conservation Agriculture, No-till, and Conventional Tillage Systems in Malawi. Agric. Ecosyst. Environ. 2015, 212, 285–296. [Google Scholar] [CrossRef]
  48. De Queiroz, M.G.; Da Silva, T.G.F.; Zolnier, S.; Jardim, A.M.D.R.F.; De Souza, C.A.A.; Araújo Júnior, G.D.N.; De Morais, J.E.F.; De Souza, L.S.B. Spatial and Temporal Dynamics of Soil Moisture for Surfaces with a Change in Land Use in the Semi-Arid Region of Brazil. CATENA 2020, 188, 104457. [Google Scholar] [CrossRef]
  49. Rötzer, K.; Montzka, C.; Vereecken, H. Spatio-Temporal Variability of Global Soil Moisture Products. J. Hydrol. 2015, 522, 187–202. [Google Scholar] [CrossRef]
  50. Li, Z.; Liu, H.; Wang, T.; Gong, P.; Li, P.; Li, L.; Bai, Z. Deep Vertical Rotary Tillage Depths Improved Soil Conditions and Cotton Yield for Saline Farmland in South Xinjiang. Eur. J. Agron. 2024, 156, 127166. [Google Scholar] [CrossRef]
  51. Shukla, S.K.; Yadav, R.L.; Gupta, R.; Singh, A.K.; Awasthi, S.K.; Gaur, A. Deep Tillage, Soil Moisture Regime, and Optimizing N Nutrition for Sustaining Soil Health and Sugarcane Yield in Subtropical India. Commun. Soil Sci. Plant Anal. 2018, 49, 444–462. [Google Scholar] [CrossRef]
  52. Wuest, S.B. Tillage Depth and Timing Effects on Soil Water Profiles in Two Semiarid Soils. Soil Sci. Soc. Amer. J. 2010, 74, 1701–1711. [Google Scholar] [CrossRef]
  53. Pot, V.; Šimůnek, J.; Benoit, P.; Coquet, Y.; Yra, A.; Martínez-Cordón, M.-J. Impact of Rainfall Intensity on the Transport of Two Herbicides in Undisturbed Grassed Filter Strip Soil Cores. J. Contam. Hydrol. 2005, 81, 63–88. [Google Scholar] [CrossRef]
  54. Albertson, J.D.; Kiely, G. On the Structure of Soil Moisture Time Series in the Context of Land Surface Models. J. Hydrol. 2001, 243, 101–119. [Google Scholar] [CrossRef]
  55. Schwinning, S.; Sala, O.E. Hierarchy of Responses to Resource Pulses in Arid and Semi-Arid Ecosystems. Oecologia 2004, 141, 211–220. [Google Scholar] [CrossRef] [PubMed]
  56. Zhang, Y.-L.; Feng, S.-Y.; Wang, F.-X.; Binley, A. Simulation of Soil Water Flow and Heat Transport in Drip Irrigated Potato Field with Raised Beds and Full Plastic-Film Mulch in a Semiarid Area. Agric. Water Manag. 2018, 209, 178–187. [Google Scholar] [CrossRef]
  57. Knapp, A.K.; Beier, C.; Briske, D.D.; Classen, A.T.; Luo, Y.; Reichstein, M.; Smith, M.D.; Smith, S.D.; Bell, J.E.; Fay, P.A.; et al. Consequences of More Extreme Precipitation Regimes for Terrestrial Ecosystems. BioScience 2008, 58, 811–821. [Google Scholar] [CrossRef]
  58. Jian, S.; Zhao, C.; Fang, S.; Yu, K. Effects of Different Vegetation Restoration on Soil Water Storage and Water Balance in the Chinese Loess Plateau. Agric. For. Meteorol. 2015, 206, 85–96. [Google Scholar] [CrossRef]
  59. Kong, D.; Miao, C.; Wu, J.; Zheng, H.; Wu, S. Time Lag of Vegetation Growth on the Loess Plateau in Response to Climate Factors: Estimation, Distribution, and Influence. Sci. Total Environ. 2020, 744, 140726. [Google Scholar] [CrossRef]
  60. Chen, L.; Zhang, K.; Zhang, Z.; Cao, Z.; Ke, Q. Response of Soil Water Movement to Rainfall under Different Land Uses in Karst Regions. Environ. Earth Sci. 2023, 82, 50. [Google Scholar] [CrossRef]
  61. Hao, Z.; Zheng, J.; Ge, Q.; Guo, X. Relationship between Precipitation and the Infiltration Depth over the Middle and Lower Reaches of the Yellow River and Yangtze-Huaihe River Valley. Prog. Nat. Sci. 2008, 18, 1123–1128. [Google Scholar] [CrossRef]
  62. Jabro, J.D.; Sainju, U.M.; Lenssen, A.W.; Evans, R.G. Tillage effects on dryland soil physical properties in northeastern Montana. Commun. Soil Sci. Plant Anal. 2011, 42, 2179–2187. [Google Scholar] [CrossRef]
  63. Wang, L.; Guo, H.; Wang, L.; Cheng, D. Suitable Tillage Depth Promotes Maize Yields by Changing Soil Physical and Chemical Properties in A 3-Year Experiment in the North China Plain. Sustainability 2022, 14, 15134. [Google Scholar] [CrossRef]
  64. Tian, S.; Wang, Y.; Ning, T.; Dong, X.; Dong, L.; Zheng, D.; Guo, H. Effect of Tillage Method Changes on Soil Organic Carbon Pool in Farmland under Long-Term Rotary Tillage and No Tillage. Trans. Chin. Soc. Agric. Eng. 2016, 32, 98–105. (In Chinese) [Google Scholar]
  65. Yin, W.; Chai, Q.; Guo, Y.; Feng, F.; Zhao, C.; Yu, A.; Hu, F. Analysis of Leaf Area Index Dynamic and Grain Yield Components of Intercropped Wheat and Maize under Straw Mulch Combined with Reduced Tillage in Arid Environments. J. Agric. Sci. 2016, 8, 26. [Google Scholar] [CrossRef]
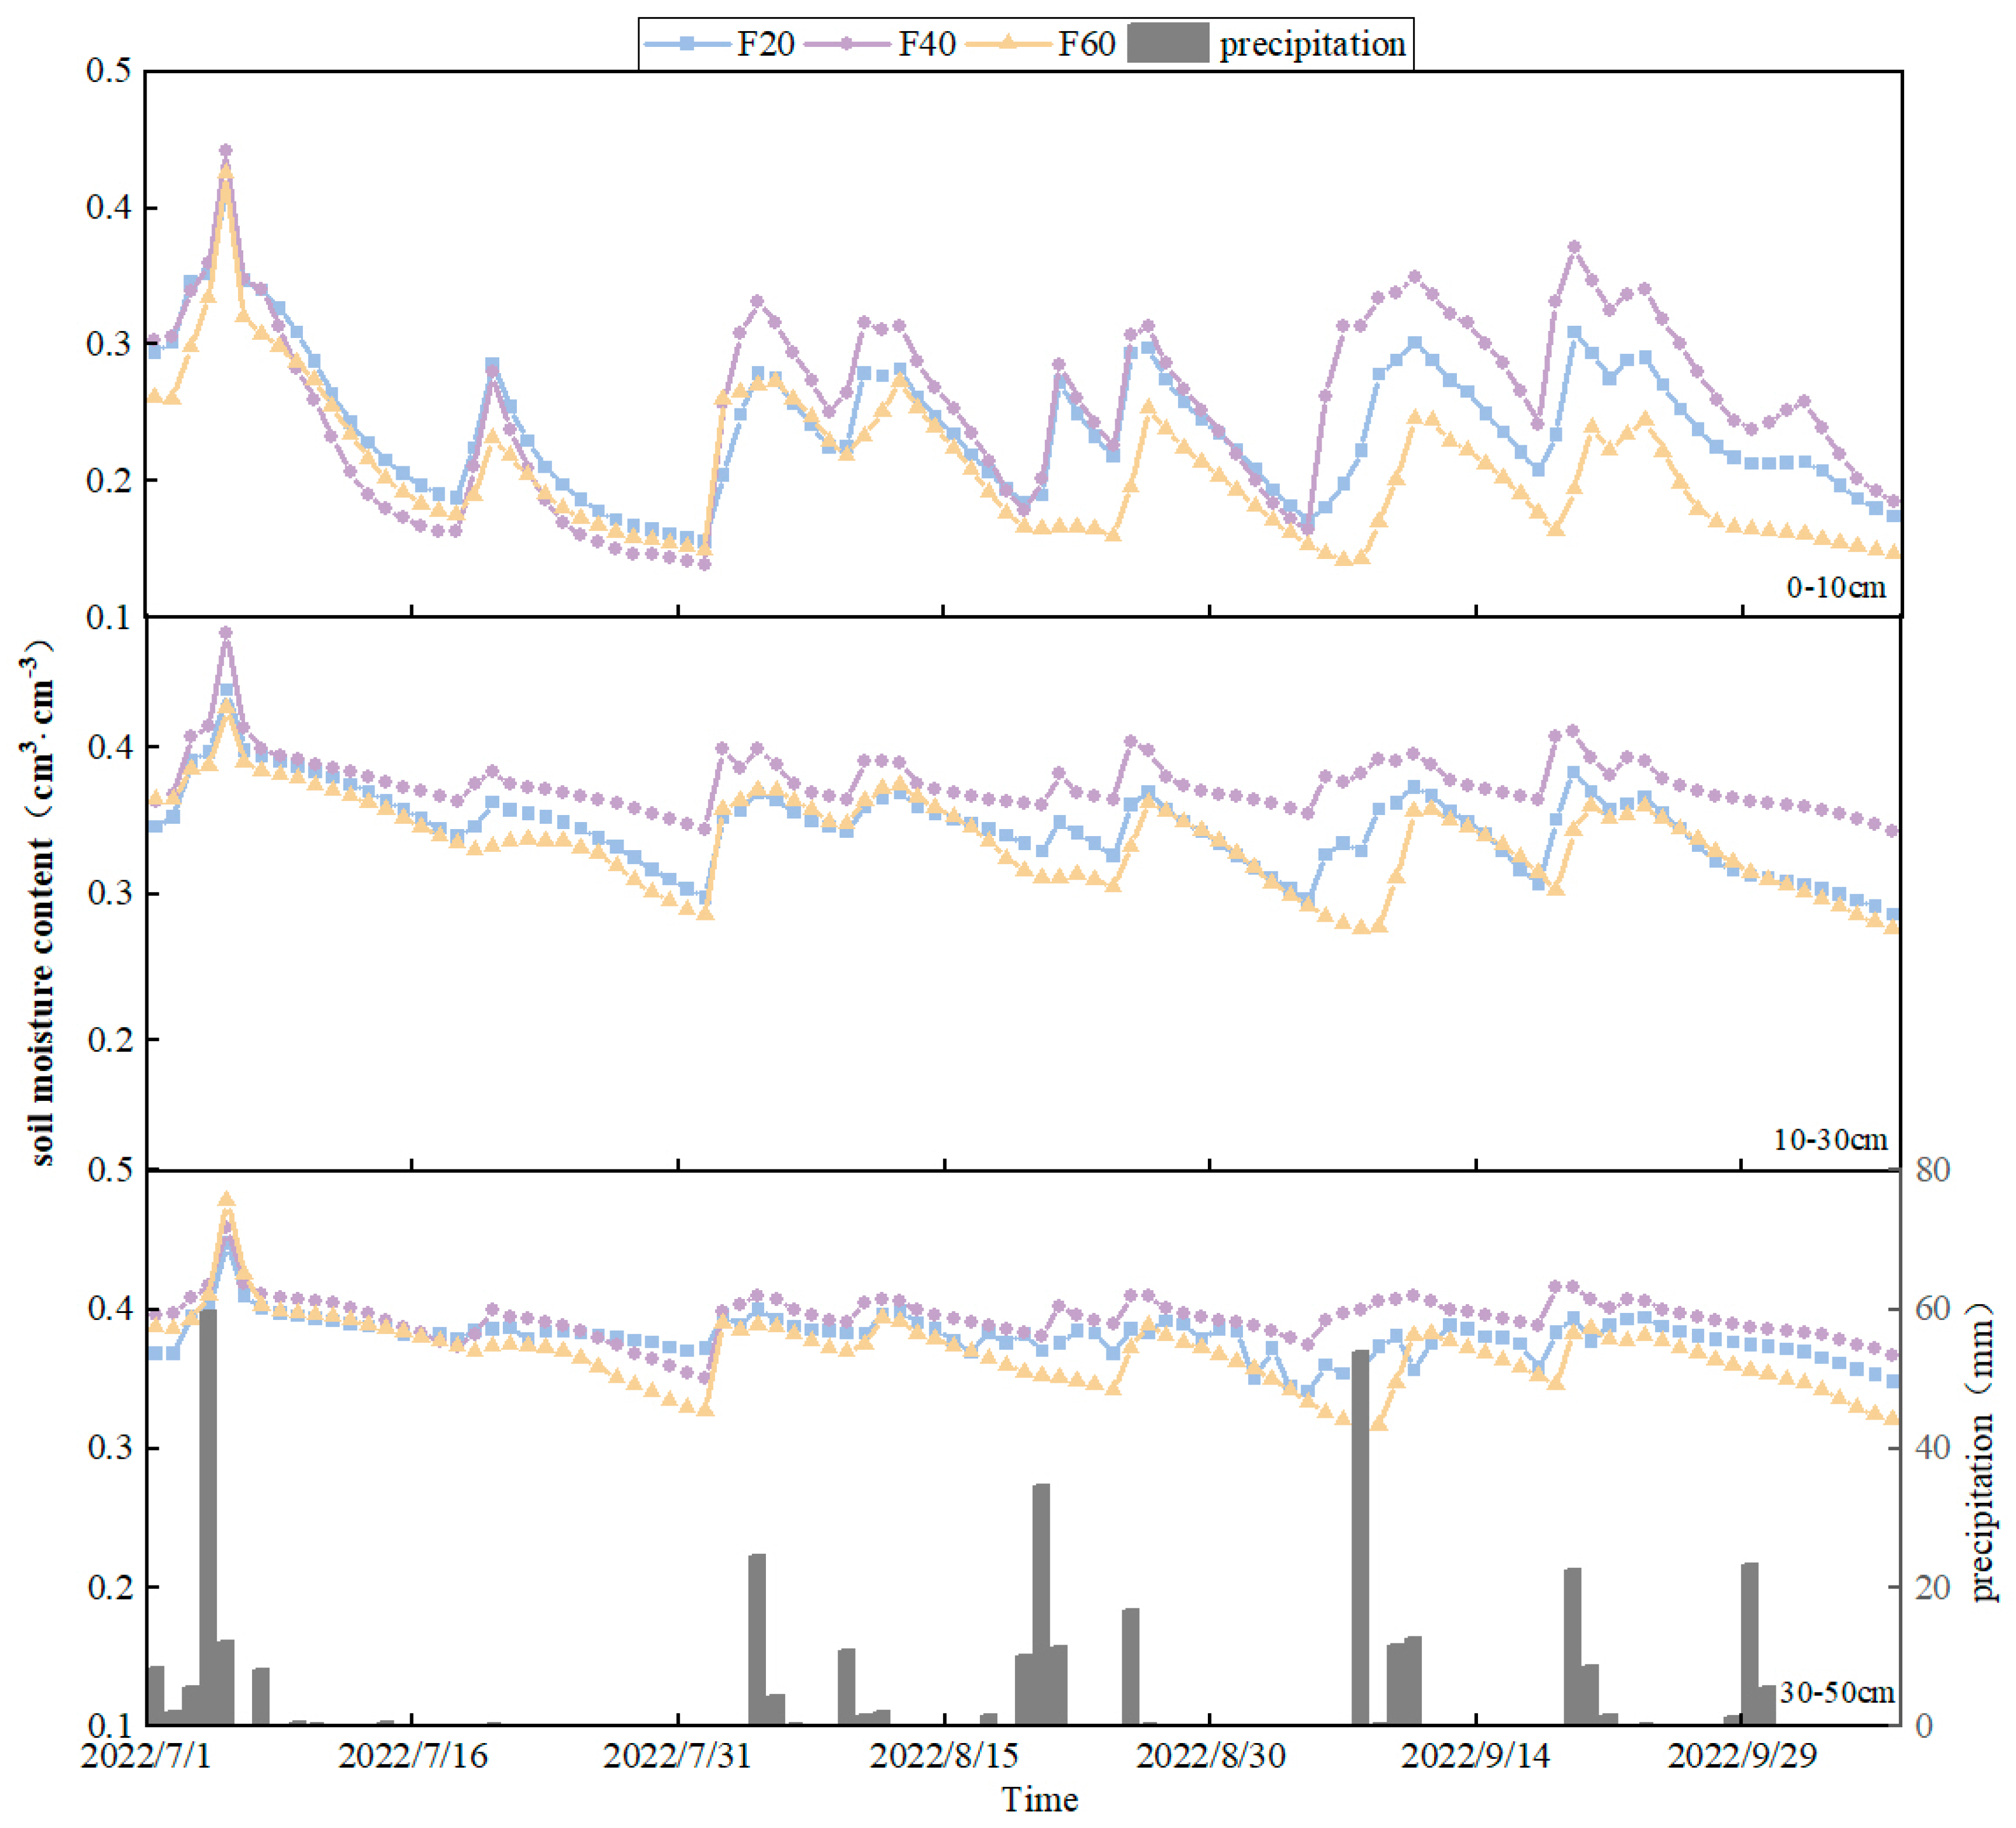
Figure 1. Variations in soil moisture content under different tillage depths in three treatments.
Agronomy 14 02576 g001
Figure 2. Statistical values of the mean soil moisture content under different tillage depths in three treatments.
Agronomy 14 02576 g002
Figure 3. Wavelet coherence spectrum of the moisture content at different vertical depths. Note: The solid black line indicates the 5% significance level, the color bar indicates the strength of the correlation, and the direction of the arrow indicates phase information or the type of correlation (right directed—“in phase” or positive; left directed—“out of phase” or negative). The right color column in the figure is the wavelet coherence value R2, which characterizes the coherence strength.
Agronomy 14 02576 g003
Figure 4. (ac) Variation of the mean wavelet coherence values (mean R2) and (d) the percent area of significant coherent (PASC) of vertical soil moisture at each treatment.
Agronomy 14 02576 g004
Figure 5. Response of soil moisture content to light rain at different tillage depths.
Agronomy 14 02576 g005
Figure 6. Response of soil moisture content to moderate rain at different tillage depths.
Agronomy 14 02576 g006
Figure 7. Response of soil moisture content to heavy rain at different tillage depths.
Agronomy 14 02576 g007
Figure 8. Response of soil moisture content to torrential rain at different tillage depths.
Agronomy 14 02576 g008
Figure 9. Correlation analysis of various parameters of soil. Note: “**” and “*” indicate p < 0.01 and p < 0.05, respectively. BD, TP, SOM, MSM, SD, CV, MSMR, MV, and MQ stand for bulk density, total porosity, soil organic matter, mean soil moisture, standard deviation, coefficient of variation, soil moisture replenishment, soil moisture replenishment rate, and soil moisture replenishment efficiency, respectively.
Agronomy 14 02576 g009
Table 1. Criteria for precipitation classification and the corresponding precipitation frequency.
Precipitation TypePrecipitation in 24 h (mm)Events
Torrential rain>502
Heavy rain25–501
Moderate rain10–2510
Light rain<1025
Table 2. Basic physical and chemical properties of soil under different tillage depth treatments.
TreatmentDepth
(cm)
Clay
(%)
Silt
(%)
Sand
(%)
BD
(g∙cm−3)
TP
(%)
SOM
(g∙kg−1)
F200–1020.78 ± 0.9834.23 ± 1.7844.99 ± 2.501.60 ± 0.0243.01 ± 0.71 a15.29 ± 3.66 a
10–3027.21 ± 2.8435.06 ± 3.9637.69 ± 4.121.63 ± 0.0541.88 ± 0.32 b13.17 ± 2.14 ab
30–5036.78 ± 2.2936.01 ± 1.1227.21 ± 3.281.41 ± 0.0849.83 ± 0.11 b7.38 ± 3.15 ab
F400–1031.08 ± 1.5940.71 ± 1.3428.17 ± 1.741.45 ± 0.0148.38 ± 0.51 a14.22 ± 2.04
10–3031.24 ± 3.0543.93 ± 2.0325.82 ± 2.891.63 ± 0.1241.95 ± 0.17 b13.93 ± 2.22
30–5034.97 ± 3.3147.43 ± 3.8917.60 ± 5.671.40 ± 0.0450.05 ± 0.23 a10.05 ± 5.10
F600–1022.31 ± 3.0937.40 ± 3.0840.29 ± 1.811.59 ± 0.1543.34 ± 5.38 a15.25 ± 2.28
10–3030.96 ± 3.2239.09 ± 4.4128.96 ± 3.361.63 ± 0.0741.98 ± 1.92 a13.70 ± 2.23
30–5044.47 ± 5.2439.36 ± 4.2116.17 ± 3.191.50 ± 0.1649.49 ± 1.67 a11.73 ± 3.49
Note: BD, TP, and SOM stand for bulk density, total porosity, and soil organic matter. The lowercase letters (e.g., a and b) represent significant differences between different depths within the same treatment (p < 0.05).
Table 3. Characteristics of the variations for soil moisture content in different treatment profiles.
Treatment
Depth (cm)
F20F40F60
0–1010–3030–500–1010–3030–500–1010–3030–50
SD (%)5.423.041.736.831.981.595.393.793.08
CV (%)22.788.904.5726.055.264.0327.0611.608.55
Note: SD and CV stand for standard deviation and coefficient of variation.
Table 4. The replenishment characteristics of soil moisture in each treatment under different precipitation events.
Precipitation TypeF20F40F60
S M R
(mm)
V
(mm∙h−1)
Q
(%)
S M R
(mm)
V
(mm∙h−1)
Q
(%)
S M R
(mm)
V
(mm∙h−1)
Q
(%)
Moderate rain16.201.1636.9918.601.4342.46000
Heavy rain27.706.9355.6221.807.2743.766.150.6212.30
Torrential rain28.204.7039.4434.505.7548.2535.704.4549.93
Mean24.034.2644.0224.974.8245.3613.951.6820.74
Note: ∆SMR represents soil moisture replenishment; V represents soil moisture replenishment rate; Q represents soil moisture replenishment efficiency.
Disclaimer/Publisher’s Note: The statements, opinions and data contained in all publications are solely those of the individual author(s) and contributor(s) and not of MDPI and/or the editor(s). MDPI and/or the editor(s) disclaim responsibility for any injury to people or property resulting from any ideas, methods, instructions or products referred to in the content.