Abstract
Mature 5-year-old Prunus domestica trees were used as research objects in plantation areas in arid and semi-arid regions of northern China in Hohhot city; three irrigation gradients and a natural control were set up according to the determination of wilting coefficient and field capacity, and FluorCam 1000-H chlorophyll fluorescence parameters of plant leaves were determined by using a portable chlorophyll fluorescence imager. The results showed that the effects of irrigation gradients on potential photochemical efficiency, maximum photochemical efficiency and non-photochemical burst were not significant (p > 0.05), and the effects on photochemical burst were significant (p < 0.05) at different fertility periods. The potential photochemical efficiency, maximum photochemical efficiency and photochemical burst basically showed a trend of increasing and then decreasing, and the non-photochemical burst showed a trend of decreasing and then increasing during different fertility periods. During the same fertility period, the potential and maximum photochemical efficiencies were significantly increased, and the photochemical and non-photochemical bursts were somewhat reduced under the full irrigation gradient. Therefore, the chlorophyll fluorescence characteristics of Prunus domestica trees at different fertility stages can be regulated by controlling the irrigation gradient to increase the activity of photosystem II (PSII), which in turn improves the photosynthesis of the plants.
1. Introduction
Prunus domestica trees are one of the earliest fruit tree varieties introduced in China, and its fruit is rich in nutrients, sweet and sour flavor and has a certain economic value. According to FAO statistics, by 2021, the harvest area of plum in China is 1946.5 thousand hectares, and the yield is as high as 6.6263 million tons, ranking first in the world [1]. There are many varieties of plum in the world, and there are more than 800 varieties and five categories in China alone [2]. With the rapid development of the planting industry and the transport industry, the demand for it increases year by year, and the planting area of the Prunus tree is also expanding, and the management system of its planting and cultivation needs to be improved [3]. At present, most of the research in this direction is concentrated in the southern crops, such as rice, tea, citrus fruits, etc. For the northern arid and semi-arid areas of the Prunus domestica trees, there is less related research, and the Prunus domestica trees are very sensitive to the problem of water stress [4]. So, through the study and exploration of irrigation gradient and chlorophyll fluorescence, the growth and development of the Prunus domestica trees are imminent.
China is a large agricultural country with vast agricultural land, which is the birthplace and planting base of many agricultural resources. The Inner Mongolia Autonomous Region is located in the arid and semi-arid region of northwestern China, and the relative scarcity of water limits the development of agricultural production in the region [5]. With the implementation of the policies of facility agriculture and smart agriculture, people have gradually recognized that the information contained in chlorophyll fluorescence parameters is linked to water stress, and that a water deficit will lead to a decrease in the photosynthetic rate and transpiration rate of crops, and chlorophyll fluorescence will be suppressed, affecting the growth and development of the crops [6,7]. Chlorophyll fluorescence characteristics are closely related to plant photosynthesis, which can be used for the study of plant growth and development, physiological traits, photosynthetic efficiency and stress monitoring [8]. Chlorophyll fluorescence imaging technology has a non-invasive advantage and is used internationally as one of the auxiliary detection technologies for photosynthesis-related research and one of the basic tools for crop breeding and selection detection, while chlorophyll fluorescence can also elucidate damage mechanisms and regulatory mechanisms [9]. For example, PSII is a photosynthetic reaction center in photosynthetic organisms, which is responsible for the absorption and conversion of light energy, and through a series of electron transfer processes, which in turn drives the process of carbon fixation and biosynthesis [10].
Quantification and analysis of chlorophyll fluorescence parameters can not only help us understand the efficiency and health of plant photosynthesis, but also provide critical information about environmental stresses and ecosystem responses [11]. However, in past studies, although we have delved into the physical mechanisms and measurements of chlorophyll fluorescence, there are still many unanswered questions about its dynamics in different ecosystems and the mechanisms of response to environmental factors. In order to fill this knowledge gap, many researchers have initiated extensive studies aiming to investigate the relationship between chlorophyll fluorescence and ecosystem health and environmental changes. Long Yan identified the drought stress state of seedling tomato by extracting chlorophyll fluorescence parameter values and compared the accuracy among different models [12]; Xiao Tianpu explored the vertical distribution law of photosynthetic characteristics of maize plants by chlorophyll fluorescence imaging technology and concluded that there are respective, most-suitable fluorescence parameters as optimal samples among different models [13]; Zhang Tong inverted the QY values by vegetation index and constructed the unmanned aerial vehicle multispectral-based method for quantum yield inversion of photosynthesis in soybean [14]; Ding Kaixin explored the relationship between potato and water stress by reviewing the growth and physiological characteristics of potato [15]. Zhang Yanyan set up a pot experiment with three water treatments and two phosphorus fertilizer treatments. By measuring the chlorophyll fluorescence parameters of different ear positions, the effects of phosphorus on the photosynthetic characteristics of wheat under different water conditions were analyzed. The results provide a theoretical basis and technical support for the rational application of phosphorus fertilizer to alleviate drought stress in wheat production [16]. Zhang Haifeng studied the effects of water stress on chlorophyll fluorescence parameters and yield of grapes at different growth stages. It was found that water stress reduced the chlorophyll fluorescence parameters of grapes and recovered after rewatering, but water stress during the whole growth period and expansion period caused irreversible effects on plants [17].
In this paper, we measured the chlorophyll fluorescence parameters of Prunus domestica trees under different watering gradients to reveal the correlation between water stress and chlorophyll fluorescence characteristics, and then select the appropriate water demand environment for the growth and development of Prunus domestica trees at the later stage of the study, so as to provide support for the water conservation and yield increase in arid and semi-arid areas in the north.
2. Materials and Methods
2.1. Overview of the Experimental Site
The experimental area is located in the Prunus Trees Park (40°26′ N, 110°47′ E) in Tumetzuo Banner, Hohhot City, Inner Mongolia Autonomous Region. The park is a typical loamy soil with an altitude of 1230 m. It is subject to a mid-temperate continental monsoon climate. Precipitation is low, evaporation is high, the climate is dry, and the frost-free period is short. The average annual temperature is 7.2 °C and the average annual frost-free period is 133 days. The average annual precipitation is about 379.4 mm, mainly concentrated in July to September. Relative humidity is low, with an average annual humidity of 54%, and evaporation is greater than precipitation. The average annual sunshine hours are about 3000 h, which is one of the longest sunshine areas in China [18]. The planting spacing of Prunus domestica trees is 3 × 3 m, and the plant height of 5-year-old Prunus domestica trees is 3.7 m, natural open-heart type, basically with four main branches, as shown in Figure 1 and Figure 2.
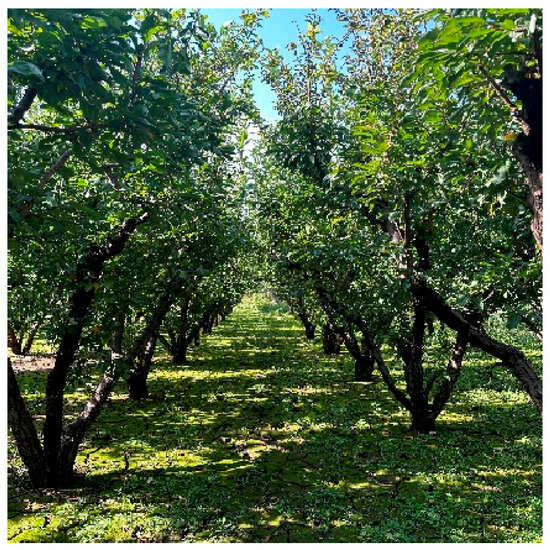
Figure 1.
Prunus domestica trees.
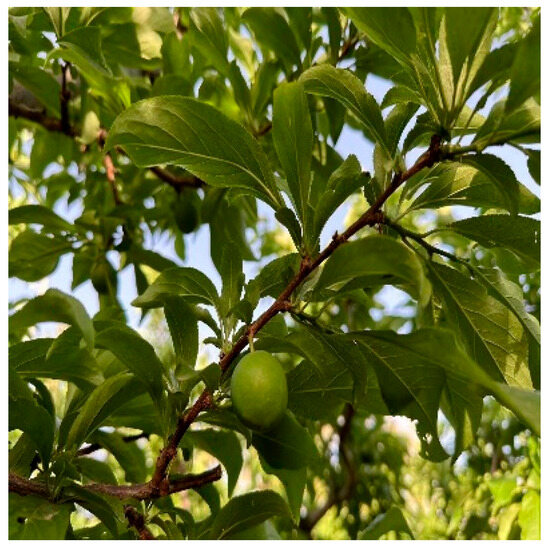
Figure 2.
Leaf blades of Prunus domestica trees.
2.2. Experimental Design
2.2.1. Experimental Area Design
The experimental site was divided into four rectangular experimental areas (Treatment, T); each rectangular experimental area contained three Prunus domestica trees with similar growth as replicated groups. Since the roots of Prunus domestica trees are mainly concentrated at 40 cm below the surface, the soil moisture in this study is mainly based on the data at this location. By installing a soil moisture sensor at 40 cm underground, the soil moisture content at this location is regularly measured and equipped with a movable folded canopy to prevent rainfall interference. The distribution of the experimental area is shown in Figure 3.
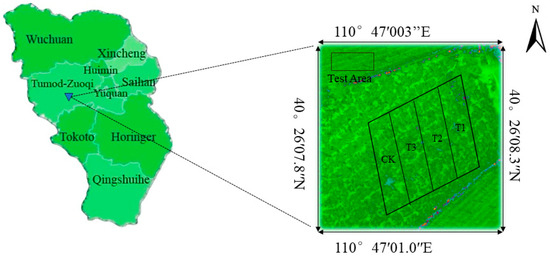
Figure 3.
Schematic distribution of the pilot area.
2.2.2. Water Gradient Design
By calculating the wilt coefficient and field water holding capacity (0.31 cm3/cm3) of the Prunus trees park, the water gradient design of each group was formulated [19,20]. By taking soil samples from the test site, soaking to reach saturation, weighing wet weight () and dry weight (), and then using Formula (1) calculate the water holding capacity:
The soil samples were put into the oven to dry to constant weight, and the dry weight was recorded. The soil samples were placed under appropriate humidity conditions to observe the growth status of plants until wilting occurred. The wet weight of soil samples at this time was recorded to determine the minimum field capacity of Prunus domestica trees. The watering gradient of each rectangular experimental area was shown as follows: experimental group I (T1) was set with full watering (90% of field water holding capacity), i.e., the soil water content was 0.279 cm3/cm3; experimental group II (T2) was set with severe water stress (field water holding capacity (48% of field water holding capacity), i.e., soil water content of 0.148 cm3/cm3; test group three (T3) was set up with moderate water stress (field water holding capacity of 48% to 90%), which was a cycle, and then irrigated again after the completion of the cycle until the end of the experiment; and the control group (CK) was set up under natural conditions as a control of the agricultural irrigation in Hohhot City. During the experiment, no fertilizer was added. As shown in Table 1, the experimental and control groups were maintained in the maintenance area for a long period of time. July to September 2023 is the period of growth and development of Prunus domestica trees, and this period was used as the experimental period of this study. Moisture observations were made every two days during the experimental period using soil water content sensors, and irrigation was carried out when it was below the specified lower limit.

Table 1.
Water treatments for Prunus domestica trees.
2.3. Data Acquisition and Measurement Methods
The chlorophyll fluorescence imaging system used in this experiment was the FluorCam 1000-H portable chlorophyll fluorometer, and the light source of the instrument consisted of five groups of light-emitting diodes, including measurement light, photochemical light Act1, photochemical light Act2, saturated light, and infrared light, and it has the ability to measure the light with Fv/Fm, Kautsky, Quenching, Light Curve, Dyes and FPs five analysis methods. Among them, the determination method used in this experiment was burst analysis (Quenching Analysis) [21]. In the early-fruiting, fruiting, and late-fruiting stages of Prunus domestica trees, nine canopy leaves were selected in each experimental area, and a total of 36 leaves in four groups of water treatments were selected, and the potential photochemical efficiency (Fv/Fo), maximum photochemical efficiency (Fv/Fm), photochemical burst coefficient, and photochemical burst coefficient of the canopy leaves of the Prunus domestica trees were determined by darkening the leaves through the black curtains for 30 min (dark treatment can restore the photosynthetic system of plants to a more stable state, which can more accurately reflect the actual state and function of PSII) before the measurement (the optimal fluorescence state could be obtained), photochemical burst coefficient (qP), non-photochemical burst coefficient (NPQ), fluorescence image and other parameters, and the stability of the instrument should be maintained during imaging to avoid leaf shaking [22]. The chlorophyll fluorescence kinetic curve graph can be used to assess the performance of the photosynthetic system, which reflects the changes in chlorophyll fluorescence signals produced by chloroplasts after receiving excitation at different light intensities, which is usually used to infer the physiological state of the photosynthetic system, and is of certain reference value for the study of the photosynthetic response mechanism, assessing the tolerance of plant species, and exploring plant growth adaptation strategies [23,24]. The fluorescence burst analysis graph of this Quenching test is shown in Figure 4; the blue curve is the graph plotted according to the average fluorescence intensity of the whole color-coded selection, and the red curve is the fluorescence graph of the pixel point pointed by the mouse.
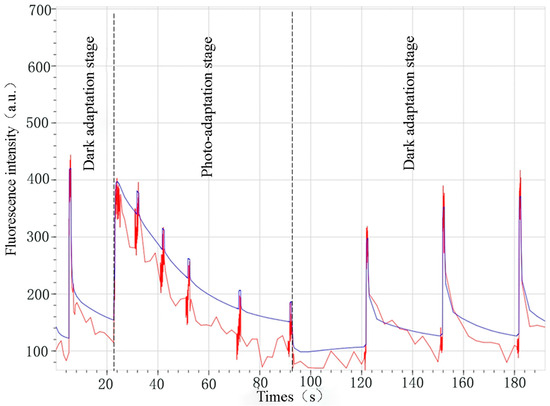
Figure 4.
Plot of chlorophyll fluorescence burst analysis.
2.4. Data Statistics and Analysis
In this study, we regionally selected the Prunus domestica tree leaves through the region of interest, obtained the fluorescence parameter images of the leaves, used Excel 2019 for the preliminary organization of the data, and SPSS 23 for the statistical analysis, using bivariate Pearson correlation analysis to obtain the mean and standard deviation, and then LSD and Duncan’s assumption of isotropy in the one-way analysis of variance (ANOVA) to explore the relationship between the irrigation gradient and the chlorophyll fluorescence correlation of variance between the parameters. Plots were made using Origin 2022, as shown in Table 2.
Table 2.
Fluorescence parameters, expressions, and concepts used in this paper.
3. Results
3.1. Analysis of Chlorophyll Fluorescence Parameter Plots
The fluorescence burst kinetic curve is the curve of fluorescence signal over time, which is used to study the rate and mechanism of the fluorescence burst process. After the laser is initiated, the fluorescence signal will rise rapidly to the peak value, when most of the fluorescent molecules are still in the excited state. As time passes, the fluorescence signal decreases exponentially, which is caused by the continuous non-radiative jump of fluorescent molecules to the ground state, and eventually, the fluorescence signal stabilizes and reaches an equilibrium state. Based on the shape of the fluorescence burst kinetic curve, the rate and mechanism of fluorescence burst can be inferred. For example, if the fluorescence signal decreases rapidly, it may indicate the existence of a strong energy transfer mechanism or charge transfer; on the contrary, if the fluorescence signal decreases slowly, it may indicate that the bursting process is restricted or the bursting mechanism is weak. From the comparative distribution plots of the fluorescence burst kinetic curves of the four irrigation water gradients, it can be seen that the leaf fluorescence intensity of T2 was the highest, around 440 (a.u.); the maximum fluorescence of the leaves of T3 and CK did not have a big difference, around 420 (a.u.); and the maximum fluorescence of the leaves of T1 was around 360 (a.u.); and the overall fluorescence intensity was declining with the reduction of irrigation water to a certain extent trend. At the Fp~Fm_Lss stage, the fluorescence intensity of different irrigation gradients showed large deviations, indicating that the photosynthetic capacity of the crop expressed through chlorophyll fluorescence parameters was easily disturbed during the light acclimatization stage, and the performance of T1 was more moderate at this stage, suggesting that sufficient irrigation conditions might moderate the fluorescence burst of leaves to a certain extent during the light acclimatization stage, as shown in Figure 5.
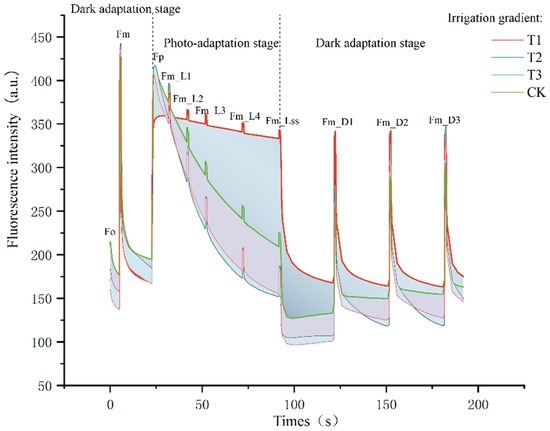
Figure 5.
Comparison of the kinetic curves of fluorescence bursting with different water filling gradients.
By comparing the imaging results of each fluorescence parameter in irrigation gradients at different fertility stages, the peak differences of fluorescence parameters were screened out. Taking the four irrigation gradients of Prunus domestica tree leaves at full fruiting stage as an example, three commonly used parameters were selected for analysis: Fv/Fm, qP, and NPQ. Typical images of the above three parameters were visualized and compared, and the results are shown in Figure 6. The distribution range of maximum photochemical efficiency Fv/Fm was mainly concentrated in 0.55~0.75; the distribution range of photochemical fluorescence burst qP was mainly concentrated in 0.1~0.6 and the qP value of leaves subjected to water stress (T2) was higher than that of other irrigated areas; and the distribution range of non-photochemical burst NPQ was mainly concentrated in 0.5~2.3, which provided certain significance for the analysis of the experiment afterwards. Comprehensive analysis of chlorophyll fluorescence imaging maps of Prunus domestica tree leaves showed that there were no significant image differences in fluorescence characteristics except for the photochemical burst, which was significantly different in different irrigation gradients; so, further analysis is needed to explore the effect of irrigation gradients on chlorophyll fluorescence parameters of Prunus domestica trees.
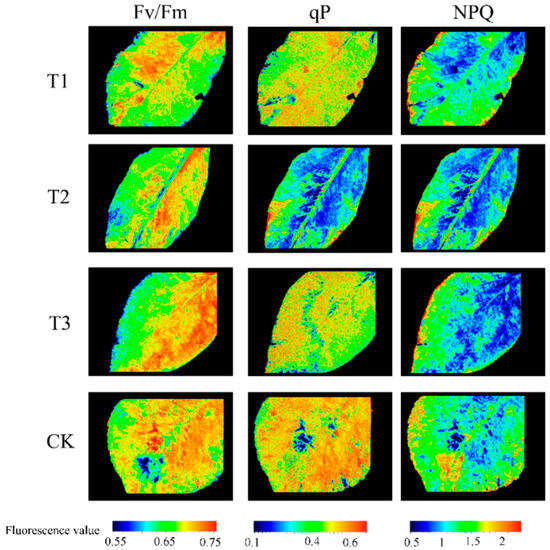
Figure 6.
Chlorophyll fluorescence imaging at different irrigation gradients.
3.2. Effect on Potential Photochemical Efficiency (Fv/Fo) of Prunus domestica Tree Leaves
Fv/Fo represents the potential activity of PSII, which is directly proportional to the number of active reaction centers [25], as can be seen in Table 3. At the beginning of the results, the potential photochemical efficiency of Prunus domestica trees under T1 and other irrigation gradient treatments differed significantly, and the Fv/Fo of Prunus domestica tree leaves would be increased under the adequate irrigation treatment, with T1 being 84% and 67% higher than T2, T3, and CK, respectively, 84%; on the contrary, being subjected to severe water stress reduced the values, giving them a lower PSII activity. Potential photochemical efficiencies were also slightly higher under the fully irrigated treatment than in other irrigation gradient areas at the peak fruiting stage. At the end of fruiting, T1 was 6% lower than T2 and T1 was 22% higher than T3.
Table 3.
Comparison of Fv/Fo values between irrigation gradients at different fertility stages.
By comparing the potential photochemical efficiencies of Prunus domestica tree leaves with different irrigation gradients at the early-fruiting, fruiting, and late-fruiting stages, a trend of increasing and then decreasing was observed, suggesting that the potential photochemical efficiencies of Prunus domestica tree leaves would reach the maximum during the fruiting stage, and that the potential activity of PSII would reach the highest, as the rate of accumulation of organic matter in the fruits would be increased. Analysis of variance showed that the coefficients of potential photochemical efficiency of Prunus domestica tree leaves were not significant (p > 0.05) by irrigation gradient at different fertility periods.
3.3. Effect on Maximum Photochemical Efficiency Fv/Fm
Maximum photochemical efficiency is an important indicator for assessing the condition of the crop photosynthetic system and whether it is affected by external stress, which represents the PSII primary light energy conversion efficiency; that is, the ability of the photosynthetic system to be able to convert light energy into chemical energy under optimal light conditions [26]. From Table 4, it can be seen that the maximum photochemical efficiency did not show a clear pattern in the early-fruiting, fruiting, and late-fruiting periods, but in the same fertility period, the values in the fully irrigated experimental area were larger than those in other areas, and the differences in Fv/Fm caused by each irrigation gradient were only within 3% to 17%.
Table 4.
Comparison of Fv/Fm values between irrigation gradients at different fertility stages.
By comparing the maximum photochemical efficiencies of Prunus domestica tree leaves with different irrigation gradients at the early-fruiting, fruiting, and late-fruiting stages, the numerical values showed fruiting > late fruiting > early fruiting, showing a trend of increasing and then decreasing, which is basically in line with the expected judgement that the crop has the strongest ability to convert light energy into chemical energy at fruiting, i.e., the Fv/Fm value is large. However, the reason why the maximum photochemical efficiency was greater at the end of fruiting than at the beginning of fruiting could not be determined directly and accurately. Reason one may be that the crop responded to environmental changes during growth and gradually adapted to new conditions, which included adaptation to light, and if the plant experienced an increase in light intensity or other adaptive adjustments at the end of fruiting, the photosynthesis system may have utilized the light energy more efficiently, which resulted in an increase in Fv/Fm values; the second reason could be that the crop enhanced the activity of these photoprotective mechanisms in the late-fruiting stage, such as the enhancement of the non-photochemical quenching mechanism, NPQ, which is able to counteract excess light energy in time to prevent it from damaging the photosynthetic pigments and reaction centers, thus improving the efficiency of photosynthesis and leading to an increase in the maximum photochemical efficiency, Fv/Fm, at the end of the fruiting stage. Further in-depth experiments are required if the cause of this result is to be determined. Analysis of variance showed that the coefficients of maximum photochemical efficiency of Prunus domestica tree leaves were not significant (p > 0.05) for different irrigation gradients at different fertility stages.
3.4. Effects on Photochemical Quenching Coefficient (qP)
Photochemical quenching reflects the share of light energy absorbed by PSII antenna pigments used for photochemical electron transfer, and to maintain high photochemical quenching, it is necessary to keep the PSII reaction center in an “open” state, so photochemical quenching reflects the openness of the PSII reaction center to a certain extent [27]. Table 5 shows that at the beginning of the results, the qP value of T2 was only 2% lower than that of the CK region among the four irrigation regions, which also indicates that the growth and development of Prunus domestica trees were under water stress under the normal irrigation pattern and climatic conditions in Hohhot. The crop was under water stress due to severe water limitation and insufficient water supply, which resulted in the crop being under water stress, which affects the light energy utilization in the photosynthesis system and the crop’s own regulatory mechanisms, and increases the occurrence of photochemical bursts, e.g., decreasing the activity of PS II and the degradation of photosynthetic pigments. At the peak fruiting stage, T3 and CK treatments were 17% higher than T1 and 45% higher than T2. At the end of fruiting, T3 was 150%, 84%, and 66% higher than T1, T2, and CK, respectively, suggesting that the photochemical burst of the crop can be enhanced by appropriate adjustment of the irrigation volume to improve the photosynthetic capacity at this stage.
Table 5.
Comparison of qP values between irrigation gradients at different fertility stages.
By comparing the photochemical burst coefficients of Prunus domestica tree leaves with different irrigation gradients at the early-fruiting stage, at the full-fruiting stage, and at the end of the fruiting stage, the photochemical burst coefficients showed a general tendency of increasing and then decreasing in the process of changing from the early-fruiting stage, at the full-fruiting stage to the end of the fruiting stage (except for T2), which was attributed to the fact that the crop in the full-fruiting stage, under the supply of a certain amount of nutrients and resources, accumulates a large amount of photosynthetic pigments including chlorophylls and other pigments, to enhance the photosynthetic capacity of the crop and convert light energy more efficiently, thus increasing the value of qP. In summary, the results showed that the photochemical burst of the crop was relatively small when the crop was relatively well watered and relatively large when it was subjected to water stress, so it is very important to maintain appropriate water supply to maintain the normal photosynthesis of the fruit trees and to reduce the occurrence of photochemical burst. Analysis of variance showed that the coefficients of photochemical burst on Prunus domestica tree leaves were significant (p < 0.05) for different irrigation gradients at different fertility periods.
3.5. Effects on Non-Photochemical Burst Coefficient (NPQ)
Non-photochemical burst reflects the part of light energy absorbed by PSII antenna pigments that cannot be used for light and electron transfer and is dissipated in the form of heat. When the PSII reaction center antenna pigment absorbs excessive light energy, if it cannot be dissipated in time, it will cause deactivation or destruction of the photosynthesis mechanism, so the non-photochemical quenching is a kind of self-protection mechanism, which plays a certain protective role for the photosynthesis mechanism [28]. Non-photochemical quenching can be expressed in two ways, NPQ = Fm/Fm’ − 1 or qN = 1 − Fv’/Fv, which reflect the same biological significance, but currently researchers prefer to use the former as a research index, and believe that NPQ is more accurately reflecting the non-photochemical quenching situation than qN [29]. Therefore, in this paper, NPQ coefficients were used as the non-photochemical burst indexes for the study crops to be analyzed. As can be seen from Table 6, the non-photochemical burst in general presents CK > T3 > T2 > T1, indicating that both the fully irrigated and water stress state will make the Prunus domestica tree leaves reduce the dissipation of energy to a certain extent, but this irrigation gradient will result in an excessive amount of light energy that cannot be dissipated, which will damage the photosynthetic capacity of the crop, so the Prunus domestica trees can be made to have the environment in an irrigation gradient of approximate T3, which will strengthen the photosynthetic capacity of the leaves.
Table 6.
Comparison of NPQ values between irrigation gradients at different fertility stages.
By comparing the non-photochemical burst coefficients (NPQs) of Prunus domestica tree leaves with different irrigation gradients at the early-fruiting stage, full-fruiting stage, and the end-of-fruiting stage, the NPQs generally showed a trend of decreasing and then increasing. It has been shown that the increase in NPQ is often closely related to the initiation of the lutein cycle, which is used to regulate and conserve light energy through the conversion and energy dissipation of lutein. The initiation of the lutein cycle mainly involves the mutual conversion of chlorophyll and lutein. During photosynthesis, when there is too much light, plants accumulate excess photosynthetic pigments, including lutein, and the excess lutein triggers a series of enzyme-catalyzed reactions to convert it into optically active non-fluorescent lutein. This non-fluorescent lutein can physically interact with photosynthetic pigments to form energy dissipation centers, thus reducing the conversion of light energy [30]. From Table 6, it can be seen that the NPQ values were larger at the end of the fruiting period than at the beginning of the fruiting period, which with a high probability is the cause of the fact that the maximum photochemical efficiency was larger at the end of the fruiting period than at the beginning of the fruiting period. Analysis of variance showed that the non-photochemical burst coefficients of leaves of Prunus domestica trees were not significant (p > 0.05) for different irrigation gradients at different fertility stages.
4. Discussion
In fact, in addition to water stress, other environmental variables such as temperature, light intensity, fertilization, and air quality also significantly affect chlorophyll fluorescence parameters. For example, higher temperature may lead to lower photosynthetic efficiency and affect the photosynthetic activity of chlorophyll [31], the change of light intensity will directly affect the photosynthetic electron transport rate [32], insufficient soil nutrients may lead to a decrease in the ability of plants to absorb and utilize light energy [33]. The study of the effect of irrigation gradient on chlorophyll fluorescence parameters involves the crop’s response to water stress and how this response is reflected by chlorophyll fluorescence. When a crop encounters a water stress environment, it will experience a series of physiological and ecological changes, such as stomatal closure and growth slowdown, which will affect chlorophyll synthesis and degradation, and thus chlorophyll fluorescence parameters. By monitoring the changes in chlorophyll fluorescence parameters, it is possible to determine crop response to water stress at an early stage in real time and non-destructively, so as to develop a more reasonable irrigation strategy and optimize the production of agriculture [34]. Of course, there are some difficulties and challenges to be encountered through this research method; for example, the crops will encounter complex environmental effects, the existence of heterogeneity in the soil, and the complexity of data interpretation, so the researchers need to identify these interfering factors.
As shown in Figure 7, differences in the distribution of fluorescence parameters across the irrigation gradient at different fertility periods can be seen; however, the reason for the direction of each trend cannot be directly determined from the data, which may have some connection with the overall environment of the region where the crop is located, including solar radiation, annual precipitation, light intensity, soil factors, etc. This is one of the drawbacks of the chlorophyll fluorescence imaging technique, which is not able to directly measure the crop’s photosynthesis. It cannot directly measure the intensity and efficiency of photosynthesis in crops, and the interpretation of certain data is too complicated. Researchers should take these factors into consideration when using chlorophyll fluorescence imaging and combine them with other methods and tools for comprehensive analyses.
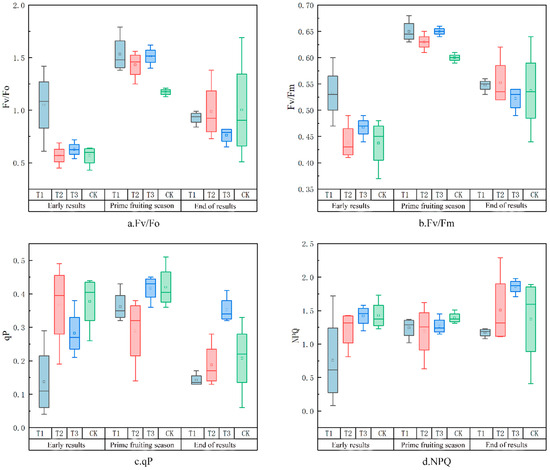
Figure 7.
Differences in the distribution of fluorescence parameters across the irrigation gradient at different fertility stages.
The irrigation gradient (Ig) and chlorophyll fluorescence data were converted into dimensionless numbers through data normalization to reduce the effect of variability due to units, and the correlation matrix obtained is shown in Figure 8. It can be seen that the watering gradient was obviously positively correlated with Fv/Fo and Fv/Fm, and negatively correlated with NPQ and qP at the beginning of the fruiting period, and there was obvious correlation between the fluorescence parameters. At the end of the period, the correlation between the watering gradient and each fluorescence parameter continued to decrease, and the correlation changed from positive to negative, and the correlation between qP and Fv/Fm and Fv/Fo increased at this stage. The reasons for the above phenomena were influenced by various factors, such as different growth stages, changes in photosynthetic efficiency, and changes in physiological metabolism.
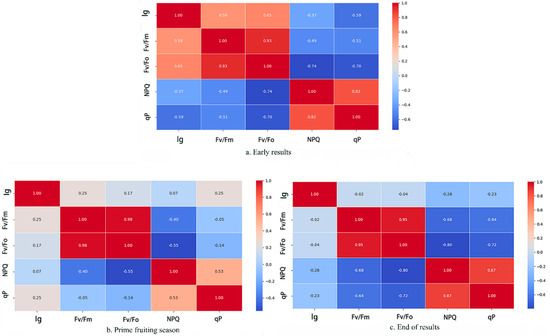
Figure 8.
Correlation matrix between watering gradient and chlorophyll fluorescence parameters.
The results of this study showed that chlorophyll fluorescence technology was used to monitor the growth status of Prunus trees, and the irrigation scheme was adjusted in time to cope with different environmental conditions, improve the efficiency of water resources use, and reduce unnecessary waste.
5. Conclusions
In this experiment, we investigated the effects of different irrigation gradients at different fertility stages on the chlorophyll fluorescence parameters of Prunus domestica tree leaves in the experimental area by designing different irrigation gradients, and the conclusions are as follows:
(1) The effects of irrigation gradients at different fertility periods on Fv/Fo, Fv/Fm, and NPQ were not significant (p > 0.05), and the effects on qP were significant (p < 0.05).
(2) During different fertility periods, Fv/Fo, Fv/Fm, and qP basically showed a trend of increasing and then decreasing, while NPQ showed a trend of decreasing and then increasing, indicating that the photosynthetic capacity of Prunus domestica trees reached the strongest at the stage of fruiting, with good growth and development.
(3) During the same fertility period, Fv/Fo and Fv/Fm were significantly increased and NPQ and qP were reduced to a certain extent under the gradient of sufficient irrigation, indicating that reasonable water irrigation conditions can improve the photosynthetic utilization efficiency of the crop and increase the efficiency capacity of light energy conversion into chemical energy.
(4) Future research should focus on long-term monitoring of the effects of different irrigation strategies on the growth and fruit quality of Prunus trees, combined with multi-factor analysis of factors such as temperature, light, and fertilization, and compare the adaptability of different varieties. In addition, in practical applications, it is recommended that farmers flexibly adjust irrigation strategies according to soil moisture and plant growth stages, promote intelligent irrigation systems based on chlorophyll fluorescence monitoring, improve water use efficiency, and combine scientific fertilization and pest control measures to improve overall crop productivity and sustainability.
Author Contributions
Conceptualization, Z.Z. and X.Y.; methodology, Z.Z. and H.W.; software, X.Y. and S.W.; validation, Z.Z. and H.W.; formal analysis, S.W. and H.W.; investigation, C.W. and X.R.; resources, Z.Z. and H.W.; data curation, X.Y. and H.W.; writing—original draft preparation, X.Y.; writing—review and editing, Z.Z. and H.W.; visualization, X.R.; supervision, Z.Z.; project administration, C.W.; funding acquisition, Z.Z. and H.W. All authors have read and agreed to the published version of the manuscript.
Funding
This research was funded by the Inner Mongolia Autonomous Region Science and Technology Program (2023YFDZ0015) and Inner Mongolia Agricultural University Basic Research Operating Expenses Program (BR241401).
Data Availability Statement
The original contributions presented in the study are included in the article; further inquiries can be directed to the corresponding author.
Acknowledgments
The authors sincerely thank the anonymous reviewers who made valuable comments on this paper.
Conflicts of Interest
The authors declare no conflicts of interest.
References
- Chen, S.; Luo, C.; Wang, H. Amino acid composition and nutritional value evaluation of Guizhou late-maturing plum. Food Res. Dev. 2021, 42, 34–40. [Google Scholar]
- Zhou, Y.; Chen, Q.; Deng, H. Study on Quality Characteristics of Several Plum Cultivars in Leshan, Sichuan. J. Leshan Norm. Univ. 2017, 32, 17–21+130. [Google Scholar]
- Chen, L. Response of prunus trees to several nutrients and pest control. Contemp. Agric. Mach. 2023, 8, 91+93. [Google Scholar]
- Chen, H. Precautions for high-quality and high-efficiency cultivation of prunus. Rural New Technol. 2023, 8, 18–19. [Google Scholar]
- Jiang, W.; Jiang, S.; Liu, Y. Discussion on three key issues of agricultural water management. J. Irrig. Drain. 2022, 41, 9–12. [Google Scholar]
- Han, Z.; Zhang, C.; Wang, Z. Comparative study on photosynthetic assimilation function of potato seedlings of different genotypes under water deficit. J. Northeast Norm. Univ. 2023, 55, 126–133. [Google Scholar]
- Ahmad, A.; Zahid, U.; Hassan, S. Water stress effects on stay green and chlorophyll fluorescence with focus on yield characteristics of diverse bread wheats. Planta 2023, 257, 104. [Google Scholar]
- Yang, N.; Deng, S. Research progress on remote sensing inversion of chlorophyll fluorescence and its application in agricultural monitoring. Jiangsu Agric. Sci. 2023, 51, 1–13. [Google Scholar]
- Wang, X.; Wu, Z.; Sun, Y. Intelligent identification of heat stress in tomato seedings based on chlorophyII fluorescence imaging technology. Trans. Chin. Soc. Agric. Eng. 2022, 38, 171–179. [Google Scholar]
- Cheng, S.; Li, Z. Research Progress in the Mechanism of Plant Photosystem II(PSII)Responsing to Abiotic Stress. Biotechnol. Bull. 2023, 39, 33–42. [Google Scholar]
- Zhang, X.; Zhang, D.; Zhou, H. Chlorophyll fluorescence detection and analysis technology and its application in agriculture. Ningxia Agric. For. Sci. Technol. 2023, 64, 59–64. [Google Scholar]
- Long, Y.; Ma, M.; Wang, Y. Identification of drought stress status in seedling tomato using chlorophyll fluorescence kinetic parameters. J. Agric. Eng. 2021, 37, 172–179. [Google Scholar]
- Xiao, T.; Yang, L.; Zhang, D. Vertical distribution of photosynthetic characteristics of maize seedling leaves based on chlorophyll fluorescence imaging. J. Agric. Eng. 2022, 38, 162–171. [Google Scholar]
- Zhang, T.; Jin, X.; Rao, Y. A quantum yield inversion method for photosynthesis of soybean flag leaf based on unmanned aerial vehicle multispectroscopy. J. Agric. Eng. 2022, 38, 150–157. [Google Scholar]
- Ding, K.; Wang, L.; Tian, G. A review of potato growth and physiological characteristics in response to water stress. J. Crops 2023, 4, 16–21. [Google Scholar]
- Zhang, Y.; Liu, L.; Yuan, X. Effects of phosphorus application on spike floret development into grain and photosynthetic characteristics of winter wheat under different water treatments. Acta Ecol. Sin. 2024, 44, 6331–6345. [Google Scholar]
- Zhang, H.; Pang, G.; Fu, Y. Effects of water stress at different growth stages on chlorophyII fluorescence parameters and yield of grape. Water-Sav. Irrig. 2024, 7, 1–7. [Google Scholar]
- Tian, H. Study on the influence of climate change on the development period of apricot in Hohhot. Rural Technol. 2021, 12, 112–114. [Google Scholar]
- Zhou, G.; Li, Y.; Fan, J. A method for determining wilting coefficient by using plant gas exchange parameters. J. Soil Sci. 2023, 60, 776–786. [Google Scholar]
- Zhang, Y. Field capacity measurement and error analysis in the plain area of eastern Henan. Henan Water Conserv. South-North Water Divers 2023, 52, 20–22. [Google Scholar]
- Si, B. Analytical Method and Experimental Study on Water Stress of Strawberry Seedlings Based on chlorophyll Fluorescence Technology; Shanxi University of Technology: Hanzhong, China, 2024. [Google Scholar]
- Zhang, S. Significance and discussion of chlorophyll fluorescence kinetic parameters. J. Bot. Bull. 1999, 4, 444–448. [Google Scholar]
- Zhou, C.; Hua, D.; Le, J. Chlorophyll fluorescence kinetics of plant water stress detection by combining images. J. Agric. Mach. 2017, 48, 148–154. [Google Scholar]
- Hu, W.; Yan, X.; Li, X. Effect of 24-epi-olein lactone on the kinetic curve of rapid chlorophyll fluorescence induction in chilli leaves under drought stress. Plant Res. 2021, 41, 53–59. [Google Scholar]
- Xia, H.; Yu, X.; Huang, Q. Effects of different water treatments on chlorophyll fluorescence parameters of cucumber grown in soilless culture. J. Irrig. Drain. 2021, 40, 90–94. [Google Scholar]
- Li, Z.; Wen, J.; Erman, H. Study on Heat Resistance of Peony Using Photosynthetic Indexes and Rapid Fluorescence Kinetics. Horticulture 2023, 9, 100. [Google Scholar] [CrossRef]
- Li, Y.; Gu, X.; Li, Y. Ridge-furrow mulching combined with appropriate nitrogen rate for enhancing photosynthetic efficiency, yield and water use efficiency of summer maize in a semi-arid region of China. Agric. Water Manag. 2023, 287, 108450. [Google Scholar] [CrossRef]
- Jiang, H.; Liu, Z.; Wang, J. Combining Chlorophyll Fluorescence and Vegetation Reflectance Indices to Estimate Non-Photochemical Quenching (NPQ) of Rice at the Leaf Scale. Remote Sens. 2023, 15, 4222. [Google Scholar] [CrossRef]
- You, X.; Gong, J. Significance of chlorophyll fluorescence kinetic parameters and example identification. West. For. Sci. 2012, 41, 90–94. [Google Scholar]
- Pu, K.; Ding, D.; Li, N. Effects of zeaxanthin on photosynthetic capacity and xanthophyll cycle of pepper under low temperature and weak light. Agric. Res. Arid Areas 2024, 42, 177–187. [Google Scholar]
- Du, S.; Fang, B.; Li, X. Effects of exogenous salicylic acid on chlorophyll fluorescence characteristics and antioxidant enzyme activities of wheat seedlings under low temperature stress. Jiangsu Agric. Sci. 2022, 50, 68–73. [Google Scholar]
- Zeng, J.; Liu, J. Comparison of nutrient absorption and photosynthetic characteristics between Alternanthera philoxeroides and companion species of Paspalum paspaloides under different light conditions. Biol. Disaster Sci. 2024, 47, 380–387. [Google Scholar]
- Liu, M.; Yu, J.; Kang, H.; Kong, Q. Effect of several environmental factors on the growth and phosphorus utilization of Chlorella vulgaris. J. Tianjin Agric. Univ. 2023, 30, 2221. [Google Scholar]
- Yuan, M. Application strategy of efficient water-saving irrigation technology in farmland water conservancy. Rural Sci. Exp. 2024, 14, 115–117. [Google Scholar]
Disclaimer/Publisher’s Note: The statements, opinions and data contained in all publications are solely those of the individual author(s) and contributor(s) and not of MDPI and/or the editor(s). MDPI and/or the editor(s) disclaim responsibility for any injury to people or property resulting from any ideas, methods, instructions or products referred to in the content. |
© 2024 by the authors. Licensee MDPI, Basel, Switzerland. This article is an open access article distributed under the terms and conditions of the Creative Commons Attribution (CC BY) license (https://creativecommons.org/licenses/by/4.0/).