Article

The Synergistic Effects of Different Phosphorus Sources: Ferralsols Promoted Soil Phosphorus Transformation and Accumulation

1
College of Resources and Environmental Science, Yunnan Agricultural University, Kunming 650201, China
2
College of Rural Revitalizing and Education of Yunnan, Yunnan Open University, Kunming 650101, China
3
Scientific Observing and Experimental Station of Arable Land Conservation (Yunnan), Ministry of Agriculture, Kunming 650201, China
*
Author to whom correspondence should be addressed.
Agronomy 2024, 14(10), 2372; https://doi.org/10.3390/agronomy14102372
Submission received: 15 July 2024 / Revised: 26 September 2024 / Accepted: 3 October 2024 / Published: 14 October 2024
(This article belongs to the Section Soil and Plant Nutrition)

Abstract

:
Phosphorus (P) application can enhance soil P availability and alter P fractions. However, the P accumulation and transformation of different P sources in low-phosphorus red soil remain unclear. Two-year (2018–2019) field experiments were conducted to investigate the effects of five P source treatments (CK—no phosphorus; SSP—superphosphate; MAP—calcium–magnesium phosphate; DAP—monoammonium phosphate; and CMP—diammonium phosphate) on the P accumulation of maize and soil P fractions in low-P red soil using the Hedley Sequential Method. The results showed that P application significantly increased P uptake, Olsen-P, total phosphorus, and most of the soil P fractions. Compared to the CMP, MAP, and DAP treatments, SSP had a relatively higher P accumulation and labile P pool, with a slightly lower moderately labile P pool. The SSP treatment mainly increased soil-available P content and crop P uptake by increasing the labile P pool (resin-P and NaHCO3-Pi) and reducing the moderately labile P pool and non-labile P pool. The P activation coefficient (PAC%) and Olsen-P were positively correlated with labile P (resin-P, NaHCO3-Pi, and NaHCO3-Po) and moderately labile P (NaOH-Pi and 1 M HCl-Pi) and negatively correlated with Fe2O3 and Al2O3. The results suggest that SSP has a priority effect on the crop P uptake and soil P availability in low-P red soil.

1. Introduction

Phosphorus (P) is one of the most important nutrients for crop growth and one of the main limiting factors for yield increases in southern acidic red soil crops [1,2]. P applied to red soils mostly reacts with Fe and Al oxides to form insoluble iron and aluminum phosphates, and nearly 75–90% of the P is converted to insoluble phosphate and accumulated in the soil, resulting in only 10–25% in the season’s utilization of P fertilization [3]. However, with the fast growth of the global food demand, the input of chemical P fertilizer has considerably increased [4,5], leading to the annual P surplus level increasing by 10% from 1980 to 2018 [6,7]. The excessive and continual application of P fertilizer to agricultural soil not only wastes limited phosphate resources but also may pose potential environmental problems [8,9]. Therefore, improving the effectiveness of soil P is the key to reducing soil P accumulation, which is important for improving P fertilizer utilization and reducing environmental pollution to achieve sustainable agricultural development. The transformation process of different P sources in the soil affects the effectiveness of soil P, which in turn affects crop yield and P uptake and utilization, and it is of great significance to explore the maize yield effect of different P sources, P uptake, and the utilization characteristics of different P sources on red soil for the rational selection of P sources and improvement of the efficiency of P utilization in red soil.
Numerous studies have focused on the relationship between P fertilizer application and utilization and showed that the long-term rational application of P fertilizer could significantly increase the total P content and improve the effective P pool and the inorganic P [8,9,10]. Soil P effectiveness is closely related to P fertilizer species. The transformation process of different P sources in the soil affects the P effectiveness, which in turn affects crop yield and P uptake and utilization. It is of great significance to explore the effects of different P sources on maize yield and the characteristics of P uptake and utilization for the rational selection of P sources and improvement of P utilization efficiency in red soil [9,11,12].
Wang et al. [11] showed that P fertilizer utilization efficiency on calcareous soil was calcium superphosphate > calcium–magnesium phosphate > diammonium phosphate under an equal P amount, but the fertilization effect of calcium–magnesium phosphate on acidic soil is comparable or even higher than that of water-soluble fertilizer [9]. Li et al. [12] found that diammonium phosphate and calcium–magnesium phosphate fertilizers were effective in improving rice and rape yields and P utilization in acidic soils in a 2-year field trial, while Wang et al. [13], in weakly acidic red soil, showed that calcium–magnesium phosphate fertilizers were the least effective compared to calcium superphosphate, monoammonium phosphate, and diammonium phosphate. Our previous study [14], in agreement with Wang et al. [13], showed that soil P fertilizer use efficiency in red soils was better for calcium superphosphate > calcium and magnesium than for both monoammonium phosphate and diammonium phosphate, and we confirmed this through adsorption and desorption tests between different P sources, but the differences between different P sources species and their specific mechanisms of action were not clear [14].
Soil total P and Olsen-P (NaHCO3-extracted P) and the P activation coefficient (PAC%, the ratio of Olsen-P to total P) are important indicators that are still commonly used to measure and evaluate soil P pools and the most effective part of soil available P pool for crops [15,16]. However, the capacity of the soil P supply mainly depends on the dynamic changes among different P forms [17,18]. The form and transformation of P in the soil directly affect the uptake and use of P by crops. Soil P fractions provide a good understanding of the effective P and the availability of each P fraction in soils, which are complex and in dynamic equilibrium [19]. The improved Hedley P fraction method takes into account the distinction between inorganic P and active and stable organic P and provides a more comprehensive assessment of the morphological changes in each P fraction in the soil [20]. It is currently a reasonable method for P fractions and has been increasingly adopted by scholars [21]. This method classifies P into active (resin-P, NaHCO3-Pi, and NaHCO3-Po), moderately active (NaOH-Pi, NaOH-Po, and 1 M HCl-Pi), and stable (conc.HCl-Pi, conc.HCl-Po, and Residual-P) P that can be used directly and indirectly by plants, depending on the state of the P in the soil [22].
Red soil is a typical acidic soil type; due to the strong desilication and aluminization, P is easily fixed by insoluble P, resulting in low P availability and utilization in growing plants [23]. Evaluating these direct and indirect relationships between P accumulation, Olsen-P, and P fractions can help predict the bioavailability of P fractions by providing quantitative information on the dynamic process of P’s replenishing ability. The matching of different P sources with red soil is helpful to improve crop yield and increase P utilization efficiency. However, the change in the P fraction to different P sources of low-P red soil in agricultural systems is still far from clear.
Thus, this study aimed to (1) comprehensively evaluate the soil P fraction and availability variations in low-P red soil based on maize cultivation under different P source treatment measures using modified Hedley sequential extraction; (2) identify the main influencing factors of P fractions and P pools by redundancy analysis (RDA); and (3) illuminate the influence of P fractions on the P uptake, Olsen-P, and PAC% in red soils of southwest China. This study will improve the understanding of the change processes of soil P fractions in low-P red soil, guide the rational selection of P sources, and improve the P efficiency.

2. Materials and Methods

2.1. Site Description and Experimental Design

The field trial experiment was initiated in May 2017 and conducted in the experimental station of Xiaoshao (24°54′ N and 102°41′ E, altitude 1820 m above the sea level), Kunming, Yunan, southwest China. This area has a northern subtropical monsoon climate, an average annual temperature of 14.4 °C, and precipitation of 850 mm. The soil is a typical low-phosphoric plateau red soil (Ferralsols, based on the USDA nomenclature), and its basic properties at 0–20 cm depth are pH 4.53, organic matter 4.50 g·kg−1, total phosphorus 190.00 mg·kg−1, nitrate nitrogen 2.19 mg·kg−1, Olsen-P 4.02 mg·kg−1, bulk density 1.36 mg·cm−3 at the commencement of the study.
With a split-plot random block design, the field study applied five P sources with three replicates. The five P application treatments were no P application (0, CK), calcium superphosphate (SSP, 16% P2O5), calcium magnesium phosphate (CMP, 12% P2O5), monoammonium phosphate (MAP, 50% P2O5), and diammonium phosphate (DAP, 46% P2O5). The P application rate was the same; applying potassium sulfate removed sulfur deficiency. The plot area was 24 m2 (4 m × 6 m), the row spacing of maize was 25 cm × 50 cm, with 25 cm edge distance, and the planting density was 75,000 plants·ha−1. Nitrogen, phosphorus, and potassium fertilizers were applied at the local conventional fertilization rates of 250 kg·N ha−1, 90 kg·P2O5 ha−1, and 75 kg·K2O ha−1, respectively. Each year before the maize was planted, all phosphorus and potassium fertilizers (50% potassium sulfate) were applied to all plots as base fertilizers, while nitrogen fertilizers (46% urea) were applied as base fertilizers, topdressing at trumpet stage (V6) and topdressing at big trumpet stage (V12), respectively, accounting for 4 0%, 25%, and 35% of the total nitrogen application rates, respectively.
This study focused on the years 2018 and 2019. Maize (‘Yunrui 88’) was sown in June and harvested in October. During sowing, 4 seeds were sown and appropriate irrigation was applied at each point to ensure the emergence, and then two uniform seedlings were maintained. Manual tillage and weeding were performed during the planting process. After harvesting, the aboveground straw was completely removed while root residues were kept in the field. The field management practices of irrigation, weeding, disease, and insect pest control were the same in all the experimental plots.

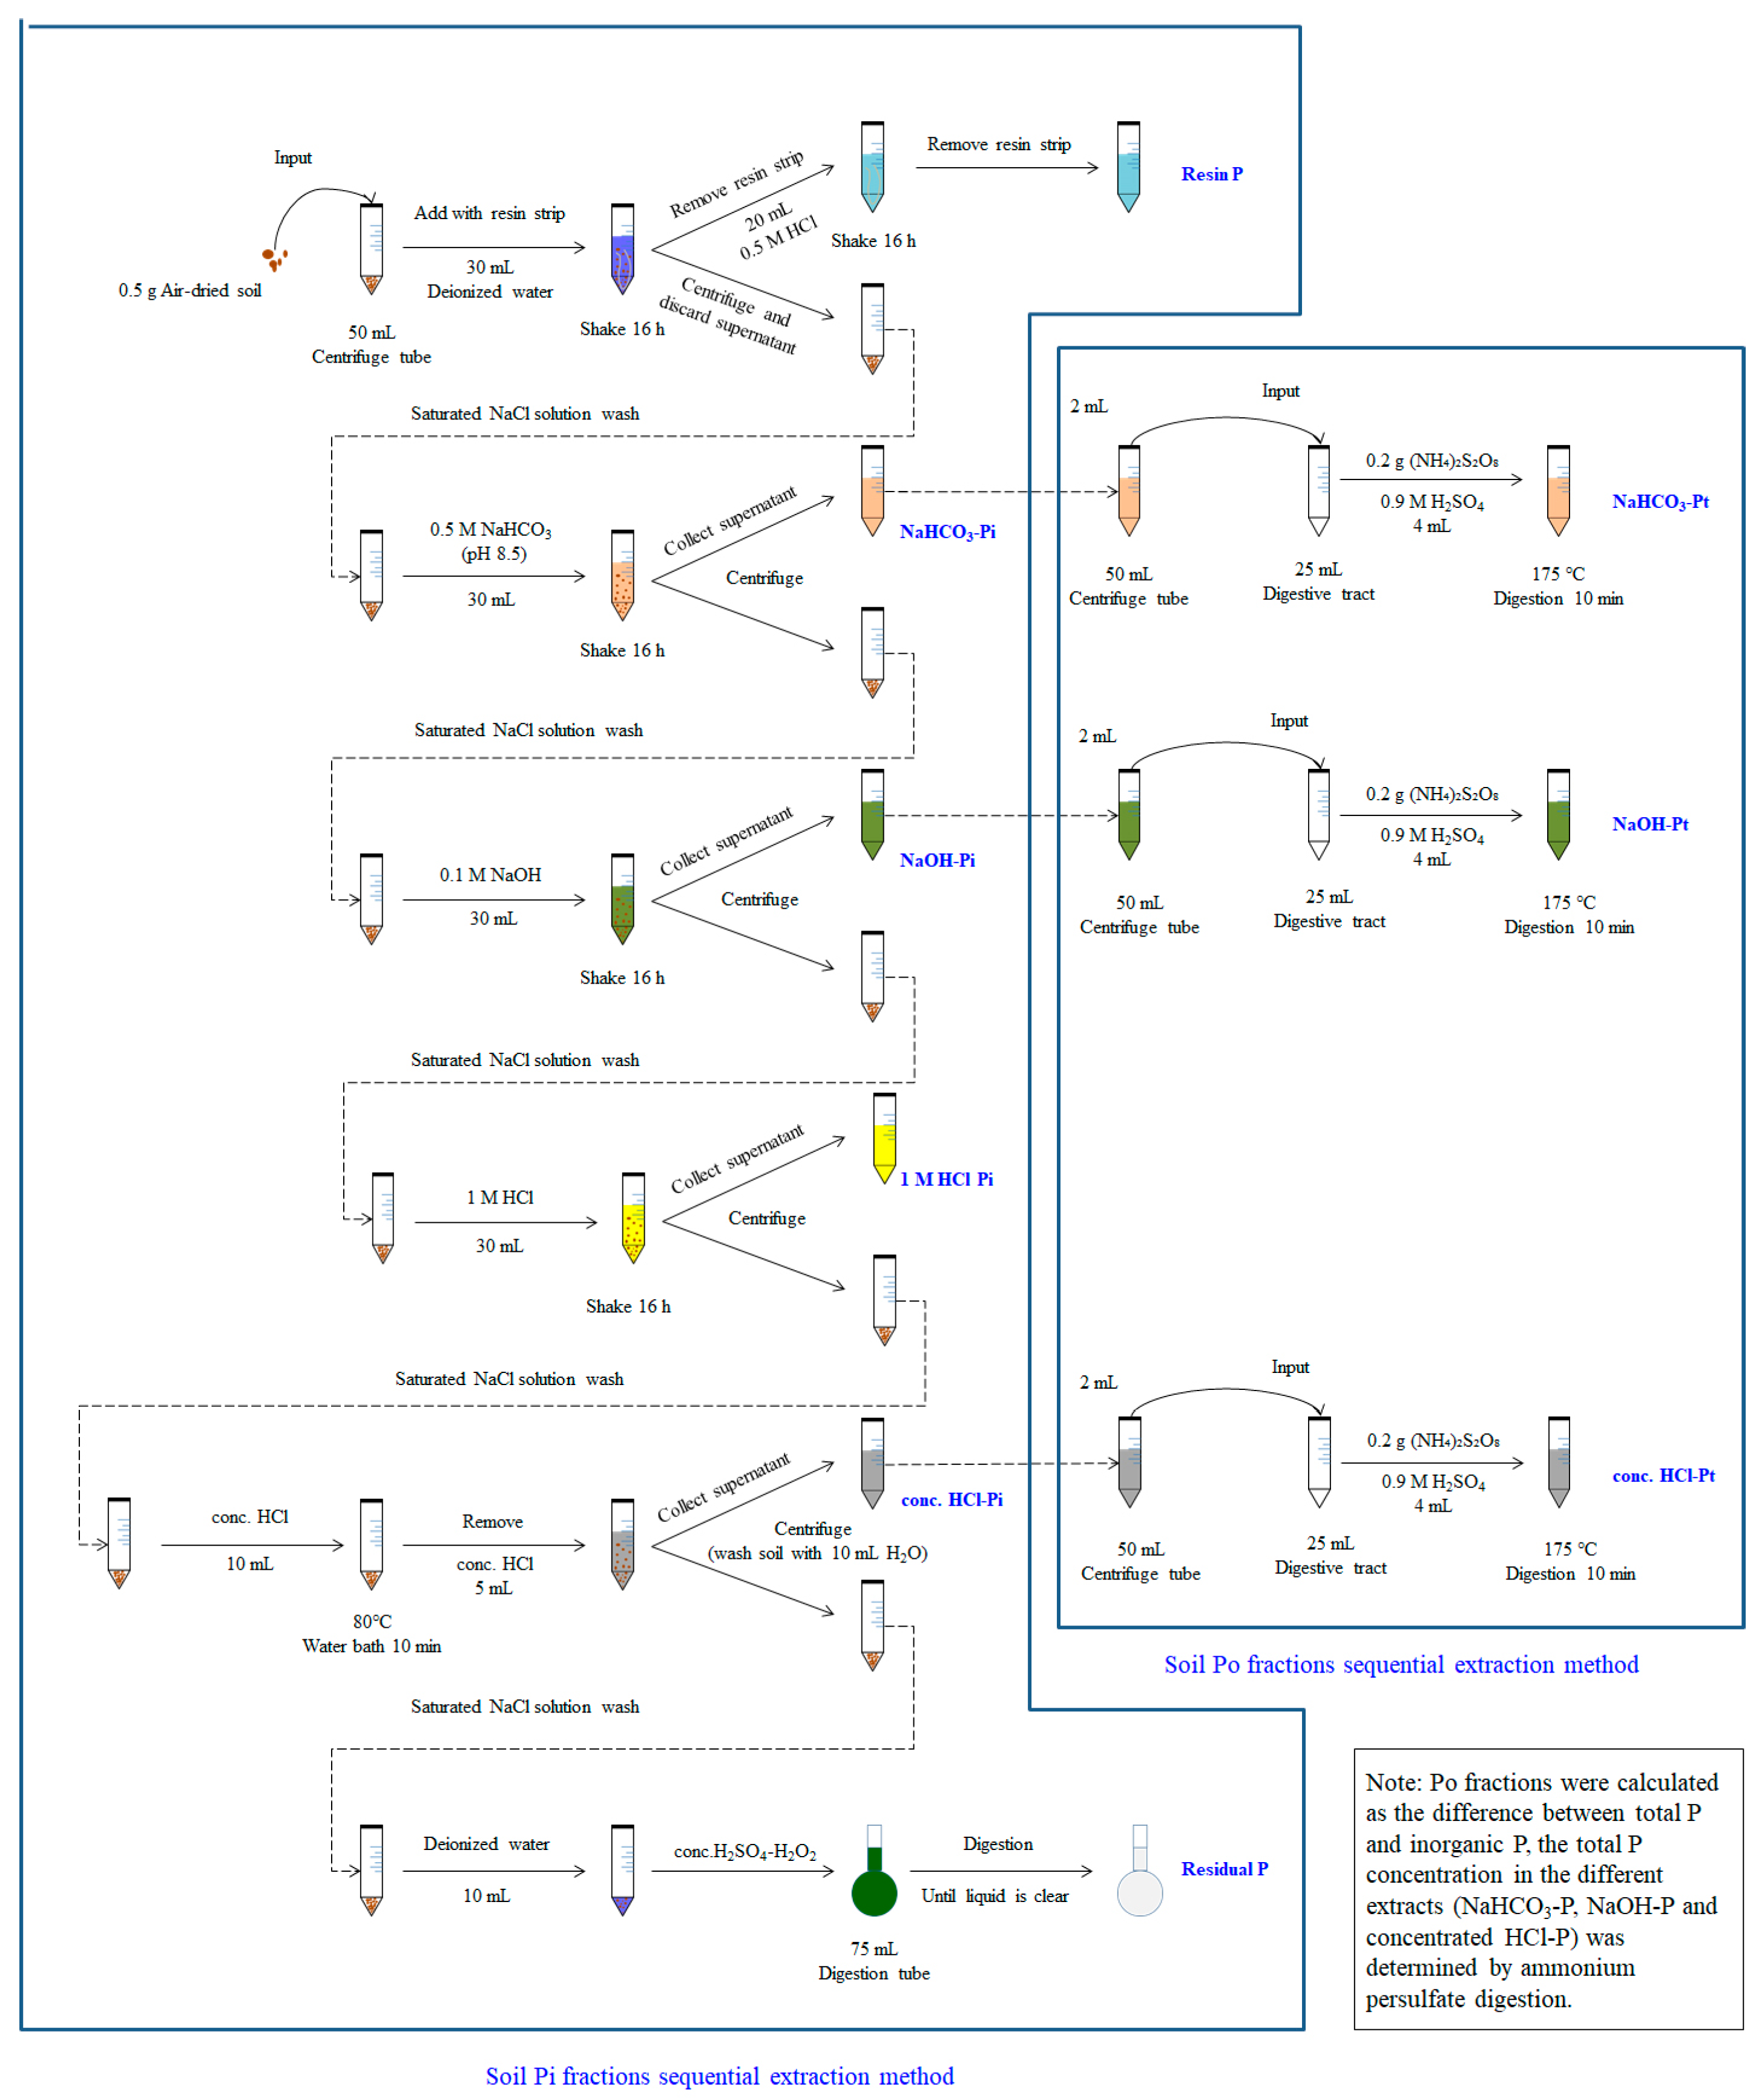
2.2. Sample Collection and Analysis

The plant samplings were conducted after the maize harvesting. At crop maturity each year, the central rows of each experimental block of maize were manually harvested, cut at 20 mm above the soil surface, and sampled plants were air dried for ten days. The dried maize plants were manually threshed and weighed to determine dry matter, then converted into kg ha−1. Four representative maize plants were selected to mix, crumble, and pass through a 0.15 mm nylon sieve for further analyses. The samples were used for measurement of P concentrations by first digesting in a mixture of concentrated H2SO4 and H2O2, and, then, using the molybdovanadophosphate method [24], the P uptake was measured by multiplying the total dry matter of the P content and calculated in kg ha−1.
Soil samplings were collected at maize maturity. Soil cores, 2.5 cm diameter and 20 cm depth, were randomly selected from each plot [14]. After the removal of gravel, straw, and other sundries, 500 g soil samples were taken by the quartering method and stored in plastic bags. Air-dried soil samples were ground through 0.25 and 1.00 mm nylon sieves for measuring soil physiochemical properties and P fraction.
Soil pH was measured using a glass electrode pH meter with a 1:2.5 soil/deionized water ratio [25]. Soil Olsen-P was extracted with 2.50 g samples under 0.5 M NaHCO3 at pH 8.5, 1 g of phosphorus-free activated carbon, 50.0 mL of sodium bicarbonate extract at 25 ± 1 °C, using an oscillator at a temperature of 25 ± 1 °C and 180 r/min ± 20 r/min for 30 ± 1 min, and then determined by the ascorbic acid–molybdophosphate blue method [26]. The SOM was analyzed by the potassium dichromate oxidation method with 0.167 M K2Cr2O7 [27]. Free iron (Fe2O3) was determined by sodium dithionite-sodium citrate-sodium bicarbonate (DCB) method [28], and calcium carbonate (CaCO3) was determined by burning weight loss method [29]. The P fractions were determined by sequential fractionation, as proposed by Hedley et al. [19] and modified by Tiessen and Moir [30]. The soil P fraction sequential extraction steps and soil Org-P determination method are shown in Figure 1. Total P concentration in the NaHCO3-P, NaOH-P, and conc. HCl-P extracts was determined using ammonium persulfate digestion, and the Po concentrations were calculated as the difference between total P and Pi [22]. Among them, the labile P pools mainly include resin-P, NaHCO3-Pi, NaHCO3-Po; the moderately P pools mainly include NaOH-Pi, NaOH-Po, 1.0 M HCl-Pi; and the non-labile P pools mainly include conc. HCl-Pi, conc. HCl-Po, and residual-P [22].

2.3. Data Processing and Statistical Analysis

The P uptake in the crop ([grain yield × P concentration of grain] + [straw yield × P concentration of straw]) for each crop was expressed in kg P ha−1 year−1. The total P content was calculated through all P fractions. The P activation coefficient was calculated as a proportion of Olsen-P to total P [31].
All data were expressed as the average of three replicates and the standard deviation was calculated. Significant differences among all treatments were examined by one-way analysis of variance (ANOVA), and the treatment averages were compared by the test of least significant differences (LSD) at p = 0.05 using IBM-SPSS Statistic 24.0 (SPSS, Chicago, IL, USA). One-way ANOVA analyses were conducted to identify significant differences between the years (Y) and P sources (P). The two-way ANOVA analyses were conducted to identify the interaction effect of both years (Y) and P sources (P). Redundancy analysis (RDA) was performed to identify the dominant and P uptake that could explain the changes in soil P fractions and P pools using Canoco version 5.0 for windows (Cambridge University Press, Cambridge, UK). The random forest model was used to explore the main predictors of the P uptake, Olsen-P and PAC% based on “randomorest” and the “rfPermute” packages in R software (version 4.1.1) [32].

3. Results

3.1. P Uptake of Maize

Two years of field localization experiments showed that year (Y), P sources (P), and the interaction of the year (Y) and P sources (P) had a significant effect on P uptake (p < 0.01) (Figure 2). The application of different P sources significantly increased the P uptake of maize (Figure 2). The P uptake was increased by 1.13~2.23-times and 2.06~4.11-times in 2018 and 2019, respectively. Under different P application treatments, P uptake was the highest in SSP treatment, much higher than that in MAP, DAP, and CMP treatments, with increases of 22.3%, 51.2%, and 24.1% in 2018, and 56.0%, 67.3%, and 21.3% in 2019, respectively (Figure 2). Otherwise, CMP treatment increased P uptake by 21.9% compared with DAP treatment in 2018, and by 28.6% and 37.9% compared to MAP and DAP treatments in 2019, respectively.

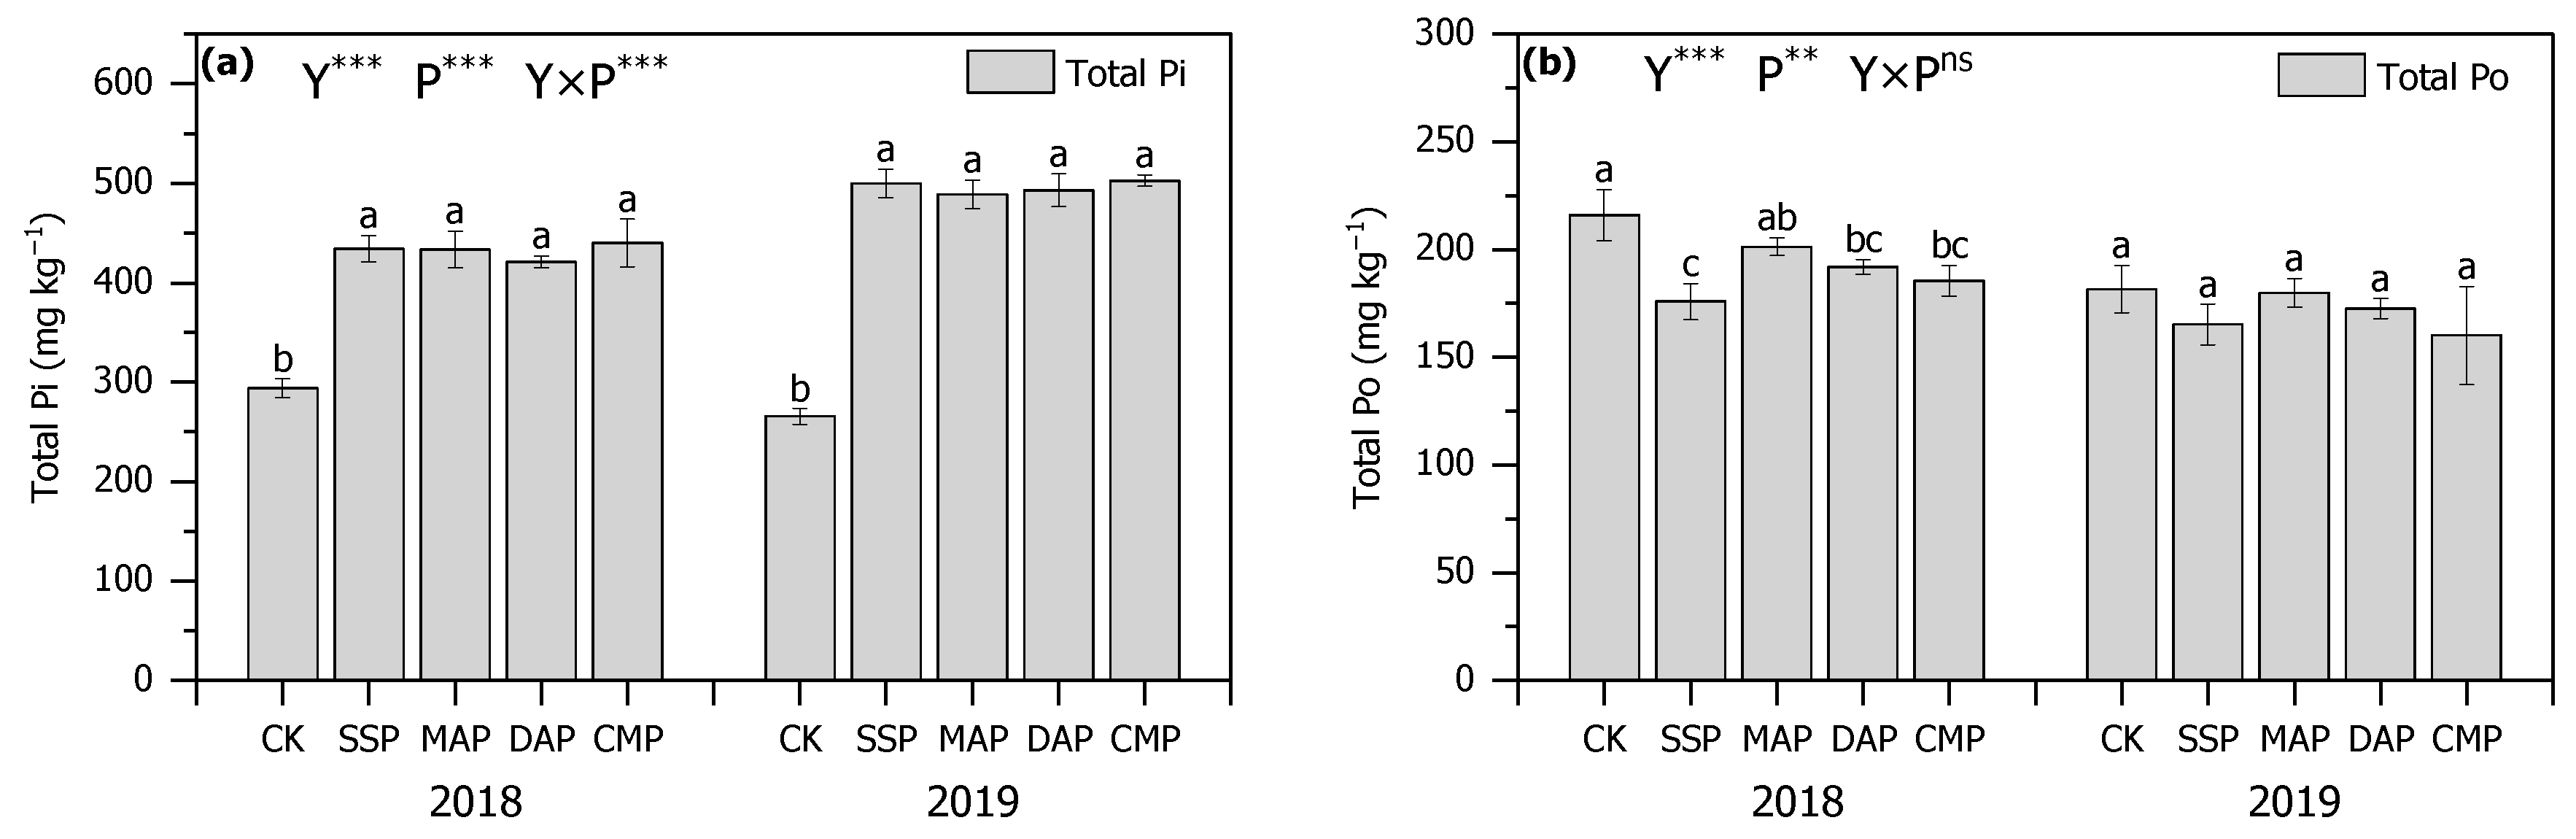
3.2. Olsen-P, Total P, and P Activation Coefficient of Soil

Figure 3 shows the changes in Olsen-P, total P, and PAC% affected by P fertilizer application at 0–20 cm soil depth covering two growing seasons. The two-way ANOVA results showed that the year (Y), P sources (P), and the interaction of the year (Y) and P sources (P) significantly affected the content of Olsen-P, total P, and PAC% (p < 0.01) (Figure 3). In comparison to CK treatment, P application increased soil Olsen-P, total P, and PAC%. Under different P source applications, soil Olsen-P was increased by 112.1~241.2%, 177.5~319.6% and total P was increased by 19.7~24.6% and 48.2~49.6%, and PAC% was increased by 76.4~184.9% and 84.8~180.7% in 2018 and 2019, respectively.
In addition, soil Olsen-P and PAC% were different among different P sources. In 2018, SSP and CMP treatments had significantly higher Olsen-P and PAC%. Soil Olsen-P was significantly increased by 28.9% and 28.4%, and PAC% was increased by 33.6% and 30.1% compared with MAP treatment, respectively. Furthermore, SSP and CMP treatments also significantly increased Olsen-P by 60.9% and 60.2%, and PAC% by 61.5% and 57.3% than DAP treatment, respectively. In 2019, the CMP and DAP treatments showed higher Olsen-P, and the MAP had the lowest soil Olsen-P. The MAP treatment reduced Olsen-P by 21.8%, 33.9%, and 32.8% related to SSP, DAP, and CMP. The PAC% was not significantly different. Soil total P showed no significant differences among all the treatments (Figure 3).

3.3. P Fractions of Soil

The application of different P sources significantly affected total inorganic P (Pi) and total organic P (Po). The two-way ANOVA results showed that the year (Y), P sources (P), and the interaction of the year (Y) and P sources (P) significantly affected total Pi, while the year (Y) and P sources (P) also significantly affected total Pi (p < 0.01) (Figure 4). Compared with CK treatment, P application significantly increased total Pi for all the P fertilizer sources in 2018 and 2019, respectively, but total Po was not significantly different among all the treatments in 2019 (Figure 4). Specifically, compared to CK treatment, P application significantly raised soil Pi from 43.3% to 49.8% and 84.2% to 89.3% in 2018 and 2019, respectively (Figure 4a). However, P application significantly depleted Po by 18.6%, 11.1%, and 14.1% at SSP, DAP, and CMP treatments, respectively, in 2018 (Figure 4b).
According to the differences in P availability among the soil P fractions, we categorized the nine P fractions into three P pools: labile P, moderately labile P, and non-labile P. The P application significantly enhanced the content of all three P pools (Figure 5). The two-way ANOVA results showed that the year (Y), P sources (P), and the interaction of the year (Y) and P sources (P) significant extremely affected the labile P pool (p < 0.001). Otherwise, the P sources (P) also extremely significantly affected the moderately labile P pool (p < 0.001), the P sources (P), and the interaction of the year (Y) and P sources (P) also significantly affected the labile P pool (p < 0.01) (Figure 5). Compared with CK, P application significantly increased labile P pools from 58.3% to 146.4% and 276.9% to 362.1%, and moderately labile P pools from 29.7% to 52.9% and 49.8% to 68.3% for all the P fertilizer sources in 2018 and 2019, respectively (Figure 5a,b). The SSP treatment significantly increased labile P pools by 21.4% and 18.1% compared to MAP treatment, and labile P pools by 55.7% and 22.6% compared to DAP treatment in 2018 and 2019, respectively. Furthermore, the CMP treatment significantly enhanced the labile P pool 15.4% than the MAP treatment in 2018, and 47.9% and 12.4% than the DAP treatment in 2018 and 2019, respectively. The MAP treatment significantly increased the labile P pool by 21.4%. In addition, the MAP treatment significantly enhanced the moderately labile P pool by 17.9% and 10.5% than the SSP and CMP treatments, the DAP treatment significantly increased the moderately labile P pools by 15.2% and 7.9%, and the CMP treatment significantly increased the moderately labile P pools by 6.7% relative to the SSP treatment in 2018 (Figure 5b). The P application increased the non-labile P pool, the CMP treatment significantly increased the non-labile P pool by 11.0% in 2018, and all the P application treatments (SSP, MAP, MAP and CMP) increased the non-labile P pool ranging from 29.3% to 23.3% in 2019 (Figure 5c).
Different P source supplies and years significantly influenced soil labile P fractions. The two-way ANOVA results showed that the year (Y), P sources (P), and the interaction of the year (Y) and P sources (P) all significantly affected the content of resin-P, NaHCO3-Pi, NaHCO3-Po (p < 0.01). The P application caused larger resin-P, NaHCO3-Pi, NaHCO3-Po P fractions over two consecutive growing seasons. Compared with CK, the P application increased the concentrations of resin-P, NaHCO3-Pi, NaHCO3-Po from 85.8% to 337.3%, 419.0% to 1004.7%, and 6.4% to 265% in these two years, respectively (Figure 6).
All labile P fractions were significantly different under different P sources (SSP, MAP, DAP, and CMP) in the same year, and there was an obvious difference between SSP and CMP treatments and MAP and DAP treatments (Figure 6). The SSP treatment significantly increased resin-P and NaHCO3-Pi by 135.4% and 56.6% relative to the MAP treatment, increased resin-P, NaHCO3-Pi, and NaHCO3-Po by 41.7%, 75.2%, and 44.8% compared with DAP, and NaHCO3-Pi by 25.7% than the CMP treatment in 2018, respectively. Furthermore, the CMP treatment increased resin-P and NaHCO3-Pi by 89.2% and 24.6% relative to the MAP treatment, while NaHCO3-Pi and NaHCO3-Po by 39.4% and 55.4% in 2018, respectively. In 2019, the SSP treatment significantly increased NaHCO3-Pi by 32.6% compared with MAP treatment, NaHCO3-Pi by 41.7% than the DAP treatment, and NaHCO3-Pi by 20.2% but reduced resin-P by 19.1% compared with the CMP treatment, respectively. The CMP treatment increased resin-P by 76.2% more than the MAP treatment in 2019 (Figure 6).

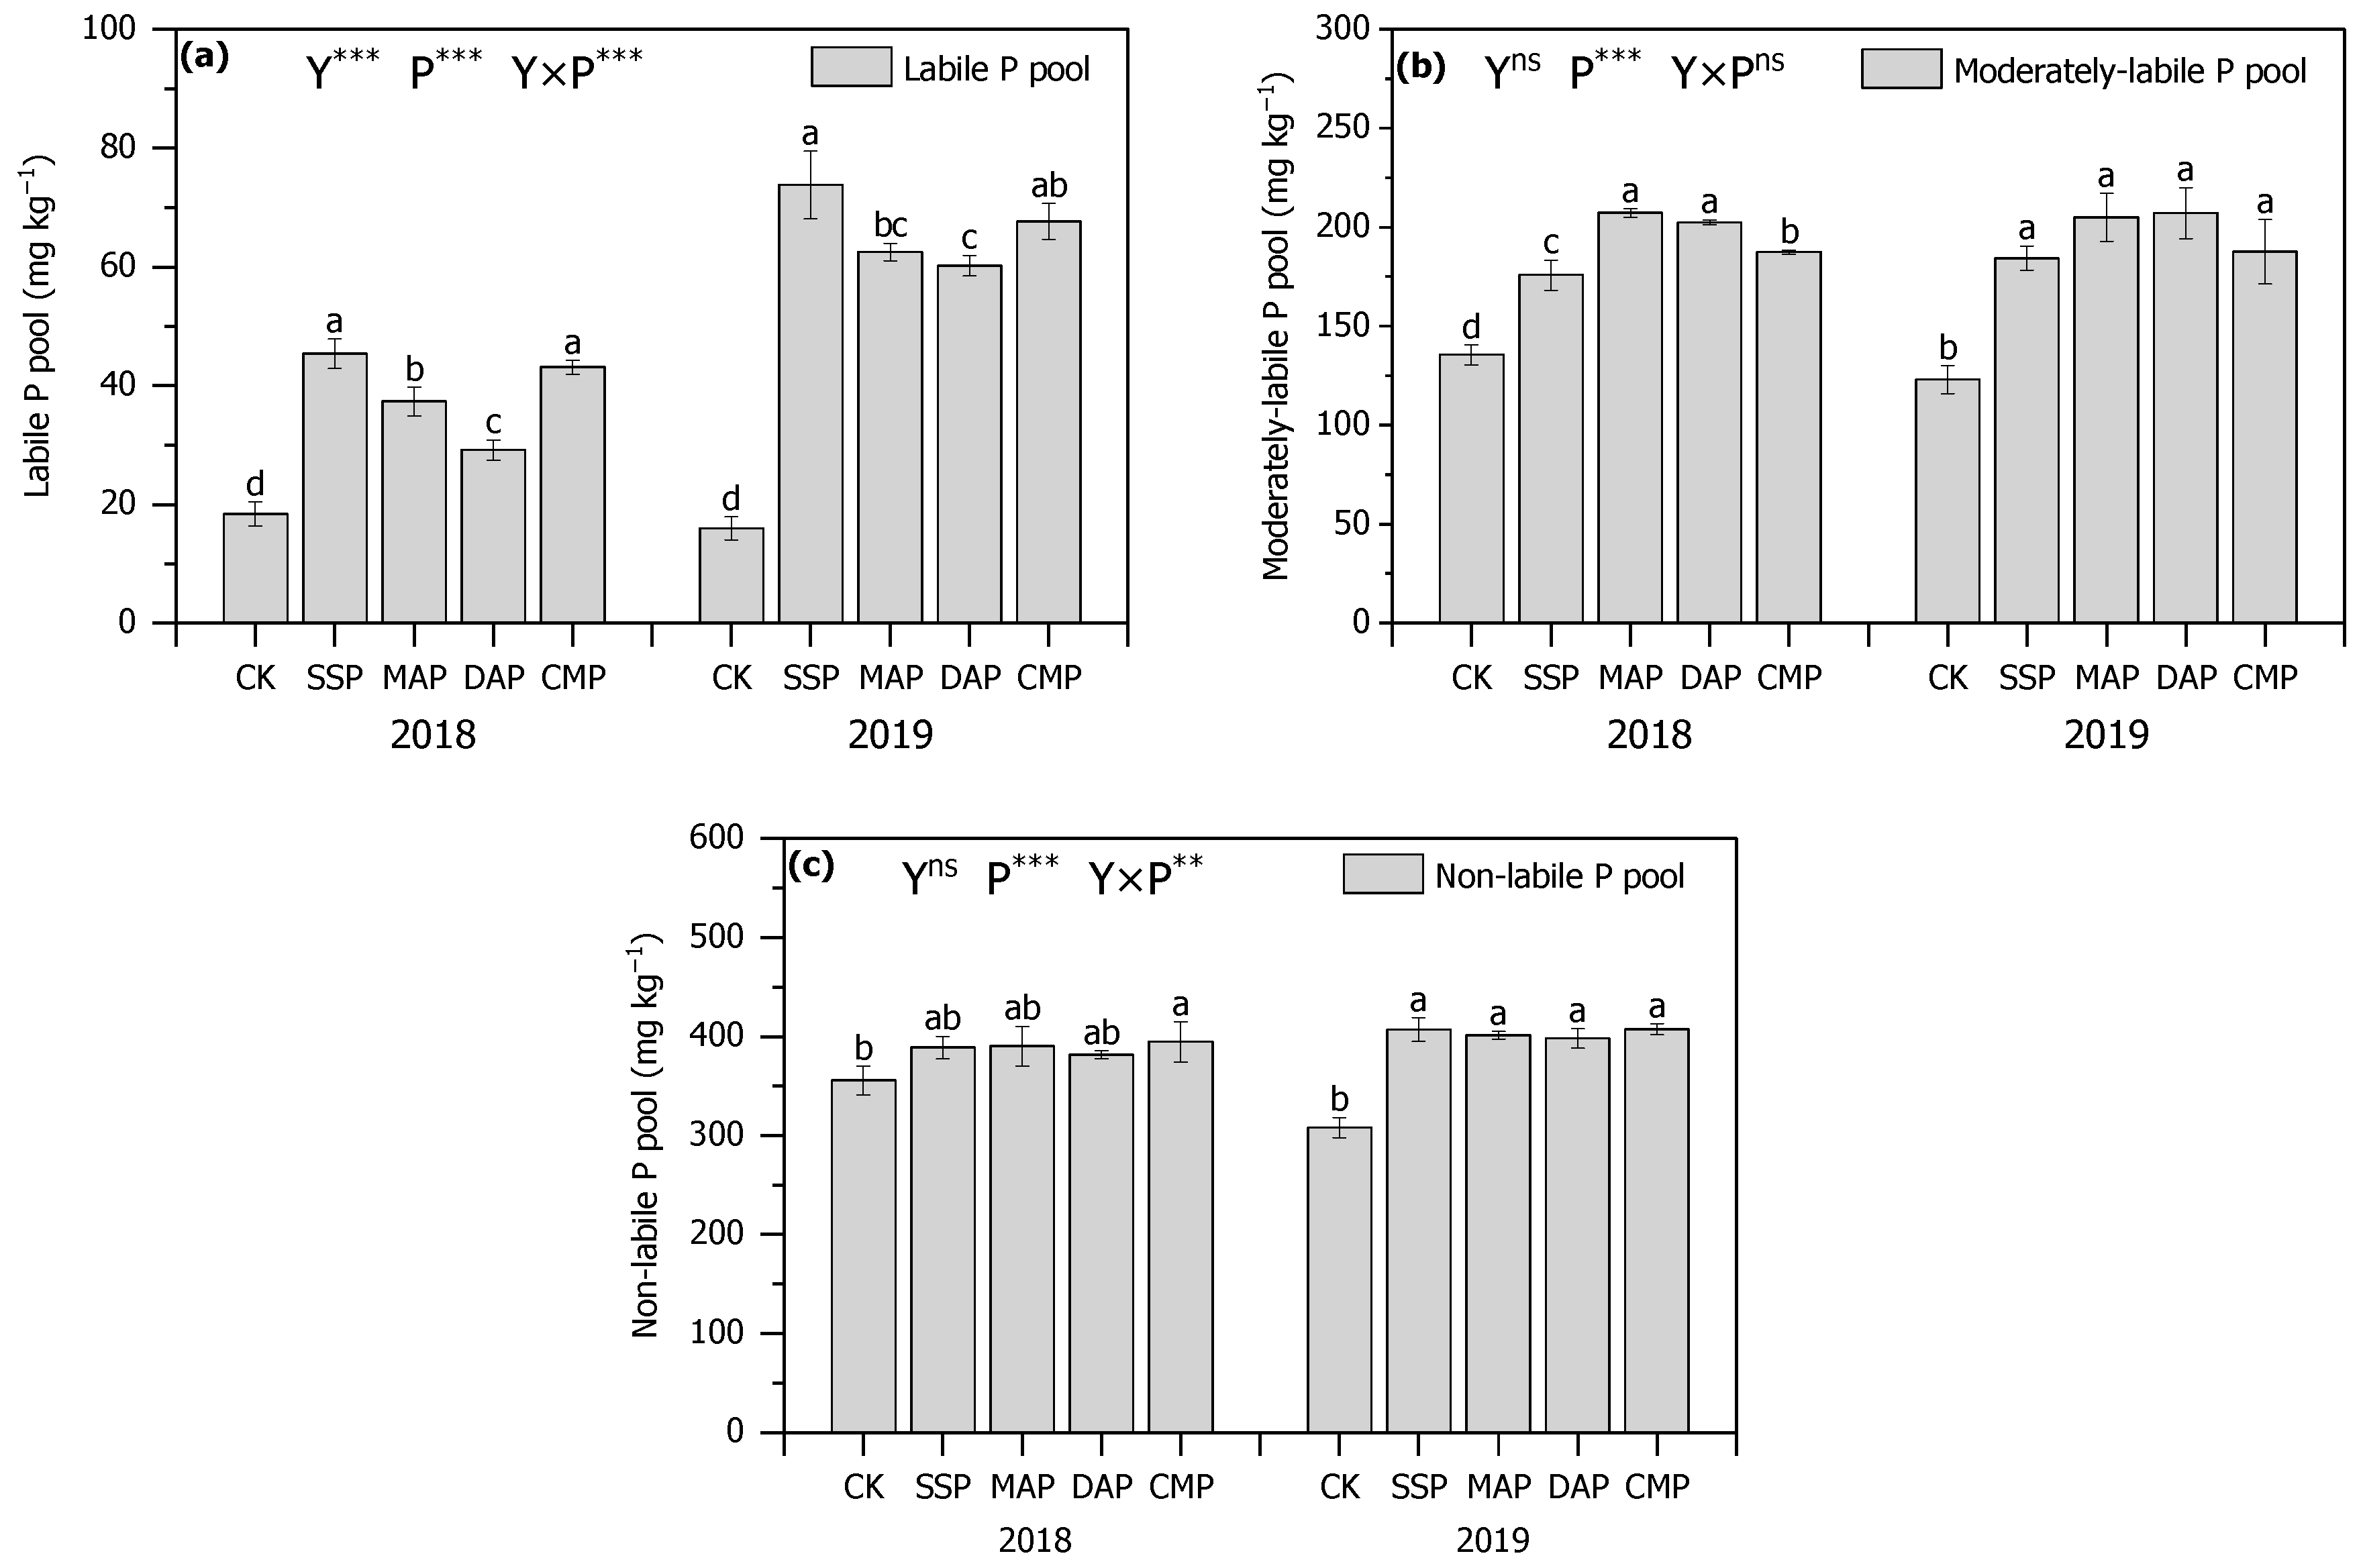
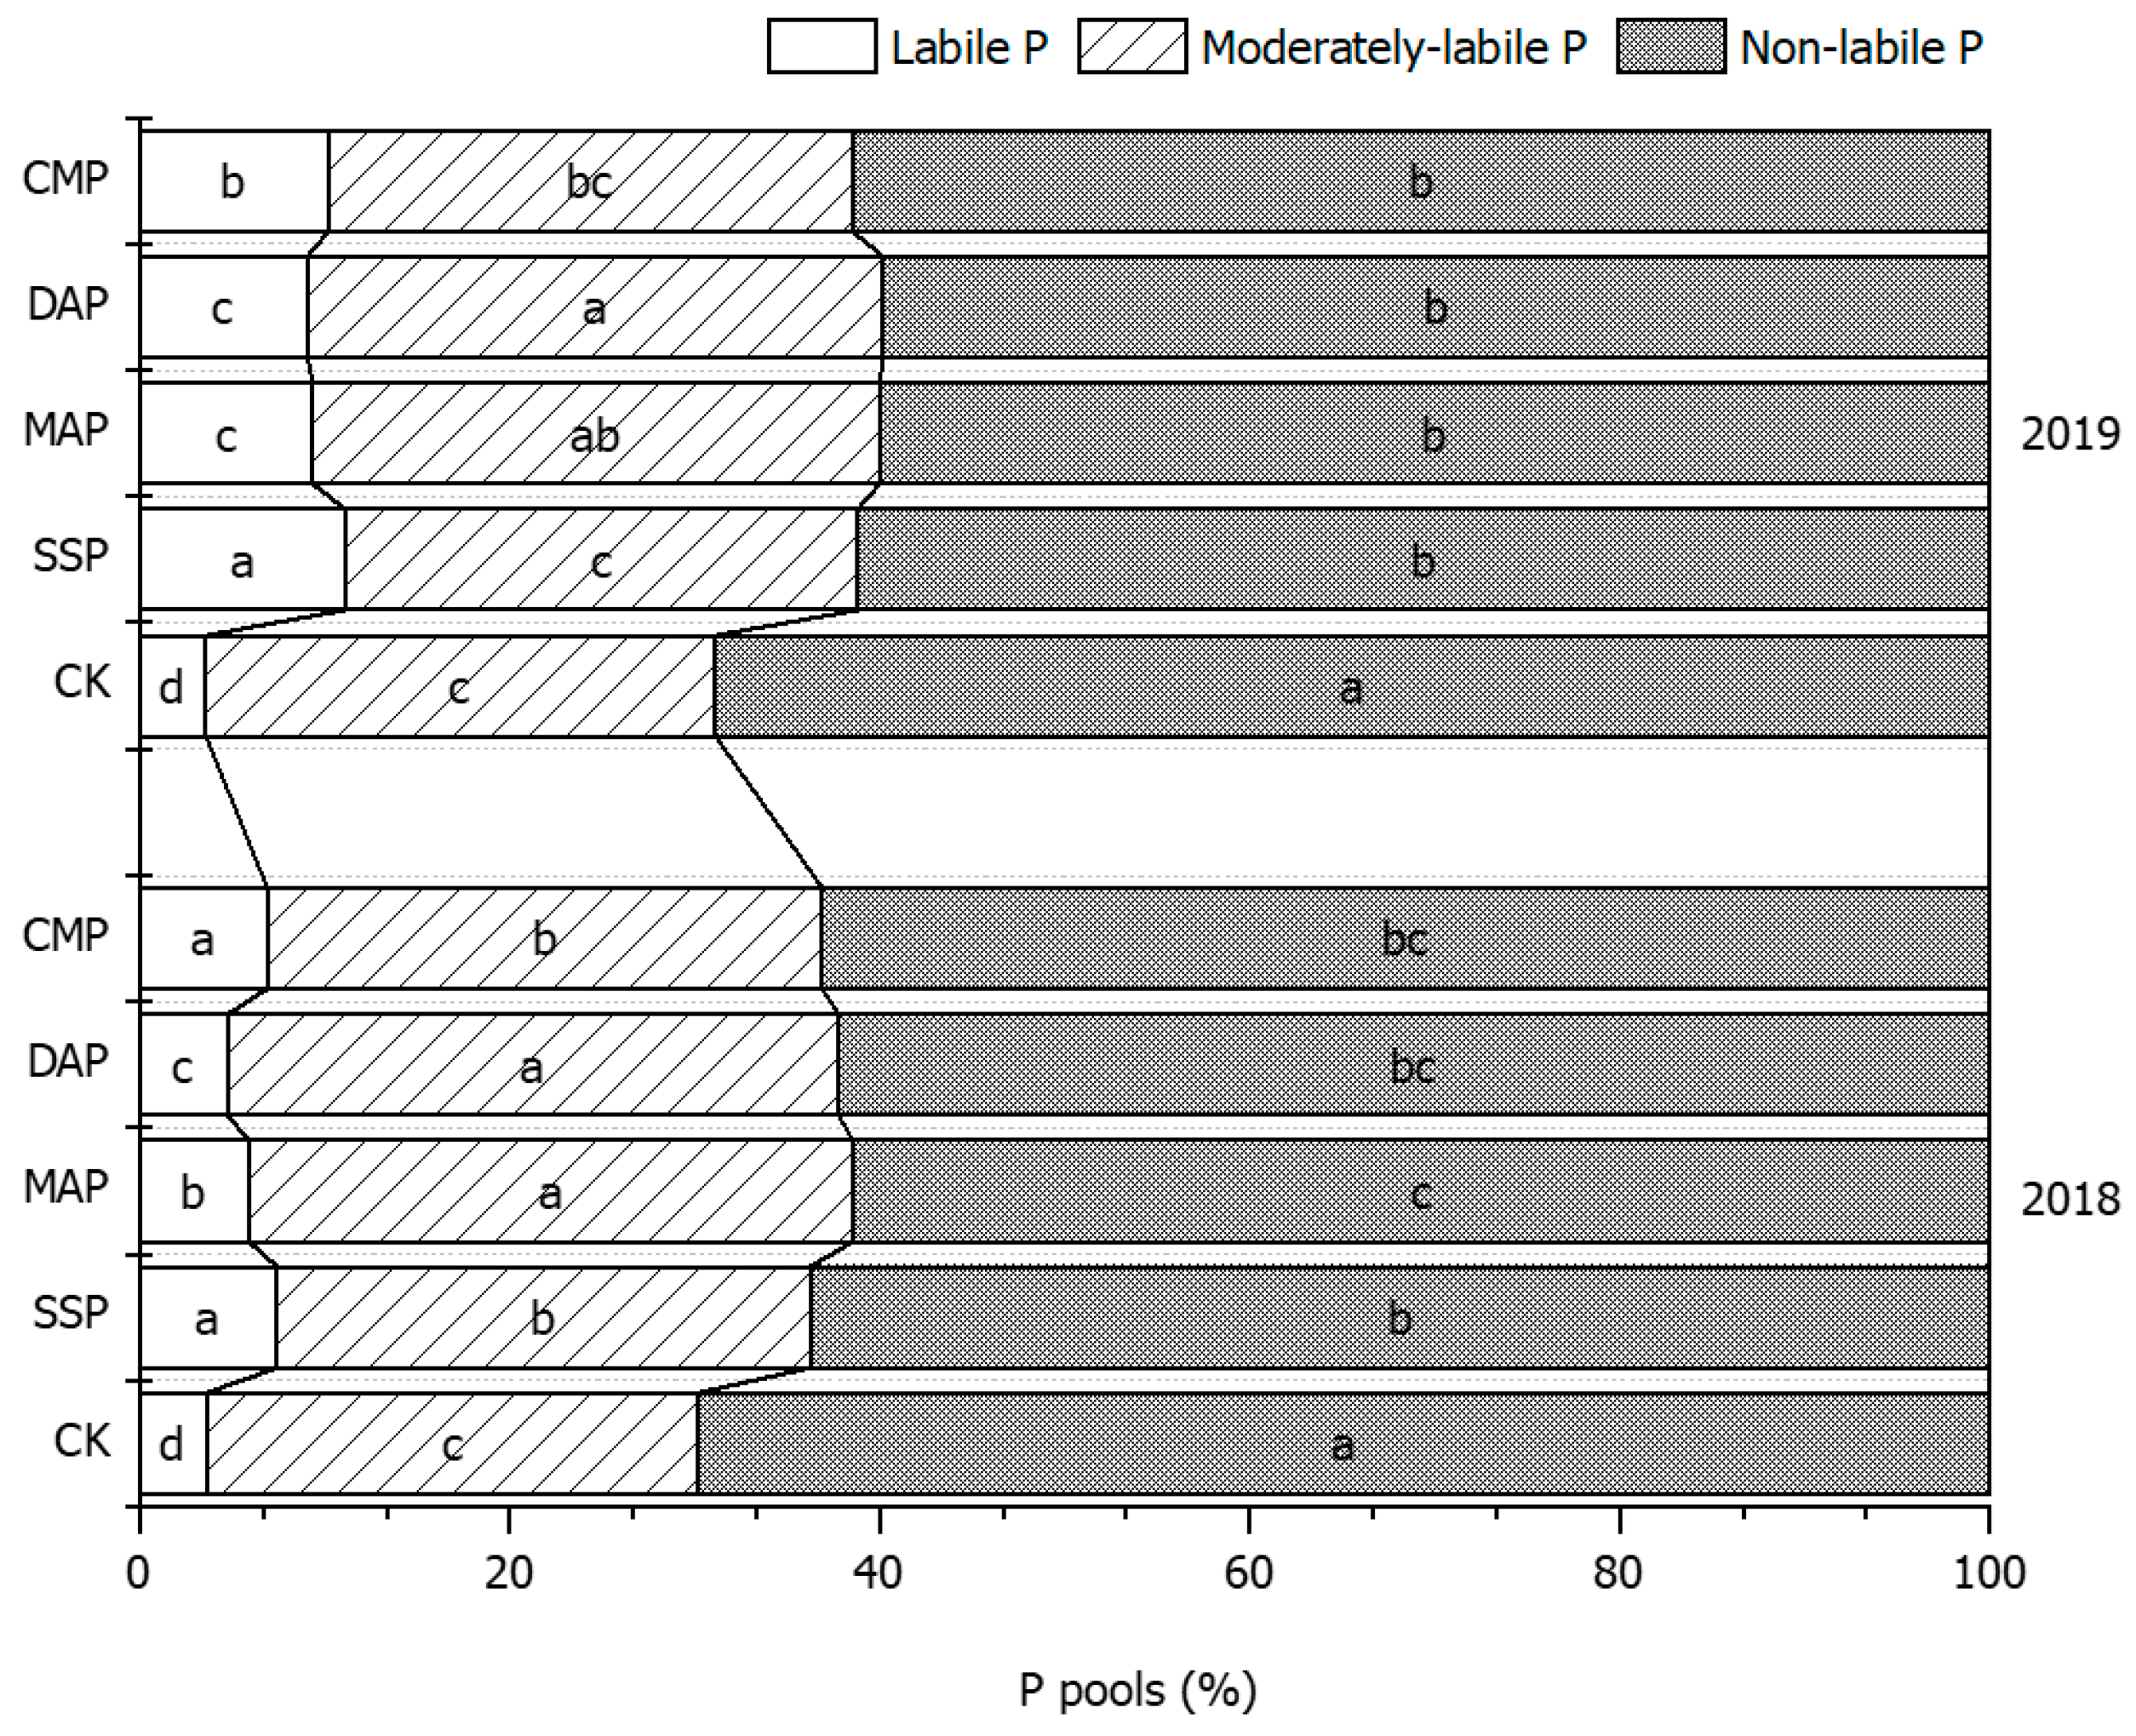
3.4. P Pool Composition of Soil

The labile P pool was the sum of resin-P plus NaHCO3-Pi plus NaHCO3-Po pools, the moderately labile P was the sum of NaOH-Pi plus NaOH-Po plus 1.0 M HCl-Pi pools, and the non-labile P was the sum of conc. HCl-Pi plus conc. HCl-Po plus residual P pools. In the two consecutive growing seasons, the non-labile P pool represented the greatest proportion of total P, ranging from 61.5 to 69.8% and 59.8 to 68.9% (in 2018 and 2019), followed by the moderately labile P pool slightly changing from 26.6% to 33.0% and 27.5 to 31.1%, and the labile-P pools represented only 3.6 to 7.4% and 3.6 to 11.1% (Figure 7). The P application greatly affected the proportion of these pools of the total P. Compared with CK treatment, the P application significantly increased the proportion of labile P pool and moderately labile P while significantly reducing the proportion of the non-labile P (Figure 7). Furthermore, the SSP treatment exhibited a higher proportion of labile P, followed by CMP treatment, greater than MAP and DAP treatments. Simultaneously, the DAP and MAP treatments showed a lower proportion of moderately labile P than the SSP and CMP treatments (Figure 7).

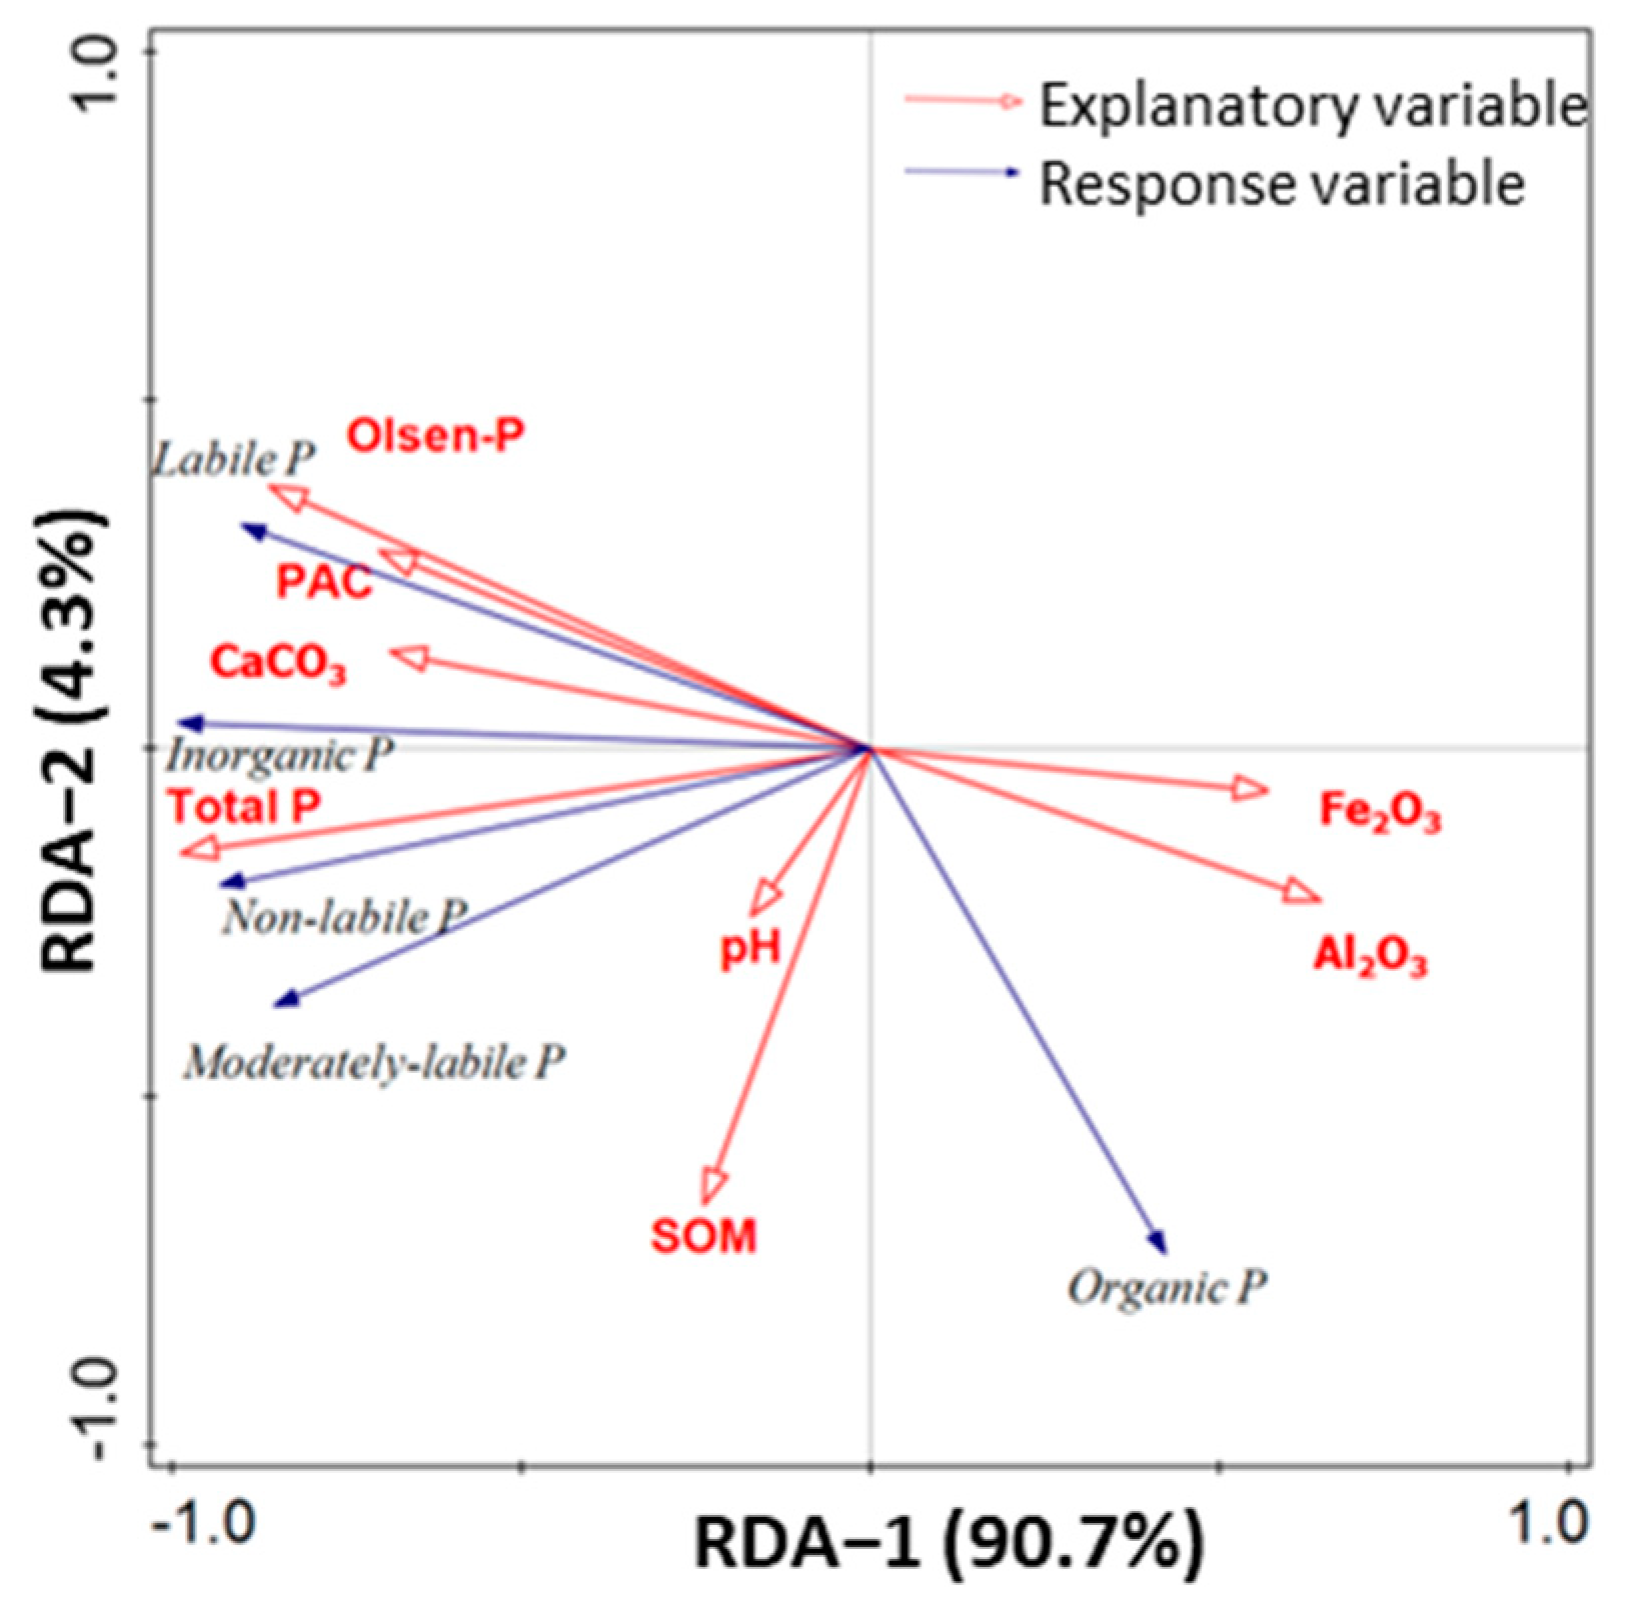
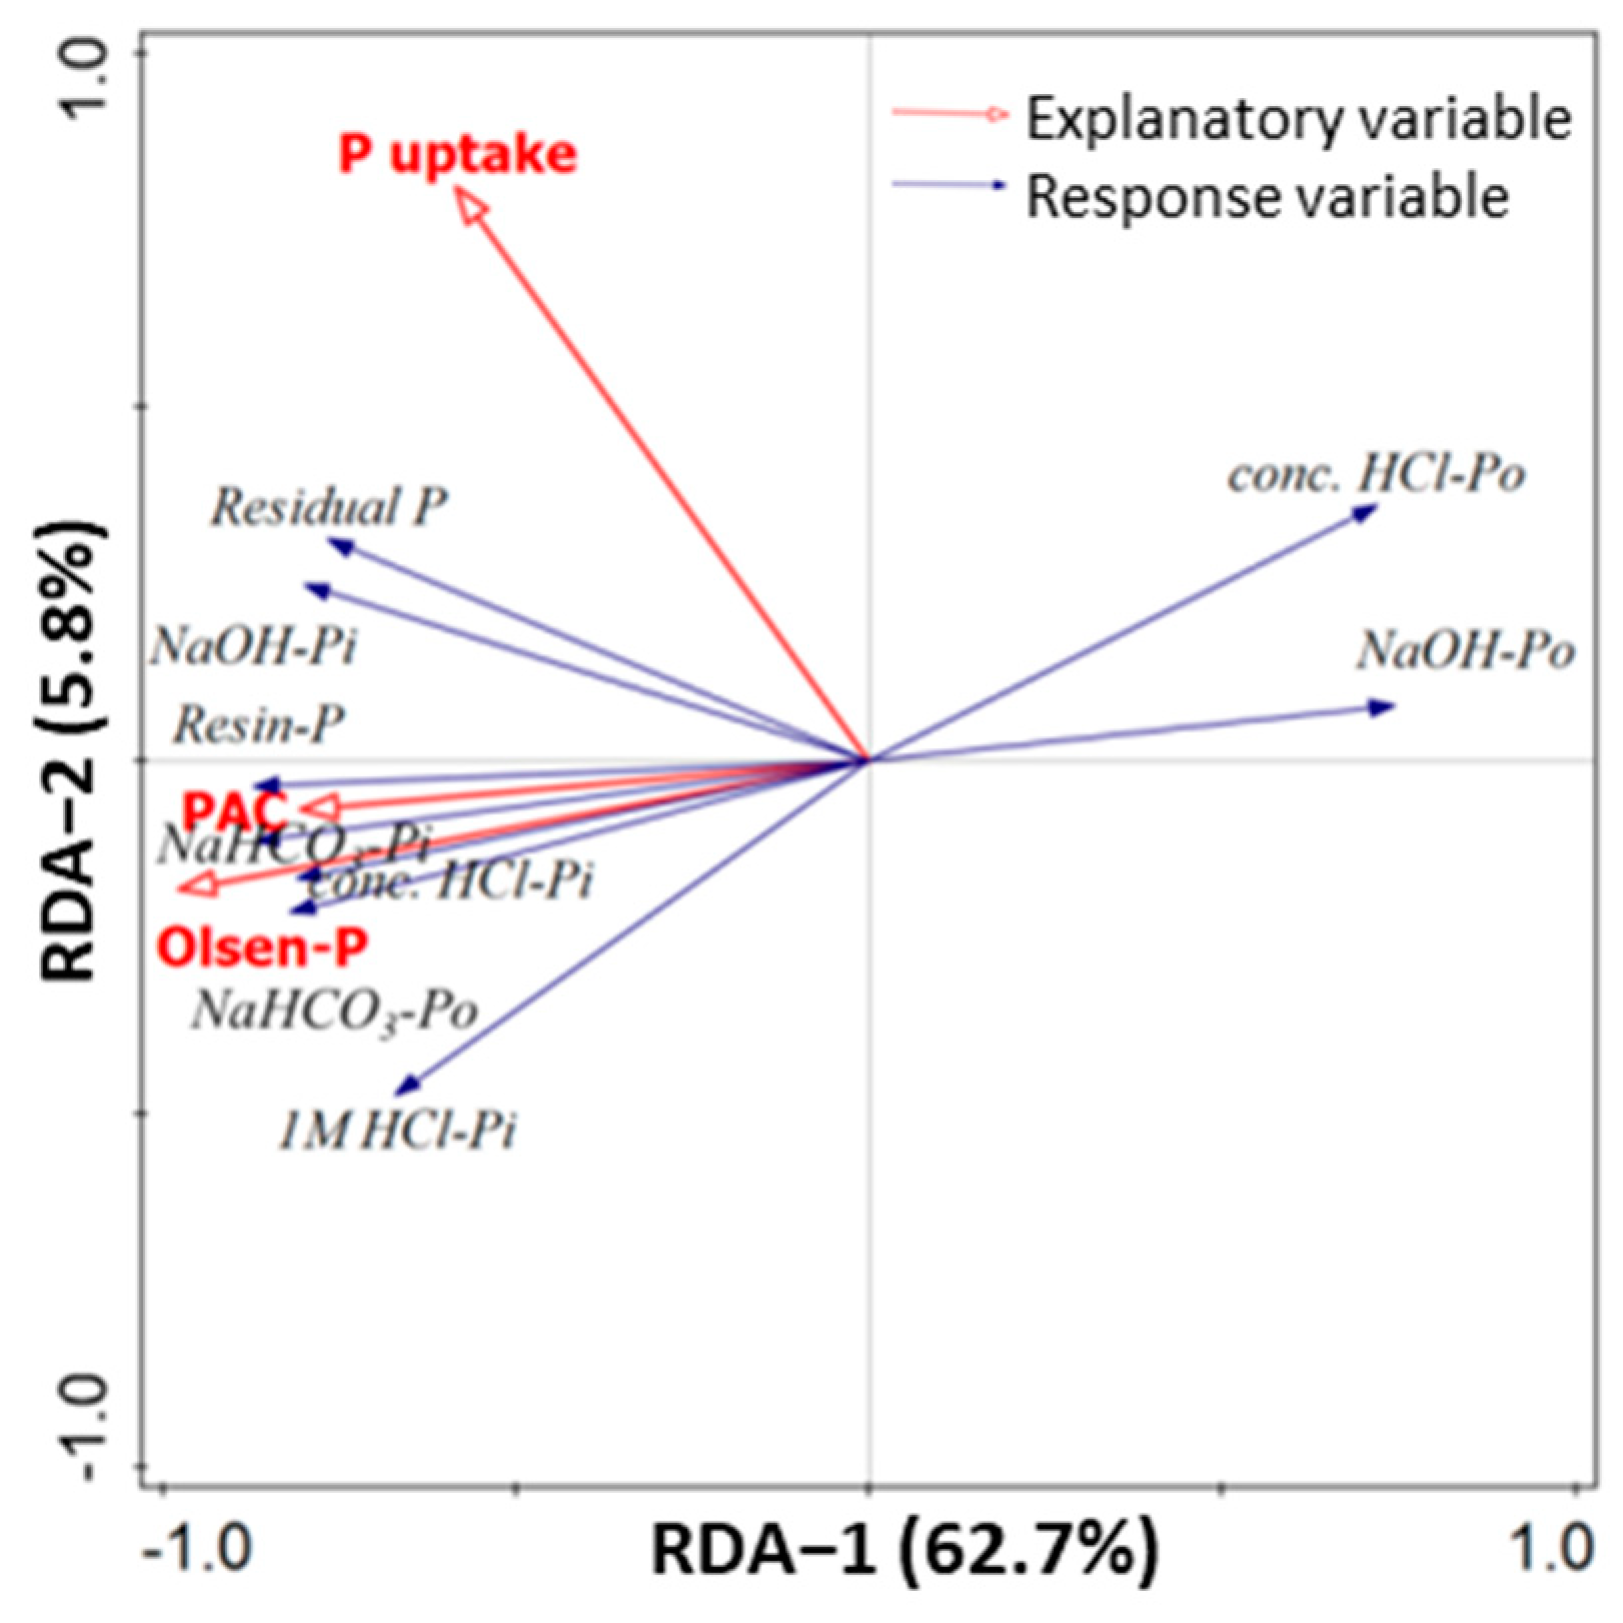
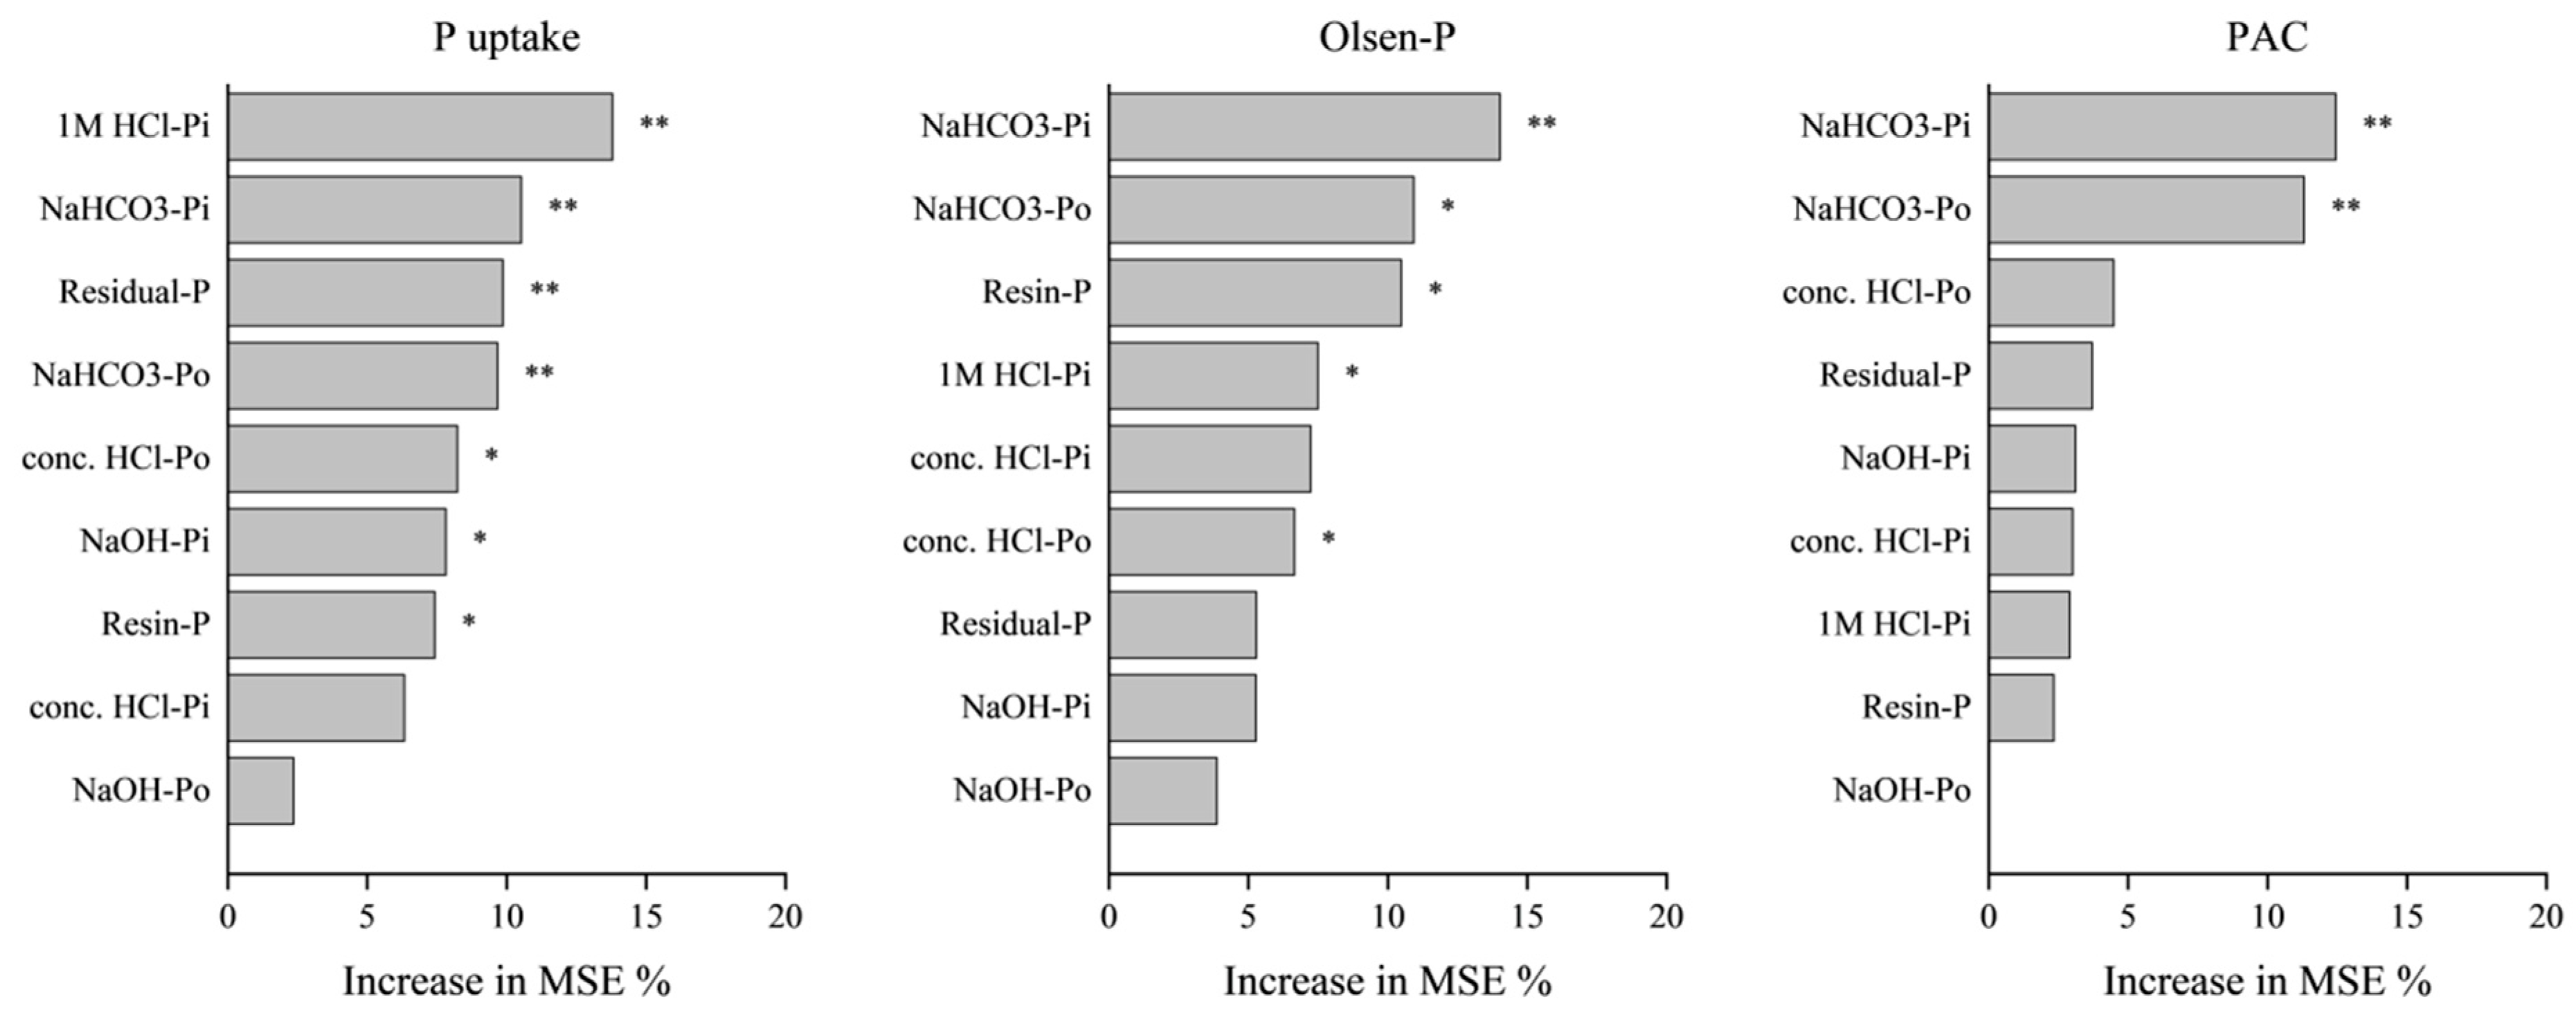
3.5. Relationships of Soil P Fractions with Crop P Uptake and Soil Chemical Factors

Soil physicochemical indexes were closely related to soil P transformation. Two-year field experiments showed that soil pH ranged from 4.3 to 5.2, SOM ranged from 4.1 to 12.7 g kg−1, Fe2O3 from 118.5 to 148.9 mg kg−1, Al2O3 from 21.5 to 33.0 mg kg−1, and CaCO3 from 1.5 to 4.0 g kg−1 under different P application treatments. The RDA analyzed the relationships between the variable soil chemical factors and soil P fractions (Figure 8). The soil chemical properties’ factors were considered explanatory variables, and the P pools and P fractions were considered response variables. In the RDA plot, the angles between the explanatory and response variables or between the explanatory (or response) variables themselves showed their correlations, and the relationship between the centroid of a qualitative response variable and explanatory variable was also observed by projecting the centroid at a right angle to the variable. A high correlation between variables was represented by smaller angles between arrows, and positive or negative correlations were represented by the direction of the arrows. The RDA plot revealed that soil chemical variables explained almost 95.0% of the variations in the different soil P fractions, while the RDA-1 and RDA-2 ordination axes accounted for 90.7% and 4.3%, respectively, of the total variation between soil chemical properties and P pools (Figure 8). The total P, Olsen-P, and PAC% showed a significant and high degree of explanation. Otherwise, the labile P positively correlated with Olsen-P and PAC% but negatively correlated with Fe2O3 and Al2O3, while non-labile P positively correlated with total P.
The RDA plot also showed the relationships among soil P fractions, P uptake, Olsen-P, and PAC% (Figure 9). The P uptake, Olsen-P, and PAC% were considered explanatory variables, and soil P fractions were considered response variables. The RDA plot revealed that the P uptake, Olsen-P, and PAC% explained almost 68.5% of the variations in the different soil P fractions; the RDA-1 and RDA-2 ordination axes accounted for 62.7% and 5.8%, respectively, of the total variation between the P uptake, Olsen-P and PAC%, and P fractions (Figure 9). The PAC% and Olsen-P positively correlated with the labile P (resin-P, NaHCO3-Pi and NaHCO3-Po) and moderately labile P (NaOH-Pi and 1 M HCl-Pi).
To further quantify the relative influence of soil P fractions to P uptake and Olsen-P under different P sources, the relative influence of soil P fractions to P uptake, P Olsen-P, and PAC% was analyzed using the random forest model (Figure 10). The 1.0 M HCl-Pi exhibited the largest random forest mean predictor importance (MPI: 13.8%) in the prediction of P uptake, followed by NaHCO3-Pi (10.5%), Residual-P (9.9%), NaHCO3-Po (9.7%), conc. HCl-Po (8.2%), NaOH-Pi (7.8%), and resin-P (7.4%). The NaHCO3-Pi exhibited the largest random forest mean predictor importance (MPI: 14.0%) in the prediction of Olsen-P, followed by NaHCO3-Po (10.9%), resin-P (10.5%), 1.0 M HCl-Pi (7.5%) and conc. HCl-Po (6.7%). Only NaHCO3-Pi and NaHCO3-Po exhibited a significant influence on PAC%, and the mean predictor importance was 12.4% and 11.3%, respectively (Figure 10).

4. Discussion

4.1. Soil Available P and Crop P Uptake

Crop P uptake could be shifted and used as an important basis for the evaluation of fertilization technical measures [10]. If P fertilizer is not applied, the soil could be deficient in P for a long time. When the crop uptake of P was less than the amount of P fertilizer applied, P accumulation in the soil occurred, and vice versa [33]. In this study, the P input was only 90 kg ha−1, while the P uptake by maize varied from 44.0 to 69.5 kg ha−1, indicating a large amount of P surplus. This is consistent with previous research results [10,22]. Furthermore, at the same P application rate, the P uptake of maize was different with different P applications. The two consecutive years of field experiments showed that the order of P uptake was SSP > CMP > MAP > DAP > CK (Figure 2). This might be related to the matching of different P sources, where optimal matching improved the uptake of nutrients by crops [10,34].
The Olsen-P and total P were two important indexes of soil P status. The Olsen-P could be taken up directly by plants, mainly from total P, and the P activation coefficient (PAC%) was a crucial indicator of available soil P, which was related to the ratio of Olsen-P to total P [35]. In agroecosystems, the content, availability, and dynamics of P in soil are mostly dependent on anthropogenic activities. The long-term application of exogenous P fertilizer significantly increased total P and Olsen-P in soil [36], while a low utilization rate during crop growing seasons resulted in excessive accumulation of P in red soil [37]. Our results also confirmed that the application of different P sources significantly increased soil total P, Olsen-P, and PAC%, but there were differences among different P sources. In addition, in this study, soil Olsen-P and PAC% were significantly higher in SSP and CMP than in MAP and DAP in 2018, while soil Olsen-P was lower in SSP and MAP than in DAP and CMP in 2019 (Figure 3). There were no significant differences in total P among all P treatments in two consecutive years (Figure 3b). This was related to the conversion of total P to Olsen-P or residual P that was taken up by plants or run off. Studies have reported that total P is not readily converted to usable P when the PAC% is less than 2.0% [23]. In our research, the PAC% ranged from 0.48 to 1.80 and with a low Olsen-P ranged from 2.44 to 12.0 mg kg−1. This might be closely related to soil properties, whereby the southwestern red soils have low pH but high Al and Fe oxides, leading to the formation of sparingly soluble, crystalline, or occluded Al and Fe phosphates, limiting the amount of P available to plants [34,38].

4.2. Soil P Fractions and P Bioavailability

Soil P application significantly increased soil P accumulation and conversion to different P fractions (Figure 5 and Figure 6). The proportions of each fraction to total P differed among different P sources. Soil P application significantly increased the proportion of soil labile P pool and moderately labile P pool but significantly decreased the proportion of non-labile P pool (Figure 7). However, the proportion of the P pool varied between P sources. In this study, the labile P pool was higher, while the moderately labile P pool was lower in the SSP and CMP treatments compared to the MAP and DAP treatments. This might be the main reason why the SSP and CMP treatments gained an advantage in P uptake because the different P sources had different effects on soil P fractions. In addition, the soil in this study was a typical low-P red soil (initial pH less than 5) with high adsorption and strong P fixation capacity. While the P fertilizer was applied as a base fertilizer in a single application before sowing, the quick-acting P fertilizer in soil was rapidly fixed and difficult for plant uptake to release. Thus, the bioavailability of P fertilization from DAP and MAP on red soil was poor. Although the solubility of SSP was relatively low, and the fertilizer effect was not high when it was first applied to soil, it would be gradually released with the growth of crops. Calcium and magnesium phosphate fertilizers are alkaline fertilizers, rich in calcium and magnesium, which could improve soil acidity and release P in acidic soils [14], as well as providing calcium and magnesium for crop growth, and they also showed high P uptake and P use efficiency on acidic low-phosphorus red soils.

4.3. Relationships between Soil Available P and Soil P Fractions

Soil properties played a crucial role in the accumulation and modification of P fractions in soil, and fertilization affected P effectiveness and P fractions in soil by altering soil properties (e.g., free iron and free alumina, calcium carbonate) [39,40,41]. In this study, the RDA analysis revealed that total P, Olsen-P, and PAC% were positively correlated with labile P, while Fe2O3 and Al2O3 were negatively correlated with labile P pool (Figure 8). Free iron oxide and free alumina as well as calcium carbonate were the main factors affecting the changes in P fractions, which might be due to the lower soil pH in our study, leading to calcium ion release from the soil, and, also, the soil contained a higher amount of aluminum, iron, and clay that would bind with the P fractions of the soil, thus reducing the effectiveness of P [14,39]. In addition, the correlation between soil organic matter (SOM) and pH with P fractions was not significant, which might be due to the low soil pH in this study. The SOM had multiple interactions (competitions for adsorption sites, changes in surface charge, cation bridges, etc.) with the Fe and Al oxides in the soil, increased the surface sites and charge, and the decomposition products of the SOM competed for adsorption sites with phosphates in soil solution, which weakened the adsorption of P by soil [42,43].
There was a generally significant correlation between Olsen-P and soil P fractions [44,45,46,47], and the correlation coefficients between Olsen-P and P fractions could be used to indicate their relative bioavailability [48,49]. However, a part of soil P was present in forms that were unavailable to plants, such as organic P and occluded P. In our study, the RDA analysis showed that the Olsen-P and PAC% positively correlated with all inorganic P fractions and NaHCO3-Po while negatively correlated with NaOH-Po and cono. HCl-Po (Figure 10). The correlation coefficients were highest in the labile P pools (including resin-Pi, NaHCO3-Pi, and NaHCO3-Po), indicating that labile P pools played a significant role in Olsen-P. Additionally, the random forest analysis confirmed that labile P accounted for 35.4% of mean predictor importance on the Olsen-P, and NaHCO3-Pi and NaHCO3-Po explained 23.8% of PAC%. Meanwhile, our research found that NaOH-Po and cono. HCl-Po were significantly negatively correlated with Olsen-P and PAC%, indicating that they could play an important role in P transformation as potential P sources of plant-available P. This was in consistence with Liao et al. [22] who confirmed an eight-year P fertilization caused organic P fractions (NaOH-Po and conc. HCl-Po) to be depleted. The RDA analysis also showed that NaOH-Po and cono. HCl-Po had an opposite arrow with less mean predictor importance to Olsen-P and PAC% (Figure 9).
The P presence in a soil medium in terms of available and bonded forms has vital importance concerning its relationship with P uptake. In the present study, P application significantly increased P uptake, but there was a significant difference among different P sources. This indicated that different P sources led to changes in P fractions and differences in P uptake. Our research found that P uptake was significantly correlated with parts of the P fractions (Figure 5). Indeed, we found that the SSP treatment had a higher P uptake at the same P supply in this soil. As a result, it is important to choose a suitable P fertilizer source to increase crop P uptake and P fertilizer use efficiency based on a reasonable amount of P applied.

5. Conclusions

The P accumulation, Olsen-P, and total P, in all the P pools, were increased significantly after the application of different P sources, as compared to the control treatment. A match up with different P sources in red soil could change the soil P fractions and P pool characteristics, increase the rate of soil easily available P and labile P pool, facilitate maize P accumulation, and reduce the rate of soil moderately labile P and non-labile P. The SSP treatments had a good match in low-P red soil compared to other treatments. An equal application of P increased the P accumulation of maize through increasing the soil labile P pool, while decreasing the moderately labile P pool and non-labile P pool to enhance soil available P and P accumulation. Therefore, SSP can be considered effective P sources as agricultural management practices in low-P red soil to increase the maize P accumulation.

Author Contributions

Conceptualization, L. Z., Y.Z. and L.T.; methodology, L.Z., Y.Z. and L.T.; formal analysis, L.Z., T.Z., N.T., H.Z. and L.T.; statistical analyses, L.Z., H.Z. and L.T.; writing—original draft, L.Z., Y.Z. and L.T.; writing—review and editing, L.Z., Y.Z. and L.T. All authors have read and agreed to the published version of the manuscript.

Funding

This research was funded by the National Key Research and Development Program of China (2022YFD1901503, 2017YFD0200207), the Major Science and Technology Special Project of Yunnan Province (202102AE090030), and the Scientific Research Fund Project of Education Department of Yunnan Province (2024J0753).

Data Availability Statement

For additional information, contact the author by correspondence.

Conflicts of Interest

The authors declare no conflicts of interest.

References

  1. Ferrol, N.; Azcón–Aguilar, C.; Pérez–Tienda, J. Arbuscular mycorrhizas as key players in sustainable plant phosphorus acquisition: An overview on the mechanisms involved. Plant Sci. 2019, 280, 441–447. [Google Scholar] [CrossRef] [PubMed]
  2. Liao, D.; Zhang, C.; Li, H.; Lambers, H.; Zhang, F. Changes in soil phosphorus fractions following sole cropped and intercropped maize and faba bean grown on calcareous soil. Plant Soil 2020, 448, 587–601. [Google Scholar] [CrossRef]
  3. Quesada, C.A.; Liovd, J.; Andeson, L.O.; Fyllas, N.M.; Schwarz, M.; Czimczik, C.I. Soils of Amazonia with particular reference to the rain for sites. Biogeosciences 2011, 6, 1415–1440. [Google Scholar] [CrossRef]
  4. Nedelciu, C.E.; Ragnarsdottir, K.V.; Schlyter, P.; Stjernquist, I. Global phosphorus supply chain dynamics: Assessing regional impact to 2050. Glob. Food Secur. 2020, 26, 100426. [Google Scholar] [CrossRef]
  5. Tian, X.; Engel, B.A.; Qian, H.; Hua, E.; Sun, S.; Wang, Y. Will reaching the maximum achievable yield potential meet future global food demand? J. Clean. Prod. 2021, 294, 126285. [Google Scholar] [CrossRef]
  6. Li, Y.; Yang, R.; Gao, R.; Wei, H.; Chen, A.; Li, Y. Effects of long-term phosphorus fertilization and straw incorporation on phosphorus fractions in subtropical paddy soil. J. Integr. Agric. 2015, 14, 365–373. [Google Scholar] [CrossRef]
  7. Chen, M.; Graedel, T.E. A half-century of global phosphorus flows, stocks, production, consumption, recycling, and environmental impacts. Glob. Environ. Chang. 2016, 36, 139–152. [Google Scholar] [CrossRef]
  8. Xu, X.; Wang, Y.; Zhang, H.; Yin, D.; Dari, B.; Xu, J. Soil phosphorus storage capacity as affected by repeated phosphorus addition in an Ultisol. Commun. Soil Sci. Plant Anal. 2020, 51, 1960–1968. [Google Scholar] [CrossRef]
  9. Su, L.; Zhao, H.; Hou, X.; Chen, Y.; Xiao, J.; Zheng, Y.; Tang, L. Activation of phosphorus pools in red soil by maize and soybean intercropping and its response to phosphorus fertilizer. Chin. J. Eco-Agric. 2023, 31, 558–566. [Google Scholar] [CrossRef]
  10. Yan, X.; Yang, W.; Chen, X.; Wang, M.; Wang, W.; Ye, D.; Wu, L. Soil phosphorus pools, bioavailability and environmental risk in response to the phosphorus supply in the red soil of southern China. Int. J. Environ. Res. 2020, 17, 7384. [Google Scholar] [CrossRef]
  11. Wang, S.; Xia, P. The use efficiency and slow-release rate of various P fertilizers with different application rates on calcareous soil. Chin. J. Soil Sci. 2008, 39, 1363–1368. [Google Scholar] [CrossRef]
  12. Li, H. Effects of Different Phosphorus Fertilizers on Crop Yield and Nutrient Utilization in Rice Rape Rotation System; Huazhong Agricultural University: Wuhan, China, 2020. [Google Scholar]
  13. Wang, Y.; Cai, Z.; Feng, G. Effects of different phosphorus application techniques on phosphorus availability in a rape system in a red soil. Acta Pedol. Sin. 2023, 60, 235–246. [Google Scholar] [CrossRef]
  14. Zhou, L.; Su, L.; Zhang, L.; Zhang, L.; Zheng, Y.; Tang, L. Effect of different types of phosphate fertilizer on phosphorus absorption and desorption in acidic red soil of southwest China. Sustainability 2022, 14, 9973. [Google Scholar] [CrossRef]
  15. Khan, A.; Lu, G.; Zhang, H.; Wang, R.; Lv, F.; Xu, J.; Yang, X.; Zhang, S. Land use changes impact distribution of phosphorus in deep soil profile. J. Soil Sci. Plant Nutr. 2019, 19, 565–573. [Google Scholar] [CrossRef]
  16. Li, C.; Zhang, P.; Zhang, J.; Zhu, P.; Wang, L. Forms, transformations, and availability of phosphorus after 32 years of manure and mineral fertilization in a Mollisol under continuous maize cropping. Arch. Agron. Soil Sci. 2020, 67, 1256–1271. [Google Scholar] [CrossRef]
  17. Beck, M.A.; Sanchez, P.A. Soil phosphorus fraction dynamics during 18 years of cultivation on a typic paleudult. Soil Sci. 1994, 34, 1424–1431. [Google Scholar] [CrossRef]
  18. Audette, Y.; O’Halloran, I.P.; Evans, L.J.; Martin, R.C.; Voroney, R.P. Kinetics of phosphorus forms applied as inorganic and organic amendments to a calcareous soil II: Effects of plant growth on plant available and uptake phosphorus. Geoderma 2016, 279, 70–76. [Google Scholar] [CrossRef]
  19. Hedley, M.J.; Stewart, J.W.B. Method to measure microbial phosphate in soils. Soil Biol. Biochem. 1982, 14, 377–385. [Google Scholar] [CrossRef]
  20. Nakayama, Y.; Wade, J.; Margenot, A.J. Does soil phosphomonoesterase activity reflect phosphorus pools estimated by Hedley phosphorus fractionation? Geoderma 2021, 401, 115279. [Google Scholar] [CrossRef]
  21. Wang, J.; Wu, Y.; Zhou, J.; Bing, H.; Shenyan, P. Air-drying changes the distribution of Hedley phosphorus pools in forest soils. Pedosphere 2020, 30, 272–284. [Google Scholar] [CrossRef]
  22. Liao, D.; Zhang, C.; Lambers, H.; Zhang, F. Changes in soil phosphorus fractions in response to long-term phosphate fertilization under sole cropping and intercropping of maize and faba bean on a calcareous soil. Plant Soil 2021, 463, 589–600. [Google Scholar] [CrossRef]
  23. Wang, Y.; Tang, J.; Zhang, H.; Schroder, J.; He, Y. Phosphorus availability and sorption as affected by long-term fertilization. Agron. J. 2014, 106, 1583–1592. [Google Scholar] [CrossRef]
  24. Johnson, C.M.; Ulrich, A. Analytical methods for use in plant analysis. Calif. Agric. Exp. Stn. Bull. 1959, 766, 25–78. [Google Scholar]
  25. Soil Survey Staff. Soil Survey Laboratory Methods Manual. Soil Survey Investigations Report 42. 2004. Available online: https://www.researchgate.net/publication/255947599_Soil_Survey_Laboratory_Method_Manual (accessed on 5 June 2022).
  26. Olsen, R.S.; Sommer, L.E. Phosphorus. In Methods of Soil Analysis (Part 2); Page, A.L., Miller, R.H., Keeney, D.R., Eds.; American Society of Agronomy: Madison, WI, USA, 1982; pp. 403–430. [Google Scholar]
  27. Schollenberger, C.J. Determination of soil organic matter. Soil Sci. 1931, 31, 483–486. [Google Scholar] [CrossRef]
  28. Fu, Q.L.; Zhang, Y.H.; Huang, W.; Hu, H.Q.; Chen, D.Q.; Yang, C. Remaining dynamics of Cry1Ab proteins from transgenic Bt corn in soil. J. Food Agric. Environ. 2007, 10, 294–298. [Google Scholar] [CrossRef]
  29. Fink, J.R.; Inda, A.V.; Bavaresco, J.; Barrón, V.; Torrent, J.; Bayer, C. Phosphorus adsorption and desorption in undisturbed samples from subtropical soils under conventional tillage or no-tillage. J. Plant Nutr. Soil Sci. 2016, 179, 198–205. [Google Scholar] [CrossRef]
  30. Tiessen, H.; Moir, J.O. Characterization of Available P by Sequential Extraction; CRC Press: Boca Raton, FL, USA, 1993; Volume 7, pp. 5–229. [Google Scholar]
  31. Sun, B.; Cui, Q.; Yun, G.; Hopkins, D.W. Soil phosphorus and relationship to phosphorus balance under long-term fertilization. Plant Soil Environ. 2018, 64, 214–220. [Google Scholar] [CrossRef]
  32. Yang, Z.; Zhang, Y.; Wang, Y. Intercropping regulation of soil phosphorus composition and microbially-driven dynamics facilitates maize phosphorus uptake and productivity improvement. Field Crops Res. 2022, 287, 108666. [Google Scholar] [CrossRef]
  33. Bai, Z.; Li, H.; Yang, X.; Zhou, B.; Shi, X.; Wang, B.; Li, D.; Shen, J.; Chen, Q.; Qin, W.; et al. The critical soil P levels for crop yield, soil fertility and environmental safety in different soil types. Plant Soil 2013, 372, 39. [Google Scholar] [CrossRef]
  34. Mahmood, M.; Tian, Y.; Ma, Q.; Ahmed, W.; Mehmood, S.; Hui, X.; Wang, Z. Changes in phosphorus fractions and its availability status in relation to long term P fertilization in loess plateau of China. Agronomy 2020, 10, 1818. [Google Scholar] [CrossRef]
  35. Wu, Q.; Zhang, S.; Zhu, P.; Huang, S.; Wang, B.; Zhao, L.; Xu, M. Characterizing differences in the phosphorus activation coefficient of three typical cropland soils and the influencing factors under long-term fertilization. PLoS ONE 2017, 12, e0176437. [Google Scholar] [CrossRef] [PubMed]
  36. Milić, S.; Ninkov, J.; Zeremski, T.; Latković, D.; Šeremešić, S.; Radovanović, V.; Žarković, B. Soil fertility and phosphorus fractions in a calcareous chernozem after a long-term field experiment. Geoderma 2019, 339, 9–19. [Google Scholar] [CrossRef]
  37. Li, D.; Wang, B.; Huang, J.; Zhang, Y.; Xu, M.; Zhang, S.; Zhang, H. Change of phosphorus in red soil and its effect to grain yield under longterm different fertilizations. Sci. Agric. Sin. 2019, 52, 3830–3841. [Google Scholar] [CrossRef]
  38. Murrmann, R.P.; Peech, M. Relative significance of labile and crystalline phosphates in soil. Soil Sci. 1969, 107, 249–255. [Google Scholar] [CrossRef]
  39. Spohn, M. Increasing the organic carbon stocks in mineral soils sequesters large amounts of phosphorus. Glob. Chang. Biol. 2020, 26, 4169–4177. [Google Scholar] [CrossRef]
  40. Hou, E.; Wen, D.; Kuang, Y.; Cong, J.; Chen, C.; He, X.; Heenan, M.; Lu, H.; Zhang, Y. Soil pH predominantly controls the forms of organic phosphorus in topsoils under natural broadleaved forests along a 2500 km latitudinal gradient. Geoderma 2018, 315, 65–74. [Google Scholar] [CrossRef]
  41. Redel, Y.; Cartes, P.; Demanet, R.; Velásquez, G.; Poblete-Grant, P.; Bol, R.; Mora, M. Assessment of phosphorus status influenced by Al and Fe compounds in volcanic grassland soils. J. Soil Sci. Plant Nutr. 2016, 16, 490–506. [Google Scholar] [CrossRef]
  42. Wang, Q.; Chen, Y.; Zhang, N.; Qin, Z.; Jin, Y.; Zhu, P.; Peng, C.; Colinet, G.; Zhang, S. Phosphorus adsorption and desorption characteristics as affected by long-term phosphorus application in black soil. J. Plant Nutr. Fertil. 2022, 28, 1569–1581. [Google Scholar] [CrossRef]
  43. Kang Kang, J.; Hesterberg, D.; Osmond, D. Soil organic matter effects on phosphorus sorption: A path analysis. Soil Sci. Soc. Am. J. 2009, 73, 360–366. [Google Scholar] [CrossRef]
  44. Ye, D.; Li, T.; Liu, D.; Zhang, X.; Zheng, Z. P accumulation and physiological responses to different high P regimes in Polygonum hydropiper for understanding a P-phytoremediation strategy. Sci. Rep. 2015, 5, 17835. [Google Scholar] [CrossRef] [PubMed]
  45. Yang, J.; Jones, C.; Kim, H.J.; Jacobsen, J.S. Soil inorganic phosphorus fractions and Olsen-P in phosphorus-responsive calcareous soils: Effects of fertilizer amount and incubation time. Commun. Soil Sci. Plant Anal. 2002, 33, 855–871. [Google Scholar] [CrossRef]
  46. Wang, J.; Liu, W.; Mu, H.; Dang, T. Inorganic phosphorus fractions and phosphorus availability in a calcareous soil receiving 21-year superphosphate application. Pedosphere 2010, 20, 304–310. [Google Scholar] [CrossRef]
  47. Shen, Y.; Duan, Y.; McLaughlin, N.; Huang, S.; Guo, D.; Xu, M. Phosphorus desorption from calcareous soils with different initial Olsen-P levels and relation to phosphate fractions. J. Soils Sediments 2019, 19, 2997–3007. [Google Scholar] [CrossRef]
  48. Shen, J.; Li, R.; Zhang, F.; Fan, J.; Tang, C.; Rengel, Z. Crop yield, soil fertility and phosphorus fractions in response to long-term fertilization under the rice monoculture system on a calcareous soil. Field Crops Res. 2004, 86, 225–238. [Google Scholar] [CrossRef]
  49. Wang, Y.; Huang, Q.; Gao, H.; Zhang, R.; Yang, L.; Guo, Y.; Li, H.; Awasthi, M.; Li, G. Long-term cover crops improved soil phosphorus availability in a rain-fed apple orchard. Chemosphere 2021, 275, 130093. [Google Scholar] [CrossRef] [PubMed]
Figure 1. Sequential P fractions based on the Hedley method modified by Tiessen and Moir [30].
Agronomy 14 02372 g001
Figure 2. Effect of different P sources (CK, SSP, MAP, DAP, and CMP) on the P uptake of maize in 2018 and 2019. Values are means ± standard deviation (n = 3). Values with the same lower-case letters are not significantly different among different P sources and years at the 5% level by the LSD. Y represents the year, P represents the P sources and Y × P represents the interaction between the year and the P sources. *** p < 0.001, * p < 0.05. CK is no P fertilizer, SSP is single superphosphate (90 kg ha−1), CMP is calcium magnesium phosphate (90 kg ha−1), MAP is monoammonium phosphate (90 kg ha−1), and DAP is diammonium phosphate (90 kg ha−1).
Agronomy 14 02372 g002
Figure 3. Changes in the soil Olsen-P (a), total P (b) and PAC% (c) to 20 cm depth as affected by different P sources. Values are means ± standard deviation (n = 3). Values with the same lower-case letters are not significantly different among different P sources and years at the 5% level by the LSD. Y represents the year, P represents the P sources and Y × P represents the interaction between the year and the P sources. *** p < 0.001, ** p < 0.01, * p < 0.05. CK is no P fertilizer, SSP is single superphosphate (90 kg ha−1), CMP is calcium magnesium phosphate (90 kg ha−1), MAP is monoammonium phosphate (90 kg ha−1), and DAP is diammonium phosphate (90 kg ha−1).
Agronomy 14 02372 g003
Figure 4. Effect of different P sources (CK, SSP, MAP, DAP, and CMP) on the total inorganic P (a), total organic P (b) in 2018 and 2019. Values are means ± standard deviation (n = 3). Values with the same lower-case letters are not significantly different among different P fertilizer sources and years at the 5% level by the LSD. Y represents the year, P represents the P sources and Y × P represents the interaction between the year and the P sources. *** p < 0.001, ** p < 0.01, ns p > 0.05. CK is no P fertilizer, SSP is single superphosphate (90 kg ha−1), CMP is calcium magnesium phosphate (90 kg ha−1), MAP is monoammonium phosphate (90 kg ha−1), and DAP is diammonium phosphate (90 kg ha−1).
Agronomy 14 02372 g004
Figure 5. Effect of different P sources (CK, SSP, MAP, DAP, and CMP) on the labile P pools (a), moderately-labile P pools (b) and non-labile P pools (c) in 2018 and 2019. Values are means ± standard deviation (n = 3). Values with the same lower-case letters are not significantly different among different P sources and years at the 5% level by the LSD. Y represents the year, P represents the P sources and Y × P represents the interaction between the year and the P sources. *** p < 0.001, ** p < 0.01, ns p > 0.05. CK is no P fertilizer, SSP is single superphosphate (90 kg ha−1), CMP is calcium magnesium phosphate (90 kg ha−1), MAP is monoammonium phosphate (90 kg ha−1), and DAP is diammonium phosphate (90 kg ha−1).
Agronomy 14 02372 g005
Figure 6. Effect of different P sources (CK, SSP, MAP, DAP, and CMP) on the labile P fractions in 2018 and 2019. Values are means ± standard deviation (n = 3). For each soil P fraction, values followed by the same lower-case letter are not significantly different among different P fertilizer sources and years at the 5% level by the LSD. Y represents the year, P represents the P sources and Y × P represents the interaction between the year and the P sources. *** p < 0.001, ** p < 0.01. CK is no P fertilizer, SSP is single superphosphate (90 kg ha−1), CMP is calcium magnesium phosphate (90 kg ha−1), MAP is monoammonium phosphate (90 kg ha−1), and DAP is diammonium phosphate (90 kg ha−1).
Agronomy 14 02372 g006
Figure 7. Effect of different P sources (CK, SSP, MAP, DAP, and CMP) on the proportions of labile P pool, moderately-labile P pool and non-labile P pool in 2018 and 2019. Values are means ± standard deviation (n = 3). Values with the same lower-case letters are not significantly different among different P sources and years at the 5% level by the LSD. CK refers to no P application, SSP refers to P application for calcium superphosphate, MAP refers to P application for calcium magnesium phosphate, DAP refers to P application for monoammonium phosphate, and CMP refers to P application for diammonium phosphate.
Agronomy 14 02372 g007
Figure 8. Correlations between the soil chemical properties and soil P pools were determined by the redundancy analysis. The red arrow indicates the explanatory variable, and the black arrow indicates the response variable.
Agronomy 14 02372 g008
Figure 9. Correlations between the soil P fractions and P uptake, Olsen-P and PAC% as determined by the redundancy analysis. The red arrow indicates the explanatory variable, and the black arrow indicates the response variable.
Agronomy 14 02372 g009
Figure 10. Random forest analyses to identify the main predictors of the P uptake, Olsen-P, and PAC% among all P fractions. Percentage increases in the MSE (mean squared error) of variables were used to estimate the importance of these predictors, and higher MSE% values imply more important predictors. Significance levels are as follows: * p < 0.05 and ** p < 0.01.
Agronomy 14 02372 g010
Disclaimer/Publisher’s Note: The statements, opinions and data contained in all publications are solely those of the individual author(s) and contributor(s) and not of MDPI and/or the editor(s). MDPI and/or the editor(s) disclaim responsibility for any injury to people or property resulting from any ideas, methods, instructions or products referred to in the content.

