
Optimising Nitrogen Fertilisation in a Potato–Oat Rotation and Implications for Nitrous Oxide Emissions in Volcanic Soils
 , , ,
, , , 
Abstract
1. Introduction
2. Materials and Methods
2.1. Study Site
2.2. Experimental Design
2.3. Climatic and Soil Parameters
2.4. Soil Analysis
2.5. Potato and Cover Crop Evaluations
2.6. N2O Fluxes Quantification
2.7. Emission Factor
2.8. Emission Intensity
2.9. Statistical Analysis
3. Results
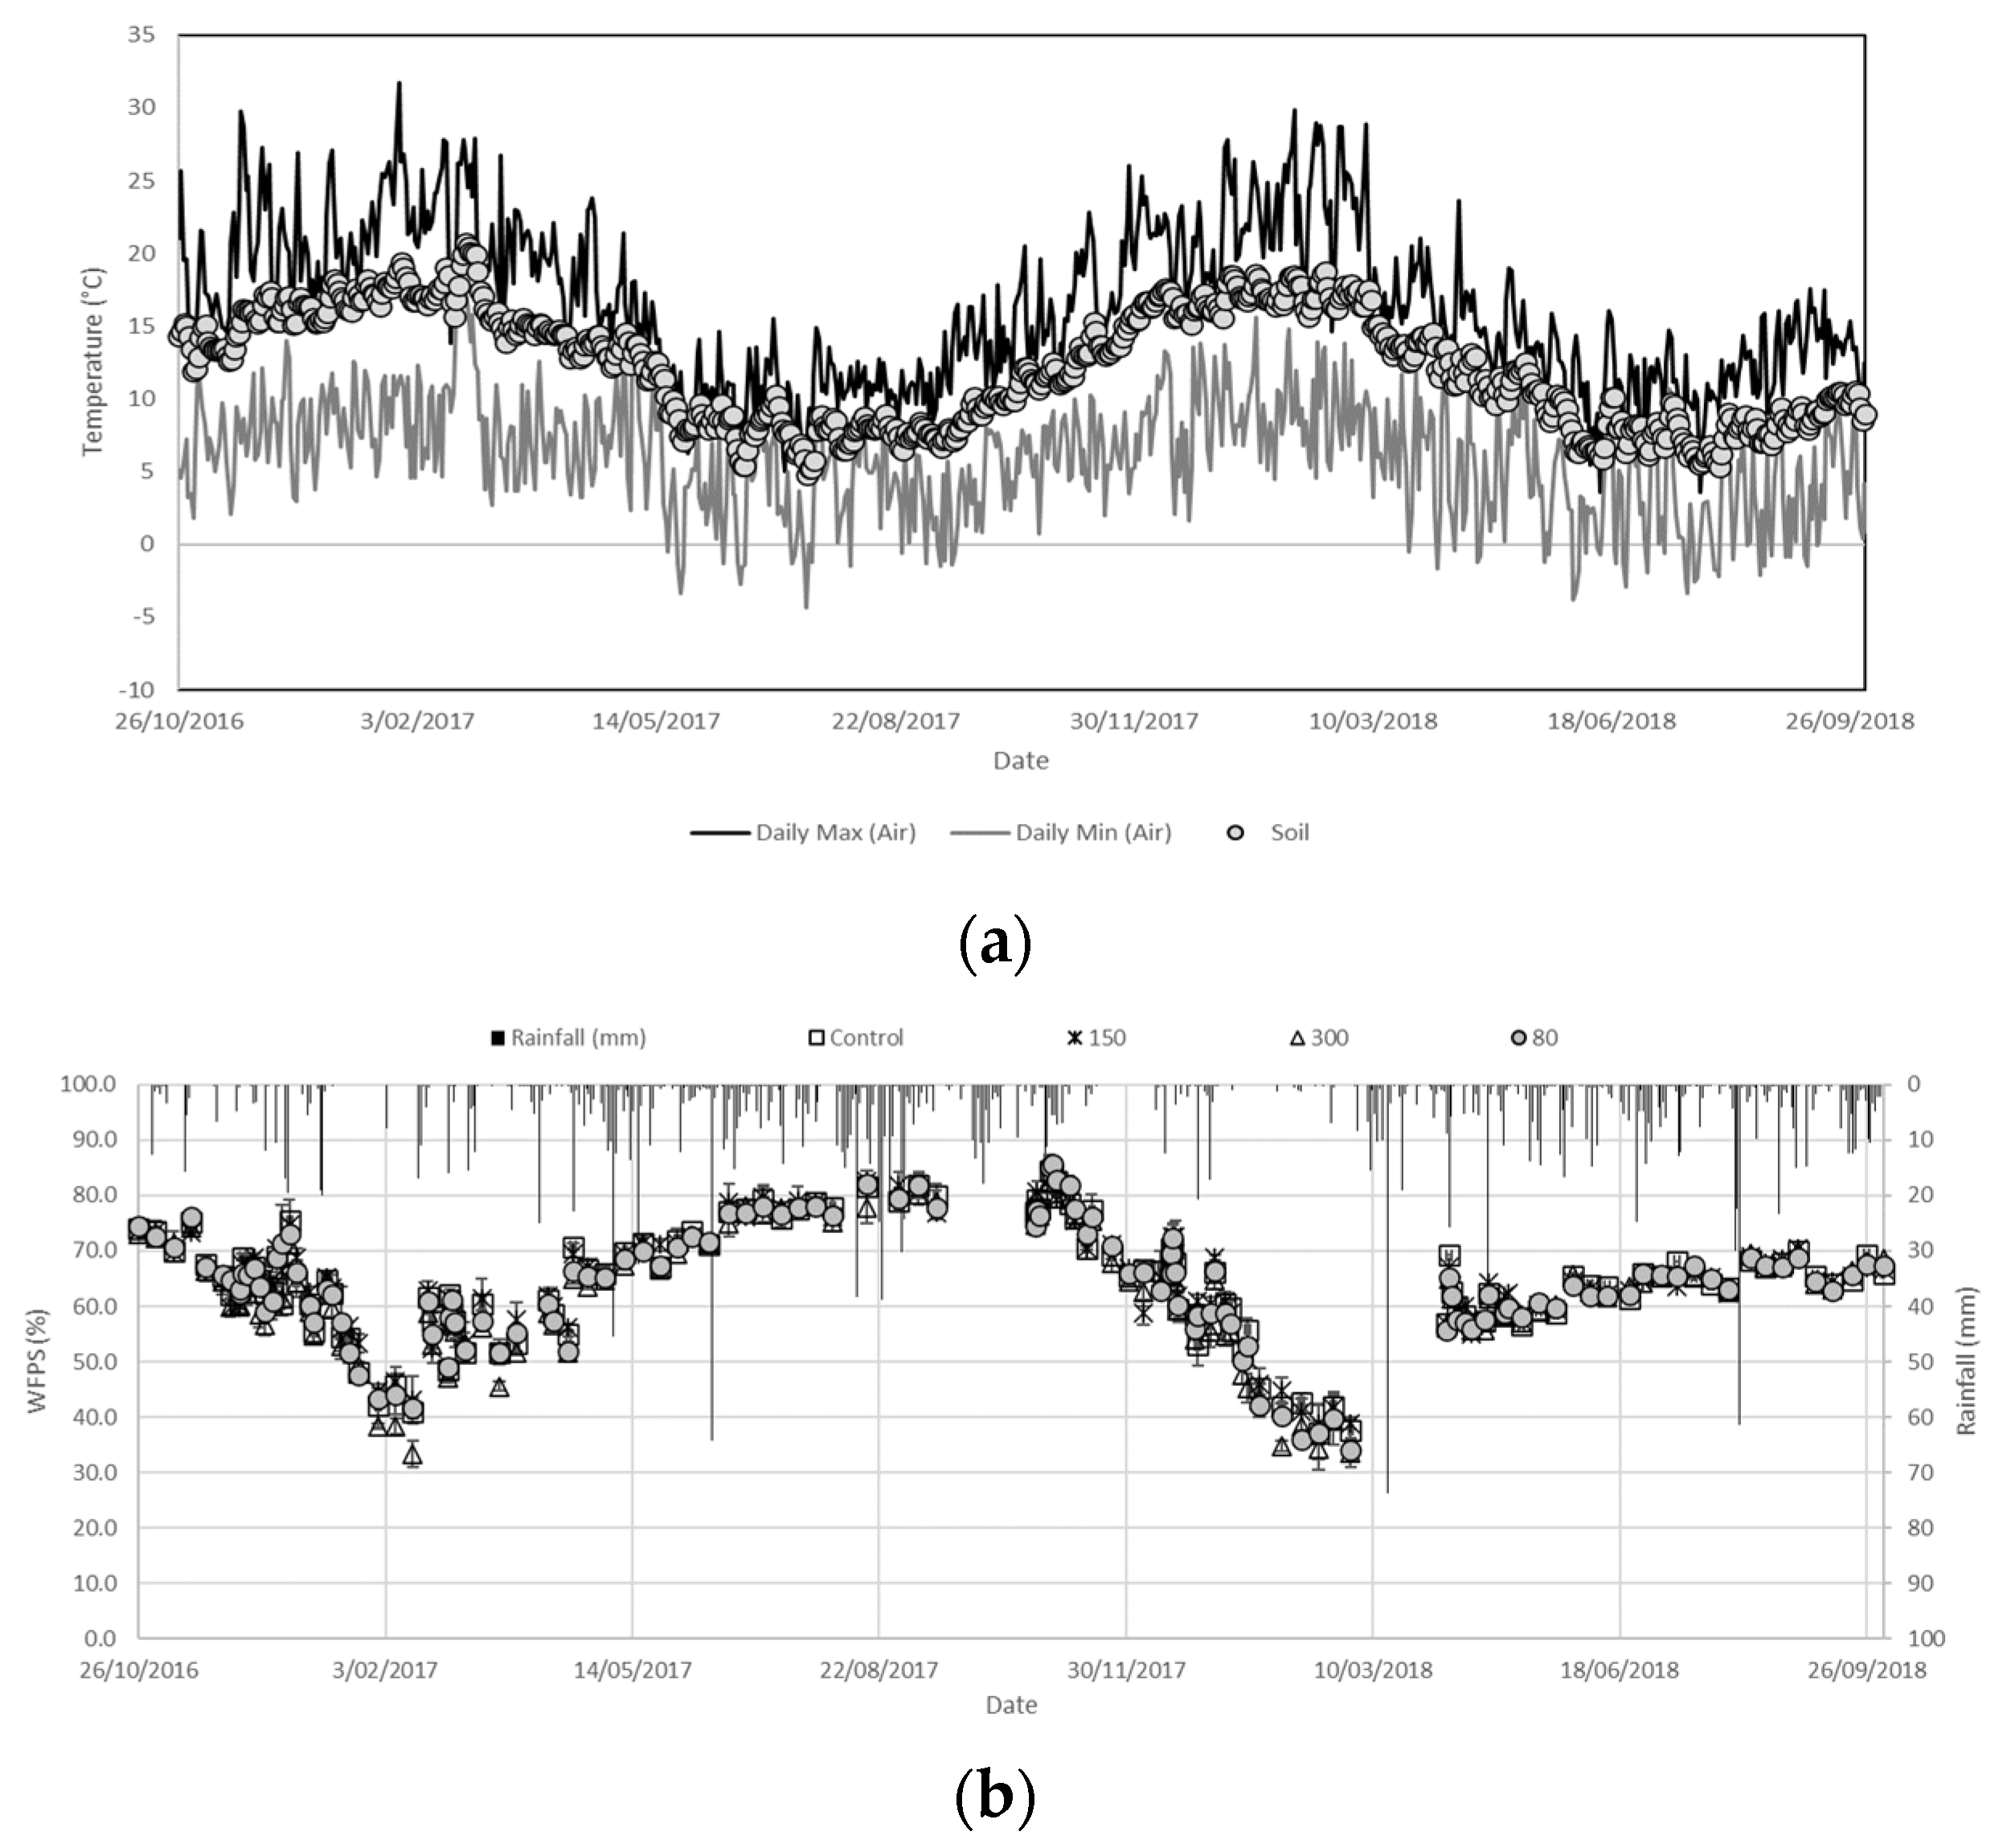
3.1. Climate
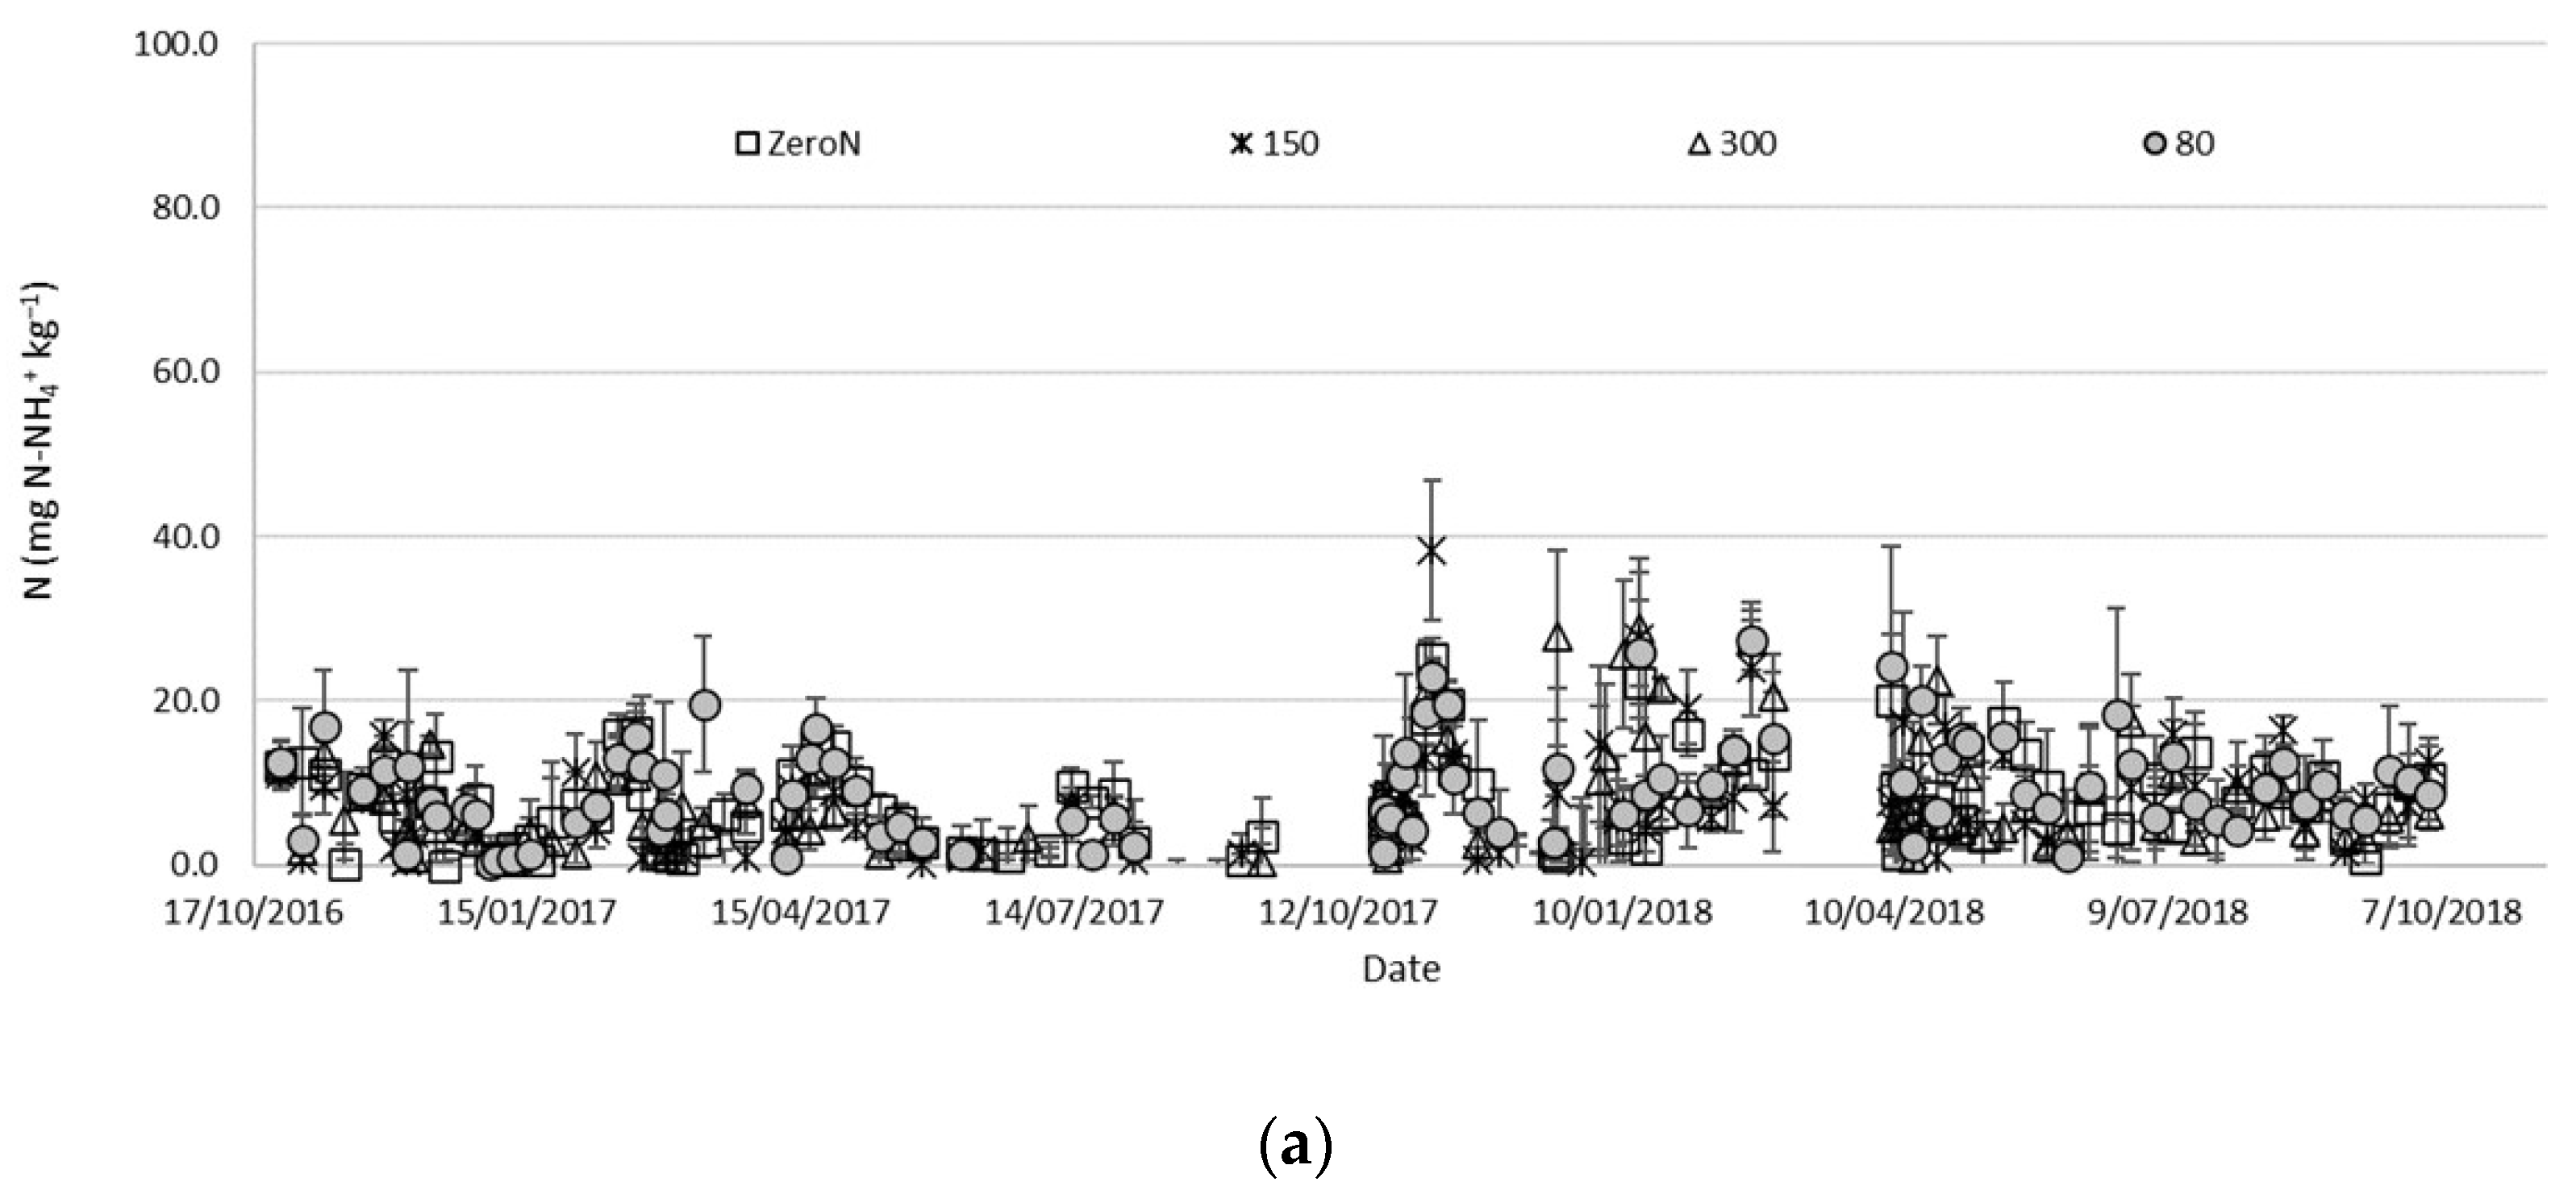
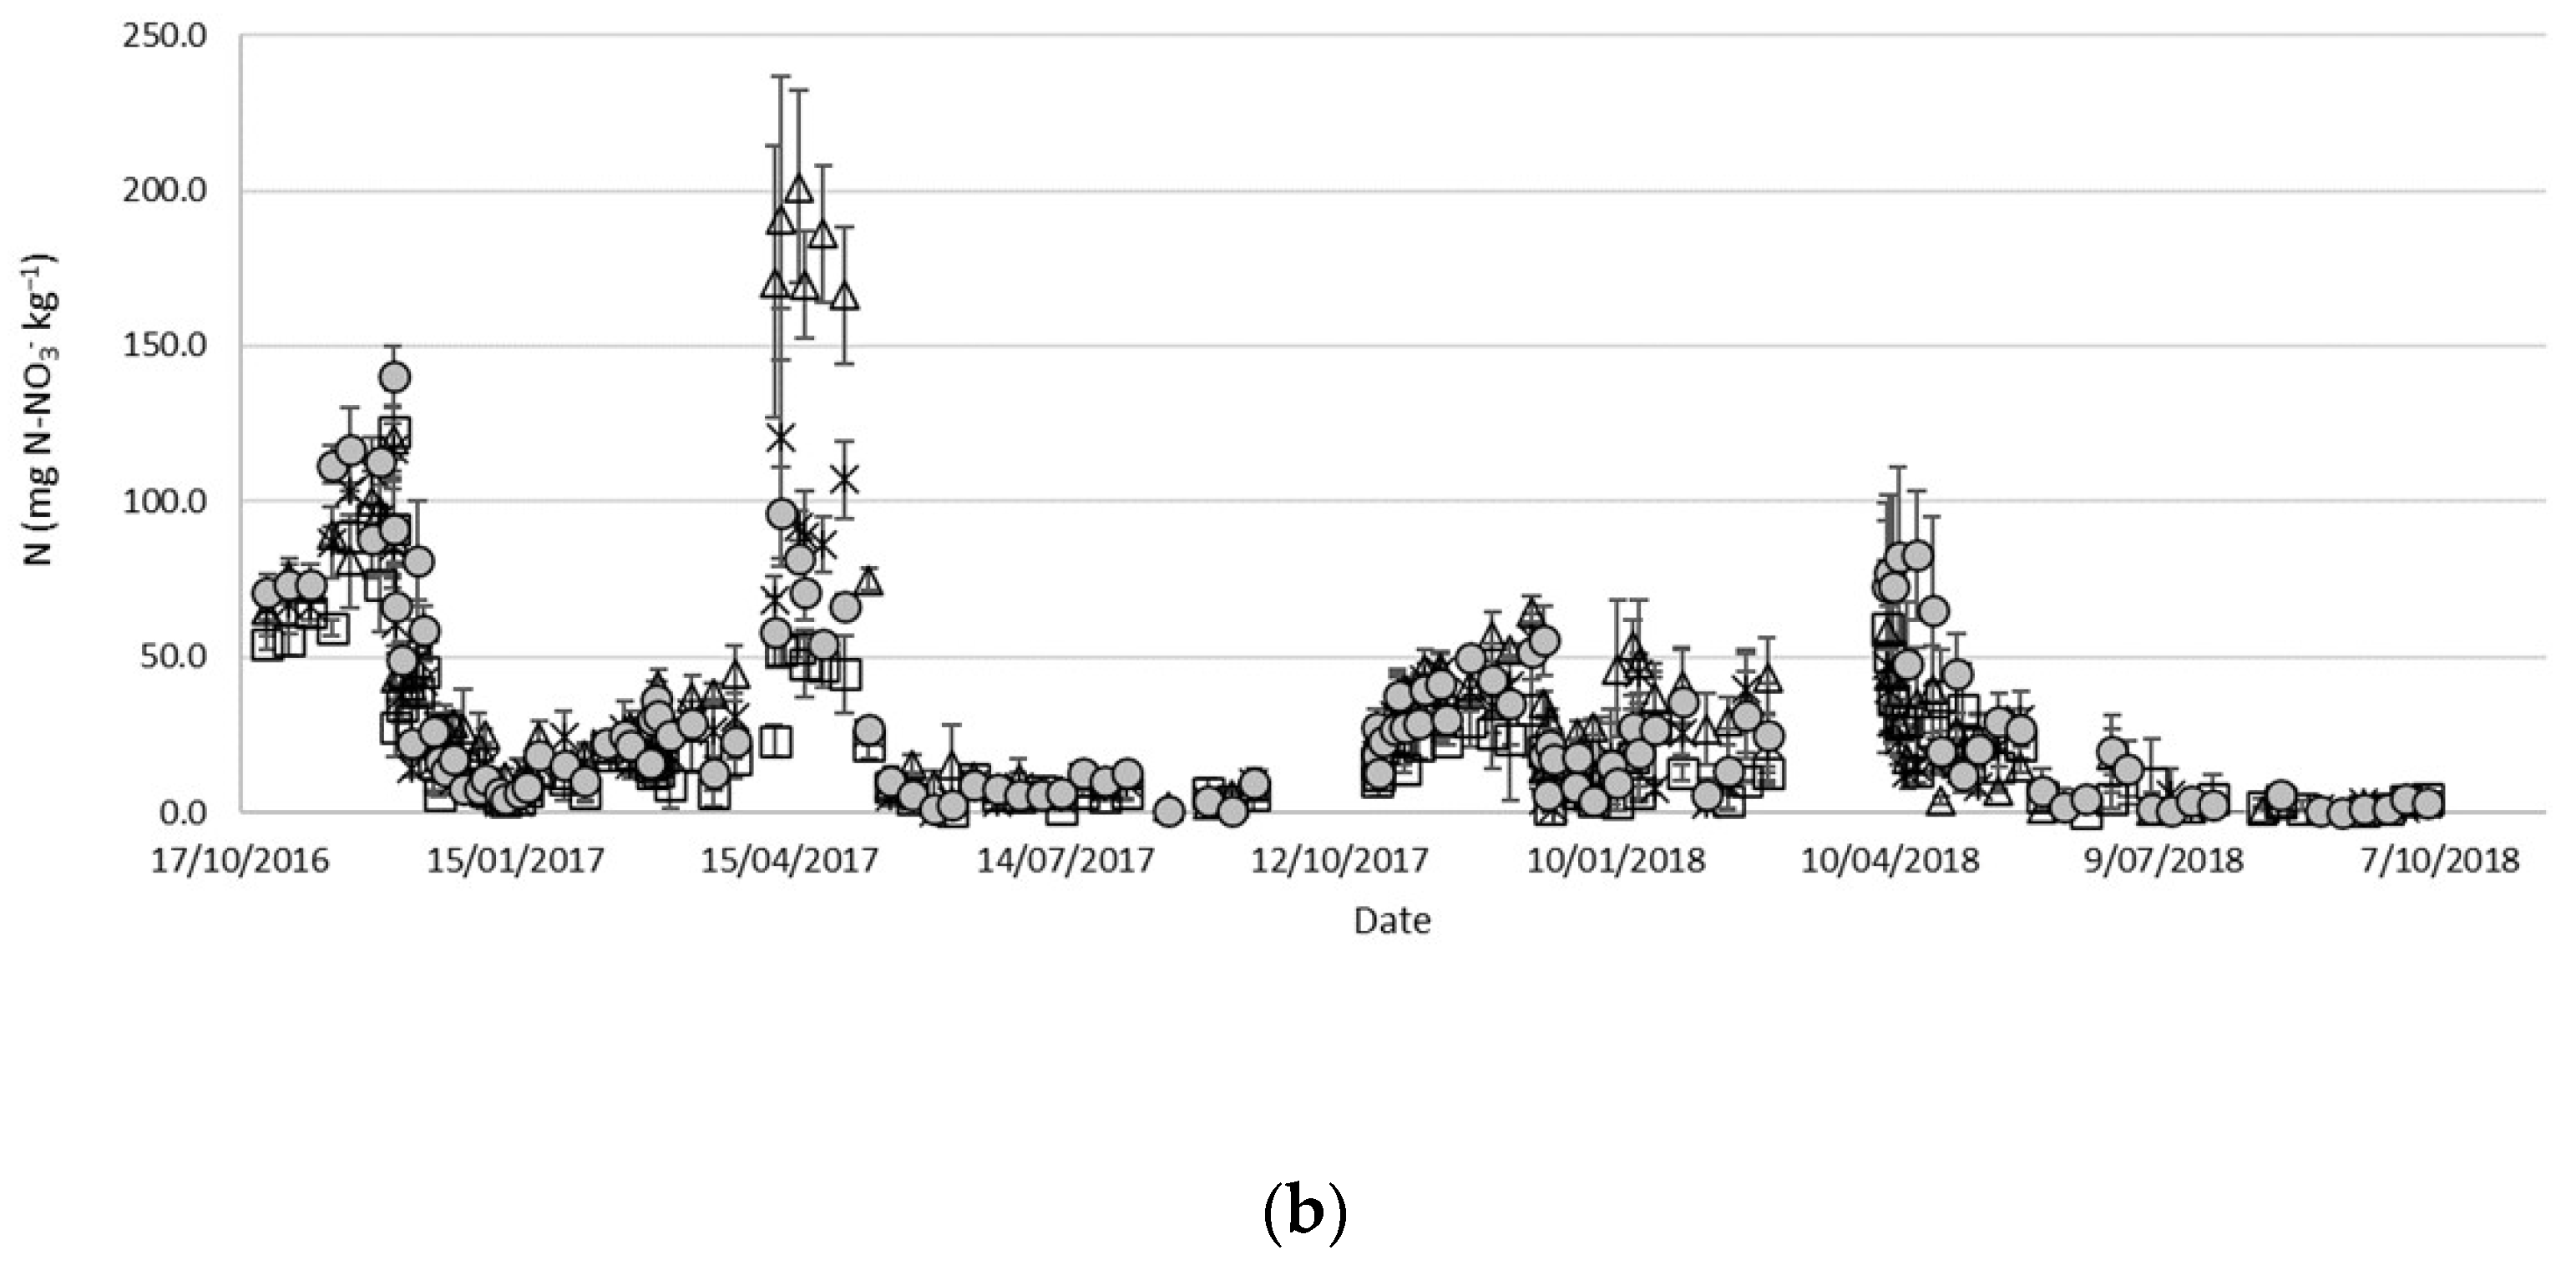
3.2. Soil-Available N (NH4+ and NO3−)
3.3. Crop Yield, N Uptake and NUE
3.3.1. Yield
3.3.2. Marketable Calibre Distribution
3.3.3. Nitrogen Uptake
3.3.4. Nitrogen Use Efficiency, NUE
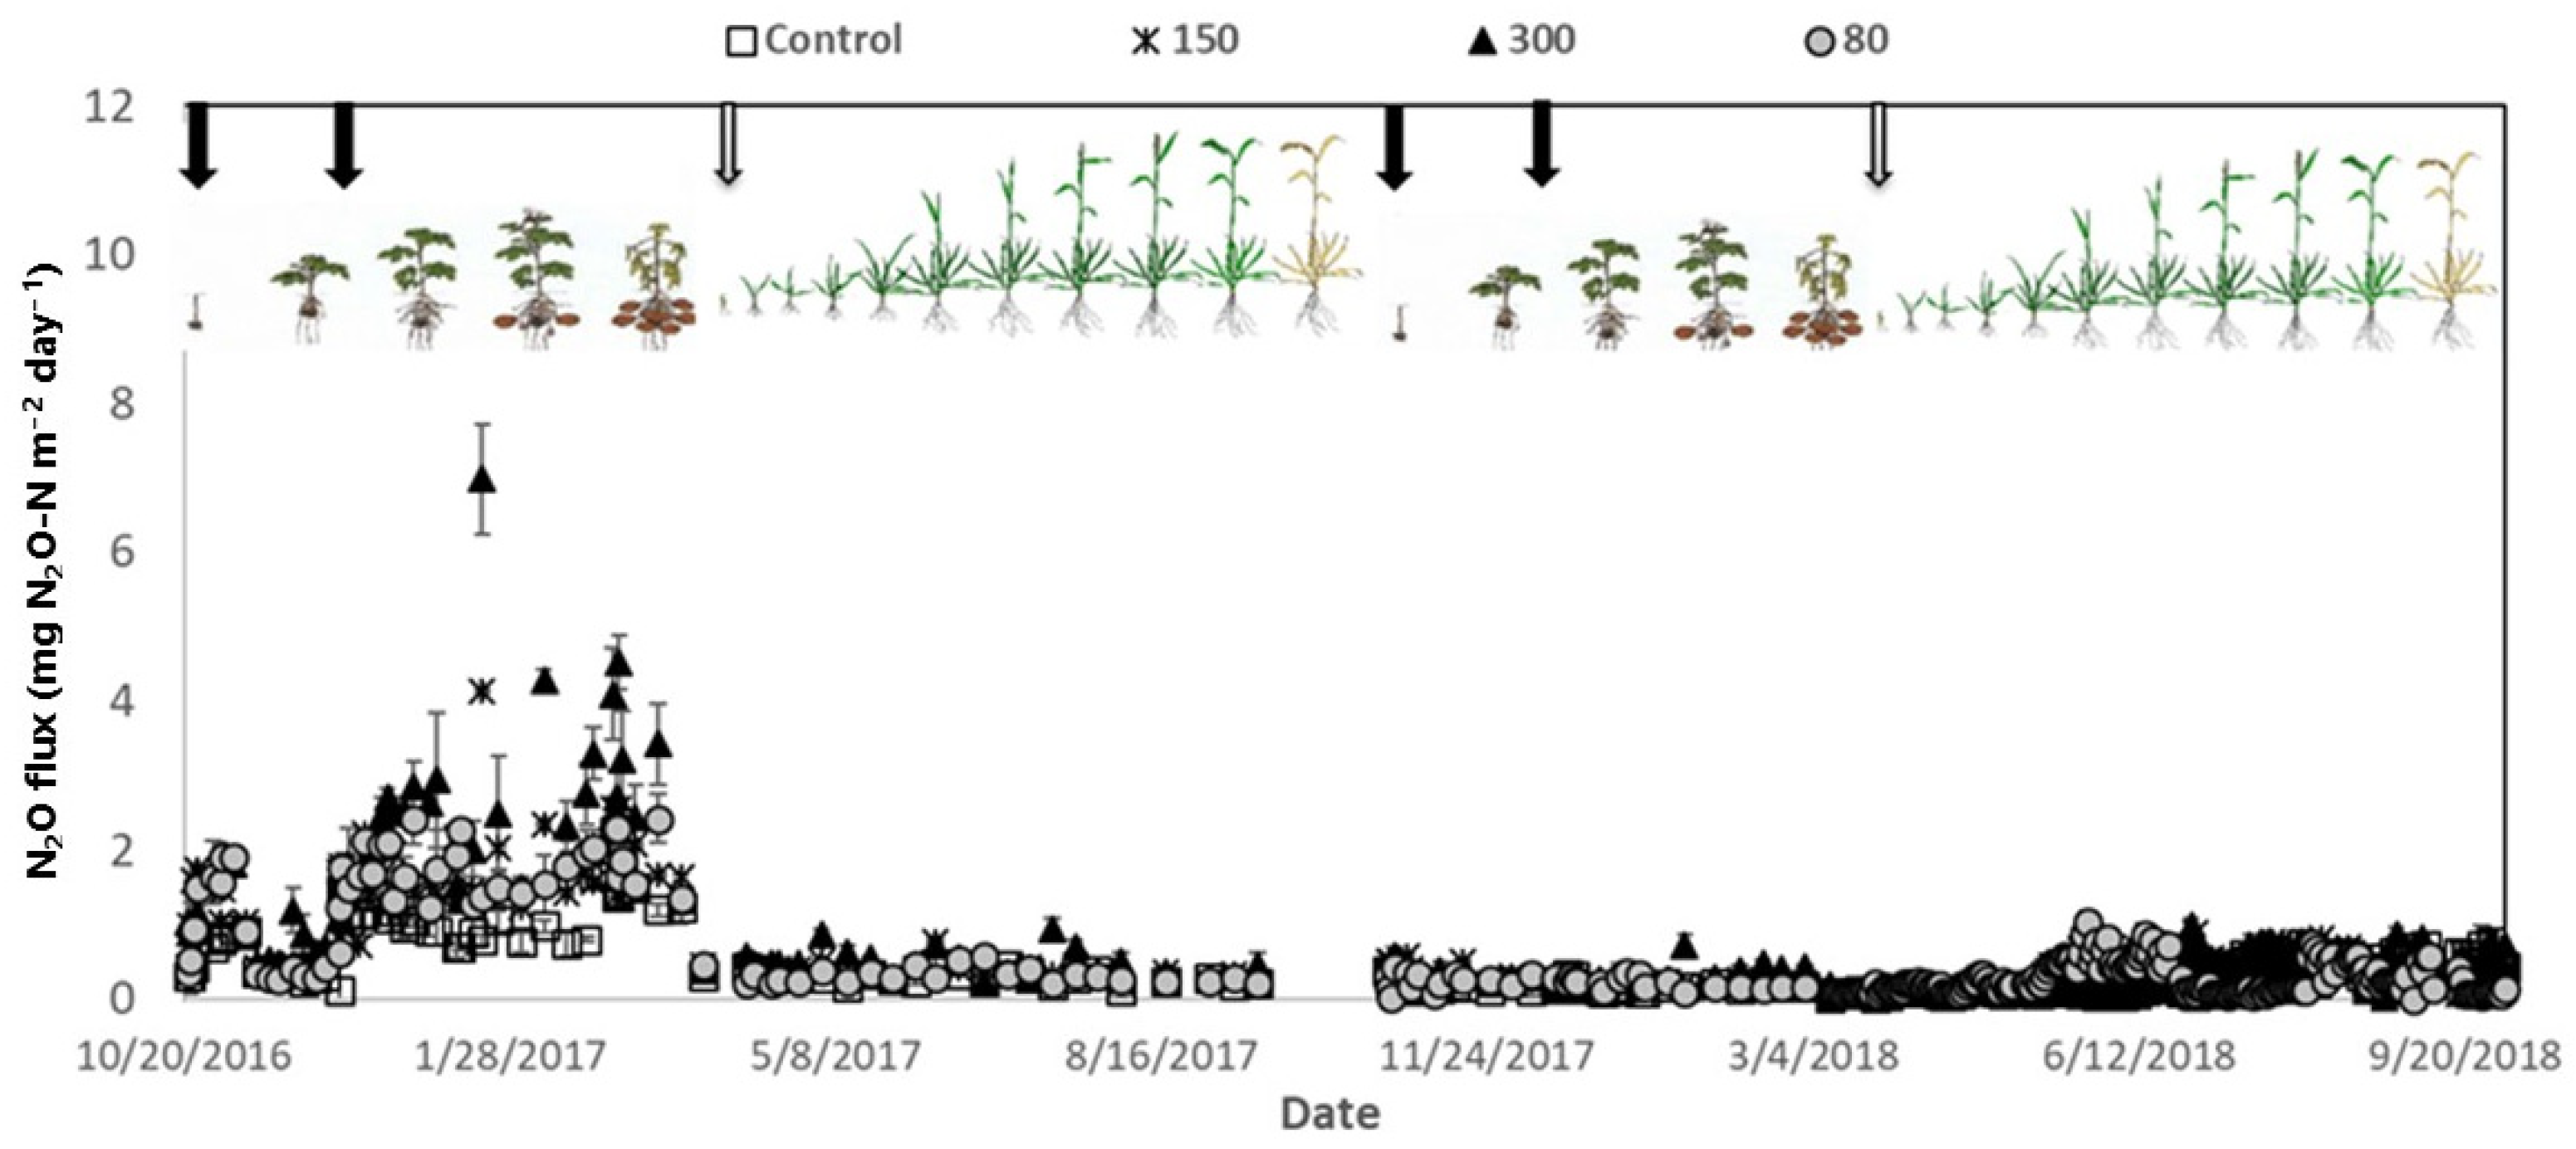
3.4. Nitrous Oxide Emissions
3.5. Emission Intensity, EI
3.6. Emission Factor (EF1)
4. Discussion
4.1. Overall Influence of Climate and Soil Factors
4.2. Effects on Yield and NUE
4.3. Effects on N2O Emissions, EI and EF1
5. Conclusions
Supplementary Materials
Author Contributions
Funding
Data Availability Statement
Conflicts of Interest
References
- The Intergovernmental Panel on Climate Change (IPCC). Climate Change 2014: Synthesis Report. Contribution of Working Groups I, II and III to the Fifth Assessment Report of the Intergovernmental Panel on Climate Change; Core Writing Team, Pachauri, R.K., Meyer, L.A., Eds.; Intergovernmental Panel on Climate Change: Geneva, Switzerland, 2014; 151p. [Google Scholar]
- The Intergovernmental Panel on Climate Change (IPCC). Summary for Policymakers. In Climate Change and Land: An IPCC Special Report on Climate Change, Desertification, Land Degradation, Sustainable Land Management, Food Security, and Greenhouse Gas Fluxes in Terrestrial Ecosystems; Shukla, P.R., Skea, J., Calvo Buendia, E., Masson-Delmotte, V.H., Pörtner, O., Roberts, D.C., Zhai, P., Slade, R., Connors, S., van Diemen, R., et al., Eds.; Intergovernmental Panel on Climate Change: Geneva, Switzerland, 2019. [Google Scholar] [CrossRef]
- Food and Agricultural Organization (FAO). Faostat Compare Data. Available online: https://www.fao.org/faostat/en/#compare (accessed on 20 January 2020).
- Paustian, K.; Robertson, G.P.; Elliot, E.T. Management impacts on carbon storage and gas fluxes (CO2, CH4) in mid-latitude cropland. In Soil Management and Greenhouse Effect; Lal, R., Kimble, J., Levine, E., Stewart, B.A., Eds.; CRC Press, Inc.: Boca Raton, FL, USA, 1995; pp. 69–83. [Google Scholar]
- Erisman, J.; Bleeker, A.; Galloway, J.; Sutton, M. Reduced nitrogen in ecology and the environment. Environ. Pollut. 2007, 150, 140–149. [Google Scholar] [CrossRef] [PubMed]
- Alfaro, M.; Hube, S.; Salazar, F.; Beltrán, I.; Rodriguez, M.; Ramírez, L.; Saggar, S. Soil Greenhouse Gas Emissions in Different Pastures Implemented as a Management Strategy for Climate Change. Agronomy 2022, 12, 1097. [Google Scholar] [CrossRef]
- Yang, S.H.; Kang, H.J.; Lee, S.C.; Oh, H.J.; Kim, G.Y. Influence of N Fertilization Level, Rainfall and Temperature on the Emission of N2O in the Jeju Black Volcanic Ash Soil with Potato Cultivation. Korean J. Soil Sci. Fertil. 2012, 45, 544–550. [Google Scholar] [CrossRef]
- Butterbach-Bahl, K.; Baggs, E.M.; Dannenmann, M.; Kiese, R.; Zechmeister-Boltenstern, S. Nitrous oxide emissions from soils: How well do we understand the processes and their controls? Phil. Trans. R. Soc. B. 2013, 368, 20130122. [Google Scholar] [CrossRef] [PubMed]
- The Intergovernmental Panel on Climate Change (IPCC). Guidelines for National Greenhouse Gases Inventories; Intergovernmental Panel on Climate Change: Geneva, Switzerland, 2006. [Google Scholar]
- Dong-Gill, K.; Hernandez-Ramirez, G.; Giltrap, D. Linear and nonlinear dependency of direct nitrous oxide emissions on fertilizer nitrogen input: A meta-analysis. Agric. Ecosyst. Environ. 2013, 168, 53–65. [Google Scholar]
- da Silva, A.L.B.R.; Zotarelli, L.; Dukes, M.D.; van Santen, E.; Asseng, S. Nitrogen fertilizer rate and timing of application for potato under different irrigation methods. Agric. Water Manag. 2023, 283, 108312. [Google Scholar] [CrossRef]
- Feng, W.; Li, P.; Zheng, C.; Sun, M.; Shao, J.; Li, X.; Dong, H. Split-nitrogen application increases nitrogen-use efficiency and yield of cotton. Nutr. Cycl. Agroecosyst. 2023, 125, 393–407. [Google Scholar] [CrossRef]
- Gao, X.; Parsonage, S.; Tenuta, M.; Baron, K.; Hanis-Gervais, K.; Nelson, A.; Tomasiewicz, D.; Mohr, R. Nitrogen Fertilizer Management Practices to Reduce N2O Emissions from Irrigated Processing Potato in Manitoba. Am. J. Potato Res. 2017, 94, 390–402. [Google Scholar] [CrossRef]
- Ekwunife, K.C.; Madramootoo, C.A.; Abbasi, N.A. Assessing the impacts of tillage, cover crops, nitrification, and urease inhibitors on nitrous oxide emissions over winter and early spring. Biol. Fert. Soils. 2022, 58, 195–206. [Google Scholar] [CrossRef]
- Akiyama, H.; Yan, X.; Yagi, K. Evaluation of effectiveness of enhanced-efficiency fertilizers as mitigation options for N2O and NO emissions from agricultural soils: Meta-analysis. Glob. Chang. Biol. 2010, 16, 1837–1846. [Google Scholar] [CrossRef]
- Burton, D.L.; Zebarth, B.J.; Gillam, K.M.; MacLeod, J.A. Effect of split application of fertiliser nitrogen on N2O emissions from potatoes. Can. J. Soil Sci. 2008, 88, 229–239. [Google Scholar] [CrossRef]
- Davenport, J.R.; Milburn, P.H.; Rosen, C.J.; Thornton, R.E. Environmental Impacts of Potato Nutrient Management. Am. J. Potato Res. 2005, 82, 321–328. [Google Scholar] [CrossRef]
- Thapa, R.; Mirsky, S.B.; Tully, K.L. Cover Crops Reduce Nitrate Leaching in Agroecosystems: A Global Meta-Analysis. J. Environ. Qual. 2018, 47, 1400–1411. [Google Scholar] [CrossRef]
- Ministerio del Medio Ambiente (MMA). 5to Informe Bienal de Actualización Ante la Convención Marco de las Naciones Unidas Sobre Cambio Climático; Ministerio del Medio Ambiente de Chile: Santiago, Chile, 2022; 384p. [Google Scholar]
- Food and Agricultural Organization (FAO). World Food and Agriculture–Statistical Yearbook 2023. Food and Agricultural Organization (FAO): Rome, Italy, 2023. [Google Scholar] [CrossRef]
- Oficina de Estudios y Políticas Agrarias (Odepa). Boletín de la Papa Noviembre 2023 Información de Mercado Nacional y Comercio Exterior Hasta Octubre 2023; Oficina de Estudios y Políticas Agrarias: Santiago, Chile, 2023; 17p. [Google Scholar]
- Venterea, R.T.; Hyatt, C.R.; Rosen, C.J. Fertilizer management effects on nitrate leaching and indirect nitrous oxide emissions in irrigated potato production. J. Environ. Qual. 2011, 40, 1103–1112. [Google Scholar] [CrossRef] [PubMed]
- Sandaña, P.; Rojas, J.S.; Orena, S.; Kalazich, J.K. Fertilización Nitrogenada Para el Cultivo de Papa en la Zona Centro-Sur de Chile; Informativo INIA N°108; Instituto de Investigaciones Agropecuarias: Santiago, Chile, 2012; 4p. [Google Scholar]
- Servicio Agrícola y Ganadero (SAG). Variedades Certificadas De Papa. 2019. Available online: https://www.sag.gob.cl/sites/default/files/variedades_cert_papas_triptico.pdf (accessed on 8 August 2024).
- Acuña, I.; Muñoz, M.; Sandaña, P.; Orena, S.; Bravo, R.; Kalazich, J.; Tejeda, P.; Castro, M.P.; Sandoval, C. Manual Interactivo de la Papa INIA; Instituto de Investigaciones Agropecuarias (INIA): Santiago, Chile, 2015; Available online: http://manualinia.papachile.cl (accessed on 8 January 2024).
- Pinochet, D.; Clunes, J.; Gauna, C.; Contreras, A. Reasoned fertilisation of potato in response to Nitrogen supply in Andisols. J. Soil Sci. Plant Nutr. 2018, 18, 790–803. [Google Scholar]
- Koch, M.; Naumann, M.; Pawelzik, E.; Gransee, A.; Thiel, H. The importance of nutrient management for potato production Part I: Plant nutrition and yield. Potato Res. 2020, 63, 97–119. [Google Scholar] [CrossRef]
- Zebarth, B.J.; Snowdon, E.; Burton, D.L.; Goyer, C.; Dowbenko, R. Controlled release fertilizer product effects on potato crop response and nitrous oxide emissions under rain-fed production on a medium-textured soil. Can. J. Soil Sci. 2012, 92, 759–769. [Google Scholar] [CrossRef]
- Haverkort, A.J.; Sandaña, P.; Kalazich, J. Yield gaps and ecological footprints of potato production systems in Chile. Potato Res. 2014, 57, 13–31. [Google Scholar] [CrossRef]
- Sandaña, P.; Kalazich, J. Attainable CO2 Emission of Ware Potatoes Under High Yield Conditions in Southern Chile. Am. J. Potato Res. 2015, 92, 318–325. [Google Scholar] [CrossRef]
- Centro de Información de Recursos Naturales (CIREN). Descripciones de Suelos, Materiales y Símbolos. Estudio Agrológico X Región. Tomo II.; Centro de Información de Recursos Naturales (CIREN): Santiago, Chile, 2003. [Google Scholar]
- IUSS Working Group WRB. World Reference Base for Soil Resources. International Soil Classification System for Naming Soils and Creating Legends for Soil Maps, 4th ed.; International Union of Soil Sciences (IUSS): Vienna, Austria, 2022. [Google Scholar]
- Sadzawka, A.; Carrasco, M.A.; Grez, R.; Mora, M.L.; Flores, H.; Neuman, A. Métodos de Análisis Recomendados Para los Suelos Chilenos. Revisión 2006; Instituto de Investigaciones Agropecuarias INIA: Santiago, Chile, 2006. [Google Scholar]
- Rowell, D.L. Soil Science: Methods and Applications; Addison Wesley Longman Limited: Essex, UK, 1997. [Google Scholar]
- Tabatabai, M.A. Sulfur. In Method of Soil Analysis. Part 2. Microbiological and Chemical Properties, 2nd ed.; Page, A.L., Müller, R.H., Keent, D.R., Eds.; Book Series N_5; Soil Science Society of America: Madison, WI, USA, 2015; pp. 501–538. [Google Scholar]
- Sadzawka, A.; Carrasco, M.A.; Demanet, R.; Flores, H.; Grez, R.; Mora, M.L.; Neuman, A. Métodos de Análisis de Tejidos Vegetales, 2nd ed.; Serie Actas N40; Instituto de Investigaciones Agropecuarias INIA: Santiago, Chile, 2007. [Google Scholar]
- Barton, L.; Kiese, R.; Gatter, D.; Butterbach-Bahl, K.; Buck, R.; Hinz, C.; Murphy, D. Nitrous oxide emissions from a cropped soil in a semi-arid climate. Glob. Chang. Biol. 2008, 14, 177–192. [Google Scholar] [CrossRef]
- Scheer, C.; Grace, P.R.; Rowlings, D.W.; Payero, J. Soil N2O and CO2 emissions from cotton in Australia under varying irrigation management. Nutr. Cycl. Agroecosyst. 2013, 95, 43–56. [Google Scholar] [CrossRef]
- Saggar, S.; Andrew, R.M.; Tate, K.R.; Hedley, C.B.; Rodda, N.J.; Townsend, J.A. Modelling nitrous oxide emissions from dairy-grazed pastures. Nutr. Cycl. Agroecosyst. 2004, 68, 243–255. [Google Scholar] [CrossRef]
- Rens, L.; Zotarelli, L.; Alva, A.; Rowland, D.; Liu, G.; Morgan, K. Fertilizer nitrogen uptake efficiencies for potato as influenced by application timing. Nutr. Cycl. Agroecosyst. 2016, 104, 175–185. [Google Scholar] [CrossRef]
- Hyatt, C.; Venterea, R.; Rosen, C.; McNearney, M.; Wilson, M.; Dolan, M. Polymer-Coated Urea Maintains Potato Yields and Reduces Nitrous Oxide Emissions in a Minnesota Loamy Sand. Soil Sci. Soc. Am. J. 2010, 74, 419–428. [Google Scholar] [CrossRef]
- Clément, C.C.; Cambouris, A.N.; Ziadi, N.; Zebarth, B.J.; Karam, A. Potato Yield Response and Seasonal Nitrate Leaching as Influenced by Nitrogen Management. Agronomy 2021, 11, 2055. [Google Scholar] [CrossRef]
- Tiwari, J.K.; Buckseth, T.; Singh, R.K.; Kumar, M.; Kant, S. Prospects of Improving Nitrogen Use Efficiency in Potato: Lessons from Transgenics to Genome Editing Strategies in Plants. Front. Plant Sci. 2020, 11, 597481. [Google Scholar] [CrossRef]
- Cardenas, L.; Hatch, D.; Scholefield, D.; Jhurreea, D.; Clark, I.; Hirsch, P.; Salazar, F.; Rao-Ravella, S.; Alfaro, M. Potential mineralization and nitrification in volcanic grassland soils in Chile. J. Soil Sci. Plant Nutr. 2013, 59, 380–391. [Google Scholar] [CrossRef]
- Kizewski, F.; Kaye, J.; Martínez, C. Nitrate transformation and immobilization in particulate organic matter incubations: Influence of redox, iron and (a)biotic conditions. PLoS ONE 2019, 14, e0218752. [Google Scholar] [CrossRef]
- Li, S.; Jiang, X.; Wang, X.; Wright, A.L. Tillage effects on soil nitrification and the dynamic changes in nitrifying microorganisms in a subtropical rice-based ecosystem: A long-term field study. Soil Tillage Res. 2015, 150, 132–138. [Google Scholar] [CrossRef]
- Huygens, D.; Rütting, T.; Boeckx, P.; Cleemput, O.; Godoy, R.; Müller, C. Soil nitrogen conservation mechanisms in a pristine south Chilean Nothofagus forest ecosystem. Soil Biol. Biochem. 2007, 39, 2448–2458. [Google Scholar] [CrossRef]
- Martínez-Lagos, J.; Salazar, F.; Alfaro, M.; Rosas, M.; Macías, F. Nitrogen mineralization in a silandic andosol fertilized with dairy slurry and urea. J. Soil Sci. Plant Nutr. 2015, 15, 60–75. [Google Scholar]
- Knox, J.W.; Daccache, A.; Weatherhead, E.K.; Stalham, M. Climate Change and Potatoes; An information booklet produced for PCL (AHDB); Cranfield University: Cranfield, England, 2011. [Google Scholar]
- Shrestha, B.; Darapuneni, M.; Stringam, B.L.; Lombard, K.; Djaman, K. Irrigation Water and Nitrogen Fertilizer Management in Potato (Solanum tuberosum L.): A Review. Agronomy 2023, 13, 2566. [Google Scholar] [CrossRef]
- Dimkpa, C.O.; Fugice, J.; Singh, U.; Lewis, T.D. Development of fertilizers for enhanced nitrogen use efficiency–Trends and perspectives. Sci. Total Environ. 2020, 731, 139113. [Google Scholar] [CrossRef]
- Hube, S.; Alfaro, M.A.; Scheer, C.; Brunk, C.; Ramírez, L.; Rowlings, D.; Grace, P. Effect of nitrification and urease inhibitors on nitrous oxide and methane emissions from an oat crop in a volcanic ash soil. Agric. Ecosyst. Environ. 2017, 238, 46–54. [Google Scholar] [CrossRef]
- Alfaro, M.; Salazar, F.; Hube, S.; Ramírez, L.; Mora, M. Ammonia and nitrous oxide emissions as affected by nitrification and urease inhibitors. J. Soil Sci. Plant Nutr. 2018, 18, 479–486. [Google Scholar]
- Thilakarathna, S.K.; Konschuh, M.; Woods, S.A.; Hernandez-Ramirez, G. Nitrous oxide emissions and productivity of irrigated potato: Effects of nitrogen fertilization options. Agron. J. 2022, 115, 161–180. [Google Scholar] [CrossRef]
- The Intergovernmental Panel on Climate Change (IPCC). Refinement to the 2006 IPCC Guidelines for National Greenhouse Gas Inventories. In Chapter 11: N2O Emissions from Managed Soils, and CO2 Emissions from Lime and Urea Application 2019; The Intergovernmental Panel on Climate Change: Geneva, Switzerland, 2019. [Google Scholar]


| Parameter | Before Planting | During Vegetation | |
|---|---|---|---|
| 2016/17 | 2017/18 | ||
| Classification 1 | Silándic Andosol | ||
| Series 2 | Osorno | ||
| Soil texture | Loamy | ||
| pH H2O (soil:water, 1:2.5) | 5.7 ± 0.08 | 5.7 ± 0.09 | 5.7 ± 0.11 |
| pH CaCl2 (soil:CaCl2, 1:2.5) | 5.0 ± 0.07 | 4.9 ± 0.08 | 4.9 ± 0.09 |
| Total N 3 (g kg−1) | 14.0 ± 0.15 | Not measured | Not measured |
| Available N (mg kg−1) | 7.8 ± 0.86 | 10.4 ± 0.63 | 9.7 ± 2.67 |
| Organic Carbon (g kg−1) | 15.8 ± 0.71 | 13.6 ± 0.72 | 14.7 ± 0.68 |
| Olsen P (mg kg−1) | 30.3 ± 1.71 | 29.7 ± 0.87 | 28.4 ± 0.55 |
| Available S (mg kg−1) | 42.8 ± 3.02 | 30.3 ± 2.51 | 31.6 ± 3.56 |
| Exchangeable Ca (cmol (+) kg−1) | 5.4 ± 0.62 | 5.1 ± 0.92 | 4.2 ± 1.00 |
| Exchangeable Mg (cmol (+) kg−1) | 0.6 ± 0.07 | 0.5 ± 0.07 | 0.4 ± 0.07 |
| Exchangeable K (cmol (+) kg−1) | 0.5 ± 0.05 | 0.5 ± 0.06 | 0.6 ± 0.06 |
| Exchangeable Na (cmol (+) kg−1) | 0.1 ± 0.01 | 0.1 ± 0.02 | 0.1 ± 0.01 |
| Al Saturation (%) | 2.4 ± 0.89 | 4.4 ± 2.57 | 7.0 ± 4.80 |
| Bulk density (g cm−3) | 0.66 ± 0.021 | 0.69 ± 0.016 | 0.66 ± 0.022 |
| Particle density (g cm−3) | 1.78 ± 0.05 | ||
| Season | Parameter | N Rate Applied (kg N ha−1 yr−1) | Treatment Effect | |||
|---|---|---|---|---|---|---|
| 0 | 80 | 150 | 300 | |||
| 2016/17 | ||||||
| Crop | Potato yield (t DM ha−1) | 8.8 ± 0.65 b | 12.7 ± 0.88 a | 11.3 ± 1.06 a | 11.9 ± 0.78 a | * |
| Oat yield (t DM ha−1) | 2.0 ± 0.20 | 2.3 ± 0.17 | 2.4 ± 0.22 | 2.3 ± 0.17 | NS | |
| N uptake (kg N ha−1) | 150 ± 22.1 b | 226 ± 26.8 a | 220 ± 11.6 a | 242 ± 31.0 a | * | |
| NUE (%) | NA | 95.5 ± 27.0 a | 46.2 ± 17.9 b | 30.5 ± 7.4 b | * | |
| Seed yield (t ha−1) 1 | 16.9 ± 2.88 | 16.5 ± 0.35 | 16.5 ± 1.99 | 16.2 ± 1.80 | NS | |
| Fresh consumption (t ha−1) 1 | 26.2 ± 4.66 | 41.6 ± 2.49 | 37.3 ± 3.98 | 39.5 ± 4.05 | NS | |
| Emissions of N2O | Potato (kg N2O-N ha−1) | 1.4 ± 0.03 c | 2.1 ± 0.04 b | 2.2 ± 0.08 b | 3.2 ± 0.26 a | * |
| Oat (kg N2O-N ha−1) | 0.4 ± 0.03 | 0.5 ± 0.05 | 0.6 ± 0.02 | 0.7 ± 0.01 | NS | |
| EI (kg N2O-N t DM−1) | 0.19 ± 0.02 b | 0.18 ± 0.02 b | 0.22 ± 0.03 b | 0.29 ± 0.01 a | * | |
| EF (%) | NA | 0.87 ± 0.15 | 0.62 ± 0.08 | 0.72 ± 0.09 | NS | |
| 2017/18 | ||||||
| Crop | Potato yield (t DM ha−1) | 5.1 ± 0.54 | 4.9 ± 0.29 | 6.1 ± 0.13 | 6.3 ± 0.33 | NS |
| Oat yield (t DM ha−1) | 1.9 ± 0.03 | 2.0 ± 0.12 | 2.0 ± 0.22 | 1.9 ± 0.12 | NS | |
| N uptake (kg N ha−1) | 109.9 ± 12.9 | 140.5 ± 1.7 | 136.8 ± 16.3 | 173.4 ± 15.3 | NS | |
| NUE (%) | NA | 93.5 ± 21.3 | 49.0 ± 18.2 | 30.1 ± 8.2 | NS | |
| Seed yield (t ha−1) 1 | 8.9 ± 0.59 | 9.2 ± 0.25 | 10.2 ± 0.79 | 11.7 ± 0.81 | NS | |
| Fresh consumption (t ha−1) 1 | 13.7 ± 1.16 | 16.5 ± 0.79 | 18.4 ± 0.19 | 16.9 ± 0.10 | NS | |
| Emissions of N2O | Potato (kg N2O-N ha−1) | 0.2 ± 0.01 | 0.3 ± 0.02 | 0.3 ± 0.06 | 0.4 ± 0.04 | NS |
| Oat (kg N2O-N ha−1) | 0.5 ± 0.01 | 0.6 ± 0.01 | 0.7 ± 0.01 | 0.7 ± 0.01 | NS | |
| EI (kg N2O-N t DM−1) | 0.12 ± 0.01 b | 0.13 ± 0.003 b | 0.13 ± 0.01 b | 0.16 ± 0.02 a | * | |
| EF (%) | NA | 0.09 ± 0.03 | 0.16 ± 0.05 | 0.16 ± 0.03 | NS | |
| Overall rotation | ||||||
| Yield (t DM ha−1) | 8.9 ± 0.87 b | 10.9 ± 1.73 a | 10.9 ± 1.22 a | 11.2 ± 1.28 a | * | |
| N uptake (kg N ha−1) | 147 ± 21.0 b | 223 ± 16.6 a | 219 ± 18.3 a | 238 ± 15.2 a | * | |
| NUE (%) | NA | 94 ± 24.2 a | 48 ± 12.8 b | 30 ± 5.5 c | * | |
| Seed yield (t ha−1) 1 | 12.9 ± 2.20 | 12.9 ± 1.50 | 13.4 ± 1.68 | 13.9 ± 1.34 | NS | |
| Fresh consumption (t ha−1) 1 | 20.0 ± 3.51 | 29.0 ± 5.29 | 27.9 ± 4.34 | 28.2 ± 5.03 | NS | |
| N2O (kg N2O-N ha−1) | 1.4 ± 0.01 c | 1.8 ± 0.07 bc | 2.0 ± 0.09 b | 2.7 ± 0.17 a | *** | |
| EI (kg N2O-N t DM−1) | 0.15 ± 0.01 b | 0.16 ± 0.01 b | 0.17 ± 0.02 b | 0.22 ± 0.01 a | *** | |
| EF (%) | NA | 0.48 ± 0.09 | 0.39 ± 0.06 | 0.44 ± 0.06 | NS | |
Disclaimer/Publisher’s Note: The statements, opinions and data contained in all publications are solely those of the individual author(s) and contributor(s) and not of MDPI and/or the editor(s). MDPI and/or the editor(s) disclaim responsibility for any injury to people or property resulting from any ideas, methods, instructions or products referred to in the content. |
© 2024 by the authors. Licensee MDPI, Basel, Switzerland. This article is an open access article distributed under the terms and conditions of the Creative Commons Attribution (CC BY) license (https://creativecommons.org/licenses/by/4.0/).
Share and Cite
Alfaro, M.; Hube, S.; Salazar, F.; Beltrán, I.; Ramírez, L.; Saggar, S. Optimising Nitrogen Fertilisation in a Potato–Oat Rotation and Implications for Nitrous Oxide Emissions in Volcanic Soils. Agronomy 2024, 14, 2202. https://doi.org/10.3390/agronomy14102202
Alfaro M, Hube S, Salazar F, Beltrán I, Ramírez L, Saggar S. Optimising Nitrogen Fertilisation in a Potato–Oat Rotation and Implications for Nitrous Oxide Emissions in Volcanic Soils. Agronomy. 2024; 14(10):2202. https://doi.org/10.3390/agronomy14102202
Chicago/Turabian StyleAlfaro, Marta, Sara Hube, Francisco Salazar, Ignacio Beltrán, Luis Ramírez, and Surinder Saggar. 2024. "Optimising Nitrogen Fertilisation in a Potato–Oat Rotation and Implications for Nitrous Oxide Emissions in Volcanic Soils" Agronomy 14, no. 10: 2202. https://doi.org/10.3390/agronomy14102202
APA StyleAlfaro, M., Hube, S., Salazar, F., Beltrán, I., Ramírez, L., & Saggar, S. (2024). Optimising Nitrogen Fertilisation in a Potato–Oat Rotation and Implications for Nitrous Oxide Emissions in Volcanic Soils. Agronomy, 14(10), 2202. https://doi.org/10.3390/agronomy14102202