Article

Comprehensive Morphometric and Biochemical Characterization of Seven Basil (Ocimum basilicum L.) Genotypes: Focus on Light Use Efficiency

1
Department of Agricultural Sciences, Food and Environment-Di3A, University of Catania, Via Valdisavoia 5, 95123 Catania, Italy
2
National Research Council of Italy, Institute of Biomolecular Chemistry (CNR-ICB), Via P. Gaifami 18, 95126 Catania, Italy
*
Author to whom correspondence should be addressed.
Agronomy 2024, 14(1), 224; https://doi.org/10.3390/agronomy14010224
Submission received: 19 December 2023 / Revised: 12 January 2024 / Accepted: 17 January 2024 / Published: 20 January 2024
(This article belongs to the Section Horticultural and Floricultural Crops)

Abstract

:
The choice of basil (Ocimum basilicum L.) genotypes determines key attributes such as yield, flavor, and adaptability, contributing significantly to the overall success and sustainability of basil cultivation practices. As the primary aim of this study, seven basil accessions were characterized for both their growth performance and biochemical profile of volatile compounds, enabling the differentiation among distinct chemotypes. As secondary objectives, growth performance and production were evaluated under natural solar radiation conditions (SR100) and with a 30% reduction in solar radiation using a net (SR70). Light use efficiency (LUE) determination revealed the plants’ biomass production capability under different solar radiation (SR) conditions. Genotypes A, B, C, and G were characterized by a high levels of linalool, which is typically associated with the “pesto” sauce smell. Lemon basil D exhibited a different chemotype due to the presence of neral and geranial. E and F displayed a different chemotype due to the higher concentration of α-bergamotene. The total fresh harvested biomass was significantly higher in SR70 than SR100 conditions. The second harvest in both SR conditions was the most productive one, while genotype E under SR70 displayed the highest yield. The landraces D and E showed the highest LUE values, indicating their capability in converting the solar radiation into fresh biomass. Plants grown in SR70 conditions registered significantly higher values of plant height, number of branches, and leaf weight. This work aimed to provide valuable insights into the selection of basil genotypes suitable for sustainable agriculture. Conversely, it lays the basis for cultivation aspects pertaining to the crop’s adaptability in peri-urban, marginal lands, which are characterized by limited solar radiation.

1. Introduction

The Ocimum genus includes more than 150 species globally; however, the most commercially significant cultivars are found within the O. basilicum L. species. In particular, sweet basil (O. basilicum, x = n = 12) stands out as a vital essential oil crop in the Labiatae family, finding numerous applications [1]. Its distinct aroma and flavor, coupled with its rich history, have made it a cherished herb in various culinary traditions around the world [2,3]. Basil is valued not only for its culinary attributes but also for its potential therapeutic properties due to its high concentration of a wide range of bioactive compounds with various health benefits [4]. Traditionally, basil leaves have been used to address a variety of health disorders, including renal affection, menstrual irregularities, symptoms of arthritis, and loss of appetite [5,6,7].
The cultivation of basil has a long history that developed in the last few centuries. Its popularity is still growing in addition to the expansion of its range of applications and uses. Nowadays, the demand for basil has significantly increased, with a growing interest for exploiting the biochemical diversity among different basil genotypes. The various basil cultivars exhibit unique chemical profiles, which not only influence their culinary and aromatic qualities, but also offer the potential for pharmaceutical and industrial applications [8,9].
Within the basil genotypes, variations abound, encompassing diverse characteristics such as leaf sizes, a spectrum of colors from green to dark purple, a range of flower colors (white, red, lavender, and purple), distinct growth features including shape, height, and flowering time, and a diverse array of aromas. The broad range of aromatic and volatile compounds within its essential oil encompasses oxygenated and aromatic monoterpenes such as linalool, p-allyl-anisole (estragole), neral, geranial, and eugenol [10,11,12]. Notably, basil has potential applications in novel food products, including sprouts, microgreens, and baby leaves [13,14,15].
It is worth mentioning that basil plants are sensitive to environmental stressors, particularly excessive sunlight and high temperatures [16,17,18]. To mitigate the adverse effects of such stressors and to significantly reduce energy usage, shading systems have emerged as a valuable tool in enhancing the growth parameters and overall performance of basil crops [19]. These systems offer a degree of control over the growing environment, allowing for the manipulation of light and temperature conditions to create an optimal environment for basil cultivation. The determination of the optimal light intensity and photoperiod is crucial for basil cultivation in open fields, greenhouses, and growth chambers [20,21,22]. As was outlined by these studies, the careful selection of basil genotypes holds immense significance, aligning with diverse agronomic purposes.
Modern agriculture is facing several challenges that encompass the growing population pressures, the increased demand for agricultural production, and the utilization of land resources, which have become critical aspects [23,24,25,26].
To address these challenges, the cultivation of plants in shaded environments has emerged as a strategic solution not only for optimizing land use and management but also to enhance overall agricultural sustainability [27,28].
Shaded agriculture, often achieved through the application of shading systems or agroforestry practices, allows for the efficient utilization of land not typically subjected to direct sun exposure. This innovative approach extends the productive capacity of available land, making it possible to grow a wider range of crops and increase overall yields [29,30,31,32]. The use of shade-adapted plants could also be exploited for urban agriculture, improving the sustainability of the food supply and reducing the costs associated with transporting food supplies over long distances [33,34,35]. For achieve this goal, plants must reach maximum photosynthesis at a lower level of saturating irradiance [36]. Notably, crop cultivation in shaded environments contributes to the sustainability of agroecosystems, as it eliminates the need to remove neighboring trees during their establishment [37].
In agriculture, optimizing light use efficiency (LUE) is crucial for maximizing crop productivity, as it directly influences the amount of biomass produced per unit of absorbed solar radiation, providing insights into the overall efficiency of the photosynthetic process. Within this context, LUE is a measure of how effectively plants convert solar radiation into biomass, which indicates the efficiency of photosynthesis in utilizing available light for growth. Several LUE estimation models have been proposed to estimate terrestrial gross primary production (GPP) at local, regional, and global scales [38,39,40,41].
Among the crops suitable for the cultivation employing varying shading levels, basil emerges as an optimal candidate. This species is a widely cultivated herb known for its culinary and medicinal significance.
Within this context, seven basil genotypes were evaluated for their morphometric response under different shading conditions and for their different chemotypes through an analysis of their essential oils. After exploring these key aspects, the aim of the current study was to assess the impact of solar radiation on basil growth. Specifically, two solar radiation conditions were applied, simulating open field cultivation and cultivation under a shading net resulting in a 30% reduction in solar radiation. The light use efficiency was calculated. The purpose of this study was to offer valuable insights into the primary aspects related to the selection of a suitable basil genotype to promote the sustainable and efficient production of fresh basil leaves. In addition, this work aimed to optimize shading system protocols, contributing to the advancement of sustainable agriculture, particularly in peri-urban, marginal lands.

2. Materials and Methods

2.1. Experimental Site and Biological Materials

The experimental trial was carried out in the experimental open field belonging to the Department of Agriculture, Food, and Environment (Di3A) of the University of Catania (UNICT). The field is situated 50 m above sea level in Catania (37°24′33″ N, 15°03′32″ E). The chosen experimental field was situated in a peri-urban area, which was strategically selected to enhance the value of marginal lands in close proximity to the city.
The plant materials consisted of seven accessions of O. basilicum belonging to the GenBank of vegetables of the Dipartimento di Agricoltura, Alimentazione e Ambiente (Di3A) of the University of Catania (Table 1).
The analyzed genotypes were selected for their distinguishable traits. In particular, genotypes A, C, D, and G are identifiable by their large and green leaves, B exhibits unique purple leaves, E is distinguishable by its small and green leaves, and finally F is distinguishable by its broad green leaf lamina with undulated surface. The primary purpose of the current research was to provide valuable insights regarding basil genotype selection for different agronomic purposes. Additionally, the agronomic performances under different solar radiation (SR) conditions were evaluated.

2.2. Experimental Design and Growing Practices

The experimental design adopted was a split plot design with randomized blocks. Each block included three replicates per genotype and each replicate consisted of 10 plants. Sowing was carried out in the middle of May 2020 in cellular trays within the University nursery situated at the same location as the experimental field. The process was conducted under controlled humidity and temperature conditions, maintaining an average temperature of 20 °C. The organic growing substrate used for sowing was Terri Bio® (Agro-Chimica S.p., Bolzano, Italy).
On 14 June 2020, plantlets were transplanted into the clay soil of the experimental field. Plantlets were arranged at a crop density of 9 plants m−2, with a distance of 40 cm between the rows and 30 cm within a row. The soil of the experimental field was 43% clay, 30% silt, 27% sand, about 1% organic matter, 0.1% total nitrogen, 10 ppm available P2O5, 114 ppm exchangeable K2O, and a pH of 7.1.

2.3. Plant Morphometric Characterization

Plantlets were characterized by their bio-morphometric traits, which are listed in Table 2. The morphometric assessment was conducted at the first harvest. In particular, the analyzed traits encompassed plant height (PH), the number of branches (PB), leaf lamina length and width (LL and LWI, respectively), and leaf blistering, which assigned scores for its absence (0) and presence (1). Leaf chromatic CIEL*a*b* parameters were registered using a colorimeter (Chroma meter CR-200, MINOLTA, Osaka, Japan). In the leaf chromatic analysis performed, L* represented lightness, a* indicated the red/green coordinate, and b* signified the yellow/blue coordinate. Plant fresh biomass was harvested four times, cutting plants from the basal side of the stem at a distance of 10 cm from the soil. Specifically, the first harvest was carried out at 35 days after transplant (DAT), the second one at 56 DAT, the third one at 84 DAT, and finally the fourth one at 119 DAT.

2.4. Light Use Efficiency (LUE) Determination

The light use efficiency for each genotype was calculated based on the total solar radiation (TSR) from 20 June to 20 October, which was 2793.67 MJ m−2 for SR100 and 1955.57 MJ m−2 for SR70. Specifically, the calculation used the following formula:
LUE = (TWE TSR−1) × 100
The value resulting from the ratio between TWE and TSR was expressed in g (MJ m−2)−1 and later, it was converted to a percentage by multiplying it by 100.

2.5. Analyses of Volatile Components

Shade air-dried samples of O. basilicum (A–G) were subjected to steam distillation extraction (SDE) for 3 h, using a Likens–Nickerson-type apparatus with a 1:1 mixture of pentane/diethyl ether as the solvent [42]. The essential oil solutions were immediately analyzed using a Hewlett-Packard gas chromatograph Model 5890 equipped with a flame ionization detector (FID) and coupled to an electronic integrator. The analytical conditions were as follows: ZB-5 capillary column (30 m × 0.25 mm, film thickness 0.25 mm); helium as carrier gas; injection in split mode (1:50); injector and detector temperature of 250 °C and 280 °C, respectively; oven temperature kept at 60 °C for several min, then programmed to increase from 60 to 300 °C at a rate of 2 °C/min. Gas chromatography mass spectroscopy (GC-MS) was carried out using the same chromatograph equipped with a Hewlett-Packard MS computerized system Model 5971A, working in electron impact mode at 70 eV; electron multiplier: 1700 V; ion source temperature: 180 °C; mass spectral data were acquired in the scan mode in the m/z range of 40–400. GC conditions were the same as above.

2.6. Identification of Components of Essential Oils

The identity of the essential oil components was based on their GC retention index (relative to C9-C22 n-alkanes on the SPB-5 column), computer matching of spectral MS data with those from NIST MS libraries [21], comparison of the fragmentation patterns with those reported in the literature [22] and, whenever possible, co-injections with authentic samples. The standards were purchased from Aldrich Chemical Co. (Merck KGaA, Darmstadt, Germany), Honeywell Fluka™ (Morris Plains, NJ, USA), and Extrasynthese (Genay Cedex, France).

2.7. Shading System Set-Up

The shading system included a no shading system with plants grown in open field conditions (SR100) and within a controlled environment (SR70), which consisted of a structure made of 2.5-meter-tall wooden posts connected by iron wires and completely covered with white shading netting with a mesh size of 20/30, resulting in a 30% reduction in solar radiation (SR70). The minimum, maximum, and mean temperatures of the thermal air in both shading conditions (no shading—SR100 and shading applied—SR70) were recorded using a USB data logger (Testo, 174-T, Lenzkirch, Germany). They are reported in Figure 1.
The solar radiation data in SR100 were provided by the Servizio Informativo Agrometerologico Siciliano (SIAS) (http://www.sias.regione.sicilia.it/home.htm, accessed on 18 December 2023) for the period in which the experimental trial was conducted. On the other hand, the SR70 results were determined by applying a 30% reduction to the SR100 data. The empirically calculated values demonstrated a strong agreement with data recorded using a solar radiation data logger that was specifically employed under SR70 conditions. The data logger used was a solar radiation tester (Vici, LX-107, Shenzhen, China). The solar radiation data are reported in Figure 2.

2.8. Data Analysis

The first experimental factor was the different radiation (SR) applied while the genotype (GE) represented the second factor. Analysis of variance (ANOVA) using the Newman–Keuls method was performed using CoStat software version 6.4 (CoHort software, Birmingham, UK). The graphical representation of the Pearson’s correlations was generated using R studio version 3.6.3 and the corrplot package. Conversely, principal component analysis (PCA) was conducted using IBM SPSS version 27 software (IBM, Armonk, NY, USA) and R studio version 3.6.3 with the factoMineR, factoextra, and ggplot2 packages.

3. Results

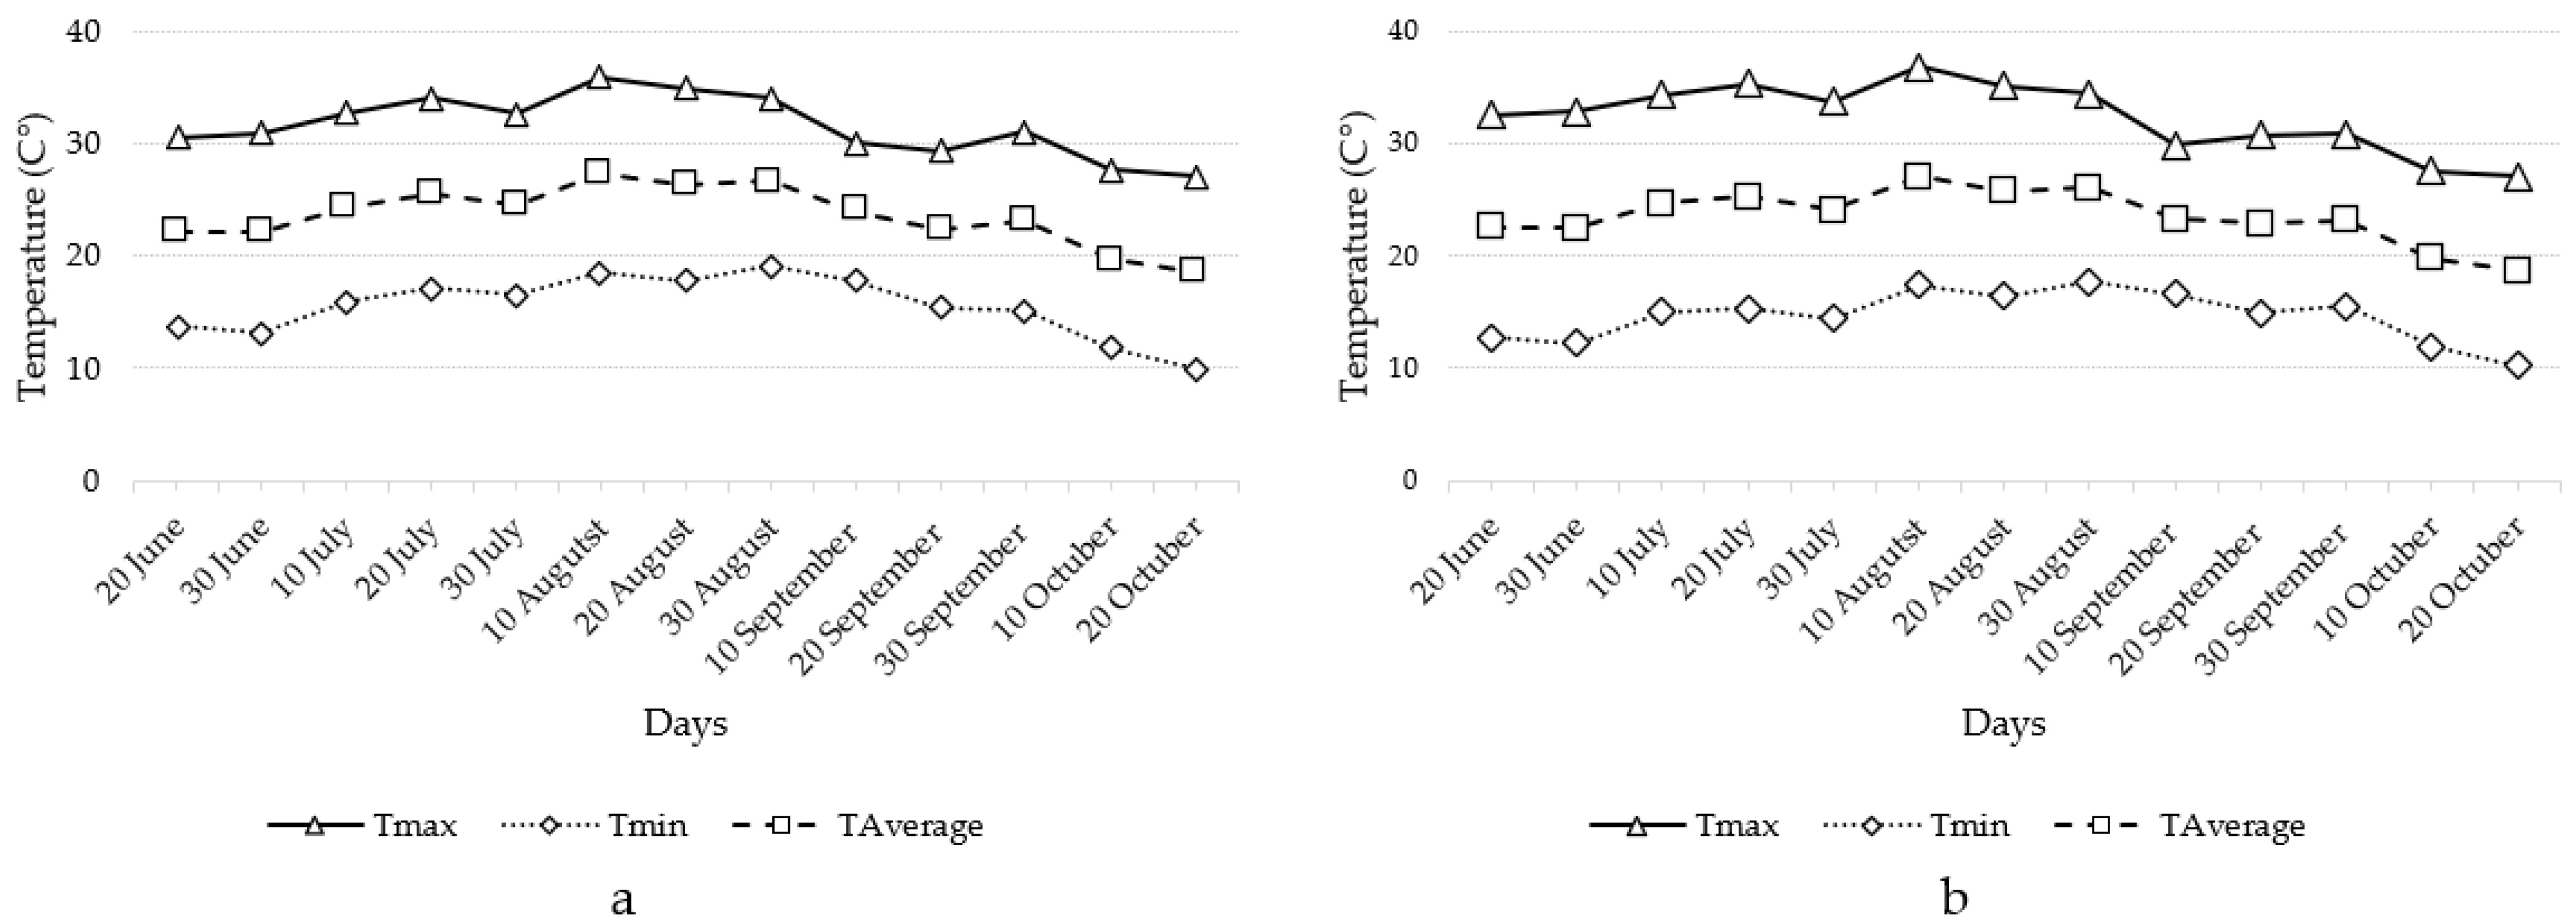
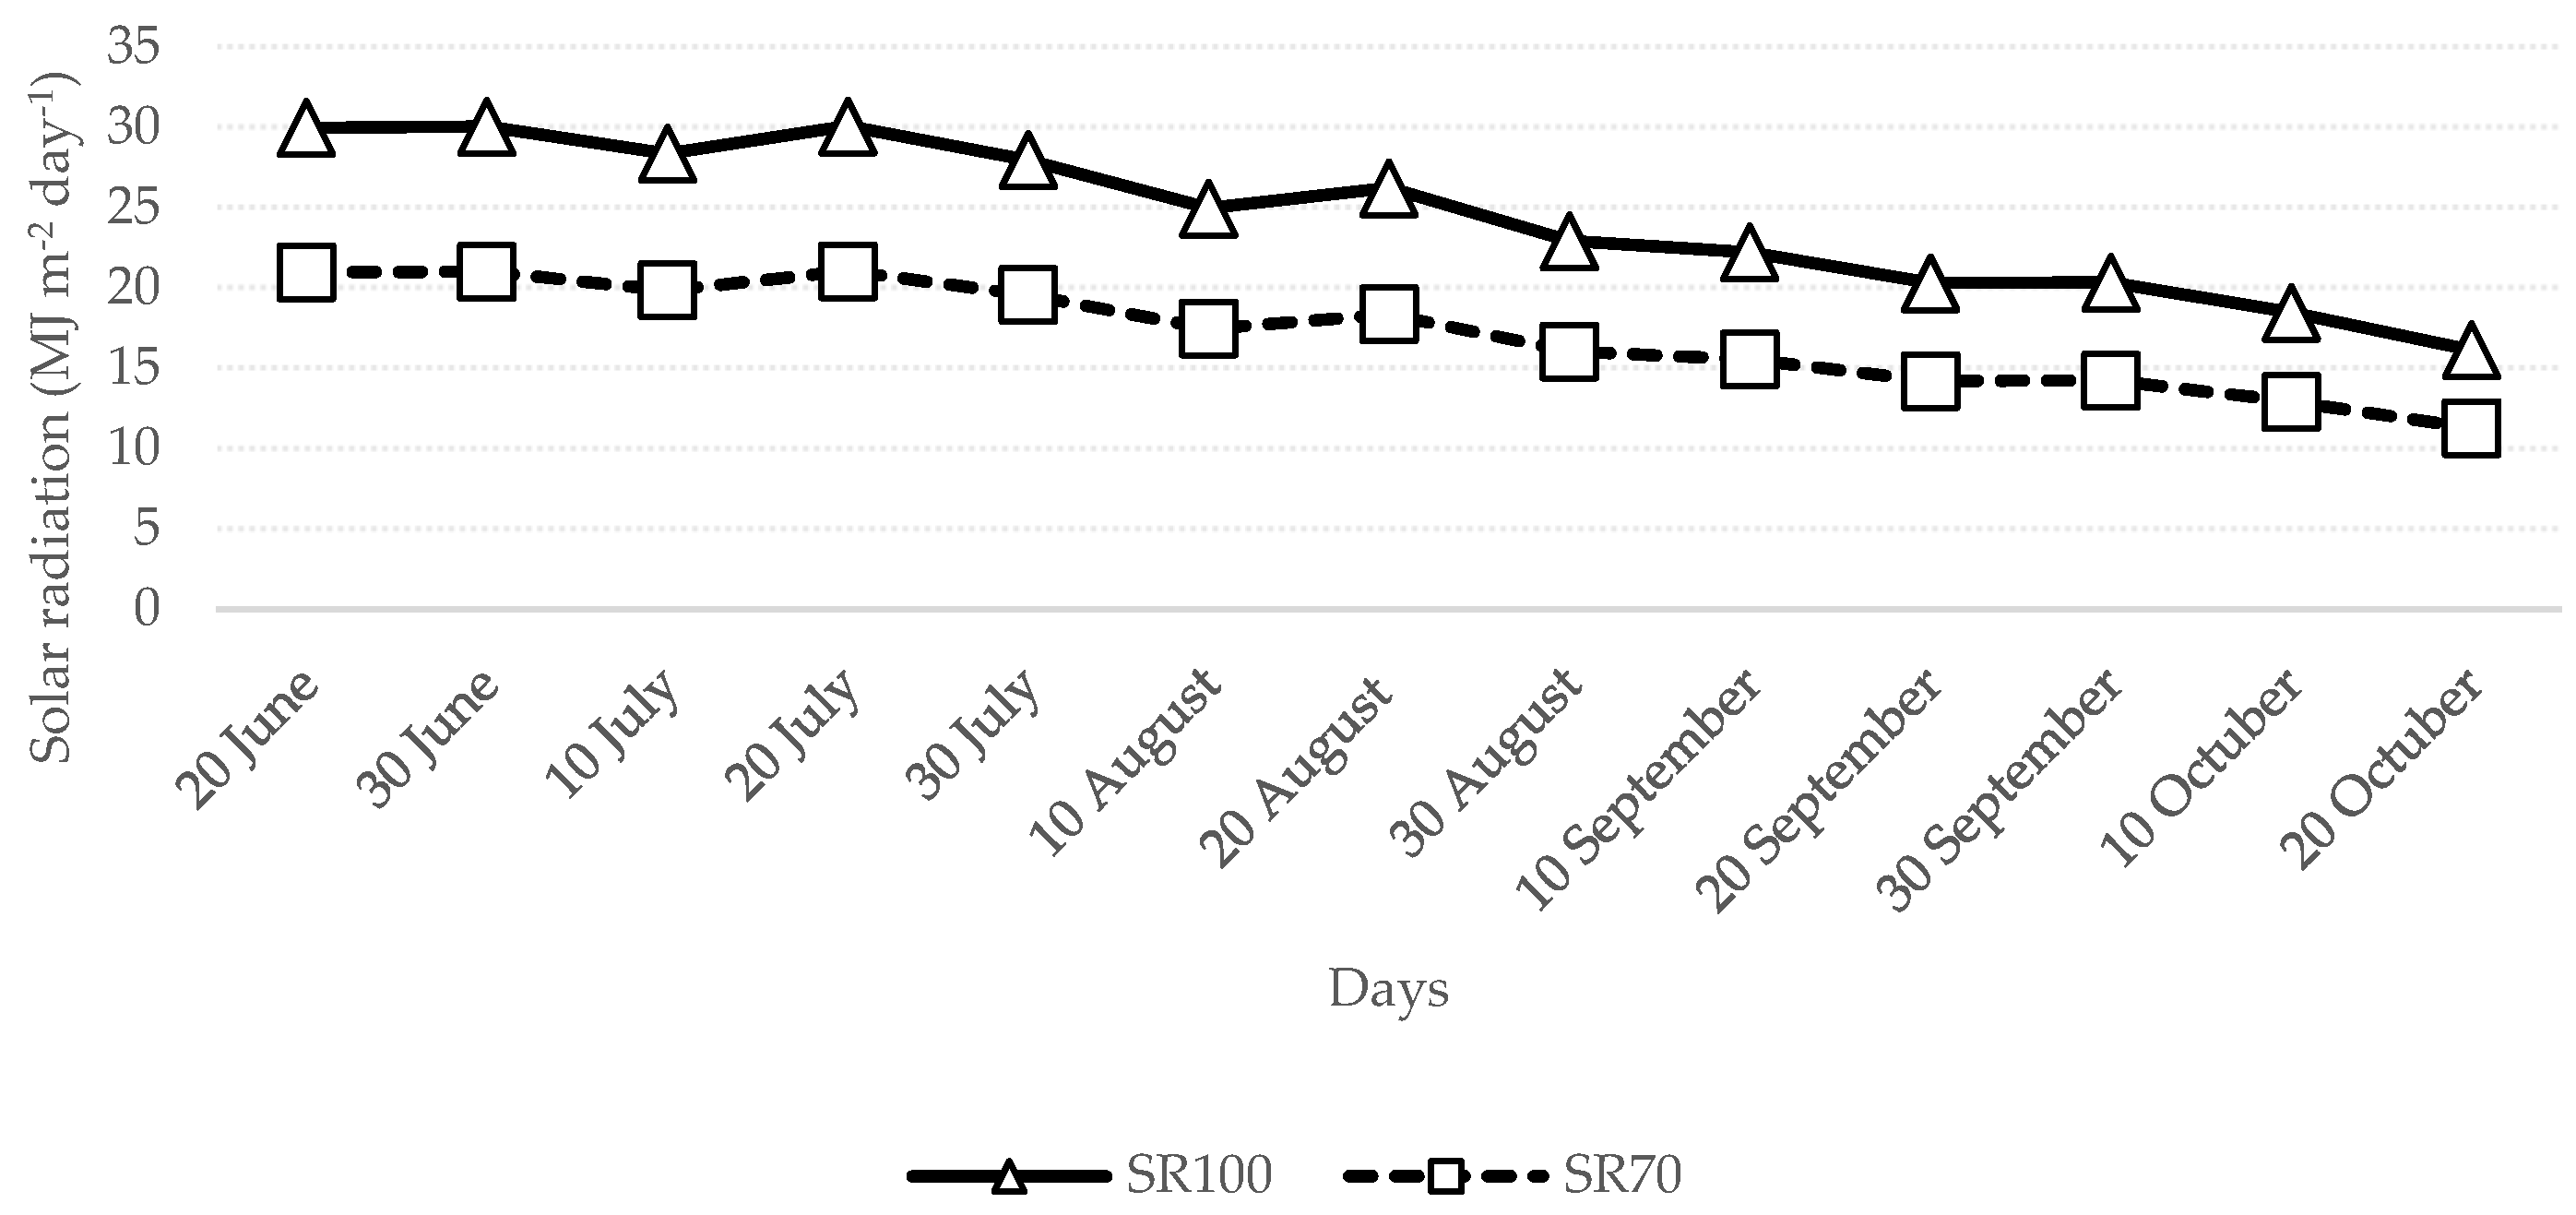
3.1. Climatic Conditions

There were no significant temperature variations detected between the SR70 and SR100 conditions (Figure 1). In contrast, solar radiation decreased by about 30% from SR100 to SR70 (Figure 2).

3.2. Morphometric Characterization of Harvested Plants at Different Stages

There were significant variations among the examined genotypes in plant fresh weight across the four harvesting time points (35, 56, 84, and 119 days after transplant). The harvest weights at 35 days after transplant (DAT) ranged from 54 g to 93.70 g for E and C, respectively (Table 3).
Conversely, at 56 DAT, the harvesting weight ranged from 86.23 g for G to 327.33 g for B. At 84 DAT, the harvesting weight varied from 0.00 g for B, E, and G to 317.20 for D (Table 3). Finally, at 119 DAT, the harvesting weight ranged from 28.30 g to 267.67 g for B and D, respectively (Table 3). The total harvested fresh weight (TWE) varied from 242.53 g for G to 827.27 for D (Table 3).

3.3. Plant Morphometric Characterization

The plant height (PH) ranged from 19.12 cm to 44.08 cm for F and C, respectively (Table 4).
On the other hand, the number of plant branches (PB) spanned between 5.03 and 10.56 branches for D and A, respectively (Table 4). Leaf lamina length (LL) varied from 2.25 cm for E to 8.60 cm for F. Moreover, leaf lamina width (LWI) ranged from 1.04 cm to 7.83 cm for E and F, respectively (Table 4). Regarding leaf blistering (LB), only genotype F consistently exhibited blistering across all replicated leaves. Genotype G showed blistering in only 33% of the examined plants, whereas all other genotypes displayed no blistering on their leaf surfaces. The percentage of leaf weight (LWE) fluctuated among the evaluated genotypes from 35.38% for G to 60.03% for C (Table 4). In contrast, leaf dry matter (LDM) ranged from 9.40% to 13.90% for F and C, respectively. Regarding the chromatic parameters, leaf lightness (LL*) varied from 39.62 for B to 48.79 for B and A (Table 4). Conversely, leaf chromatic parameter a* (La*) spanned from −0.55 to −11.78 for B and A. Finally, leaf chromatic parameter b* (Lb*) fluctuated from 3.12 to 22.60 for B and E, respectively (Table 4).

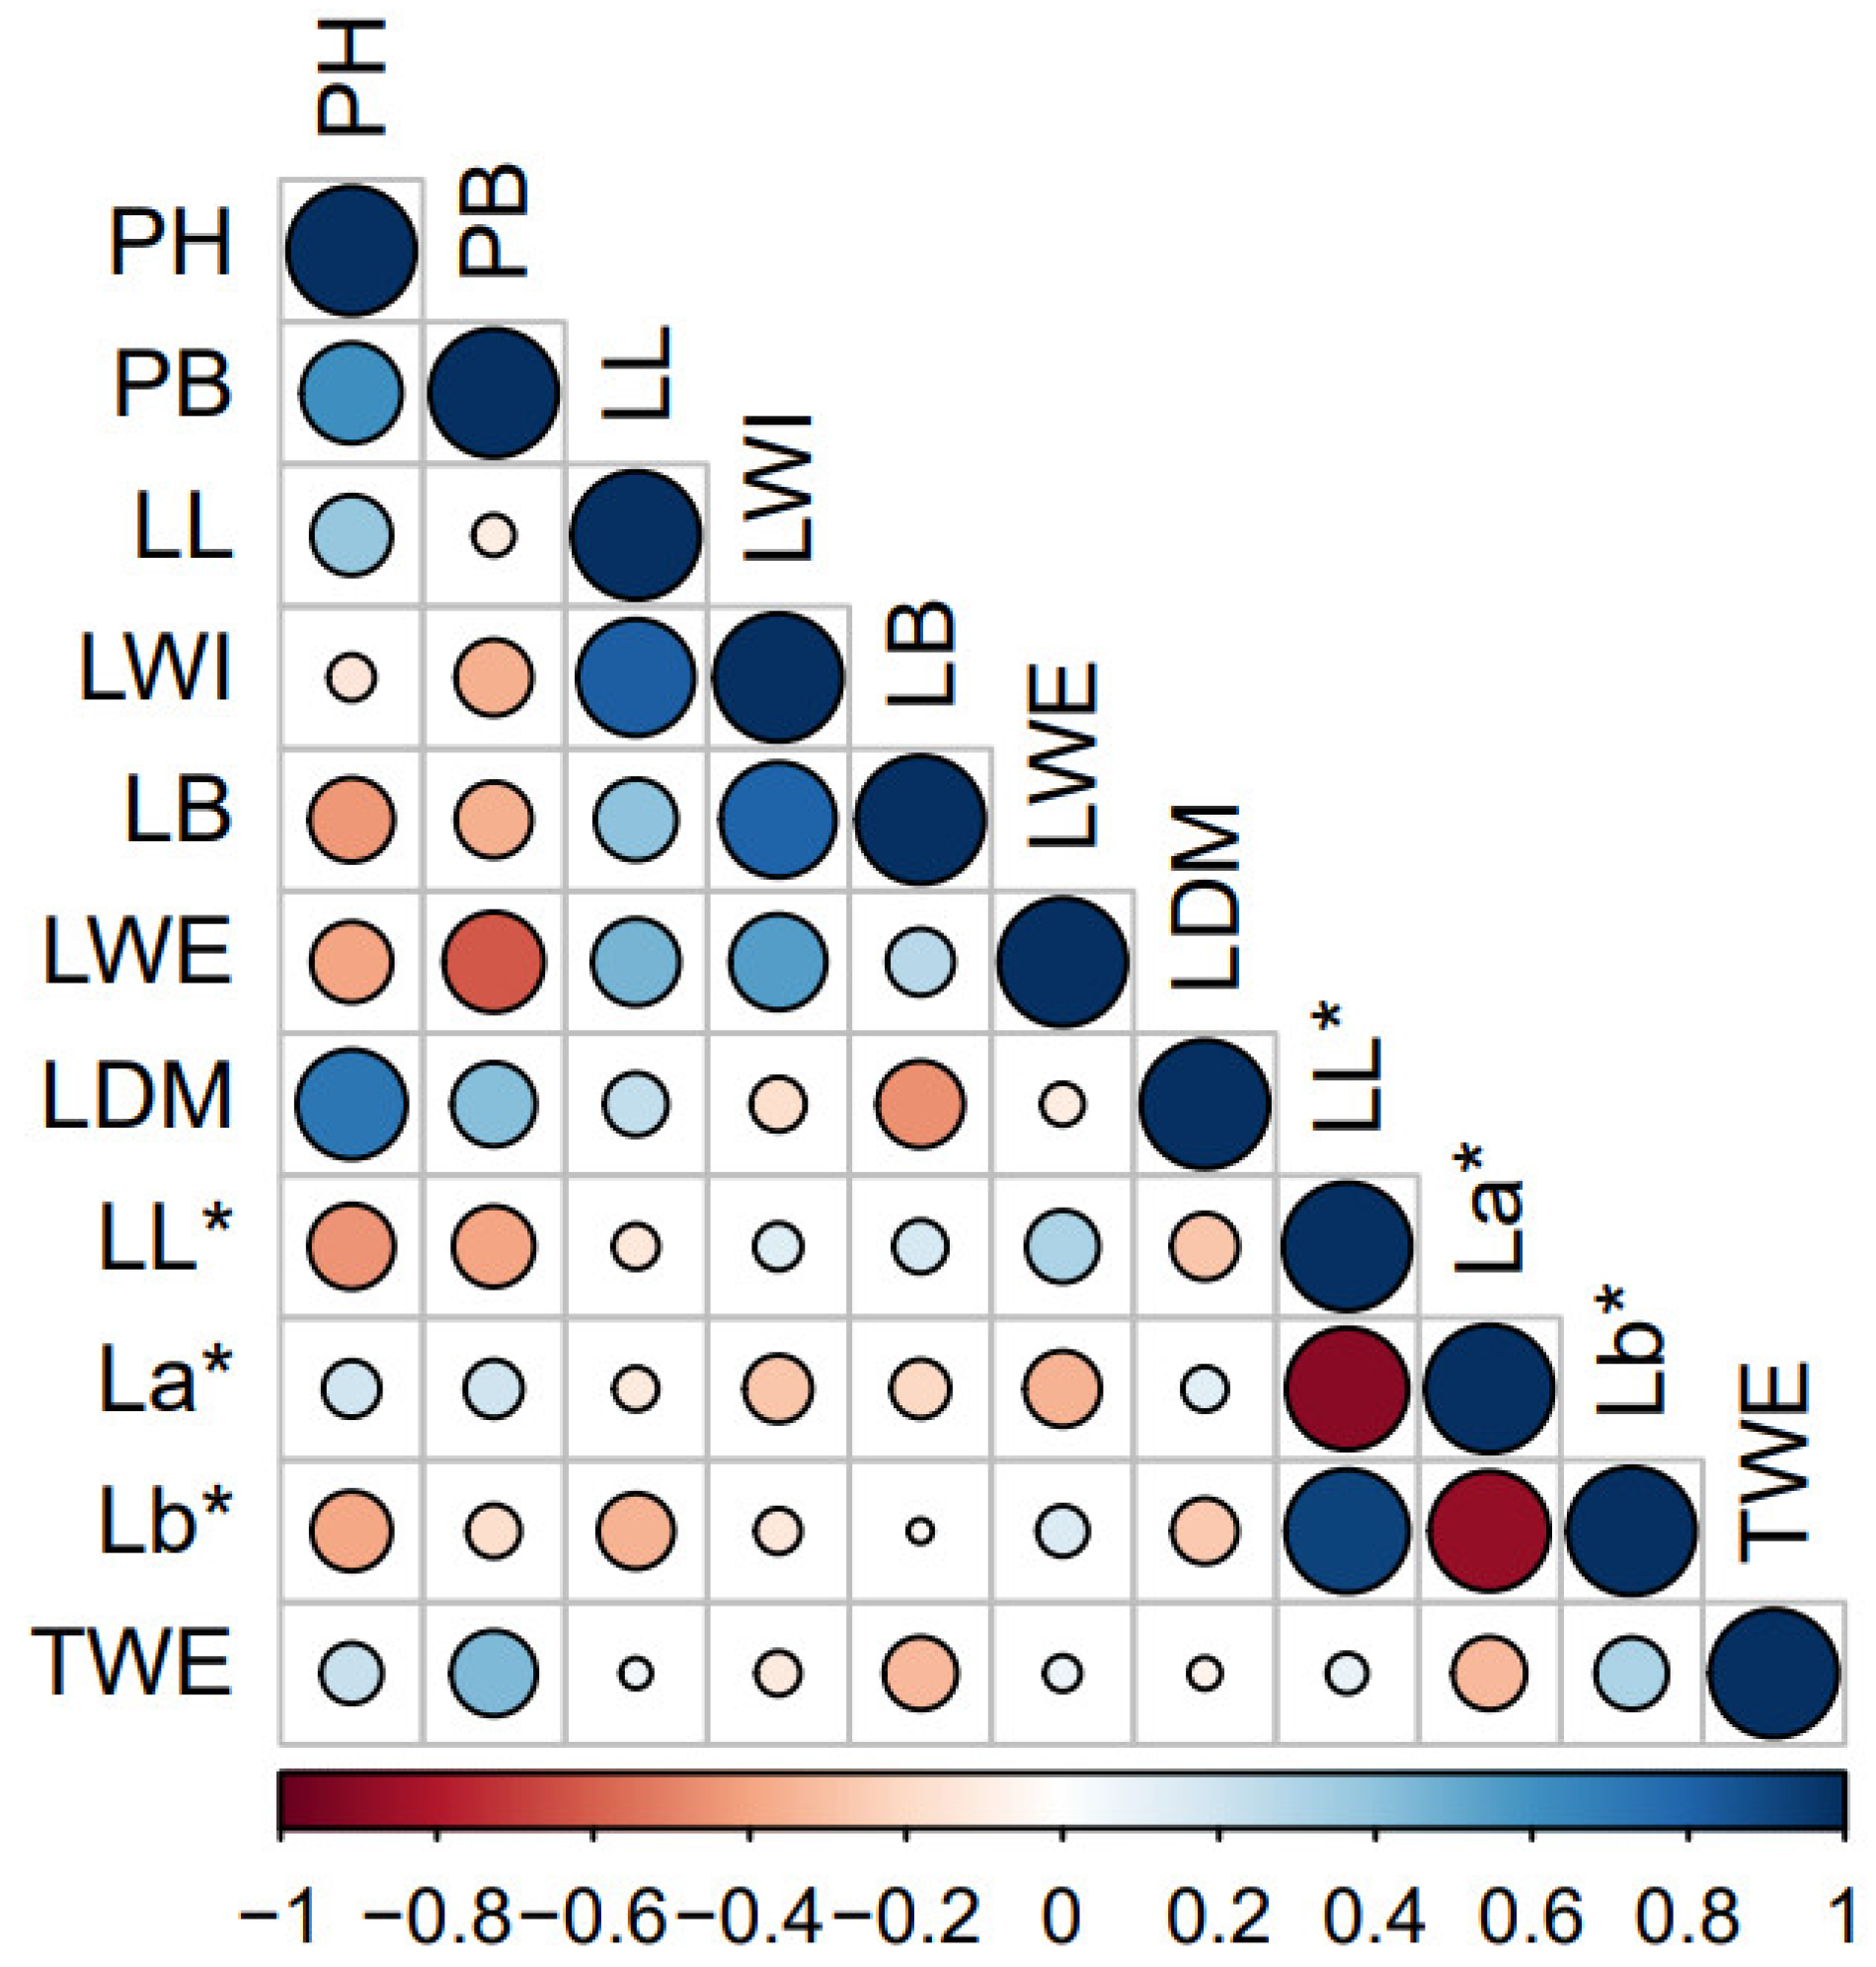
3.4. Pearson’s Correlation between Traits

The trait with the most correlations was the leaf weight (LWE) for which there were robust linear correlations with three morphological traits. In particular, LWE displayed a strong positive correlation with leaf lamina length (LL) and leaf lamina width (LWI) (Figure 3).
Conversely, LWE was negatively correlated with the number of plant branches (PB). Furthermore, there were significant linear positive correlations between plant height (PH), plant branches (PB), and leaf dry matter (LDM). Concerning the chromatic leaf parameters, b* displayed a robust negative correlation with both L* and a* (Figure 3).

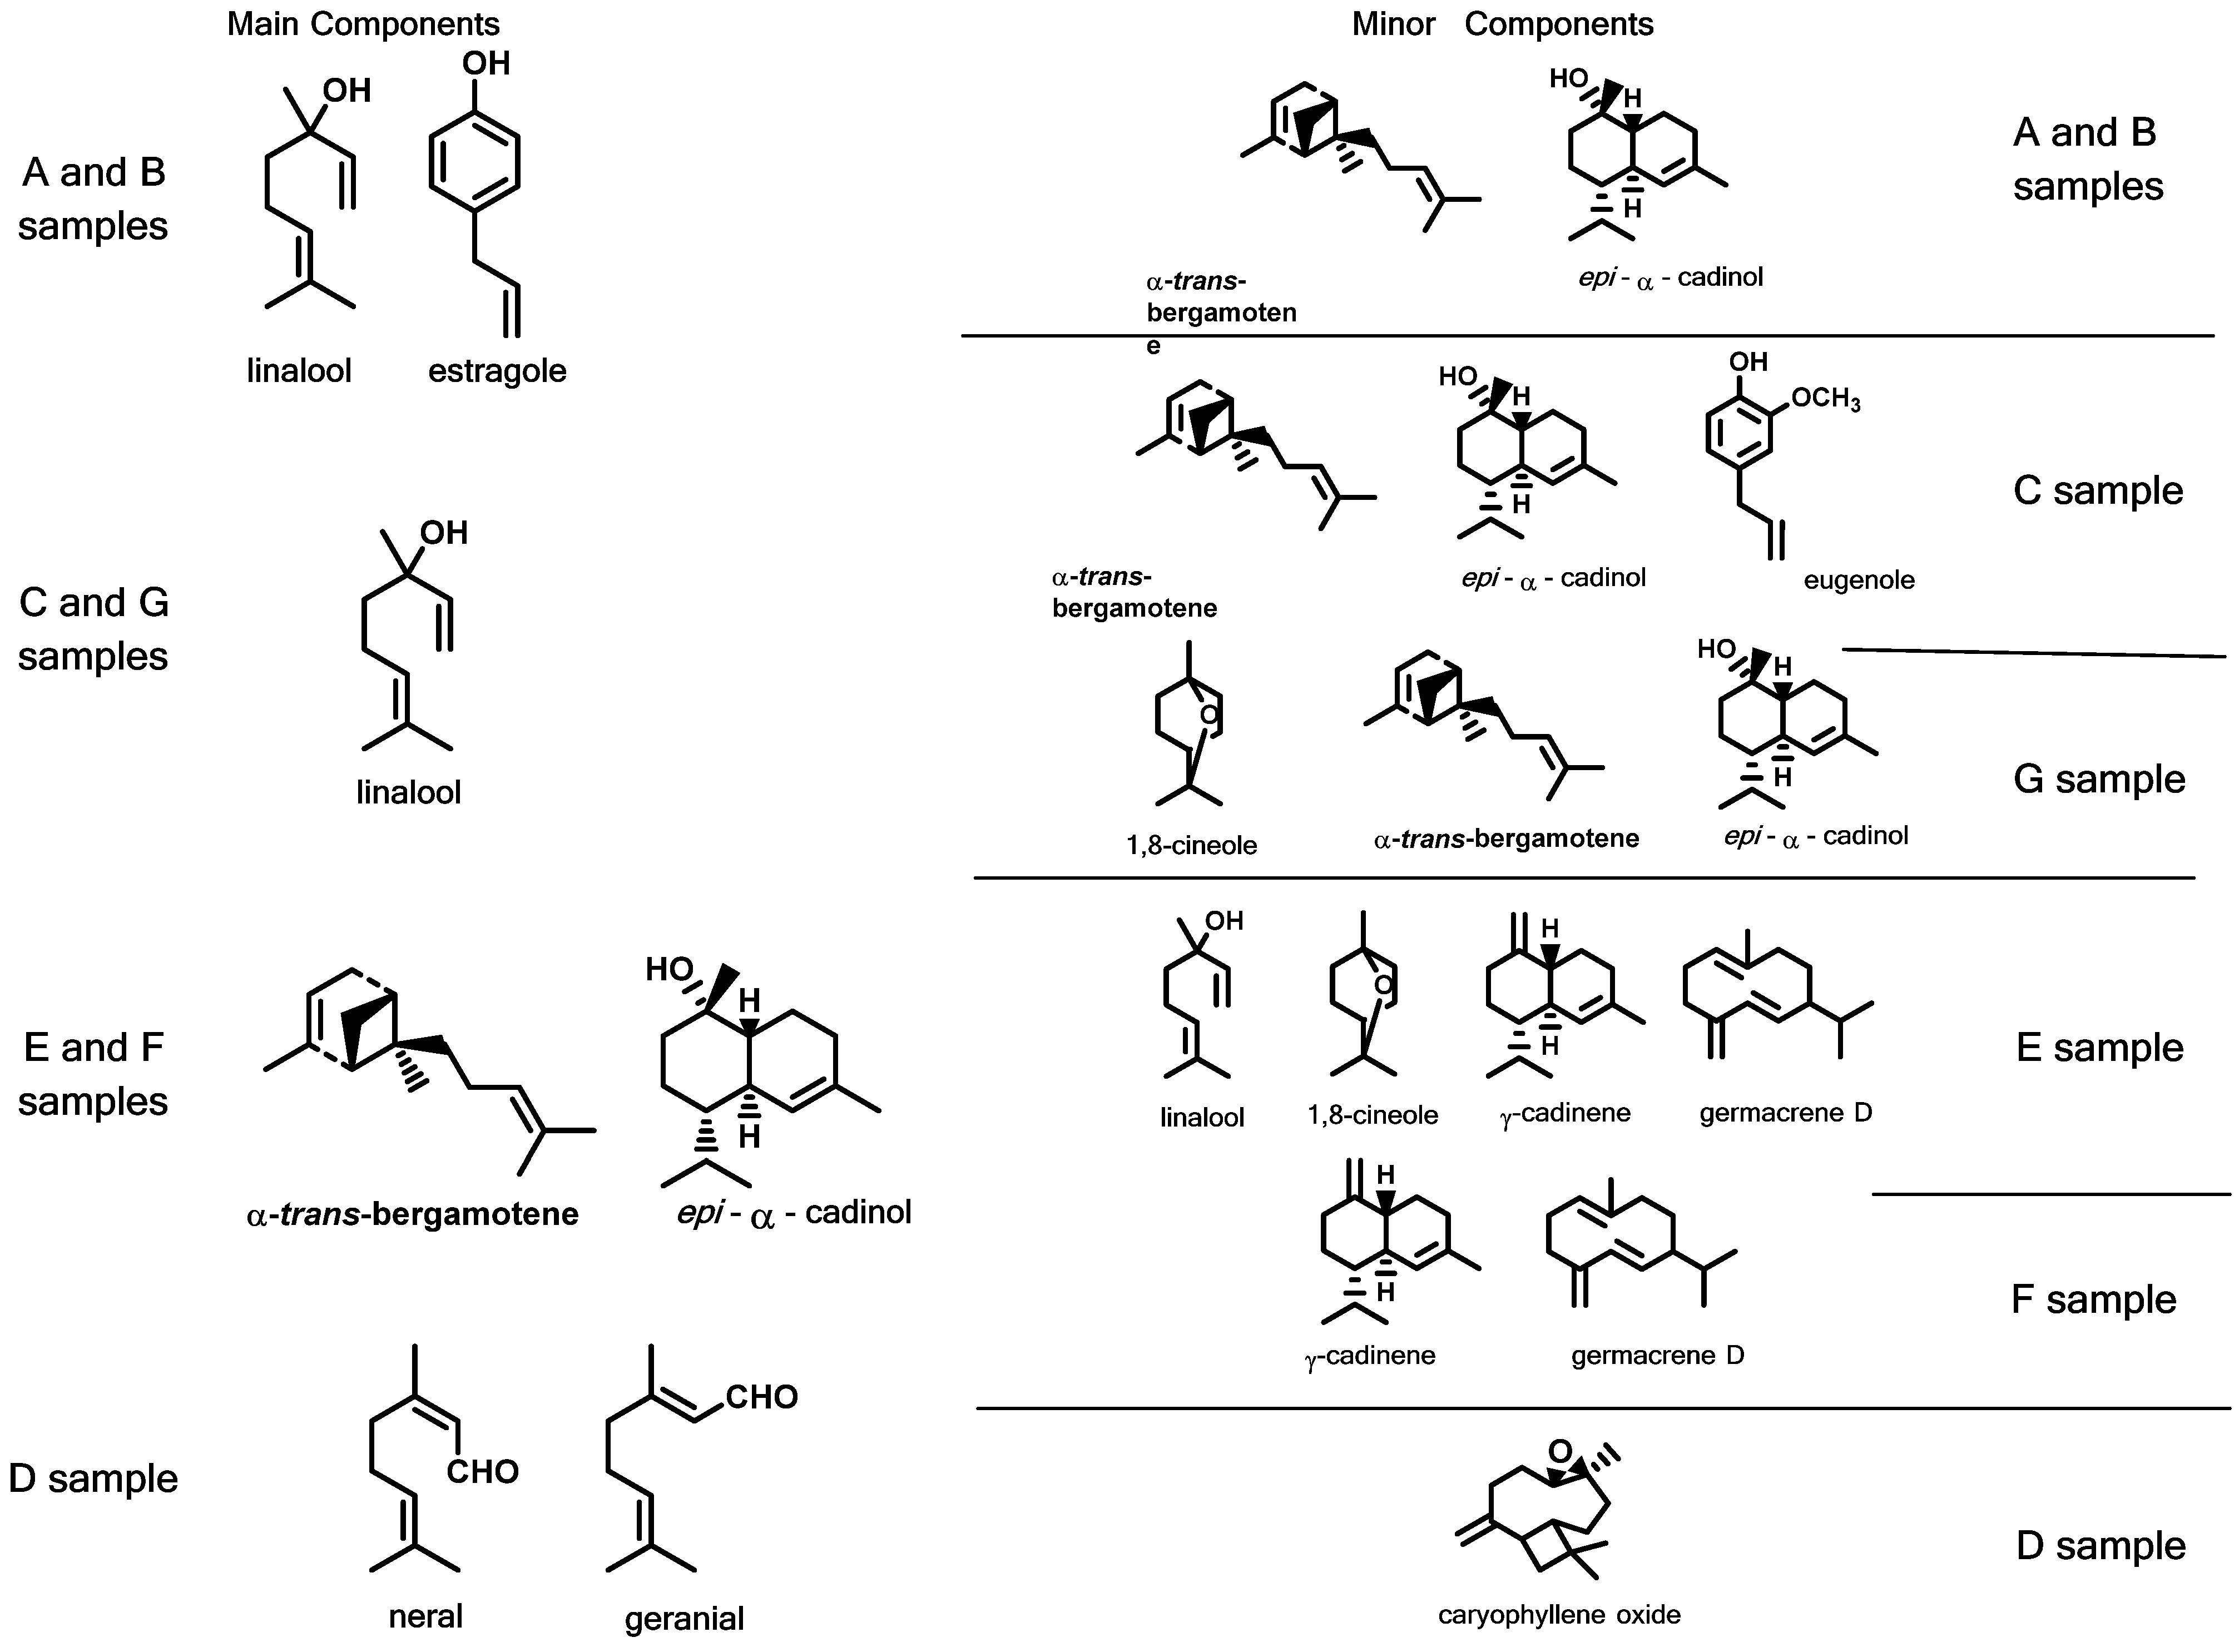
3.5. Biochemical Characterization of the Volatile Compounds

All the extracted volatile compounds are listed in Supplementary Table S1. The number of identified compounds was between 47 for sample A and 61 for the E and G samples; the percentage of the identified components with respect to the total number of detected components ranged between 83% for sample D and 96% for sample A (Table S1). To facilitate the comparison of various Ocimum genotypes, the components listed in Table S1 were organized into the following five classes: monoterpene hydrocarbons, oxygenated monoterpenes, sesquiterpenes, diterpenes, and non-terpenoid components. A preliminary and general analysis of the chemical composition of the oils showed significant compositional differences among the seven basil genotypes examined. Figure 4 shows the differences observed between the aforementioned classes of compounds in the seven basil accessions.
The first class of components, namely monoterpene hydrocarbons, is, together with diterpenes, the least represented classes, despite the consistent number (14) of characterized components. In fact, all the components were present at levels below 1% and only the samples E and G showed a total amount slightly over 4%.
The oxygenated monoterpenes class is, instead, significantly present in all samples with the exception of sample F, in which, the total amount was only 2.7%. Linalool and 1,8-cineole were the main components of the A, B, C, F, and G samples. Sample G showed a higher amount of 1,8-cineole than linalool, as well as a consistent presence of terpinen-4-ol and bornyl acetate. The profile of this class in sample D was completely different; in fact, neral/geranial accounted for over 95% of the oxygenated monoterpenes (Figure 4).
The sesquiterpenes class, with 28 components, is more represented and consistent with the total amount in three cases (C, E and F samples), and is the main class of components (Figure 4). In fact, in sample F, this class accounted for over 76% of the total, whereas there was a lower amount of these components, at 16%, in the sample B. In almost all samples, the main components were α-bergamotene, germacrene D, and γ-cadinene amongst the hydrocarbons, and epi-α-cadinol was the most represented oxygenated sesquiterpene. Once again, sample D was an exception, with caryophyllene oxide and trans-caryophyllene as the main components.
Diterpenes were represented only by one component, phytol, whose presence was almost negligible in all samples, with exception of C, in which it reached 2.3%.
The last class of volatile components in the Sicilian Ocimum samples was the non-terpenoid components. It was only present in the A and B samples, with estragole (methyl chavicol) being the most important compound. This was also true for the E, F and G samples, but the amount was decidedly lower. Sample C showed a content of these components of approximately 8%, represented almost exclusively by an aromatic compound, namely eugenol. Finally, sample D was also different in terms of these components, with the main one being an aliphatic oxygenated hydrocarbon: 6-methyl-5-epten-2-one.
On the basis of the collected data, it is possible to distinguish one or more components which could be used to characterize each sample. In particular, estragole and linalool may be considered the chemical markers of the A and B samples. In fact, sample A can be classified as classical sweet (or European) basil given that the content of linalool and estragole in this variety ranges from 35 to 50% and 15 to 25%, respectively [43]. Sample B can be considered a variant of A since in this case, the estragole content exceeded 56%, whereas the linalool content was only 15%. Secondary components in both of these samples included α-bergamotene and epi-α-cadinol. Unlike the previous two samples which were differentiated based on minor components, samples E and F were strongly characterized by numerous sesquiterpenes: 1,8-cineole, linalool, γ-cadinene and germacrene D for sample E, and only γ-cadinene and germacrene D for sample F. Samples C and G can be classified as linalool chemotypes; however, the secondary components can also be used to clearly distinguish between the two samples: in C, there are significant amounts of α-bergamotene, epi-α-cadinol, and eugenol, and in G, 1,8-cineole, α-bergamotene, and epi-α-cadinol are predominant. Finally, sample D, as already observed in the previous description, shows a profile quite different from the other samples, being characterized by the neral/geranial isomers and, as a secondary component, by caryophyllene oxide; all these components are absent or present at very low levels in the other samples of Ocimum examined here.
Regarding the correlations between all the volatile compounds, the ones with the most correlations were caryophyllene oxide and epi-α-cadinol. Specifically, caryophyllene oxide was positively correlated with trans-linalool oxide, nerol, neral, geraniol, geranial, neryl acetate, geranyl acetate, α-copaene, β-bourbonene, β-cubebene, trans-caryophyllene, β-bisabolene, trans-γ-bisabolene, 1-octen-3-ol, 6-methyl-5-epten-2-one, octanal, 3-Z-hexen-1-yl acetate, benzene acetaldehyde, and 1-octen-3-yl acetate (Figure S1).
In contrast, caryophyllene oxide was negatively correlated with β-damascenone, γ-gurjunene, cis-calamenene, α-cadinene, spathulenol, epi-α-cadinol, and β-eudesmol. Regarding epi-α-cadinol, it was positively correlated with α-terpinene, γ-terpinene, terpinolene, bornyl acetate, β-damascenone, β-elemene, α-bergamotene, trans-β-farnesene, germacrene D, γ-gurjunene, γ-cadinene, cis-calamenene, β-sesquiphellandrene, α-cadinene, trans-nerolidol, and β-eudesmol. In contrast, it was negatively correlated with fenchone, trans-linalool oxide, nerol, neral, geranial, neryl acetate, geranyl acetate, β-bourbonene, β-bisabolene, δ-cadinene, trans-γ-bisabolene, caryophyllene oxide, 1-octen-3-ol, 6-methyl-5-epten-2-one, octanal, 3-Z-hexen-1-yl acetate, benzeneacetaldehyde, and 1-octen-3-yl acetate (Figure S1).
The compounds with the lowest correlations number, chavicol and eugenol, were correlated with only two volatile compounds each. In particular, chavicol was positively correlated with cis-linalool oxide and negatively correlated with α-copaene, while eugenol was positively correlated with borneol and phytol (Figure S1).
Based on the distinct volatile compound profiles, we used a principal component analysis to facilitate the clustering of genotypes into three main groups (Figure S2a).
The first group, referred to as chemotype 1, comprises genotypes A, B, C, G, and F (Figure S2a). The second group, labeled as chemotype 2, exclusively features genotype E (Figure S2a). Lastly, chemotype 3 only included genotype D (Figure S2a). In Figure S2b, each volatile compound, named using the numeric code reported in Table S1, is depicted basing on its distribution in the two extracted principal components. Specifically, chemotype 1 is characterized by the typical “pesto” sauce aroma, due to the high abundance of eugenol, 1,8-cineole, and linalool. Conversely, E, representing chemotype 2, was characterized by higher amounts of α-bergamotene, germacrene D, and terpinene-4-ol. Finally, chemotype 2, represented by the genotype D, was characterized by high concentrations of neral and geranial (Figure S1).
Table 5 reports all of the most significant compounds used to determine the chemotype of each basil accession.
Within this context, aromatic compounds varied significantly among the different genotypes. 1,8-cineole varied from 0.2% of the essential oil in genotype F to 11.2% in G (Table 5). Remarkably, genotype D showed small traces of this compound. The amount of linalool varied from 0.7% in D to 33.5% in G (Table 5).
Notably, genotypes A, C, and G exhibited a linalool content higher than 30.0%. Furthermore, the terpinen-4-ol content varied from 0.1 in genotype A to 4.4% in E. Notably, this specific compound was not detected in genotype D (Table 5). Another representative compound found in the essential oil was estragole. The amount of this aromatic compound ranged from 0.1 in C to 56.9% in B. Subsequently, neral was found only in genotypes C and D, exhibiting values of 0.1 and 23.7%, respectively. Furthermore, geranial was only detected in genotypes C and D, and its concentration ranged from 0.1 to 31.2% in C and D, respectively (Table 5). The eugenol concentration fluctuated from 0.3 to 7.2% for D and C. With regard to α-bergamotene, its concentration fluctuated among the genotypes from 3.1 in B to 33.6% in F (Table 5). Moreover, the concentration of germacrene D varied from 0.2 in D to 5.7% in F. The caryophyllene oxide concentration was 0.1% for genotypes A, C, E, F, and G. Conversely, B and D displayed caryophyllene oxide concentrations of 1.5 mg g−1 and 8.6%, respectively. Finally, the epi-α-cadinol amount varied among the tested genotypes from 0.6 to 12.2% in D and F, respectively (Table 5).

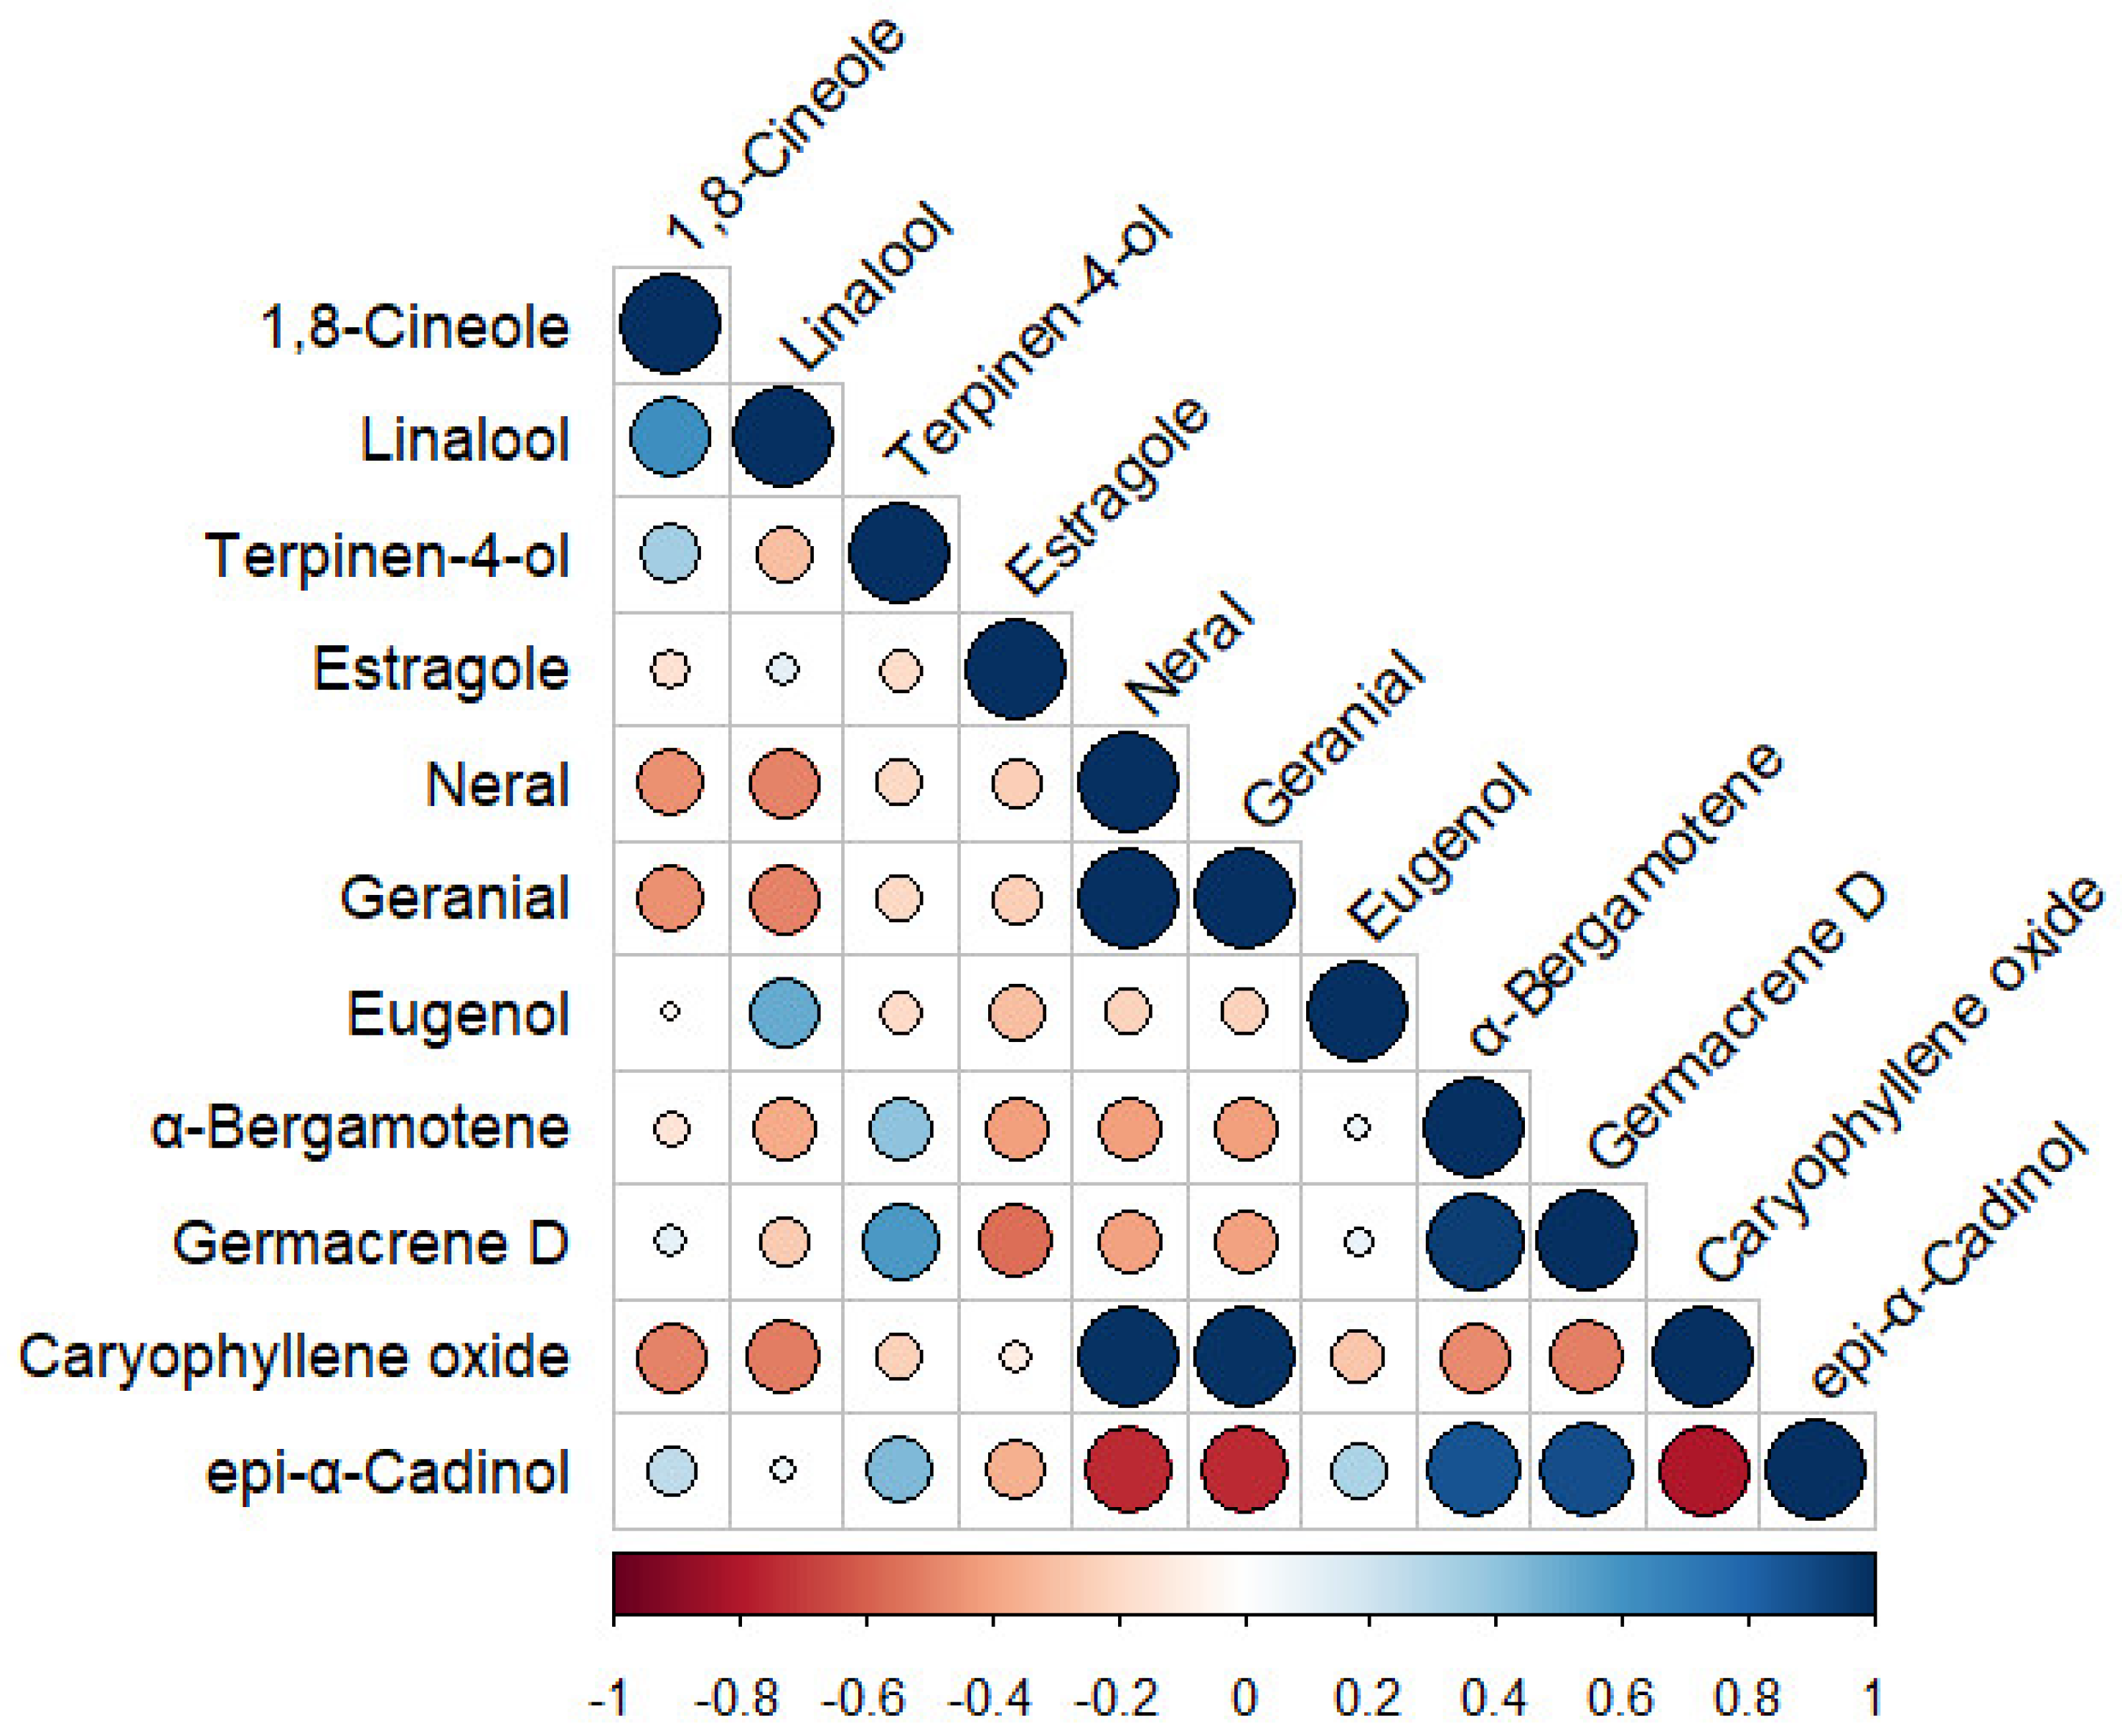
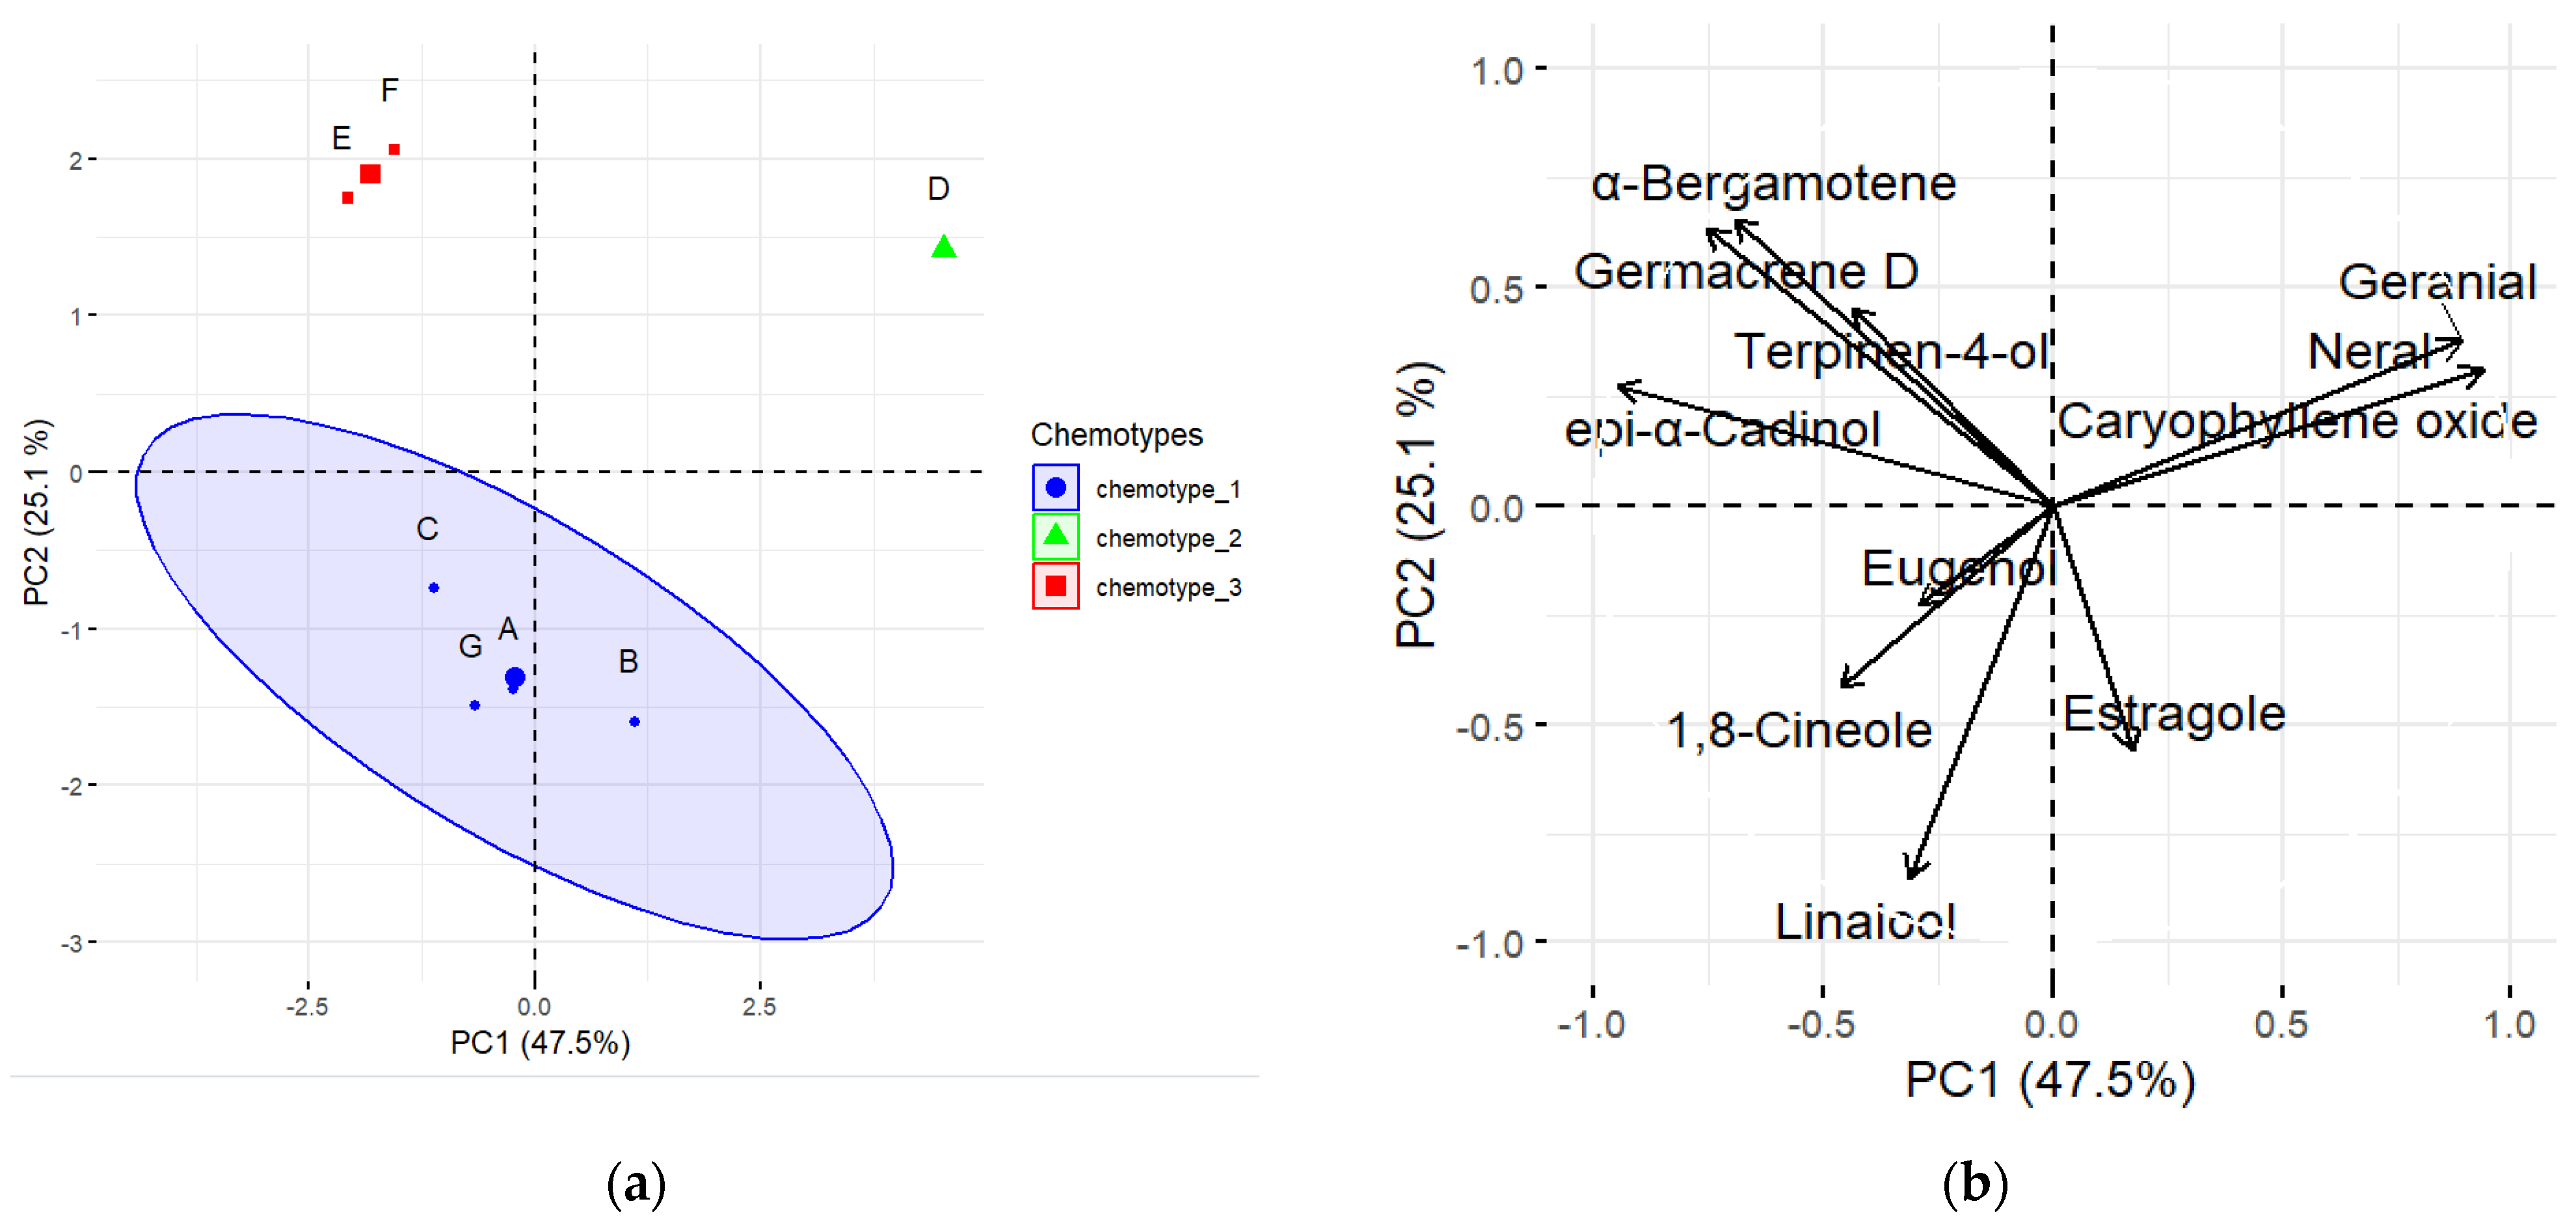
3.6. Pearson’s Correlation and Chemotypes Determination among the Aromatic Compounds

The compound with the most correlations was epi-α-cadinol, exhibiting a robust linear correlation with five aromatic compounds (Figure 5).
Specifically, it was positively correlated with α-bergamotene and germacrene D, and negatively correlated with neral, geranial, and caryophyllene oxide (Figure 5). In contrast, terpinen-4-ol, estragole, and eugenol displayed no significant correlations with the other aromatic compounds (Figure 5).
The PCA analysis enabled the categorization of each genotype based on its aromatic profile, revealing three distinct groups characterized by markedly different aromatic profiles. The three groups represented three different chemotypes (Figure 6a).
Specifically, A, B, C and G represented chemotype 1, characterized by the typical “pesto” sauce aroma due to the high abundance of eugenol, 1,8-cineole, and linalool (Figure 6). Conversely, chemotype 2, represented by genotype D, was characterized by high concentrations of neral and geranial (Figure 6a,b). Finally, E and F, representing chemotype 3, were characterized by higher amounts of α-bergamotene, germacrene D, and terpinene-4-ol (Figure 6a,b).

3.7. Variations in Harvesting Weight in Relation to the Solar Radiation Conditions

For plant fresh weight across the four harvesting time points (35, 56, 84, and 119 days after transplant), a significant interaction was observed between the two experimental factors: solar radiation (SR) and genotype (GE). The fresh weight values displayed a wide range of values, with the lowest weight recorded for genotype B at 28.30 g when cultivated in open-air conditions (SR100) at the third harvesting time point (84 days after transplant (DAT)), as shown in Table 6.
Conversely, the highest fresh weight values (523.17 g) was achieved by genotype E when grown in the shading system (SR70) at the second harvesting time point (56 DAT). It is noteworthy that genotype E exhibited no fresh biomass to harvest during at the third time point (84 DAT) under both shading (SH) conditions, while genotypes B and G provided no biomass to harvest during the same period, but only in SR100 conditions (Table 6). The total fresh harvested biomass (TWE) ranged from 242.53 g for genotype G cultivated under SR100 conditions, to 1035.17 g for genotype E grown in SR70 conditions (Table 6). The cumulative production is graphically represented for each genotype, for both solar radiation conditions, in Supplementary Figure S3.

3.8. Light Use Efficiency (LUE) in Relation to the Solar Radiation Conditions

There was a significant interaction between SR and GE in terms of LUE. The LUE value varied from 8.68% for G grown in SR100 conditions to 52.93% for E grown in SR70 conditions (Table 7). Notably, genotypes E and D showed the highest LUE values, while the lowest value was registered by G (Table 7).

3.9. Variation in the Morphometric Traits in Relation to the Solar Radiation Conditions

Plant height (PH) exhibited a significant interaction between the two experimental factors studied, which were the solar radiation (SR) and the genotype (GE). Remarkably, the PH value ranged from 19.12 cm for F grown in SR100 conditions, to 78.87 cm for D cultivated in SR70 conditions (Table 8).
Conversely, the plant branches (PB) displayed a significant variation in relation to the solar radiation (SR) applied. Within this context, the PB value ranges from 8.52 to 13.47 branches under SR100 and SR70 conditions, respectively (Table 8).
Regarding the leaf lamina length (LL), it displayed a significant variation among the genotypes. Remarkably, the LL value ranged from 2.56 cm for E to 9.49 cm for F (Table 8). On the other hand, there was a significant interaction, SR × GE, for leaf lamina width (LWI). Within this context, the LWI value fluctuated from 1.30 cm for E grown under SR70 conditions, to 8.64 cm for F grown under SR100 conditions (Table 8). Concerning the leaf blistering (LB) value, it showed a significant variation among the different genotypes tested. Specifically, its value was 1.00 for genotype F, 0.33 for genotype G, and 0.00 for the other genotypes (Table 8).
For the leaf weight (LWE), there was a significant interaction (SR × GE). The LWE value varied from 30.76% to 63.30% for B and A both grown under SR70 conditions. Leaf dry matter (LDM) showed significant variations among the different genotypes examined. Specifically, the LDM value varied from 9.86% for genotype F to 13.75% for C (Table 8).
Regarding the chromatic parameters, there were significant variations among the examined genotypes. In particular, leaf lightness (LL*) ranged from 37.52 to 49.96 for B and D, respectively. Conversely, the leaf chromatic parameter a* value spanned from −12.16 to 0.16 for A and B, respectively. Finally, the leaf chromatic parameter b* value ranged between 1.76 and 22.00 for B and E, respectively.

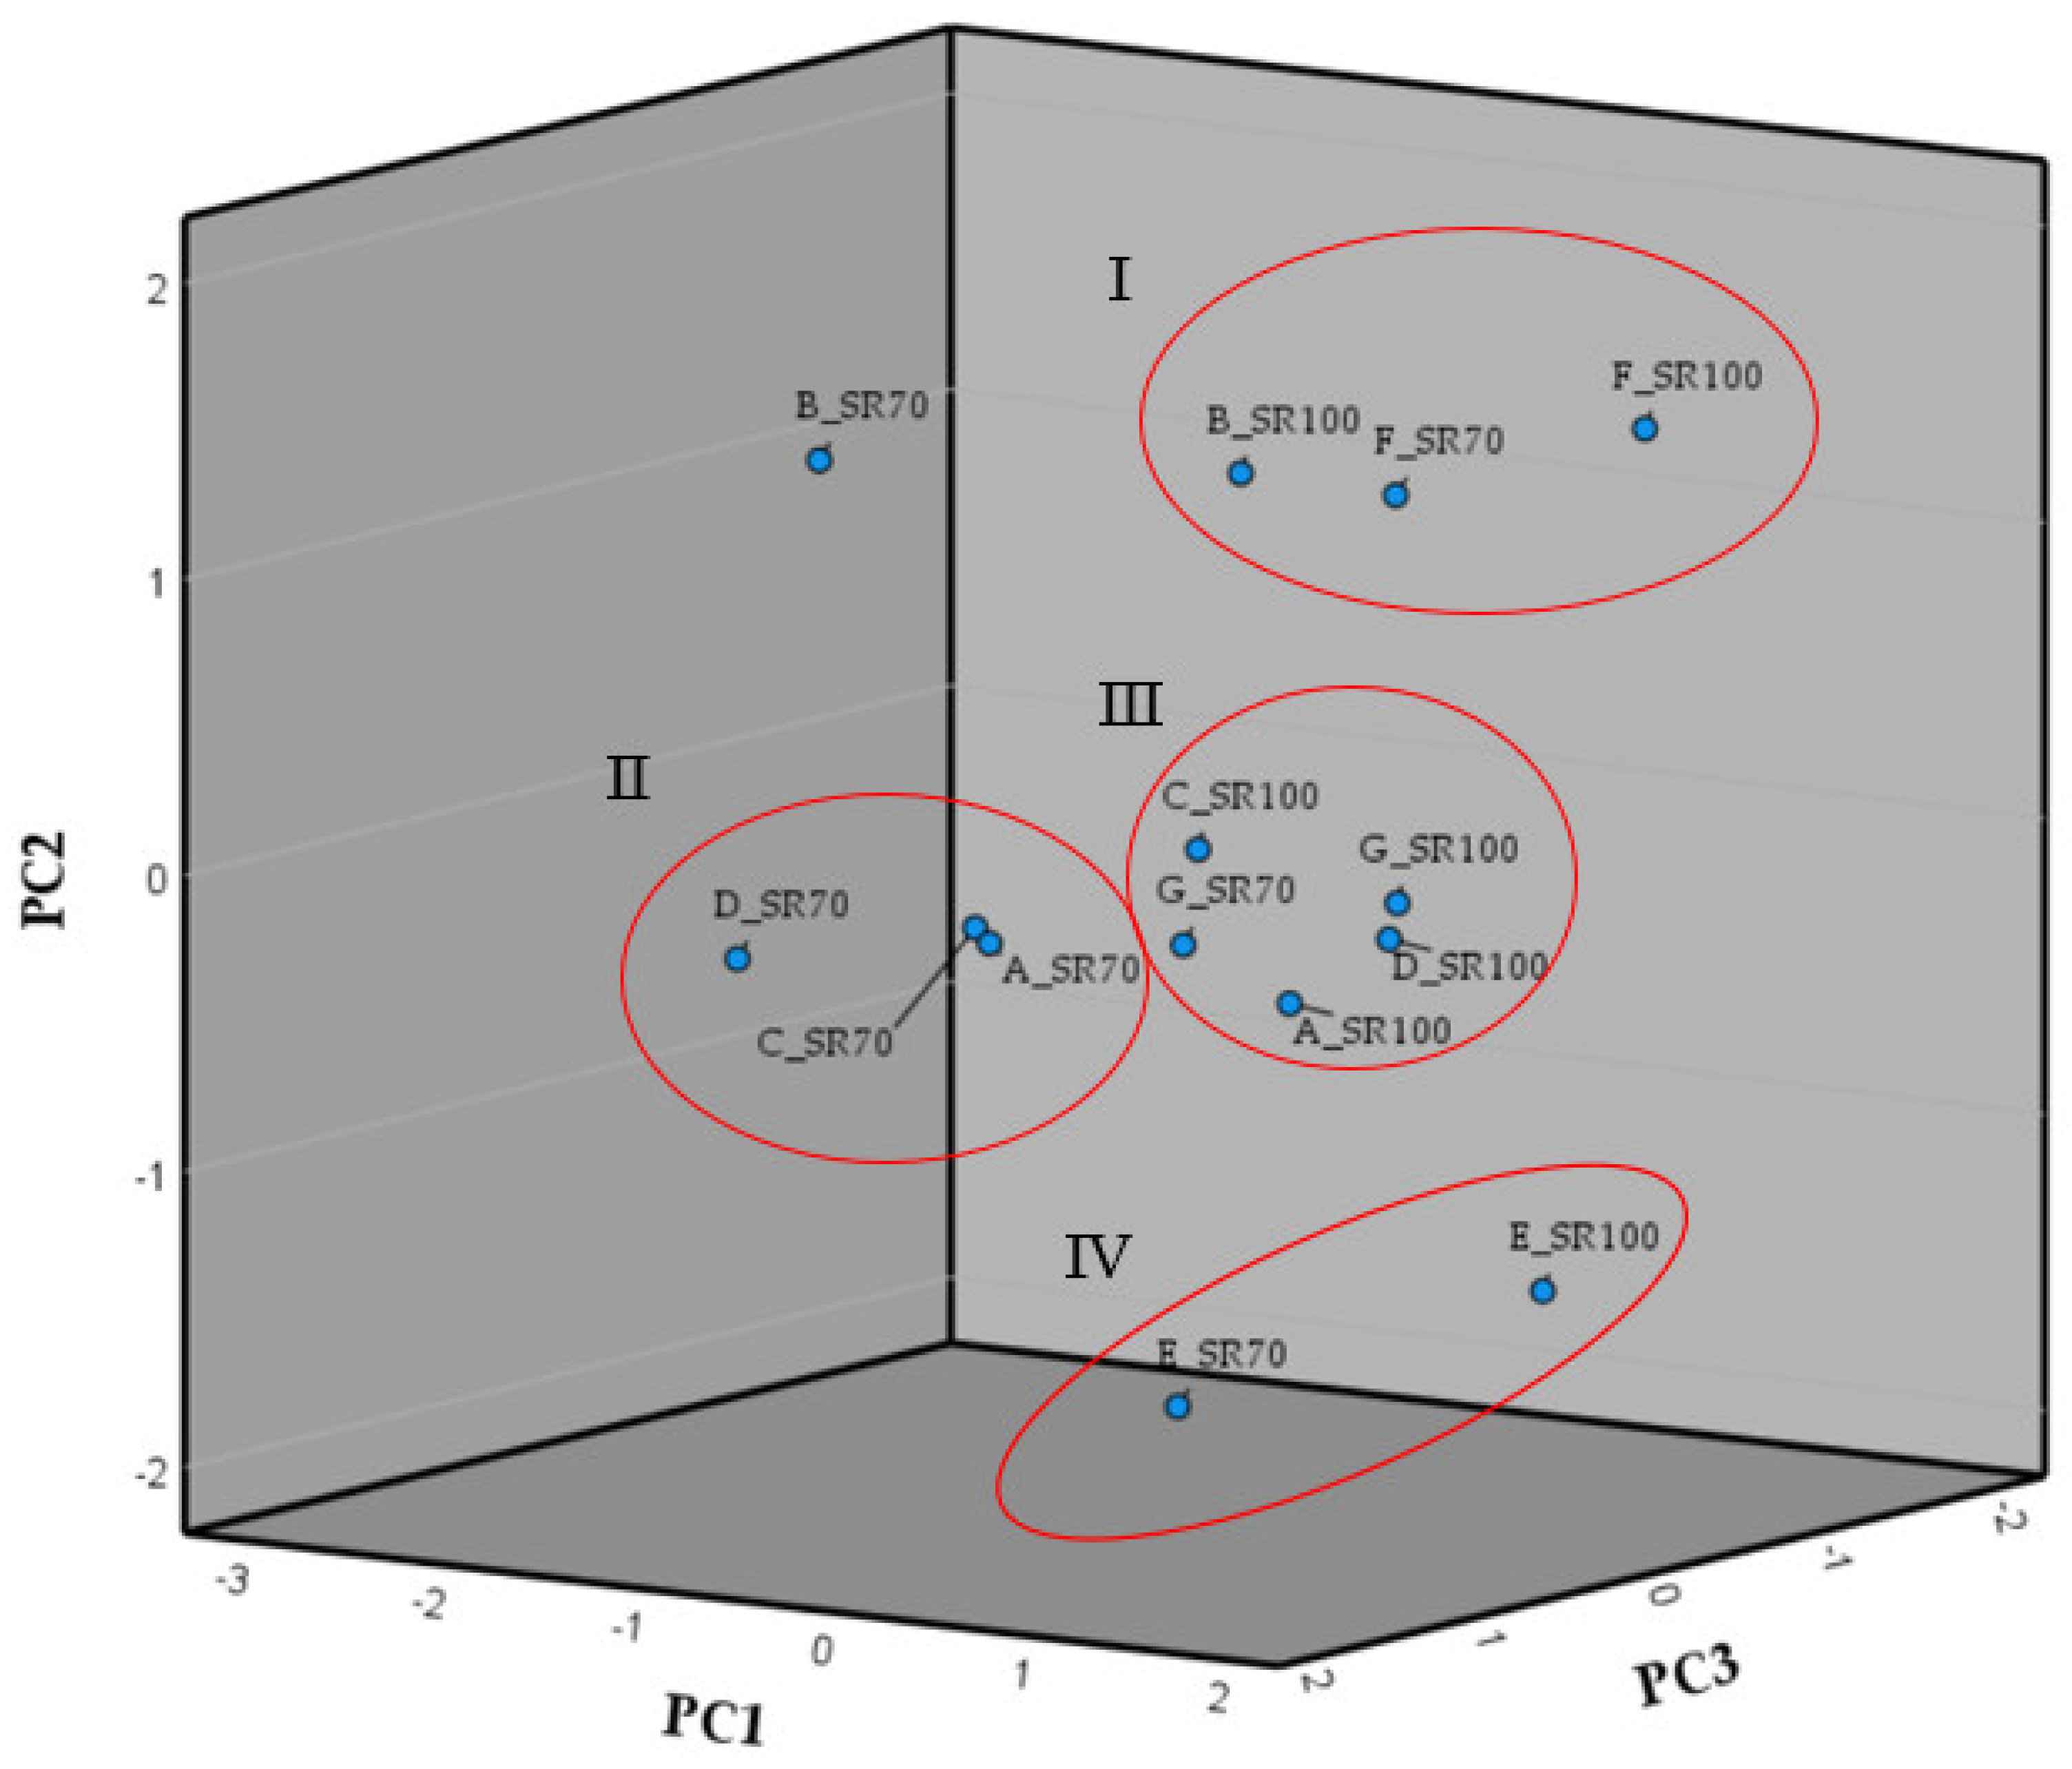
3.10. Principal Component Analysis of the Morphological Trait Variations as Result of the Different Solar Radiation Conditions

The first component extracted (PC1) accounted for 35.996% of the total observed variance among the different genotypes grown in the different shading conditions. Notably, the first component was positively correlated with L*, LWE, and LB (Table 9). On the other hand, PC1 was negatively correlated with a*, PH, PB, and LDM (Table 6). The second extracted component (PC2) accounted for 24.898% of the total variance and it exhibited a positive linear correlation with L* and LWI. Furthermore, PC2 was negatively correlated with the chromatic component Lb* (Table 9). The third extracted component (PC3) was positively correlated with TWE. PC1, PC2, and PC3 represented the first, second, and third axes of the PCA plot, respectively. Remarkably, genotypes grown in both shading systems were clearly distinguished based on the three extracted components. In particular, genotypes were clustered into four distinct groups (I, II, III, and IV). Group I encompassed genotype B grown in SR100 conditions and genotype F grown in both SR70 and SR100. This group included all the genotypes displaying low values of PH and PB. In fact, as previously detailed, PC1 was negatively correlated with both PH and PB (Table 9).
In contrast with the genotypes included in group I, B grown in SR70 conditions was an outlier due to it recorded high values of PH and PB, which were 71.13 cm and 16.46 branches, respectively (Figure 7). On the other hand, group II comprised genotypes A, C, and D cultivated under SR70 condition. These genotypes were characterized by intermediate morphometric values. Group III included A, C, and G grown in SR100 and genotype G grown in both SR70 and SR100 conditions (Figure 7). Finally, Group IV comprised genotype E grown in both SR conditions. Remarkably, genotype E exhibited the highest LL values and high values of TWE (Figure 7).

4. Discussion

The first objective of the present study was to characterize seven basil genotypes for their agronomic performances. Additionally, the comprehensive characterization of the aromatic compounds within their essential oils allowed for the distinction of three chemotypes. Subsequently, the work conducted enabled the identification of the optimal growing conditions in relation to the applied shading. Within this context, it was evident that plants grown under the shading system produced a significantly higher amount of fresh biomass (TWE). This could be attributed to the intense solar radiation recorded in the open field (SR100) during the trial (Figure 2). Indeed, basil is native to the Liguria region in Italy, known for its comparatively lower solar radiation levels compared to Sicily.
As is well known, the cut-and-come-again (CC) harvest strategy is widespread in basil cultivation, and it was proven that different harvesting time produce different yields of fresh product. It is worth mentioning that leaves at the different harvesting stages exhibit different biochemical profiles [44]. As was evident in our experiment, the second harvest led to accelerated plant growth, resulting in a significant increase in the fresh biomass. In relation to the different amounts of fresh biomass per harvest, our findings are consistent with previous studies that indicated that basil genotypes achieve their highest yields during the second harvest [45,46,47]. In particular, the first cutting appeared to stimulate rapid plant growth, likely due to effect of the mechanical stimulation after cutting. Therefore, the highest amount of fresh biomass was observed in the second cutting [48].
Genotype E (Nano) exhibited the highest total fresh weight, reaching more than 500.0 g of fresh biomass weight in the second harvesting period and exhibiting a remarkable increase of more than 100% compared to the first harvest. Interestingly, in the third harvesting period, genotype E showed no available biomass for harvesting, indicating its ability to produce substantial biomass after the initial cutting. This characteristic could be leveraged to significantly reduce the labor required for harvesting, consequently lowering the cultivation costs. In contrast, genotype D consistently registered an increase in biomass across all four harvesting periods.
As previously reported, the second harvest also induces a significant change in the basil’s metabolomic profile [49]. In particular, it is evident that phytohormones and secondary metabolite accumulation stimulate plant growth process, simulating the natural effects of animal grazing that are typical in the environment of pasture grasses. This accelerated growth rate can be attributed to increased carbon and nitrogen uptake, which is subsequently allocated to the shoots in response to defoliation [50,51]. Additionally, the stressful environment induced by a reduction in the leaves or canopy significantly modifies the plant’s physiological responses, consequently increasing its photosynthetic activity and source–sink relationships [52]. To further strengthen our findings related to the significant vegetative stimulation that we observed after the first cutting, it was noted that defoliation significantly increase the cytokinin content in leaves [53]. This phytohormone is widely recognized to regulate leaf primordium differentiation with significant boosting effects on cell division [54].
In this experimental trial, it is worth mentioning that several genotype-related traits were unaffected by the shading net application. These traits included leaf dry matter (FDM) and all the leaf chromatic parameters (LL*, La*, and Lb*).
The effects of shading on plant height have been extensively studied and well documented [55]. In fact, a reduction in plant exposure to sunlight by approximately 30% has been shown to modulate the photosynthetic response, inducing stem elongation [56]. Furthermore, shading systems can be also useful in the realm of photo-selection, significantly enhancing photosynthetic activity [57]. According to a previous study, the light saturation point of basil increases from the plantlet stage to week 8 of growth. This phenomenon allows the leaves to expand their surface area, facilitating enhanced light absorption and conversion into biomass [58]. It is well established that reduced sun exposure leads to a notable increase in internode length, accompanied by a significant reduction in internode diameter. This distinctive characteristic arises from the increased accumulation of gibberellin GA3 in the stems of shaded plants, resulting in a concurrent reduction in the abscisic acid content [59]. This process is typically referred to as the shading avoidance syndrome [60].
With regard to the impact of shading on plant branches (PB), we noted a significant variation in response to the shading application. It is well documented that shading typically inhibits plant branching processes [61]. However, in our experimental trial, we recorded a significant increase in the number of branches as a consequence of the shading conditions. Remarkably, the shading net utilized in our experiment did not seem to impede the plant branching process. This unexpected outcome may be attributed to the relatively low percentage of shading applied. Indeed, our observations indicated that mild shading levels even contributed to enhancing the branching process in basil plants. Furthermore, the weight of the leaves (LWE) displayed a negative correlation with the number of plant branches (Table 9). This negative relationship can be attributed to the branching process, which induces lateral stem differentiation and appears to interact unfavorably with leaf growth and expansion.
As expected, all leaf traits exhibited positive correlations. Specifically, an increase in leaf lamina length corresponded to an increase in leaf lamina width and fresh weight. Regarding leaf blistering, it was another genotype-related trait and its presence was only detected in the F genotype.
As previously documented, the use of shading nets can lead to a reduction in fresh product yield (approximately 12% reduction). However, it significantly improves the quality of harvested leaves by decreasing the presence of senescent and dry leaves [62]. This specific manifestation can be attributed to the excessive sun exposure, predominantly experienced during summer conditions. It is well known that sun exposure induces heat stress, triggering the activity of enzymes such as superoxide dismutase (SOD), catalase (CAT), ascorbate peroxidase (A-POX), and pyruvate peroxidase (P-POX) [63]. Notably, these enzymes represent essential biomarkers for oxidative stress and their increased activity is closely associated with the overproduction of reactive oxygen species (ROS) [64]. Within the context of our experimental trial, the plants were cultivated during the summer growing cycle, which likely accelerated leaf senescence, ultimately impacting the yield of the plants grown in the open-air (SR100) conditions. Consequently, plants characterized by younger and tender leaves, cultivated in a shading net system, can be exploited for pesto sauce production while preserving the aromatic qualities of the leaves.
As previously documented, the volatile compounds, particularly linalool, represent a biochemical marker for the distinction of diverse basil chemotypes [65]. In particular, we detected a linalool concentration higher than 30.0 mg g−1 for genotypes A, C, and G. Remarkably, these genotypes are the well-known “A foglia larga”, “Genovese”, and “Genovese Gigante” cultivars (Table 1), which could be used for pesto sauce production.
In particular, our findings are consistent with prior works in which linalool was identified as the predominant volatile compound in both fresh leaves and pesto sauce. In fact, the typical smell of basil leaves and stems and pesto sauce is closely linked to terpenoids such as linalool and the non-terpenoid estragole, and their concentrations vary between different basil cultivars [66,67].
It is worth mentioning that lemon-scented plants are characterized by the presence of citral. Specifically, this compound is a mixture between geranial and neral in an approximately 3:2 ratio [68,69]. Within this context, the Romanian basil accession D (Table 1) exhibited a totally different chemotypes from the other accessions. Notably, it displayed significantly elevated levels of neral and geranial compounds. These findings are consistent with prior research that effectively distinguished lemon basil, a variety known for its high concentrations of geranial and neral, from the common basil typically used in pesto sauce [70]. It is evident that accession D can used for its lemon-scented aroma but not for pesto sauce production. In fact, contrary to the “Genovese” types, it showed low amounts of linalool (the lowest recorded).
Remarkably, the lemon basil genotype D also displayed a high concentration of caryophyllene oxide, with the highest recorded level among all the genotypes analyzed. This outcome aligns with previous studies that characterized the essential oil composition of lemon basil [71,72,73]. As evident from the PCA plot, genotype D displayed a distinct biochemical profile compared to all the other tested genotypes. On the contrary, genotypes E and F show some similarities in their biochemical profiles.

5. Conclusions

The primary aim of this work was to perform a comprehensive characterization of seven Ocimum basilicum genotypes in terms of both morphometric traits and volatile compounds. Conversely, the morphometric response of plants under two distinct solar radiation conditions was evaluated. The analysis of aromatic compounds revealed three distinct chemotypes with significant differences in their biochemical compositions. The landrace E (Nano from Catania) exhibited the highest yield in fresh product under 70% solar radiation conditions (SR70).
Concerning light use efficiency (LUE), a significant interaction was observed between the solar radiation and genotype factors. Genotypes E and D demonstrated the highest conversion of solar radiation into biomass, with the most efficient conversion occurring under SR70 conditions. Improved light use efficiency presents a promising prospect for future agriculture, facilitating plant cultivation even in peri-urban marginal lands.
This study could offer valuable insights into genotype selection for various agronomic products, ranging from fresh shoots to pesto sauce. Additionally, it contributes to expanding our understanding of plant responses under varying solar radiation conditions.

Supplementary Materials

The following supporting information can be downloaded at: https://www.mdpi.com/article/10.3390/agronomy14010224/s1, Table S1: Chemical composition of the volatile profiles of the seven genotypes of Ocimum basilicum L.; Figure S1: Pearson’s correlation among the biochemical compounds examined in the seven Ocimum basilicum L. genotypes; Figure S2: PCA plots related to the aromatic compounds analyzed for all the Ocimum basilicum L. genotypes. In Figure S2a, the three distinct chemiotypes (1, 2 and 3) in according to the variables in Figure 6b. Precisely, variables depicted in Figure S2b were named using the numeric code reported in Table S1; Figure S3: Cumulative production of the seven basil genotypes (A, B, C, D, E, F, G) in relation to the different solar conditions tested (SR70 and SR100).

Author Contributions

Conceptualization, F.B. and G.R.; methodology, S.A., S.T. and A.R.; software, S.T.; validation, F.B., G.R. and S.A.; formal analysis, A.R. and S.T.; investigation, S.A.; resources, F.B.; data curation, S.A., S.T., G.R. and A.R.; writing—original draft preparation, F.B. and G.R.; writing—review and editing, F.B., S.A., S.T. and G.R.; supervision, F.B. and G.R. All authors have read and agreed to the published version of the manuscript.

Funding

Funded by CNR project FOE-2021 DBA. AD005.225.

Institutional Review Board Statement

Not applicable.

Informed Consent Statement

Not applicable.

Data Availability Statement

Data are contained within the article and Supplementary Materials.

Conflicts of Interest

The authors declare no conflicts of interest.

References

  1. Yaldiz, G.; Camlica, M. Agro-morphological and Phenotypic Variability of Sweet Basil Genotypes for Breeding Purposes. Crop Sci. 2021, 61, 621–642. [Google Scholar] [CrossRef]
  2. Purushothaman, B.; Srinivasan, R.P.; Suganthi, P.; Ranganathan, B.; Gimbun, J.; Shanmugam1, K. A Comprehensive Review on Ocimum basilicum. J. Nat. Remedies 2018, 18, 71–85. [Google Scholar] [CrossRef]
  3. Dudai, N.; Nitzan, N.; Gonda, I. Ocimum basilicum L. (Basil). In Medicinal, Aromatic and Stimulant Plants; Springer: Berlin/Heidelberg, Germany, 2020; pp. 377–405. [Google Scholar]
  4. Rubab, S.; Bahadur, S.; Hanif, U.; Durrani, A.I.; Sadiqa, A.; Shafique, S.; Zafar, U.; Shuaib, M.; Urooj, Z.; Nizamani, M.M.; et al. Phytochemical and Antimicrobial Investigation of Methanolic Extract/Fraction of Ocimum basilicum L. Biocatal. Agric. Biotechnol. 2021, 31, 101894. [Google Scholar] [CrossRef]
  5. Filip, S. Basil (Ocimum basilicum L.) a Source of Valuable Phytonutrients. Int. J. Clin. Nutr. Diet. 2017, 3, 118. [Google Scholar] [CrossRef]
  6. Almalki, D. Renoprotective Effect of Ocimum basilicum (Basil) Against Diabetes-Induced Renal Affection in Albino Rats. Mater. Socio Med. 2019, 31, 236. [Google Scholar] [CrossRef]
  7. Pratama, Y.; Ulfah, T.; Bintoro, V.P. Effect of Basil (Ocimum americanum L.) Proportion on Physical and Organoleptical Properties of Basil Cracker. J. Appl. Food Technol. 2018, 5, 1–5. [Google Scholar] [CrossRef]
  8. Shahrajabian, M.H.; Sun, W.; Cheng, Q. Chemical Components and Pharmacological Benefits of Basil (Ocimum basilicum): A Review. Int. J. Food Prop. 2020, 23, 1961–1970. [Google Scholar] [CrossRef]
  9. Zhan, Y.; An, X.; Wang, S.; Sun, M.; Zhou, H. Basil Polysaccharides: A Review on Extraction, Bioactivities and Pharmacological Applications. Bioorg. Med. Chem. 2020, 28, 115179. [Google Scholar] [CrossRef]
  10. Yaldız, G.; Çamlıca, M.; Özen, F.; Eratalar, S.A. Effect of Poultry Manure on Yield and Nutrient Composition of Sweet Basil (Ocimum basilicum L.). Commun. Soil Sci. Plant Anal. 2019, 50, 838–852. [Google Scholar] [CrossRef]
  11. Ciriello, M.; Pannico, A.; El-Nakhel, C.; Formisano, L.; Cristofano, F.; Duri, L.G.; Pizzolongo, F.; Romano, R.; De Pascale, S.; Colla, G.; et al. Sweet Basil Functional Quality as Shaped by Genotype and Macronutrient Concentration Reciprocal Action. Plants 2020, 9, 1786. [Google Scholar] [CrossRef]
  12. Du, P.; Yuan, H.; Chen, Y.; Zhou, H.; Zhang, Y.; Huang, M.; Jiangfang, Y.; Su, R.; Chen, Q.; Lai, J.; et al. Identification of Key Aromatic Compounds in Basil (Ocimum L.) Using Sensory Evaluation, Metabolomics and Volatilomics Analysis. Metabolites 2023, 13, 85. [Google Scholar] [CrossRef] [PubMed]
  13. D’Imperio, M.; Renna, M.; Cardinali, A.; Buttaro, D.; Santamaria, P.; Serio, F. Silicon Biofortification of Leafy Vegetables and Its Bioaccessibility in the Edible Parts. J. Sci. Food Agric. 2016, 96, 751–756. [Google Scholar] [CrossRef] [PubMed]
  14. Raiciu, A.D.; Livadariu, O.; Șerbanica, C.-P. The Assesment of the Influence Induced by LED-s Irradiation on Basil Sprouts (Ocimum basilicum L.). Rom. Biotechnol. Lett. 2020, 25, 1334–1339. [Google Scholar] [CrossRef]
  15. Puccinelli, M.; Malorgio, F.; Pintimalli, L.; Rosellini, I.; Pezzarossa, B. Biofortification of Lettuce and Basil Seedlings to Produce Selenium Enriched Leafy Vegetables. Horticulturae 2022, 8, 801. [Google Scholar] [CrossRef]
  16. Stetsenko, L.A.; Pashkovsky, P.P.; Voloshin, R.A.; Kreskavski, V.D.; Kuznetsov, V.V.; Allakhverdiev, S.I. Role of Anthocyanin and Carotenoids in the Adaptation of the Photosynthetic Apparatus of Purple- and Green-Leaved Cultivars of Sweet Basil (Ocimum basilicum) to High-Intensity Light. Photosynthetica 2020, 58, 890–901. [Google Scholar] [CrossRef]
  17. Barbi, S.; Barbieri, F.; Taurino, C.; Bertacchini, A.; Montorsi, M. Quantitative Calculation of the Most Efficient LED Light Combinations at Specific Growth Stages for Basil Indoor Horticulture: Modeling through Design of Experiments. Appl. Sci. 2023, 13, 2004. [Google Scholar] [CrossRef]
  18. Milić Komić, S.; Živanović, B.; Dumanović, J.; Kolarž, P.; Sedlarević Zorić, A.; Morina, F.; Vidović, M.; Veljović Jovanović, S. Differential Antioxidant Response to Supplemental UV-B Irradiation and Sunlight in Three Basil Varieties. Int. J. Mol. Sci. 2023, 24, 15350. [Google Scholar] [CrossRef]
  19. Kotilainen, T.; Robson, T.M.; Hernández, R. Light Quality Characterization under Climate Screens and Shade Nets for Controlled-Environment Agriculture. PLoS ONE 2018, 13, e0199628. [Google Scholar] [CrossRef]
  20. Pennisi, G.; Pistillo, A.; Orsini, F.; Cellini, A.; Spinelli, F.; Nicola, S.; Fernandez, J.A.; Crepaldi, A.; Gianquinto, G.; Marcelis, L.F.M. Optimal Light Intensity for Sustainable Water and Energy Use in Indoor Cultivation of Lettuce and Basil under Red and Blue LEDs. Sci. Hortic. 2020, 272, 109508. [Google Scholar] [CrossRef]
  21. Lim, S.; Kim, J. Light Quality Affects Water Use of Sweet Basil by Changing Its Stomatal Development. Agronomy 2021, 11, 303. [Google Scholar] [CrossRef]
  22. Tabbert, J.M.; Riewe, D.; Schulz, H.; Krähmer, A. Facing Energy Limitations—Approaches to Increase Basil (Ocimum basilicum L.) Growth and Quality by Different Increasing Light Intensities Emitted by a Broadband LED Light Spectrum (400–780 Nm). Front. Plant Sci. 2022, 13, 1055352. [Google Scholar] [CrossRef] [PubMed]
  23. Zhai, Z.; Martínez, J.F.; Beltran, V.; Martínez, N.L. Decision Support Systems for Agriculture 4.0: Survey and Challenges. Comput. Electron. Agric. 2020, 170, 105256. [Google Scholar] [CrossRef]
  24. Hossain, A.; Krupnik, T.J.; Timsina, J.; Mahboob, M.G.; Chaki, A.K.; Farooq, M.; Bhatt, R.; Fahad, S.; Hasanuzzaman, M. Agricultural Land Degradation: Processes and Problems Undermining Future Food Security. In Environment, Climate, Plant and Vegetation Growth; Springer International Publishing: Cham, Switzerland, 2020; pp. 17–61. [Google Scholar]
  25. Argento, S.; Treccarichi, S.; Arena, D.; Rizzo, G.F.; Branca, F. Exploitation of a Grafting Technique for Improving the Water Use Efficiency of Eggplant (Solanum melongena L.) Grown in a Cold Greenhouse in Mediterranean Climatic Conditions. Agronomy 2023, 13, 2705. [Google Scholar] [CrossRef]
  26. Ragusa, L.; Picchi, V.; Tribulato, A.; Cavallaro, C.; Lo Scalzo, R.; Branca, F. The Effect of the Germination Temperature on the Phytochemical Content of Broccoli and Rocket Sprouts. Int. J. Food Sci. Nutr. 2017, 68, 411–420. [Google Scholar] [CrossRef] [PubMed]
  27. Tschora, H.; Cherubini, F. Co-Benefits and Trade-Offs of Agroforestry for Climate Change Mitigation and Other Sustainability Goals in West Africa. Glob. Ecol. Conserv. 2020, 22, e00919. [Google Scholar] [CrossRef]
  28. Haggar, J.; Casanoves, F.; Cerda, R.; Cerretelli, S.; Gonzalez-Mollinedo, S.; Lanza, G.; Lopez, E.; Leiva, B.; Ospina, A. Shade and Agronomic Intensification in Coffee Agroforestry Systems: Trade-Off or Synergy? Front. Sustain. Food Syst. 2021, 5, 645958. [Google Scholar] [CrossRef]
  29. Caudill, S.A.; DeClerck, F.J.A.; Husband, T.P. Connecting Sustainable Agriculture and Wildlife Conservation: Does Shade Coffee Provide Habitat for Mammals? Agric. Ecosyst. Environ. 2015, 199, 85–93. [Google Scholar] [CrossRef]
  30. Xie, X.; Cheng, H.; Hou, C.; Ren, M. Integration of Light and Auxin Signaling in Shade Plants: From Mechanisms to Opportunities in Urban Agriculture. Int. J. Mol. Sci. 2022, 23, 3422. [Google Scholar] [CrossRef]
  31. Toscano, S.; Ferrante, A.; Branca, F.; Romano, D. Enhancing the Quality of Two Species of Baby Leaves Sprayed with Moringa Leaf Extract as Biostimulant. Agronomy 2021, 11, 1399. [Google Scholar] [CrossRef]
  32. Picchi, V.; Lo Scalzo, R.; Tava, A.; Doria, F.; Argento, S.; Toscano, S.; Treccarichi, S.; Branca, F. Phytochemical Characterization and In Vitro Antioxidant Properties of Four Brassica Wild Species from Italy. Molecules 2020, 25, 3495. [Google Scholar] [CrossRef]
  33. Specht, K.; Siebert, R.; Hartmann, I.; Freisinger, U.B.; Sawicka, M.; Werner, A.; Thomaier, S.; Henckel, D.; Walk, H.; Dierich, A. Urban Agriculture of the Future: An Overview of Sustainability Aspects of Food Production in and on Buildings. Agric. Hum. Values 2014, 31, 33–51. [Google Scholar] [CrossRef]
  34. Ramin Shamshiri, R.; Kalantari, F.; Ting, K.C.; Thorp, K.R.; Hameed, I.A.; Weltzien, C.; Ahmad, D.; Mojgan Shad, Z. Advances in Greenhouse Automation and Controlled Environment Agriculture: A Transition to Plant Factories and Urban Agriculture. Int. J. Agric. Biol. Eng. 2018, 11, 1–22. [Google Scholar] [CrossRef]
  35. Walters, S.; Stoelzle Midden, K. Sustainability of Urban Agriculture: Vegetable Production on Green Roofs. Agriculture 2018, 8, 168. [Google Scholar] [CrossRef]
  36. Guenet, B.; Gabrielle, B.; Chenu, C.; Arrouays, D.; Balesdent, J.; Bernoux, M.; Bruni, E.; Caliman, J.; Cardinael, R.; Chen, S.; et al. Can N2O Emissions Offset the Benefits from Soil Organic Carbon Storage? Glob. Chang. Biol. 2021, 27, 237–256. [Google Scholar] [CrossRef] [PubMed]
  37. Blaser, W.J.; Oppong, J.; Hart, S.P.; Landolt, J.; Yeboah, E.; Six, J. Climate-Smart Sustainable Agriculture in Low-to-Intermediate Shade Agroforests. Nat. Sustain. 2018, 1, 234–239. [Google Scholar] [CrossRef]
  38. Drolet, G.G.; Middleton, E.M.; Huemmrich, K.F.; Hall, F.G.; Amiro, B.D.; Barr, A.G.; Black, T.A.; McCaughey, J.H.; Margolis, H.A. Regional Mapping of Gross Light-Use Efficiency Using MODIS Spectral Indices. Remote Sens. Environ. 2008, 112, 3064–3078. [Google Scholar] [CrossRef]
  39. Yuan, W.; Cai, W.; Xia, J.; Chen, J.; Liu, S.; Dong, W.; Merbold, L.; Law, B.; Arain, A.; Beringer, J.; et al. Global Comparison of Light Use Efficiency Models for Simulating Terrestrial Vegetation Gross Primary Production Based on the LaThuile Database. Agric. For. Meteorol. 2014, 192–193, 108–120. [Google Scholar] [CrossRef]
  40. Gitelson, A.A.; Gamon, J.A. The Need for a Common Basis for Defining Light-Use Efficiency: Implications for Productivity Estimation. Remote Sens. Environ. 2015, 156, 196–201. [Google Scholar] [CrossRef]
  41. Pei, Y.; Dong, J.; Zhang, Y.; Yuan, W.; Doughty, R.; Yang, J.; Zhou, D.; Zhang, L.; Xiao, X. Evolution of Light Use Efficiency Models: Improvement, Uncertainties, and Implications. Agric. For. Meteorol. 2022, 317, 108905. [Google Scholar] [CrossRef]
  42. Godefroot, M.; Sandra, P.; Verzele, M. New Method for Quantitative Essential Oil Analysis. J. Chromatogr. A 1981, 203, 325–335. [Google Scholar] [CrossRef]
  43. Schulz, H.; Schrader, B.; Quilitzsch, R.; Pfeffer, S.; Krüger, H. Rapid Classification of Basil Chemotypes by Various Vibrational Spectroscopy Methods. J. Agric. Food Chem. 2003, 51, 2475–2481. [Google Scholar] [CrossRef] [PubMed]
  44. Barut, M.; Nadeem, M.A.; Akgür, Ö.; Tansi, L.S.; Aasim, M.; Altaf, M.T.; Baloch, F.S. Medicinal and Aromatic Plants in the Omics Era: Application of Plant Breeding Andbiotechnology for Plant Secondary Metabolite Production. Turk. J. Agric. For. 2022, 46, 182–203. [Google Scholar] [CrossRef]
  45. Zheljazkov, V.D.; Cantrell, C.L.; Tekwani, B.; Khan, S.I. Content, Composition, and Bioactivity of the Essential Oils of Three Basil Genotypes as a Function of Harvesting. J. Agric. Food Chem. 2008, 56, 380–385. [Google Scholar] [CrossRef] [PubMed]
  46. Carlo, N.; Silvia, S.; Stefano, B.; Paolo, S. Influence of Cut Number on Qualitative Traits in Different Cultivars of Sweet Basil. Ind. Crops Prod. 2013, 44, 465–472. [Google Scholar] [CrossRef]
  47. Ciriello, M.; Formisano, L.; El-Nakhel, C.; Corrado, G.; Pannico, A.; De Pascale, S.; Rouphael, Y. Morpho-Physiological Responses and Secondary Metabolites Modulation by Preharvest Factors of Three Hydroponically Grown Genovese Basil Cultivars. Front. Plant Sci. 2021, 12, 671026. [Google Scholar] [CrossRef] [PubMed]
  48. Gavrić, T.; Jurković, J.; Gadžo, D.; Čengić, L.; Sijahović, E.; Bašić, F. Fertilizer Effect on Some Basil Bioactive Compounds and Yield. Ciênc. Agrotecnol. 2021, 45. [Google Scholar] [CrossRef]
  49. Corrado, G.; Chiaiese, P.; Lucini, L.; Miras-Moreno, B.; Colla, G.; Rouphael, Y. Successive Harvests Affect Yield, Quality and Metabolic Profile of Sweet Basil (Ocimum basilicum L.). Agronomy 2020, 10, 830. [Google Scholar] [CrossRef]
  50. Zhao, Z.; Moghadasian, M.H. Chemistry, Natural Sources, Dietary Intake and Pharmacokinetic Properties of Ferulic Acid: A Review. Food Chem. 2008, 109, 691–702. [Google Scholar] [CrossRef]
  51. Thorn, A.M.; Orians, C.M. Partial Defoliation and Hydraulic Integration in Ocimum Basilicum (Lamiaceae): Testing a Model for Sectored Xylem Flow Using 15 N Labeling. Am. J. Bot. 2011, 98, 1816–1824. [Google Scholar] [CrossRef]
  52. Iqbal, N.; Masood, A.; Khan, N.A. Analyzing the Significance of Defoliation in Growth, Photosynthetic Compensation and Source-Sink Relations. Photosynthetica 2012, 50, 161–170. [Google Scholar] [CrossRef]
  53. Wang, X.; Guo, X.; Hou, X.; Zhao, W.; Xu, G.; Li, Z. Effects of Leaf Zeatin and Zeatin Riboside Induced by Different Clipping Heights on the Regrowth Capacity of Ryegrass. Ecol. Res. 2014, 29, 167–180. [Google Scholar] [CrossRef]
  54. Skalák, J.; Vercruyssen, L.; Claeys, H.; Hradilová, J.; Černý, M.; Novák, O.; Plačková, L.; Saiz-Fernández, I.; Skaláková, P.; Coppens, F.; et al. Multifaceted Activity of Cytokinin in Leaf Development Shapes Its Size and Structure in Arabidopsis. Plant J. 2019, 97, 805–824. [Google Scholar] [CrossRef] [PubMed]
  55. Kumar, R.; Sharma, S.; Pathania, V. Effect of Shading and Plant Density on Growth, Yield and Oil Composition of Clary Sage (Salvia sclarea L.) in North Western Himalaya. J. Essent. Oil Res. 2013, 25, 23–32. [Google Scholar] [CrossRef]
  56. Kesumawati, E.; Apriyatna, D.; Rahmawati, M. The Effect of Shading Levels and Varieties on the Growth and Yield of Chili Plants (Capsicum annuum L.). IOP Conf. Ser. Earth Environ. Sci. 2020, 425, 012080. [Google Scholar] [CrossRef]
  57. Stagnari, F.; Di Mattia, C.; Galieni, A.; Santarelli, V.; D’Egidio, S.; Pagnani, G.; Pisante, M. Light Quantity and Quality Supplies Sharply Affect Growth, Morphological, Physiological and Quality Traits of Basil. Ind. Crops Prod. 2018, 122, 277–289. [Google Scholar] [CrossRef]
  58. Solis-Toapanta, E.; Gómez, C. Growth and Photosynthetic Capacity of Basil Grown for Indoor Gardening under Constant or Increasing Daily Light Integrals. Horttechnology 2019, 29, 880–888. [Google Scholar] [CrossRef]
  59. Yu, K.M.J.; McKinley, B.; Rooney, W.L.; Mullet, J.E. High Planting Density Induces the Expression of GA3-Oxidase in Leaves and GA Mediated Stem Elongation in Bioenergy Sorghum. Sci. Rep. 2021, 11, 46. [Google Scholar] [CrossRef]
  60. Ballaré, C.L.; Pierik, R. The Shade-avoidance Syndrome: Multiple Signals and Ecological Consequences. Plant Cell Environ. 2017, 40, 2530–2543. [Google Scholar] [CrossRef]
  61. Rameau, C.; Bertheloot, J.; Leduc, N.; Andrieu, B.; Foucher, F.; Sakr, S. Multiple Pathways Regulate Shoot Branching. Front. Plant Sci. 2015, 5, 741. [Google Scholar] [CrossRef]
  62. Castronuovo, D.; Russo, D.; Libonati, R.; Faraone, I.; Candido, V.; Picuno, P.; Andrade, P.; Valentao, P.; Milella, L. Influence of Shading Treatment on Yield, Morphological Traits and Phenolic Profile of Sweet Basil (Ocimum basilicum L.). Sci. Hortic. 2019, 254, 91–98. [Google Scholar] [CrossRef]
  63. Jakovljević, D.; Momčilović, J.; Bojović, B.; Stanković, M. The Short-Term Metabolic Modulation of Basil (Ocimum basilicum L. Cv. ‘Genovese’) after Exposure to Cold or Heat. Plants 2021, 10, 590. [Google Scholar] [CrossRef] [PubMed]
  64. Awasthi, R.; Bhandari, K.; Nayyar, H. Temperature Stress and Redox Homeostasis in Agricultural Crops. Front. Environ. Sci. 2015, 3, 11. [Google Scholar] [CrossRef]
  65. Radulović, N.S.; Blagojević, P.D.; Miltojević, A.B. α-Linalool—A Marker Compound of Forged/Synthetic Sweet Basil (Ocimum basilicum L.) Essential Oils. J. Sci. Food Agric. 2013, 93, 3292–3303. [Google Scholar] [CrossRef] [PubMed]
  66. Amadei, G.; Ross, B.M. Quantification of Character-impacting Compounds in Ocimum basilicum and “Pesto Alla Genovese” with Selected Ion Flow Tube Mass Spectrometry. Rapid Commun. Mass Spectrom. 2012, 26, 219–225. [Google Scholar] [CrossRef] [PubMed]
  67. Romano, R.; De Luca, L.; Aiello, A.; Pagano, R.; Di Pierro, P.; Pizzolongo, F.; Masi, P. Basil (Ocimum basilicum L.) Leaves as a Source of Bioactive Compounds. Foods 2022, 11, 3212. [Google Scholar] [CrossRef] [PubMed]
  68. Singh-Sangwan, N.; Sangwan, R.; Luthra, R.; Thakur, R. Geraniol Dehydrogenase: A Determinant of Essential Oil Quality in Lemongrass1. Planta Med. 1993, 59, 168–170. [Google Scholar] [CrossRef] [PubMed]
  69. Iijima, Y.; Gang, D.R.; Fridman, E.; Lewinsohn, E.; Pichersky, E. Characterization of Geraniol Synthase from the Peltate Glands of Sweet Basil. Plant Physiol. 2004, 134, 370–379. [Google Scholar] [CrossRef]
  70. Majdi, C.; Pereira, C.; Dias, M.I.; Calhelha, R.C.; Alves, M.J.; Rhourri-Frih, B.; Charrouf, Z.; Barros, L.; Amaral, J.S.; Ferreira, I.C.F.R. Phytochemical Characterization and Bioactive Properties of Cinnamon Basil (Ocimum basilicum Cv. ‘Cinnamon’) and Lemon Basil (Ocimum × Citriodorum). Antioxidants 2020, 9, 369. [Google Scholar] [CrossRef]
  71. Hamad, A.; Djalil, A.D.; Dewi, D.Y.S.; Hartanti, D. Development of Lemon Basil Essential Oil as a Natural Chicken Meat Preservative. IOP Conf. Ser. Earth Environ. Sci. 2021, 803, 012028. [Google Scholar] [CrossRef]
  72. Ngamprasertsith, S.; Menwa, J.; Sawangkeaw, R. Caryophyllene Oxide Extraction from Lemon Basil (Ocimum citriodorum Vis.) Straw by Hydrodistillation and Supercritical CO2. J. Supercrit. Fluids 2018, 138, 1–6. [Google Scholar] [CrossRef]
  73. Wesołowska, A.; Jadczak, D.; Wesołowska, A. Mineral Elements and Chemical Composition Essential Oil from Leaves and Flowers of Selected Lemon-Scented Ocimum Species. J. Elem. 2023, 28, 123–143. [Google Scholar] [CrossRef]
Figure 1. Temperature registered during the growing cycle. (a) Temperature registered in SR70 conditions; (b) temperature registered in SR100 conditions. Tmax: maximum temperature; Tmin: minimum temperature; Taverage: mean temperature.
Agronomy 14 00224 g001
Figure 2. Solar radiation for SR70 and SR100, expressed in MJ m−2 day−1. Values of SR100 were provided by Servizio Informativo Agrometereologico Siciliano (SIAS), while SR70 values were calculated and demonstrated consistency with those recorded by a data logger.
Agronomy 14 00224 g002
Figure 3. Pearson’s correlation among the traits analyzed in the seven Ocimum basilicum L. genotypes. The analyzed traits were the plant height (PH), the number of plant branches (PB), leaf lamina length and width (LL and LWI, respectively), leaf blistering (LB), leaf fresh and dry weight (LWE and LDM, respectively), the leaf chromatic parameters (LL*, La*, and Lb*), and the total fresh harvested weight (TWE). The correlation coefficient spanned from −1 (dark red) and 1 (dark blue). Furthermore, the diameter of the circle corresponds to the absolute value of the correlation coefficient.
Agronomy 14 00224 g003
Figure 4. Main and minor components of the essential oils of the seven genotypes of Ocimum basilicum L.
Agronomy 14 00224 g004
Figure 5. Pearson’s correlation among the analyzed aromatic compounds in the Ocimum basilicum L. genotypes. The correlation coefficient spanned from −1 (dark red) and 1 (dark blue). Furthermore, the diameter of the circle corresponds to the absolute value of the correlation coefficient.
Agronomy 14 00224 g005
Figure 6. PCA plots related to the aromatic compounds analyzed for all the Ocimum basilicum L. genotypes. (a) Distribution of genotypes in the two axes (PC1 and PC2). Genotype distribution enabled the chemotype definitions. The three chemotypes identified are represented by blue, green, and red colors. (b)Distribution of variables among the axes (PC1 and PC2).
Agronomy 14 00224 g006
Figure 7. PCA plot for the different Ocimum basilicum L. genotypes in solar radiation conditions tested (SR70 and SR100). Genotypes were clustered into four distinctive groups (I, II, III, and IV) basing on their morphometric traits.
Agronomy 14 00224 g007
Table 1. Biological materials employed for the trial. In particular, plant materials included seven O. basilicum L. genotypes from the GenBank of the Di3A at Catania University.
AccessionCodeCommon Name Origin
UNICT 2106AA foglia largaCatania
UNICT 2111BViolettoIran
UNICT 2102CGenoveseHortus sementi
UNICT 2630DCitrodoraRomania
UNICT 2112ENanoCatania
UNICT 2125FFoglia di lattugaLa Rosa
UNICT 2094GGenovese GiganteRoyal Sluis
Table 2. List of the descriptors with their unit of measurement used for the experimental trial.
CodeTrait
PHPlant height (cm)
PBNumber of plant branches (n)
LLLeaf lamina length (cm)
LWILeaf lamina width (cm)
LBLeaf blistering (absent: 0; present: 1)
LWELeaf weight percentage (%)
LDMLeaf dry matter percentage (%)
LL*Leaf chromatic parameter L*
La*Leaf chromatic parameter a*
Lb*Leaf chromatic parameter b*
TWEHarvesting weight of the total fresh biomass (g)
Table 3. Variation in the fresh harvesting weight (g) among the Ocimum basilicum L. genotypes (GE) at 35, 56, 84 and, 119 days after transplant (DAT). The cumulative fresh weight of all harvests is represented by the total fresh weight (TWE).
DATABCDEFGMean
3588.0069.0093.7056.8054.0054.6061.0068.16
56225.53327.33134.37185.60272.33170.9086.23200.33
84211.570.00218.57317.200.0019.500.00109.55
11997.6328.30157.57267.67289.30159.1795.30156.42
TWE622.73424.63604.20827.27615.63404.17242.53534.45
Table 4. Variation in the plant morphometric traits among the Ocimum basilicum L. genotypes. The analyzed traits were the plant height (PH), the number of plant branches (PB), leaf lamina length and width (LL and LWI, respectively), leaf blistering (LB), leaf fresh and dry weight (LWE and LDM, respectively), and the leaf chromatic parameters (LL*, La*, and Lb*).
TraitABCDEFGMean
PH36.8042.1844.0839.2322.9419.1240.8335.03
PB10.569.358.635.039.978.108.548.59
LL6.826.607.007.782.258.605.816.41
LWI4.333.133.944.171.047.833.994.06
LB0.000.000.000.000.001.000.330.19
LWE54.0949.5960.0358.3844.2256.7835.3851.21
LDM11.9012.9013.909.909.709.4012.9011.51
LL*48.7939.6245.2547.7648.3946.1448.4946.35
La*−11.88−0.55−10.58−11.77−9.53−9.91−11.59−9.40
Lb*19.283.1215.9618.0822.6012.9818.6915.81
Table 5. Variation in the selected significant compounds among the Ocimum basilicum L. genotypes. All the detected compounds are expressed as a percentage (%).
MoleculeABCDEFG
1,8-Cineole5.02.23.3t *7.20.211.2
Linalool31.415.030.80.76.72.133.5
Terpinen-4-ol0.10.20.1-4.40.20.2
Estragole26.256.90.10.73.01.21.3
Neral-t0.123.7---
Geranial-t0.131.2---
Eugenol1.5t7.20.30.50.80.8
α-Bergamotene8.63.113.61.923.033.65.8
Germacrene D2.50.23.00.95.65.72.2
Caryophyllene Oxide0.11.50.18.60.10.10.1
epi-α-Cadinol6.24.610.00.611.512.27.6
* t indicates traces (<0.05).
Table 6. Variation in the fresh harvest weight (g) among the Ocimum basilicum L. genotypes (GE) at 35, 56, 84, and 119 days after transplant (DAT) in both solar radiation (SR) conditions employed (SR70 and SR100). The cumulative fresh weight of all harvests is represented by the total fresh weight (TWE).
SR70SR100
DATABCDEFGMean ABCDEFGMean
35147.70183.70156.82201.00167.30151.0085.50156.15a88.0069.0093.7056.8054.0054.6061.0068.16b
56269.30186.13220.73370.83523.17235.6792.47271.19a225.53327.33134.37185.60272.33170.9086.23200.33b
84228.13166.77165.27191.470.00139.10174.70152.20a211.570.00218.57317.200.0019.500.00109.55b
119148.8350.47223.60140.40344.70225.1795.43175.51a97.6328.30157.57267.67289.30159.1795.30156.42ab
TWE793.97587.07766.42903.701035.17750.93448.10755.05a622.73424.63604.20827.27615.63404.17242.53534.45b
Means for each genotype
ABCDEFG
35117.85126.35125.26128.90110.65102.8073.25
56247.42256.73177.55278.22397.75203.2889.35
84219.8583.38191.92254.330.0079.3087.35
119123.2339.38190.58204.03317.00192.1795.37
TWE708.35b505.85de685.31c865.48a825.40ab577.55d345.32f
Significance of the differences using ANOVA Student–Newman–Keuls
SRGEHTSR × GESR × HTGE × HTSR × GE × HT
TWE*********************
*** indicates p-value ≤ 0.001. Letters indicate significant differences according to the Tukey test (p < 0.05).
Table 7. Variation in the light use efficiency (LUE) among the Ocimum basilicum L. genotypes in both solar radiation conditions employed (SR70 and SR100). Values are expressed as a percentage (%).
SR70SR100
ABCDEFGMeanABCDEFGMean
LUE40.6030.0239.1946.2152.9338.4022.9138.61a22.2915.2021.6329.6122.0414.478.6819.13b
Mean for each genotype
ABCDEFG
LUE31.45b22.61d30.41b37.91a37.49a26.43c15.80e
Significance of the differences using ANOVA
SR***
GE***
SR × GE***
*** indicates p-value ≤ 0.001. Letters indicate significant differences according to the Tukey test (p < 0.05).
Table 8. Variation in the morphometric traits among the Ocimum basilicum L. genotypes (GE) in the different solar radiation (SR) conditions employed (SR70 and SR100). The analyzed traits were the plant height (PH), the number of plant branches (PB), leaf lamina length and width (LL and LWI, respectively), leaf blistering (LB), leaf fresh and dry weight (LWE and LDM, respectively), and the leaf chromatic parameters (LL*, La*, and Lb*).
SR70SR100
DATABCDEFGMean ABCDEFGMean
PH47.9771.1359.3378.8733.6834.4353.2554.09a36.8042.1844.0839.2322.9419.1240.8335.03b
PB12.5616.4612.7315.7816.299.0611.4213.47a10.569.358.635.039.978.108.548.59b
LL8.477.498.049.622.8610.386.207.58a6.826.607.007.782.258.605.816.41a
LWI4.593.023.934.761.308.643.214.21a4.333.133.944.171.047.833.994.06a
LB0.000.000.000.000.001.000.330.19a0.000.000.000.000.001.000.330.19a
LWE63.3030.7653.1936.8234.1261.7140.5645.78b54.0949.5960.0358.3844.2256.7835.3851.21a
LDM15.2713.6013.6013.6010.7110.3213.7012.97a11.9012.9013.909.909.709.4012.9011.51a
LL*47.5035.4144.9546.1545.9146.4647.6144.86a48.7939.6245.2547.7648.3946.1448.4946.35a
La*−12.440.88−12.47−12.29−11.20−12.85−11.96−10.3a−11.88−0.55−10.58−11.77−9.53−9.91−11.59−9.40a
Mean for each genotype
ABCDEFG
PH42.39b56.65a51.71ab59.05a28.31c26.78c47.04ab
PB11.56a12.90a10.68a10.40a13.13a8.58a9.98a
LL7.64ab7.04ab7.52ab8.70ab2.56c9.49a6.01b
LWI4.46b3.08c3.93bc4.47b1.17d8.24a3.60c
LB0.00b0.00b0.00b0.00b0.00b1.00a0.33b
LWE58.70a40.18bc56.61a47.60b39.17bc59.25a37.97bc
LDM13.59a13.25a13.75a11.75b10.21bc9.86c13.30a
LL*48.15a37.52b45.10a46.96a47.15a46.30a48.05a
La*−12.16b0.16a−11.53b−12.03b−10.37b−11.38b−11.78b
Lb*18.67ab1.76d16.05bc17.02bc22.00a13.97c17.87b
Significance of the differences using ANOVA Student−Newman−Keuls
PHPBLLLWILBLWELDMLL*La*Lb*
SR******n.s.n.s.n.s.*n.s.n.s.*n.s.
GE***n.s.************************
SR × GE**n.s.n.s.***n.s.*n.s.n.s.n.s.n.s.
***, **, and * indicate p-values ≤ 0.001, 0.01, and 0.05, respectively. Letters indicate significant differences according to the Tukey test (p < 0.05). n.s. represents not significant.
Table 9. Matrix of the three components extracted by the principal component analysis (PCA). Bold represents the strongest correlation between the analyzed traits and the respective component extracted.
TraitPC1PC2PC3
PH−0.714 0.132 0.603
PB−0.703 −0.234 0.364
LL 0.141 0.774 0.596
LWI 0.553 0.748 0.288
LB0.598 0.566 −0.137
LWE0.644 0.333 0.221
LDM−0.570 0.085 0.506
LL*0.790 −0.484 0.218
La*−0.716 0.382 −0.535
Lb* 0.626 −0.731 0.227
TWE −0.044 −0.393 0.595
Variance (%)35.99624.89818.152
Disclaimer/Publisher’s Note: The statements, opinions and data contained in all publications are solely those of the individual author(s) and contributor(s) and not of MDPI and/or the editor(s). MDPI and/or the editor(s) disclaim responsibility for any injury to people or property resulting from any ideas, methods, instructions or products referred to in the content.

