Article

Effects of Different Water Storage and Fertilizer Retention Substrates on Growth, Yield and Quality of Strawberry

1
College of Resources and Environmental Engineering, Anhui University, Heifei 230601, China
2
Hefei Intelligent Agricultural Collaborative Innovation Research Institute, Chinese Academy of Sciences, Heifei 230601, China
*
Authors to whom correspondence should be addressed.
Agronomy 2024, 14(1), 205; https://doi.org/10.3390/agronomy14010205
Submission received: 10 December 2023 / Revised: 11 January 2024 / Accepted: 13 January 2024 / Published: 17 January 2024
(This article belongs to the Section Agroecology Innovation: Achieving System Resilience)

Abstract

:
To address the problems of inadequate water and fertilizer retention performance of the substrate, which results in the waste of water and fertilizer resources and then contributes to existing agricultural non-point source pollution, this study selected raw materials with different water retention performances for substrate compounding and explored their water retention performance and impact on the growth, yield and quality of strawberries. The experimental setup utilized the strawberry cultivar ‘Hongyan’ as the test subject and incorporated different proportions of vermicompost, coconut bran, biochar and humic acid into the organic fertilizer. A total of 12 treatment groups were formed across three gradients, involving different proportions of vermicompost with 0.05, 0.10 and 0.15 proportions of coconut bran/biochar and 0.05, 0.15 and 0.20 proportions of humic acid. To evaluate the water retention performance, uniform water and fertilizer regulations were applied. The results revealed that the treatment groups T4 (vermicompost:coconut bran = 0.5:0.1) and T5 (vermicompost:biochar = 0.5:0.1) exhibited higher water absorption multiplicity, lower water infiltration rates, and better water retention performances, but there was no significant difference between the two treatment groups. Among them, T4 could effectively improve the nutrient content of the substrate, and the substrate nitrogen-use efficiency (NUE) increased by 5.80% compared with CK2. Also, plant total nitrogen (TN) and total phosphorus (TP) uptake increased by 81.18% and 4.74%, respectively, compared with CK2, which in turn promoted the growth and development of the plant and improved the fruit yield and quality to a certain extent. Meanwhile, T4 had the highest urease and catalase activities, with sucrase activity ranking second only to T1. In contrast, T5 demonstrated greater effectiveness in improving the average fruit weight and maximum fruit weight, registering increases of 22.98% and 36.22% compared to CK2, respectively, but the effect on the total yield was less pronounced. A comprehensive evaluation of strawberry growth found that the T4 treatment was superior. In conclusion, the ratio of vermicompost and coconut bran at 0.5:0.1 improved and promoted the substrate water retention performance and strawberry growth.

1. Introduction

Strawberries (Fragaria × ananassa Duch.) are rich in minerals and trace elements such as calcium, iron, phosphorus, zinc and others, which boast pro-digestive and anti-aging effects [1]. Together with their delectable flavor profile, strawberries have endeared themselves to a wide public audience. In the United States, strawberries are the fourth-highest-selling crop in California, with approximately 90% of strawberries growing in the state and bringing over $2 billion in revenue to the United States in 2020 [2]. As the world’s largest exporter of strawberries, Spain exported 304,300 tons of strawberries in 2017, accounting for 84.43% of its total strawberry production that year [3]. At present, strawberries in China are mainly cultivated in greenhouses with excessive irrigation and fertilization, which will cause a series of problems, such as substantial water wastage, reduced efficiency of fertilizer use, soil compaction and agricultural non-point source pollution. Perennial strawberry cultivation is susceptible to the accumulation of diseases and pests, resulting in continuous cropping obstacles that adversely affect crop development, crop yield and fruit quality [4,5]. Therefore, improving water retention capabilities through substrate enhancement and the selection of water retention materials becomes imperative. Vermicompost is the organic matter excreted after digestion and decomposition by earthworms. It boasts high fertility and porosity and an abundance of organic matter, nitrogen, phosphorus, potassium and other nutrients. It can improve soil fertility, enhance soil aeration and increase water retention owing to its granular structure [6,7]. The test results of Zhang et al. [8] showed that the content of soil aggregates and water-stable aggregates was positively proportional to the content of applied vermicompost under the same fertilization amount. Baghbani-Arani A. [9] also discovered that the application of vermicompost enhanced the soil organic carbon content, improved soil physicochemical conditions, and increased the biological yield of chili under water-deficient conditions. Biochar, characterized by an expansive surface area and porosity, enhances soil’s pore structure and water retention capacity, in addition to adsorbing and stabilizing organic and inorganic substances in the soil. It facilitates the acceleration of strawberries entering the fruiting stage and prolongs the strawberry supply cycle. Santos J.A. [10] investigated the effect of biochar addition on water retention in tropical soils of different textures and observed a 62% enhancement in typical tetrads, a 38% increase in old mature soils, and an 18% improvement in leached soils. It has been reported that the addition of biochar can improve soil aggregates, increase the average soil water content, and alleviate issues associated with poor soil water retention [11]. Coconut bran is rich in cellulose and phenolic substances, which offer effective water and fertilizer conservation properties. It provides better aeration and water retention than ordinary substrate, all while remaining cost-effective and readily accessible, with a loose texture [12]. However, studies have found that [13] the nutrient elements contained in coconut bran substrate may not suffice to meet the nutritional needs of plants in terms of concentration and proportion, so it needs to be supplemented. Therefore, the formulation of a composite substrate in specific proportions proves to be more suitable for cultivation. Yang Yi et al. [14] showed that with the increase in coconut bran application, the soil bulk density decreased, along with improvements in porosity and water content to a certain extent. Humic acid possesses the ability to augment the soil’s cation exchange capacity, improve the soil’s aggregate structure, raise fertilizer utilization, and maintain a soil acid-base balance [15,16]. Research indicates that biological humic acid could improve the soil’s capacity for water conservation and drought resistance, boosting soil water retention and root water absorption [17]. The experimental findings of Hou et al. [18] showed that the application of humic acid immensely bolstered the water and fertilizer retention capacity of mixed sandy soils. Moreover, Bigelow C. et al. [19] also showed that humic acid had the ability to mitigate the hydrophobicity of soil.
This study aims to improve the physical and chemical properties and water retention performance and explore its performance in actual planting by using agricultural waste for composting. This involves incorporating different ratios of water-retaining raw materials into the substrate after proper decomposition. After that, the formulated substrate is applied to strawberry planting, carrying out unified water and fertilizer management, observing and recording the strawberry growth process, and realizing the alleviation of surface source pollution and saving water resources.

2. Materials and Methods

2.1. Test Materials

Sheep manure, rapeseed cake, coconut bran and vermicompost were purchased from Hefei Chenghui Ecological Agriculture Co., Ltd. (Hefei, China). Humic acid was obtained from the CPS Green Farming Group of the Plant Protection Institute of the Chinese Academy of Agricultural Sciences (CASA, Hefei, China). Biochar was supplied by Hefei Debo Bioenergy Technology Co., Ltd. (Hefei, China). Strawberry seedlings were provided by Anhui Academy of Agricultural Sciences (AAAS, Hefei, China). The integrated water and fertilizer equipment was acquired from Hebei LvZhiXin Agricultural Equipment Technology Co., Ltd. (Hefei, China).

2.2. Experimental Methods

The experiment was conducted at Zhongke Wisdom Agricultural Collaborative Innovation Research Institute, Changfeng County, Hefei City, Anhui Province (117°27′ E, 31°96′ N). During the preliminary testing period, waste substrate and organic fertilizer were piled up for aerobic composting at a mass ratio of 2:1.1. The moisture content of the heap was maintained at 60%, with a pH between 7 and 8. Also, daily temperature measurements of the heap were taken at 4:00 p.m. throughout the stacking period to assess the extent of decomposition. According to the comprehensive consideration of the water retention performance, air permeability and nutrient content of the substrate, the decomposed organic fertilizer was mixed with different proportions of vermicompost, coconut bran, biochar and humic acid to prepare the raspberry planting substrate (ratios refer to Tang et al. [20], Su et al. [21] and Si et al. [22]). Specifically, 12 treatment groups were set in the experiment (as detailed in Table 1).
The strawberry variety for the test was ‘Hongyan’, and it was planted in September 2022. Prior to planting, the strawberry plants were thoroughly watered, and during the first week after planting, they received ample irrigation. After that, the amount of watering was adjusted to promote the growth of the root system while observing the growth of new roots. By reducing a certain amount of irrigation to test the water retention of the substrate, the irrigation amount of the strawberry growth process was set at 80% ET0 = 2680 m3/hm2 (ET0 represents the reference crop evapotranspiration [23,24]), and the fertilization amount was 2112.5 kg/hm2. Drip irrigation belts were paved on elevated cultivation, and the integrated water and fertilizer equipment was employed for water and fertilizer application. Strawberry planting was completed in the greenhouse. During the planting process, artificial regulation could be carried out according to the air and soil sensors, which reflected the state of the temperature and humidity. When the temperature was too high, we took measures such as ventilation, shading, or sprinkling cooling to cool it down. When the temperature was too low, we used heaters or covered the mulch film to increase the temperature. The temperature was controlled between 5 °C and 28 °C, and the humidity was between 60% and 80% throughout the planting period. The lighting time should be as long as possible to meet 8 h. When the lighting is extremely inadequate during the winter, additional lighting can be used.

2.3. Measurement Indicators and Methods

2.3.1. Physical and Chemical Properties of Substrate

The pH value was measured using a pH meter (STARTER 3C), which was manufactured by OHAUS Instruments Co., Ltd. (Shanghai, China). The bulk density, total porosity and aerated porosity were determined following the conventional agrochemical analysis method. Total nitrogen was determined using Kjeldahl automatic nitrogen determination. Moreover, the organic matter was assessed through the potassium dichromate oxidation-external heating method. Fast-acting potassium was quantified using the ammonium acetate leaching method. The effective phosphorus content was determined by the molybdenum-antimony colorimetric method. And the exchangeable calcium and magnesium were determined by an atomic absorption spectrophotometer.

2.3.2. Water Retention Analysis of Different Substrates

For each treatment, a consistent volume of air-dried matrix was weighed and placed into a non-woven bag (M0), followed by subsequent weighing (M1). These bags were, respectively, placed in water and soaked for a full 24 h period, ensuring complete saturation. On the second day, the bags were removed from the water and hung until there was no water dripping, and the time from the beginning of the dripping (t1) to the time of no water dripping (t2) was recorded. The weight of the bags was measured again (M2), and the water quality (M3) was determined in the water cup below where the water had dripped. The bag weight after no water dripping was set to the mass of the first day (E1), and the second weighing (E2) was carried out after 24 h. Continuous measurement was carried out until the mass did not change (Elast). After 5 days, the water content of the matrix was W5.
Aw = (M2M0M1)/M1
Sr (g/min) = M3/(M2 + M3)(t2t1)
Er (g/h) = (EnEn+1)/24
W5 = E5M0M1
Notes: Aw means matrix water absorption ratio; Sr means matrix seepage rate; Er means matrix evaporation rate.

2.3.3. Utilization and Uptake of Nitrogen and Phosphorus of Substrates and Plants in Different Treatments

The utilization rates of nitrogen and phosphorus in the substrate were ascertained through the collection of runoff tail water and water-soluble fertilizer stock solutions. Total nitrogen (TN) was determined using potassium persulfate digestion and UV spectrophotometry, while total phosphorus (TP) was determined by employing ammonium molybdate spectrophotometry. Plant samples were nitrated with H2SO4-H2O2, distilled under alkaline conditions, absorbed by boric acid absorption solution, and titrated with the sulfuric acid standard solution in order to determine the content of TN in plants, and the content of TP was determined by ICP-MS after digestion. The matrix nitrogen and phosphorus utilization rate formulas are as follows:
N U E = R F N T N R F × 100 %                 P U E = R F P T P R F × 100 %
Notes: NUE—matrix nitrogen utilization efficiency; PUE—matrix phosphorus utilization efficiency; RFN—total nitrogen content in the original solution of water-soluble fertilizer; RFP—total phosphorus content in the original solution of water-soluble fertilizer.

2.3.4. Plant Growth Index

The plant height, leaf length and leaf width of new leaves of strawberry plants were measured, respectively, during both the growth and harvesting phases, utilizing a straightedge. The leaf area (LA) was calculated according to the modified formula LA = 0.7366 × L × W − 0.1971 [25]. The thickness of plant stems was measured using vernier calipers, while chlorophyll was determined by means of a portable chlorophyll meter, the SPAD-502 Plus.

2.3.5. Fruit Yield and Quality

Upon the ripening of strawberries with the same maturity, a harvesting interval of 2~3 days was maintained. The yield and weight of maximum fruits were measured. The quality of fruit at the full fruit stage was determined. What is more, the soluble solids were determined by the Atago PAL-2 portable refractometer. Titratable acid was titrated with sodium hydroxide, while soluble sugar and reducing sugar were determined following the GB 6194-86 method. Moreover, the vitamin C content was determined by 2,6-dichloroindophenol titration.

2.4. Data Processing and Analysis

The test data were processed utilizing Microsoft Office Excel 2016. The Statistical Package for the Social Sciences (SPSS) 26.0 was used for the one-way analysis of variance (ANOVA) procedure. When p < 0.05, the differences were considered statistically significant according to Fisher’s LSD test. The data were standardized by SPSS and then subjected to principal component extraction to establish a comprehensive evaluation formula and finally, to calculate its comprehensive score. Graphic plots were generated using Origin 2023.

3. Results and Analysis

3.1. Analysis of Water Storage Performance of Different Substrates

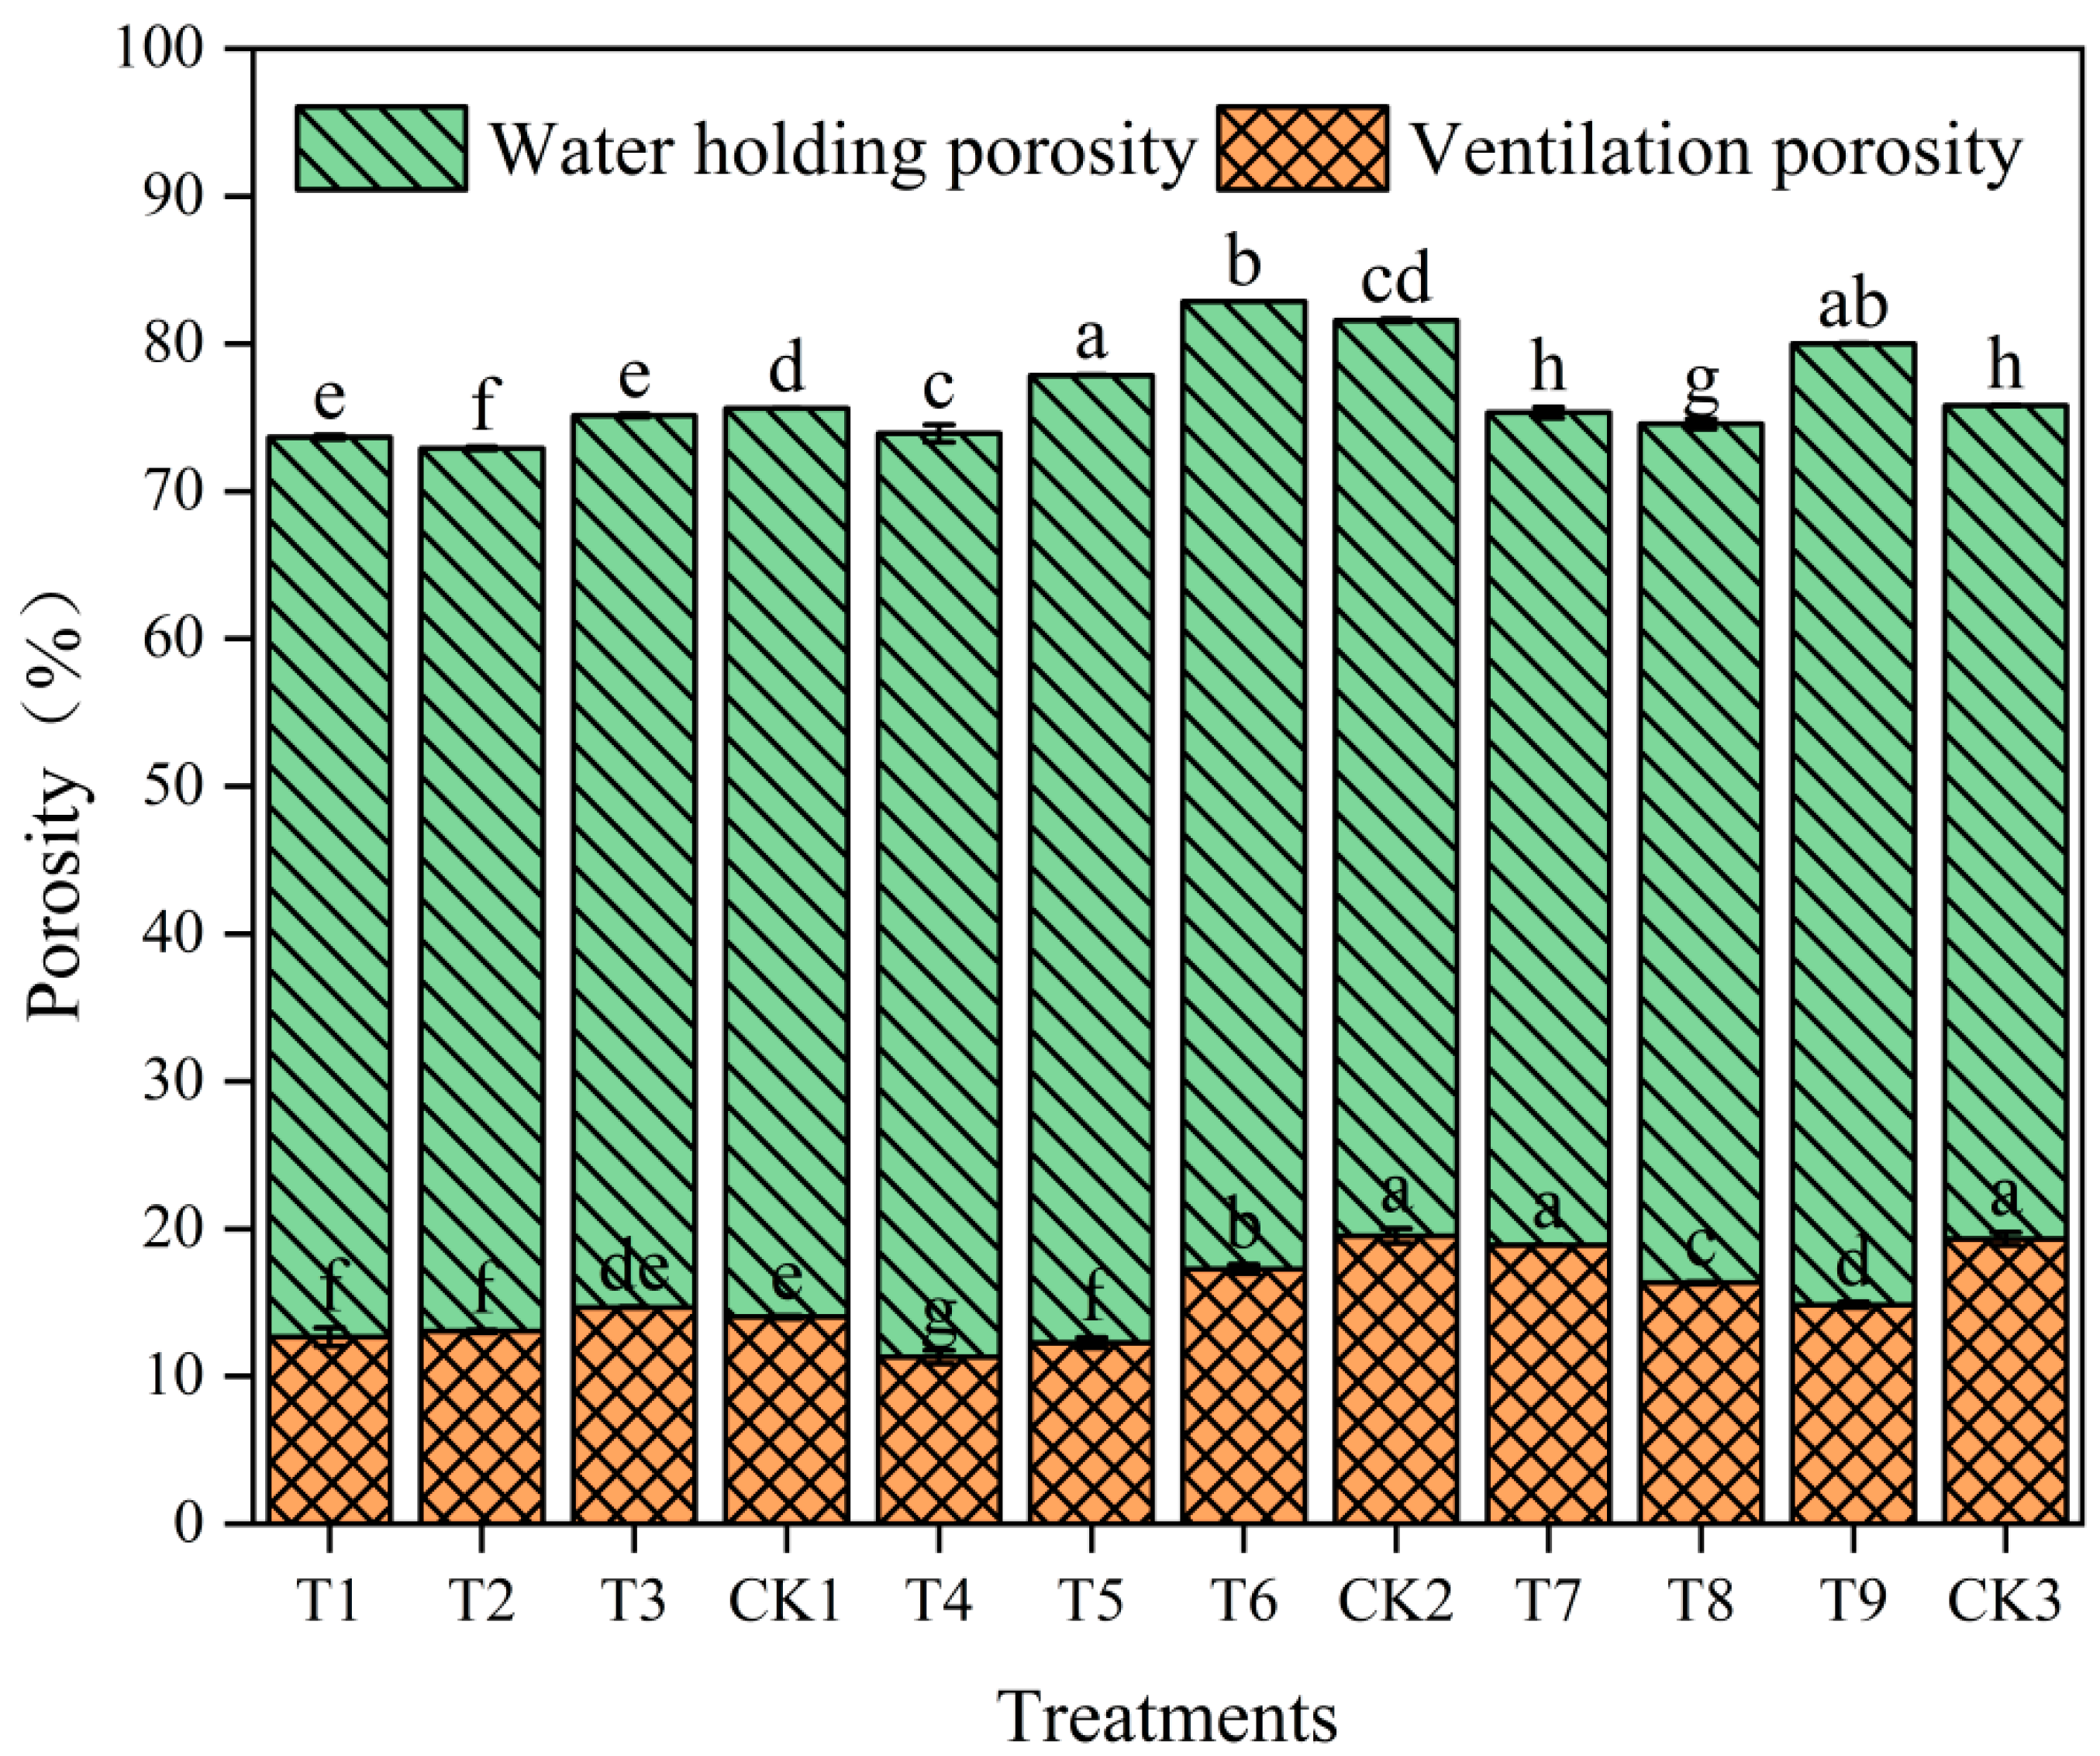
3.1.1. Analysis of Physical Properties of Different Substrates

Except for T1, the bulk density in all groups was lower than that of the CK group, although the differences were not statistically significant. The air–water ratio of T4 and T5 was the lowest, while CK3 and T7 were the highest. There was no significant difference between T4 and T5, as well as between CK3 and T7 (Table 2). In Figure 1, T6 had the highest total porosity, with no significant difference when compared to CK2. The porosity of T1, T2 and T4 was lower than that of CK1 and CK2 by 2.59%, 3.46% and 9.72%, respectively, with a significant difference (p < 0.05). What is more, CK2, CK3 and T7 have the highest ventilation porosity, while T4 and T5 have the lowest porosity, of which T4 and T5 were reduced by 42.11% and 37.04%, respectively, compared with CK2. Additionally, T5 and T9 in water-holding porosity were significantly higher than those in the other groups, but there was no significant difference between them.

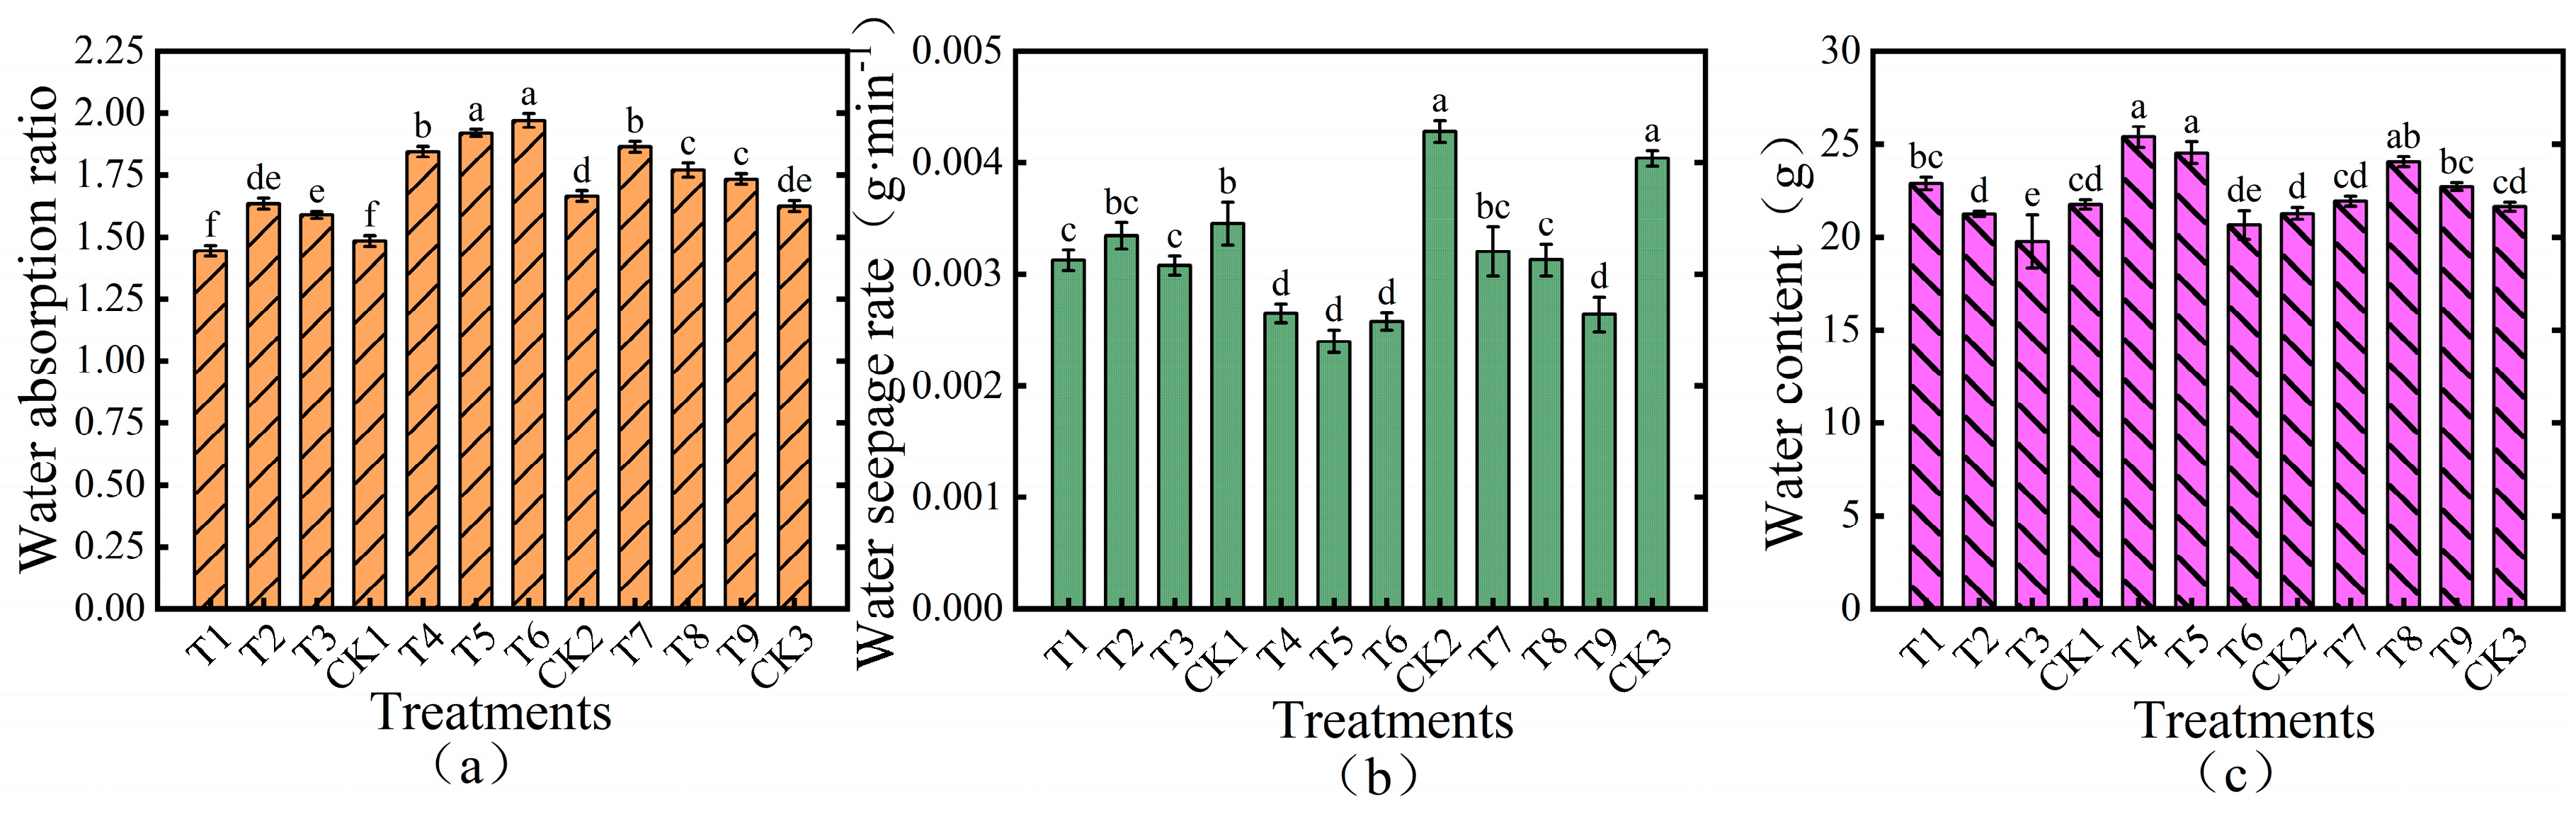
3.1.2. Analysis of Water Absorption Parameters of Different Substrates

Water Absorption Multiplicity, Percolation Rate and Water Content
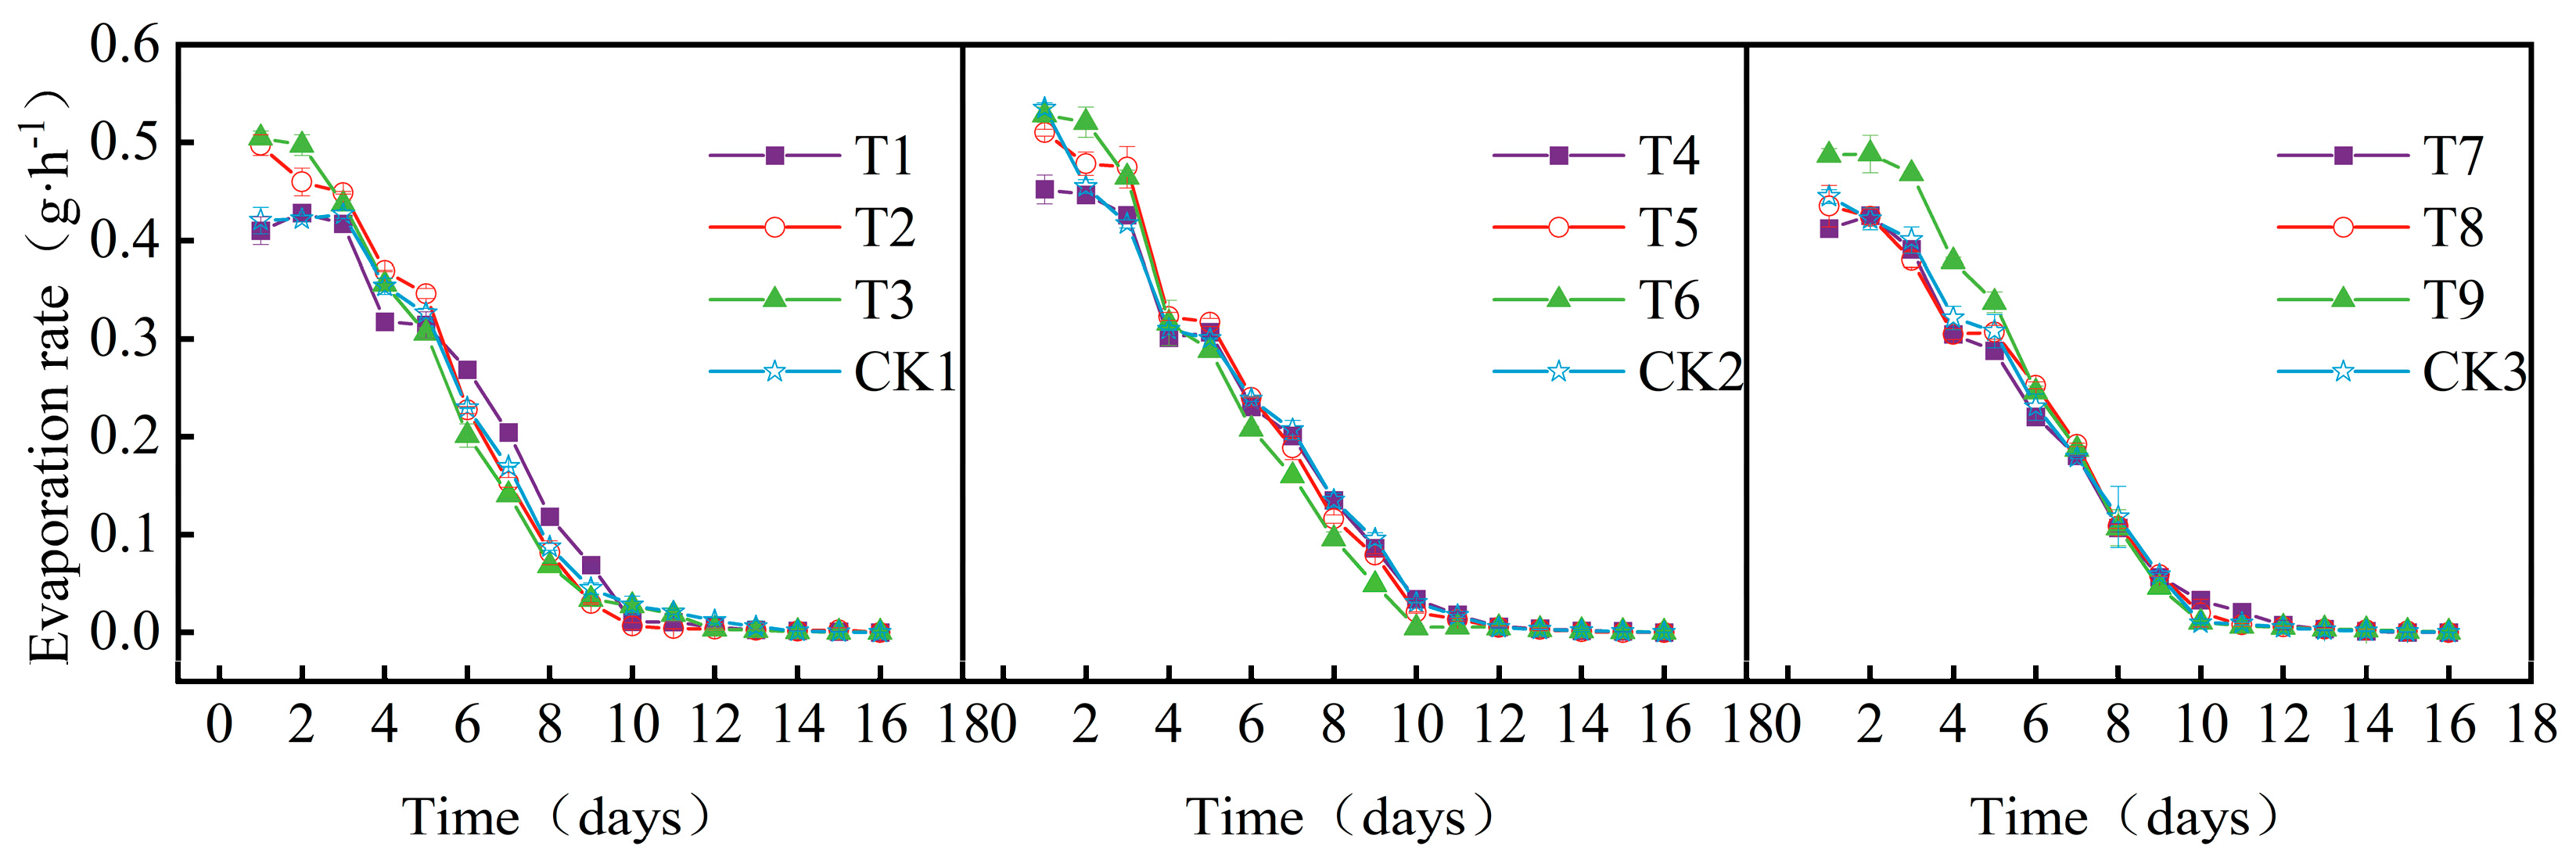
The water absorption ratios for different matrix treatment groups are illustrated in Figure 2a. There were significant differences in the water absorption of multiple different substrates. The water absorption ratio for T4~T6 treatment groups was higher, with increments of 10.81%, 15.32% and 18.32% in comparison to CK2, respectively. Within this group, T5 and T6 were significantly higher than the other groups, and there was no significant difference between T5 and T6. The water absorption ratios for T1~T3 were relatively low, and T1 was the smallest, showing no significant difference when compared to CK1.
As depicted in Figure 2b, after adding different water retention materials, the water infiltration rate of the substrate was reduced to different degrees. Notably, T4~T6 treatments were more effective compared with CK2, and the water infiltration rate was reduced by 38.08%, 43.93% and 39.72%, respectively. The differences among these three treatment groups were not statistically significant. The seepage rates of T1~T3 decreased by 9.54%, 3.18% and 10.98%, respectively, compared with CK1. Also, there were no significant differences between T2 and CK1. Compared with CK3, the T7~T9 treatments decreased by 20.54%, 22.52% and 34.65%, respectively.
In all the treatment groups, except for the T3 and T6 groups, the water content of all the other groups witnessed varying degrees of increase when compared with the CK, in which the water content of the T4 and T5 treatments was significantly higher than that of the other groups, but there was no significant difference between T4 and T5, as shown in Figure 2c. The average water content within the matrix incorporating three different water-retaining materials followed the following order: coconut bran-mixed (T1, T4 and T7), biochar-mixed (T2, T5 and T8), and humic acid-mixed (T3, T6 and T9) substrates.

Evaporation Rate

As can be seen from Figure 3, the evaporation rate of different substrates showed a gradual decline with an increasing testing time. This decline was more pronounced in the first 10 days, after which it slowed down, bringing about a decreased rate of change. Moreover, the evaporation rate of the treatments tended to be the same after a plateaued state. What shall be noticed is that the evaporation rates of the three groups, T1, T4 and T7, were significantly lower than those of the other groups (p < 0.05), while CK2 exhibited a relatively high rate of evaporation. Around the fifth day of the experiment, the evaporation rates of all groups except T3 and T9 showed a flat trend and then continued to decline.

3.2. Analysis of Fertilizer Retention Effect of Different Substrates

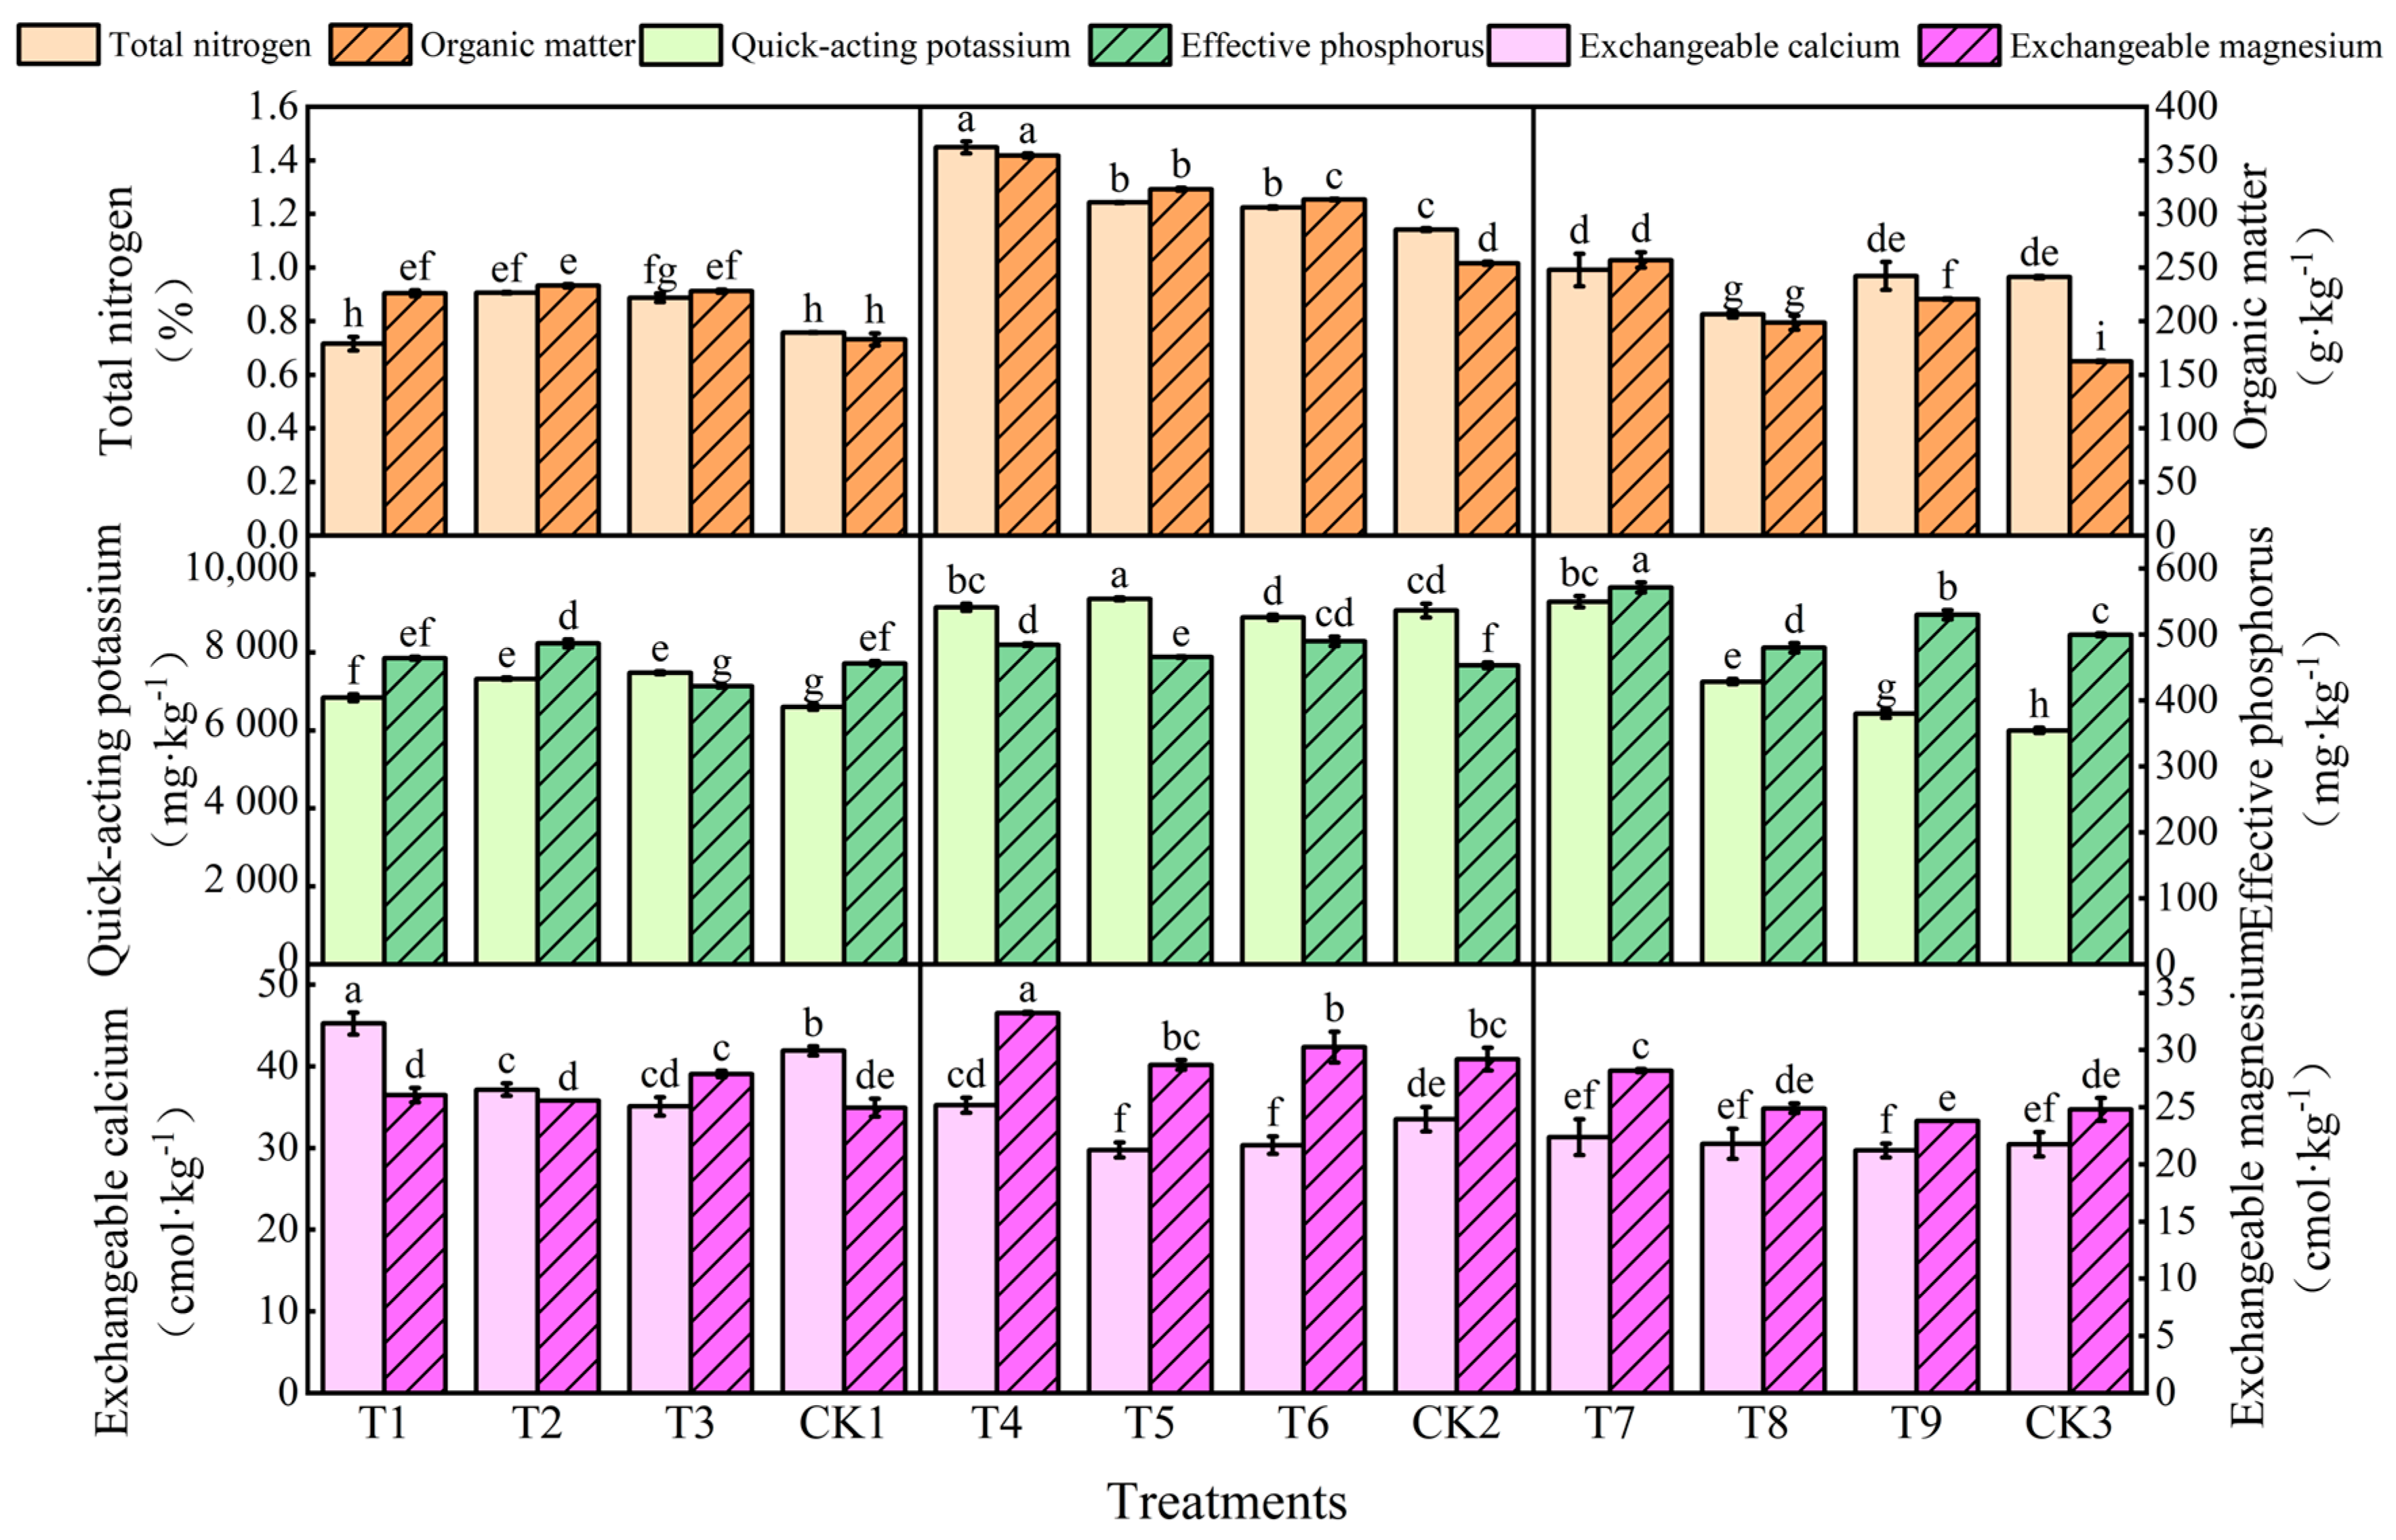
3.2.1. Analysis of Chemical Properties of Different Substrates

The EC and pH values of the matrix can reflect the salt ion concentration and acid or alkali value in the matrix. Electrical conductivity (EC) refers to the electrical conductivity of the solution, serving as a measure of the soil’s water-soluble salt content. An EC value that is either too high or too low can impede crop growth. If the EC is too high, it may create a high concentration of soluble salts that generate reverse osmotic pressure, displacing water from the plant’s root system and causing browning or drying of the root tips [26]. This phenomenon is the reason why overfertilization can cause seedling burning. Conversely, if the EC is too low, the nutrients available to the plant for uptake are inadequate. If this situation persists, it may lead to delayed plant growth and development [27]. The pH levels of all substrates in the study fell within the range of 6.2~6.8, which was weakly acidic. The EC values ranged from 0.92 to 1.48 mS/cm, which was consistent with the growth environment of strawberries. The pH and EC of the matrix treatment group added with water-retaining materials were increased to varying degrees compared with those of the CK. In addition, the EC of the matrix added with humic acid was higher than that of other groups, but there was no significant difference (Table 3).
As shown in Figure 4, T4 had the highest total nitrogen and organic matter content, followed by T5 and T6, all of which were significantly higher than the other groups. (p < 0.05). Compared with CK2, the total nitrogen content of T4~T6 increased by 26.95%, 8.90% and 7.27%, respectively. Likewise, the organic matter content of T4~T6 was significantly higher than that of the other groups, witnessing an increase of 39.57%, 27.17% and 23.43%, respectively, when compared to CK2. The rest of the groups exhibited varying degrees of improvement compared to their respective controls. What is more, T5 witnessed the highest effective potassium content, which was significantly different from other groups (p < 0.05), followed by T7 and T4, with no significant difference between them. T7 exhibited the maximum effective phosphorus content, with T9 and CK3 following closely behind, both of which differed significantly (p < 0.05). Among the exchangeable calcium content, the T1 group had the highest levels, followed by CK1 and T2, with a significant difference between the three (p < 0.05). Moreover, the content of exchangeable magnesium in T4 was higher than that in other groups and had a significant difference (p < 0.05). Specifically, the contents of T4 and T6 increased by 13.87% and 3.60%, respectively, compared with CK2. However, T5 displayed slightly lower levels than CK2, and there was no significant difference between them.
The contents of total nutrients (N+P2O5+K2O) are shown in Table 3. What shall be noticed is that the national standard for biogas residue agricultural and forestry substrates (NY 525-2012) stipulates the technical indicators for organic fertilizer, specifying that a total nutrient (N+P2O5+K2O) content (on a dry basis) of ≥1.5% meets the agricultural standards. According to the nutrient content analysis, it can be concluded that the T4 group has a higher nutrient value and can provide more adequate nutrients for the optimal growth of strawberries.

3.2.2. Substrate Nitrogen and Phosphorus Utilization and Plant Nitrogen and Phosphorus Uptake in Different Treatments

Nitrogen and Phosphorus Utilization of Different Substrates

The nitrogen and phosphorus utilization of different treatment substrates are shown in Table 4. The utilization rate of matrix TN was the highest in T4, followed by T5 and T1, with no significant difference among the three. T4 and T5 demonstrated 5.80% and 5.37%, respectively, compared with CK2. T1 and T2 were all increased to a small extent compared to CK1, and T3 was slightly lower than CK1, with no significant difference. When it comes to T7~T9, they displayed varying degrees of reduction in TN utilization compared to CK3, T8 and T9 were significantly different from CK3 (p < 0.05). The utilization rates of TP in T6 were the highest, followed by T2. There was a significant difference between the two groups. In addition, T7 demonstrated the lowest TP utilization, being significantly lower than other groups (p < 0.05).

Nitrogen and Phosphorus Uptake by Plants under Different Treatments

Nitrogen and phosphorus uptake in the plants were shown in Table 5, demonstrating varied increases in TN uptake among the different treatment groups when compared to each control group. To be more specific, T1, T2 and T3 were significantly higher than CK1 by 48.16%, 39.71% and 56.62%, respectively. T4, T5 and T6 were significantly higher than CK2 by 81.18%, 71.78% and 56.79%, respectively. In addition, T7, T8 and T9 were significantly higher than CK3, with increments of 113.01%, 133.56% and 147.95%, respectively. The highest TN uptake was found in T4, and this value was significantly higher than the other treatment groups. As for the TP uptake, all treatment groups displayed a higher uptake than their respective control groups, except for T6 and T7. T1, T2 and T3 were, respectively, increased by 98.84%, 60.70% and 83.02%, in comparison to CK1. Also, T4 and T5 increased by 4.74% and 24.05%, when compared with CK2. T8 and T9 increased by 9.05% and 14.03%, respectively, compared with CK3. Among them, CK2 and CK3 were, respectively, increased by 101.16% and 105.58%, compared with CK1. TP uptake was highest in T5. It was significantly different (p < 0.05) from each of the others.

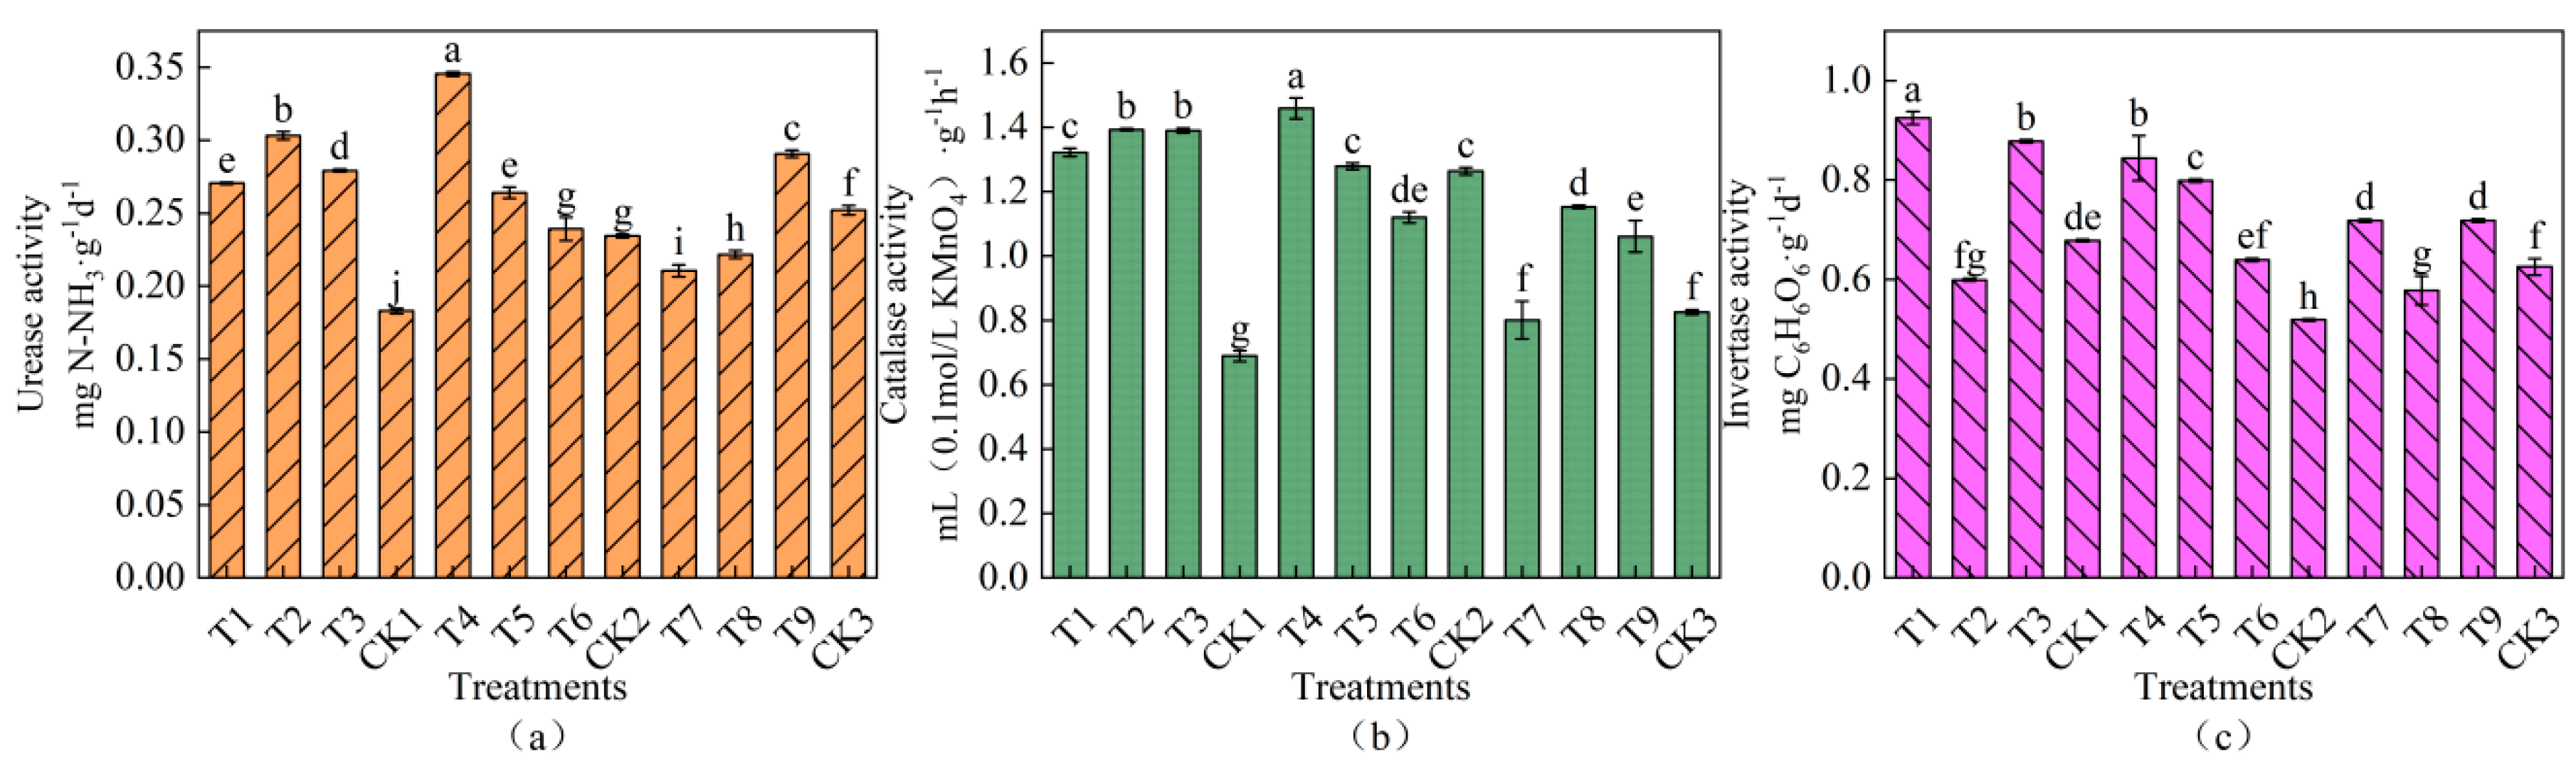
3.2.3. Matrix Enzyme Activity under Different Treatments

The matrix enzyme activities under different treatments are shown in Figure 5. Compared with CK1, the urease activity in the T1, T2 and T3 treatments were significantly increased by 47.84%, 65.64% and 52.64%, respectively. The urease activity of T2 was the highest, surpassing T1 and T3 by 17.80% and 13.00%, respectively, with a significant difference (p < 0.05). Compared with CK2, the urease activities of T4, T5 and T6 witnessed significant increases by 47.39%, 12.64% and 2.09%, respectively. Notably, T4’s enzyme activity was the highest among the treatment groups, significantly differing from all other treatments (p < 0.05). T9 exhibited a moderate increase in urease activity, while T7 and T8 exhibited lower levels than CK3, and there was a significant difference (p < 0.05). The hydrogen peroxidase activity in the treated groups increased to vary in all treated groups compared to the control group, except for T6. Catalase activity significantly increased by 91.87%, 102.18% and 101.74% in the T1, T2 and T3 treatments compared to CK1, and there was no significant difference between T2 and T3. Compared with CK2, the catalase activity of T4 and T5 treatments increased by 15.43% and 1.19%, while there was no significant difference between T5 and CK2. The catalase activity of T7 was slightly lower than that of CK3, but there was no significant difference, while T8 and T9 displayed significant increases of 39.55% and 28.47%. T1 was the highest among the sucrase activities, followed by T3 and T4. T1 and T3 increased by 36.35% and 29.44%, respectively, compared to CK1, while T4 increased by 62.64% compared to CK2. Overall, the T4 treatment had the highest urease and catalase activities, with sucrase activity ranking second only to T1.

3.3. Comprehensive Analysis

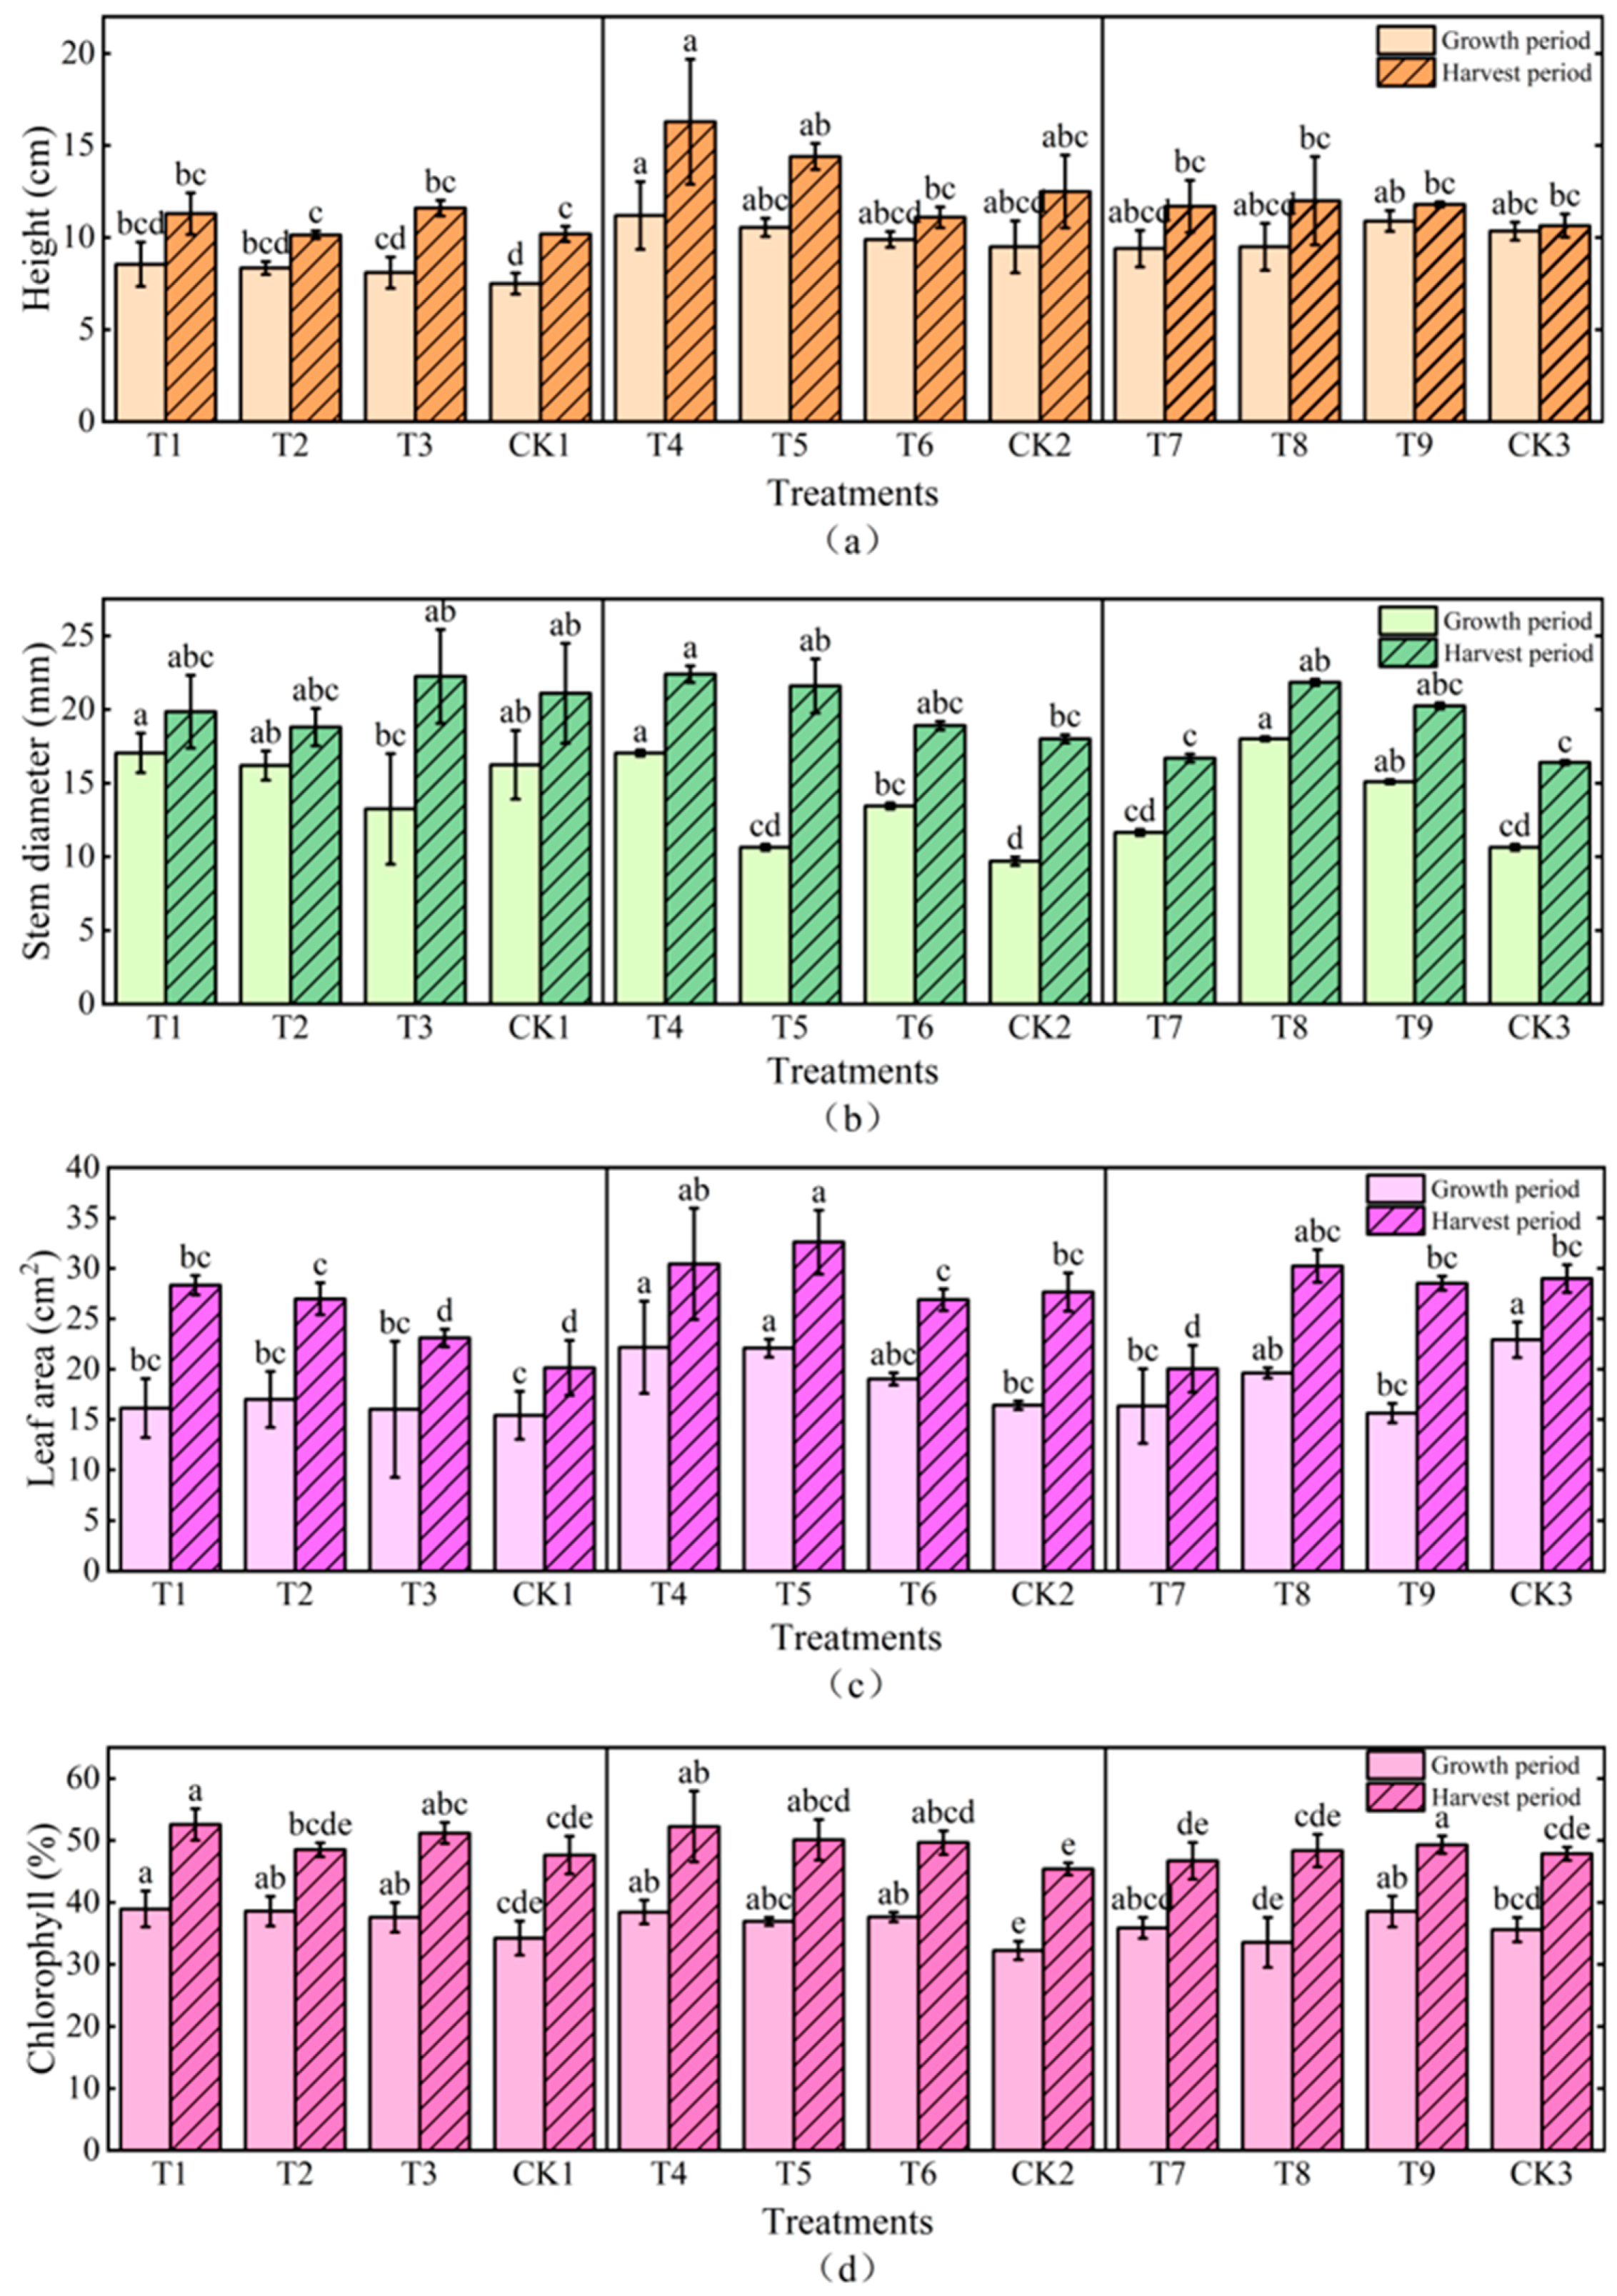
Analysis of Plant Growth Indexes of Different Treatments

From Figure 6a, it can be observed that the differences in plant height during the growth period are relatively small, with T4 being higher and showing significant differences (p < 0.05) compared to T1, T2, T3 and CK1. During the harvest period, the plant height of T4 and T5 was significantly greater than that of the other groups, showing an increase of 30.4% and 15.2% compared to CK2. However, there were no significant differences among the three groups (p < 0.05). In Figure 6b, the growth in stem thickness is in the order of T4 > T8 > T1, but the difference among the three was not significant. During the harvest period, T4 had significantly higher values compared to the other groups (p < 0.05). T3, T8, T5 and CK1 followed closely, while T7 and CK3 had significantly lower values. No significant differences were observed between the groups. Although the leaf area of each treatment group did not differ significantly during the growing period, the optimal groups of leaf area were T5 > T4 > T8 > CK3 at the time of harvest. These groups were significantly different (p < 0.05) from the T3, T7 and CK1 groups, as shown in Figure 6c. Compared with the growth period, the chlorophyll content during the harvesting period has significantly increased, with varying degrees of improvement. This indicates that over time, the chlorophyll content of different treatment groups also increases, with T4 and T5 displaying higher contents, but there is no significant difference between the treatments.

3.4. Strawberry Yield and Fruit Quality

3.4.1. Strawberry Yield

The findings demonstrate an improvement in the yield of strawberries when treated with different water-retaining substrates. The total yields of T8 and T9 were significantly higher than other treatments (p < 0.05), with increases of 20.13% and 22.23% over the control group CK3, respectively (Table 6). The average fruit weight of strawberries in the T5 treatment was larger and significantly higher than in the other groups (p < 0.05), showing a 23.00% increase compared to CK2. Following were T4 and T6, which were on par with CK2, with no significant difference between the treatment groups. The maximum fruit weight in T4, T5, and T6 increased by 15.32%, 36.29% and 22.42%, respectively, compared with CK2. Except for the T1 and T9 treatments, the weight of the maximum fruits increased to varying degrees in all other groups compared to their control group. The yield per plant in T8 and T9 was significantly higher than in the control group, increasing by 20.14% and 22.24%, respectively. Following them were T7, T4, T6 and T5, with no significant difference between these treatments.

3.4.2. Strawberry Quality

According to Table 7, the soluble solid content of T1-T3 increased by 35.43%, 29.14% and 2.86%, respectively, compared to CK1. Meanwhile, T4~T6 witnessed increases of 15.35%, 18.86% and 4.39%, respectively, compared to CK2. However, T7 and T8 showed relatively modest increases of 8.71% and 7.47% compared to CK3. The content of soluble and reducing sugars was the highest in T6, followed only by T3, CK1, and T2. In T6, both soluble sugar and reducing sugar increased by 63.83% and 63.48%, respectively, compared to the control group, and were significantly higher than other groups (p < 0.05). The titratable acid was highest in T2 and lowest in T1; T2 was significantly different from the rest of the treatment groups. The vitamin C content was highest in T2, followed by T4 and T1, showing increases of 16.14%, 33.54% and 2.07%, respectively, compared to the control group. In addition, T6 has the lowest vitamin C content among all treatment groups. T5 has the highest solid–acid ratio, and T2 has the lowest, with a significant difference (p < 0.05). T4 had a slightly lower solid–acid ratio than T5, but there was no immense difference.

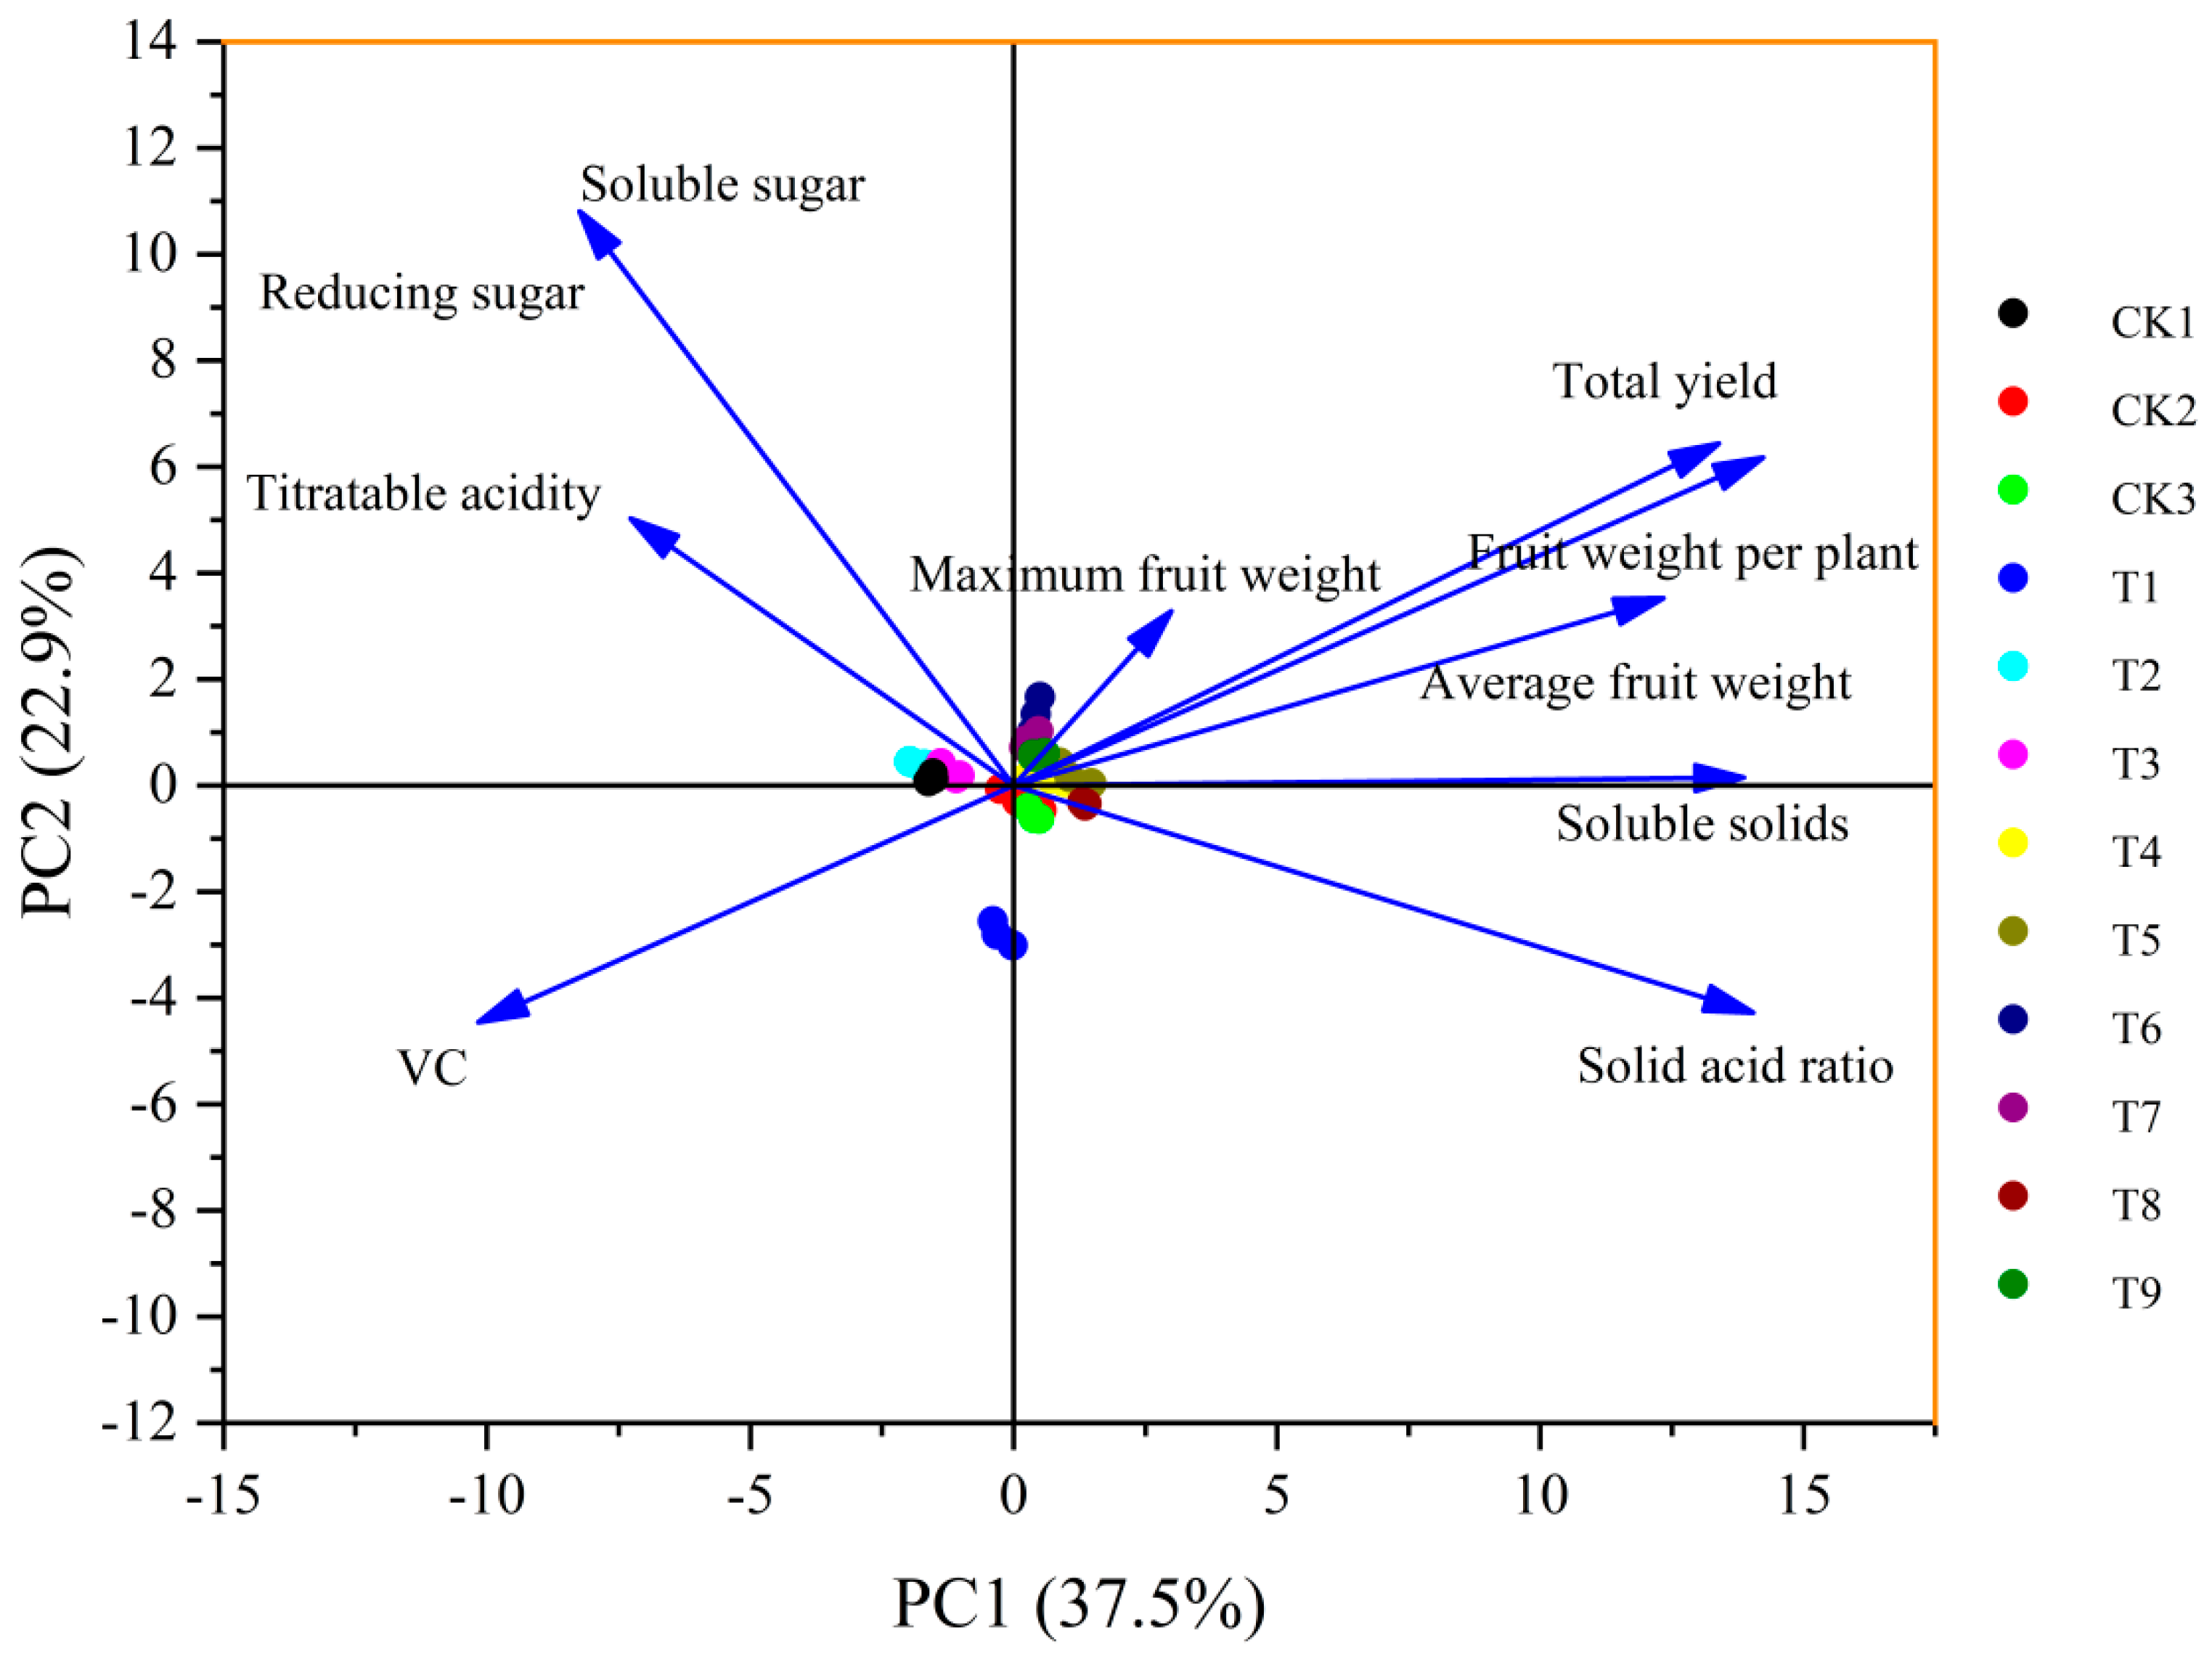
3.4.3. Strawberry Principal Component Analysis

Principal Component Analysis (PCA)

To account for the possible impact caused by different dimensions, the raw data were standardized before undergoing principal component analysis [28]. According to the principle of eigenvalues greater than 1, four strawberry principal components were extracted from the yield and quality indicators. These indicators include average fruit weight, maximum fruit weight, single plant yield, total yield, soluble solids, soluble sugar, titratable acid, vitamin C, reducing sugar, and solid–acid ratio. These four principal components collectively explained 89.136% of the total variance. The detailed contribution rates of the principal components are shown in Table 8.
The loadings matrix of the principal components are shown in Table 9. The principal component load matrix reflects the relative magnitude and direction of action of each trait indicator on the principal component load. This matrix reveals the extent to which each indicator affects the principal component and is determined based on the 0.5 principle [29,30]. By the factor rotation matrix, principal component 1 was interpreted as the total yield, yield per plant and vitamin C; principal component 2 was interpreted as reducing sugar and soluble sugar; principal component 3 was interpreted as the maximum fruit weight, average fruit weight, soluble solids and solids–acid ratio; principal component 4 was interpreted as the solids-acid ratio and titratable acid. In particular, vitamin C displayed a negative correlation with principal component 1, while the solid–acid ratio was positively correlated with principal component 3 and negatively correlated with principal component 4. The PCA of strawberry yield and quality is shown in Figure 7.

Comprehensive Evaluation of Strawberries Based on Principal Component Analysis

To depict the relationship between each principal component and its related quality indicators more intuitively, a linear relationship equation for comprehensive evaluation is formulated using indicators with a higher correlation. In this equation, y1, y2, y3 and y4 represent the score values of the four principal components. A higher Y value corresponds to a better growth status of the strawberry.
y 1 = 0.402 X 1 + 0.398 X 2 + 0.398 X 3 + 0.376 X 4 + 0.349 X 5 0.284 X 6 0.243 X 7 0.234 X 8 + 0.083 X 9 0.229 X 10
y 2 = 0.218 X 1 + 0.329 0.017 X 3 + 0.345 X 4 + 0.172 X 5 0.255 X 6 + 0.526 X 7 + 0.526 X 8 + 0.146 X 9 + 0.239 X 10
y 3 = 0.260 X 1 0.230 X 2 + 0.149 X 3 0.297 X 4 + 0.374 X 5 + 0.320 X 6 + 0.183 X 7 + 0.183 X 8 + 0.662 X 9 0.148 X 10
y 4 = 0.178 X 1 + 0.059 X 2 + 0.435 X 3 + 0.042 X 4 + 0.119 X 5 + 0.343 X 6 0.176 X 7 0.176 X 8 + 0.046 X 9 + 0.760 X 10
The inner product was calculated by taking the weighted average of the score value and variance contribution rate, delivering the function expression Y = 0.420y1 + 0.256y2 + 0.205y3 + 0.118y4. Based on various calculation results, comprehensive score values and rankings were determined, as shown in Table 10. The results showed that the T4 treatment ranked first in terms of comprehensive scores, and the growth status of strawberries was better.

4. Discussion

4.1. Sicochemical Properties and Water Retention of Different Substrates

The physicochemical properties of the substrate not only influence water and nutrient transport but also impact plant growth and development. The size of the bulk density and porosity play a crucial role in determining the aeration and water absorption properties of the substrate. An optimal range is observed with the bulk density ranging from 0.1~0.8 g/cm3 and a total porosity between 70% and 90% [31]. An increase in total porosity within a certain range is favorable for plant root growth, even though it may decrease the water retention capacity [32]. The results of the study showed a reduction in T4’s and T5’s bulk weight and an increase in water-holding porosity for the coconut bran and biochar treatments. Compared with other groups, the T4–T6 treatment boasted a higher water absorption ratio and a lower water infiltration rate. In particular, T4 had a significantly lower evaporation rate than the other groups, resulting in a higher water content and improved water retention characteristics. The water retention capacity of the three different water retention materials followed the order of coconut bran-mixed substrate (T1, T4, T7) > biochar-mixed substrate (T2, T5, T8) > humic acid-mixed substrate (T3, T6, T9). Moreover, the T4 treatment with coconut bran showed significant differences in the total nitrogen, organic matter and exchangeable magnesium contents compared to other treatments. The content of available potassium, available phosphorus and exchangeable calcium was also higher, leading to an overall increase in nutrient value and providing more nutrients for strawberry growth. Research has shown that increasing the organic matter content by means of composting also increases the water retention of the substrate [33]. Applying coconut bran and biochar to organic fertilizers can improve the soil’s physicochemical properties and stimulate crop root growth and development [34,35,36]. Incorporating vermicompost and coconut bran increased the organic matter, alkaline dissolved nitrogen, quick-acting potassium and effective phosphorus contents of the substrate, which is similar to the findings by Bellitürk K et al. [37]. The pore structure of coconut bran itself contributes to its better water retention and strong buffering activity, which can increase the soil’s moisture content and improve the soil’s water and fertilizer retention capacities [38,39,40,41]. It formed a composite substrate mixed with vermicompost, which improved these effects [42,43]. The nutrient content of the T1 and T7 treatments, which were also treated with vermicompost and coconut bran, was significantly lower than that of T4, indicating that different ratios of vermicompost and coconut bran also had a significant effect on the physicochemical properties of the compounded substrate.

4.2. Nitrogen and Phosphorus Utilization and Plant Nitrogen and Phosphorus Uptake of Different Substrates

The utilization rates of nitrogen and phosphorus stand as important indicators that are related to fertilization standards, agricultural product safety and environmental protection [44,45]. Research has indicated that under acidic conditions, fertilization can achieve a more stable and higher crop yield with higher nitrogen utilization efficiency [46]. In contrast, phosphorus was easily fixed and difficult to be absorbed and utilized by crops [47]. It is reported that coconut bran and biochar contain a high content of basic cations, and the large surface area and negatively charged surface enhance the electrostatic adsorption and retention capacity of Ca2+ and other cations so that nutrients can be slowly released for plant use [48]. As such, a higher total nitrogen content in the substrate leads to better nitrogen utilization efficiency. Adding coconut bran and biochar can effectively increase the nitrogen content of the substrate, bolster the bioavailability of soil nitrogen and increase the nitrogen absorption of strawberries. Moreover, it has been shown that the hydrophobic surface of biochar can absorb organic molecules involved in the khelasi process, such as Al3+, Fe3+ and Ca2+, removing the khelasi effects and thus increasing the uptake of phosphorus in the soil [49]. The study’s findings showed that the T7 treatment had a higher substrate phosphorus content but lower plant uptake of phosphorus, while the T5 treatment represented the opposite trend. Nevertheless, the substrate utilization efficiency and plant absorption of T4 nitrogen elements were both optimal. This can be interpreted as a lower nitrogen loss in comparison to the other groups. In general, when the nutrient supply is insufficient or moderate, the nutrient utilization rate of plants tends to be relatively high, but it decreases when nutrient levels become excessive.

4.3. Matrix Enzyme Activity under Different Treatments

Soil enzyme activity is an important driving force in nutrient cycling in the soil ecosystem and stands as a crucial indicator for assessing soil fertility [50]. Urease serves as an indicator of soil nitrogen availability, while catalase reflects the intensity of soil humification and sucrase presents the maturity and fertility level of soil [51]. Biochar and vermicompost can effectively improve the physicochemical properties of the substrate and increase biodiversity, which in turn increases enzyme activity. Previous studies reported that the combination of vermicompost and biochar could stimulate soil enzyme activity through the existing massive quantity of microorganisms in soil [52,53]. In this research, the T4 treatment could effectively improve the substrate enzyme activity; that is, when the ratio of vermicompost to coconut bran was set at 0.5:0.1, the urease and catalase activities witnessed a notable increase. When the ratio was adjusted to vermicompost:coconut bran = 1:0.05, the sucrase activity enhancement became more prominent. The addition of different proportions of vermicompost, coconut bran, biochar or humic acid exerts a certain impact on the improvement of matrix enzyme activity. This phenomenon might arise from the fact that the addition of water-retaining materials increases the number of microorganisms in the matrix. At the same time, vermicompost boasts favorable physical and chemical properties that facilitate microbial reproduction [54,55] and then improve enzyme activity. Different proportions of coconut bran also had different effects on the activities of matrix enzymes. When the proportion of coconut bran was moderate (0.1), it delivered the most significant increases in urease and catalase activities. When the proportion of coconut bran was reduced to 0.05, the improvement of invertase was better. On the contrary, when the proportion of coconut bran was increased to 0.15, the improvement effect of the activities of the three enzymes decreased significantly. Based on the experimental results of Deng et al. [56], it is equally evident that the addition of coconut bran to water spinach plantations was effective in increasing the catalase activity, and when the volume ratio of coconut bran was increased, the enzyme activity was rather reduced. A study showed that vermicompost with the addition of herbaceous residues significantly increased substrate urease, catalase and sucrase [57], corroborating similar findings in the study conducted by Xue et al. [58].

4.4. Effect of Different Substrates on Plant Growth

This study showed that different water retention substrates had significant differences in plant height, leaf area, stem thickness and chlorophyll during strawberry growth. To put it more specifically, strawberry plants in the T4 treatment (vermicompost:coconut bran = 0.5:0.1) delivered the best growth. Plant height, leaf area and stem thickness surpassed those of the other groups. Some plants even brought about vigorous growth, which affected the development of fruit expansion and had a certain impact on the ultimate yield of strawberries. Adding part of the coconut bran to the substrate can improve the plant height, leaf length, leaf width and fruit yield, which is consistent with the research results of Arancon et al. and He et al. [59,60]. Singh et al. [61] planted chrysanthemums by adding different nitrogen contents in the substrate and showed that the average plant height increased significantly at the highest nitrogen level compared with the control group, which was similar to the results of this experiment. When the ratio of vermicompost to coconut bran was adjusted to 1.5:0.15 (T7), the plant growth rate experienced a decline, and the growth indexes were lower than T4. This decline may be attributed to the fact that an excessively high proportion of coconut bran in the matrix may release an excessive quantity of secondary metabolites [62], thus affecting plant growth. Similarly, when the ratio of vermicompost to coconut bran was adjusted to 1:0.05, the nutrient supply in the substrate was insufficient, and the plant growth rate was also reduced, resulting in slow plant growth. At the same time, after increasing the proportion of vermicompost and coconut bran, the compactness and resistance of the matrix are changed accordingly. These properties, in turn, affect the cell division speed or cell length of the root meristem and then affect the growth speed of the root [63]. When the root is in the substrate with too much resistance, the elongation of the main root will be inhibited, resulting in an increase in lateral roots and the thickening and shortening of the root system [64,65], while too little resistance can lead to reduced yield [66,67]. Other studies have shown that seedlings grow and develop better in substrates with higher water retention [68] but perform poorly in substrates with lower water use efficiency [69]. Our study also showed that the T4 treatment had higher water use efficiency and better plant growth. Chlorophyll is the carrier of photosynthesis and an important indicator reflecting the photosynthetic capacity and growth stage of plant leaves [70,71]. The changes in leaf area affect the chlorophyll content, which subsequently influences the photosynthetic rate of strawberries. Proper and adequate photosynthesis can increase the production of organic matter in crops and improve fruit quality [72,73]. In this experiment, the effect of the substrate on leaf area was not significant, and therefore, the change in chlorophyll was not significant.

4.5. Effect of Different Substrates on Strawberry Yield and Fruit Quality

The substrate is the primary medium for providing the nutrients required for strawberry growth and development, which directly affects fruit yield and quality. The results showed that treatment T5 (vermicompost:biochar = 0.5:0.1) attains the highest average and large fruit weights, increasing by 22.98% and 36.22%, respectively, compared with the control group. What is more, this treatment increased the soluble solid content while decreasing the titratable acid content of the fruit to a certain extent. It was shown that the addition of an appropriate proportion of vermicompost and biochar was effective in increasing the average fruit yield as well as large fruit weight and improving the quality of the fruit. In addition, the yield per plant and total yield in the T8 (vermicompost:biochar = 1.5:0.15) and T9 (vermicompost:humic acid = 1.5:0.05) treatments delivered notable improvements. Given this, it suggested that the total yield of strawberries could be increased by appropriately increasing the proportion of vermicompost and biochar or humic acid. Meanwhile, it has been shown [74,75] that the application of vermicompost, alone or in combination with biochar, leads to increased crop yield parameters and overall yield. Yuan et al. [76] applied biochar with wood vinegar solution in a coastal area and showed that peanut yield and amino acid content were significantly increased. Investigations by Soumya A. [77] highlighted that a soilless medium composed of coconut bran and manure had an enhancing effect on the yield. The higher content of soluble and reducing sugars in strawberry fruits of the T3 (vermicompost:humic acid = 1:0.01) and T6 treatments (vermicompost:humic acid = 0.5:0.02) suggests that a reduction in the ratio of humic acid, as seen in T9, can impact the quality of strawberry fruits, which is similar to the results of the study by Ullah A. [78]. As for T4, treated with coconut bran, it could also boost the content of soluble solids and vitamin C, increasing them by 15.35% and 64.23%, respectively, compared with the control group. Tuckeldoe R. [79] planted tomatoes with a composite substrate of coconut bran and found that it exerted a significant effect on improving the vitamins, total phenols and total flavonoids of tomato fruit. These outcomes align with the experimental results of this study. There were also relevant experiments on the planting and application of green pepper, which show that the content of ascorbic acid, capsaicin and oil can be significantly increased by applying coconut bran organic fertilizer [80].

5. Conclusions

These results demonstrated that the incorporation of a certain proportion of coconut bran, biochar and vermicompost into the composite matrix could reduce the soil’s bulk density, improve the water-holding porosity and water absorption ratio, and reduce the water seepage rate to some extent. In particular, the T4 (vermicompost:coconut bran = 0.5:0.1) and T5 (vermicompost:biochar = 0.5:0.1) treatments exhibited the best outcomes. The difference resides in the fact that the T4 treatment can improve the activity of substrate enzymes and effectively increase the nutrient content. Consequently, it fosters plant growth and improves fruit yield and quality to a certain extent. In contrast, the impaction of the T5 treatment was more pronounced in enhancing average and large fruit weights, but the effect on the improvement in the total yield was less significant. Through principal component analysis, the T4 treatment scored higher when the ratio of vermicompost to coconut bran was 0.5:0.1. It indicated that it could effectively improve the water and fertilizer conservation of the substrate but also played a certain role in promoting the growth of strawberries.
To conclude, we can effectively improve the water retention performance of the substrate and thus improve strawberry growth by selecting and adjusting the ratio of materials in the substrate formulation. This provides guidance for farmers and horticultural practitioners to choose the appropriate substrate for strawberry cultivation, achieving better yields and quality. Our study offers valuable insights into water-saving and fertilizer-reducing practices in greenhouse strawberry cultivation. These findings not only conduce to the better application of agricultural waste reuse-derived products in agriculture but also contribute to alleviating environmental pollution, laying the foundation for sustainable development and a productive future in agriculture and the environment.

Author Contributions

Conceptualization, X.T., Y.L. (Yonghui Li) and Y.L. (Yucheng Li); Software, X.T.; Investigation, X.T., W.L. and Y.H.; Resources, W.L. and Y.L. (Yucheng Li); Data curation, X.T. and Y.H.; Writing—original draft, X.T.; Writing—review and editing, Y.L. (Yonghui Li), M.F. and Y.L. (Yucheng Li); Supervision, W.L. All authors have read and agreed to the published version of the manuscript.

Funding

This research was supported by the Agricultural Science and Technology Project of the Shanghai Science and Technology Innovation Action Plan (No. 21N51900300), the Changfeng County Digital Strawberry Construction Project in 2021 (No. AHSZNY-2021-06), and the Third-Party Service Project for Pilot Work of Agricultural Non-point Source Pollution Control in Feidong County in 2023 (No. K160139421).

Data Availability Statement

Dataset available on request from the authors.

Conflicts of Interest

The authors declare that they have no known competing financial interests or personal relationships that could have appeared to influence the work reported in this paper.

References

  1. Bai, S.; Zhu, R.; Yang, S.; Qin, L.; Huang, S. Nutrients Comparison and Screening of Different Strawberry Varieties. J. Shanxi Agric. Sci. 2020, 48, 64–67. [Google Scholar]
  2. Guthman, J.; Jiménez-Soto, E. Socioeconomic challenges of California strawberry production and disease resistant cultivars. Front. Sustain. Food Syst. 2021, 5, 764743. [Google Scholar] [CrossRef]
  3. Wang, M.; Xue, L.; Zhao, J.; Dai, H.; Lei, J. Status of World Strawberry Production and Trade. Chin. Fruit Tree 2021, 2, 104–108. [Google Scholar]
  4. Sui, Y.; Feng, Z.; Wang, C.; Song, K.; Zhang, J. Effects of water and fertilizer coupling on growth, yield and quality and water use efficiency of strawberry in greenhouse. J. Shandong Agric. Univ. (Nat. Sci.) 2011, 42, 369–375. [Google Scholar]
  5. Chojnacka, K.; Moustakas, K. Anaerobic digestate management for carbon neutrality and fertilizer use: A review of current practices and future opportunities. Biomass Bioenergy 2024, 180, 106991. [Google Scholar] [CrossRef]
  6. Yang, F.; Zhai, Y.; Zhang, X.; Qiao, J. Properties and application of vermicompost. ShangHai Veg. 2019, 2, 61–62. [Google Scholar]
  7. Truong, H.D.; Wang, C.H.; Trung Kien, T. Effects of continuously applied vermicompost on media properties, growth, yield, and fruit quality of two tomato varieties. Commun. Soil Sci. Plant Anal. 2017, 48, 370–382. [Google Scholar] [CrossRef]
  8. Zhang, Y.; Sun, C. Effects experiment of different compound wormcast organic fertilizer combination. Tianjin Agric. Sci. 2006, 2, 12–14. [Google Scholar]
  9. Baghbani-Arani, A.; Modarres-Sanavy, S.A.M.; Poureisa, M. Improvement the soil physicochemical properties and fenugreek growth using zeolite and vermicompost under water deficit conditions. J. Soil Sci. Plant Nutr. 2021, 21, 1213–1228. [Google Scholar] [CrossRef]
  10. Santos, J.A.; Gonzaga, M.L.S.; dos Santos, W.M.; Silva, A.J.D. Waterretention and availability in tropical soils of different texturesamended with biochar. Catena 2022, 219, 106616. [Google Scholar] [CrossRef]
  11. Lu, J.; Luo, Y.; Huang, J.; Hou, B.; Wang, B.; Ogino, K.; Zhao, J.; Si, H. Evaluating the effects of biochar on the hydraulic properties of acidified soil in China. J. Soils Sediments 2023, 23, 223–231. [Google Scholar] [CrossRef]
  12. Zhang, J.; Xu, Y.; Liu, Z. Study of the alleviate of earthworm manure on continuous cropping obstacle of cucumber growth in plastic greenhouse. North Hortic. 2010, 4, 58–60. [Google Scholar]
  13. Ren, Z.; Zhang, P.; Qie, Y.; Wang, L. Fertilizer requirements of coir substrate for tomato soilless seedlings. Jiangsu Agric. Sci. 2015, 43, 207–209. [Google Scholar]
  14. Yang, Y.; He, Z.; Lin, J.; Li, Y.; Chen, F. Effects of coconut bran application rate on soil physicochemical properties and sweet-potato yield. Acta Agron. Sin. 2023, 49, 2517–2527. [Google Scholar]
  15. Rekaby, S.A.; AL-Huqail, A.A.; Gebreel, M.; Alotaibi, S.S.; Ghoneim, A. Compost andhumic acid mitigate the salinity stress on quinoa (Chenopodium quinoa Willd L.) and improve some sandy soilproperties. J. Soil Sci. Plant Nutr. 2023, 23, 2651–2661. [Google Scholar] [CrossRef]
  16. Li, Y.; Liu, Q.; Liang, B.; Du, Z.; Li, J. Effects of humic acid type functional fertilizer on soil physical and chemical properties and apple tree growth in acidified orchard. Shandong Agric. Sci. 2020, 52, 92–97. [Google Scholar] [CrossRef] [PubMed]
  17. Zhang, Z.; Hang, Z.; Shan, R. Discussion of Humic Acid on Soil Amelioration. Environ. Sustain. Dev. 2013, 38, 109–111. [Google Scholar]
  18. Hou, L.; Zhang, W. Study on the Infl uence of Humic Acid to the Water and Fertilizer Retention Capacity of the Mixed Sandy Soil. Humic Acid 2015, 2, 25–28. [Google Scholar]
  19. Bigelow, C.; Moeller, A.; Nemitz, J.R. Soil surfactants and humic acid application affects water retention, repellency and localized dry spot in a sand based rootzone. Appl. Turfgrass Sci. 2013, 10, 14. [Google Scholar] [CrossRef]
  20. Su, B.; Yan, Z.; Li, Y.; Tang, S.; Pan, X.; Zhang, X.; Li, W.; Li, Y. Co-Compost Application of Magnesium Salts and Orthophosphate Adjusted Biochar and Cyanobacteria for Fixing Nitrogen, Improving Maize Quality, and Reducing Field Nutrient Loss. Agronomy 2022, 12, 2406. [Google Scholar] [CrossRef]
  21. Si, X.; Tang, S.; Zhao, X.; Wang, S.; Li, Y. Development of cyanobacteria organic selenium rich fertilizer and its application in common cabbage planting. J. Jiangsu Agric. 2021, 37, 340–347. [Google Scholar]
  22. Tang, S.; Zhao, X.; Si, X.; Wang, S.; Li, S.; Zhang, X.; Li, Y. Control effect of different magnesium/phosphorus salt additives on nitrogen loss in cyanobacteria composting. J. Agric. Environ. Sci. 2021, 40, 428–435. [Google Scholar]
  23. Lozano, D.; Ruiz, N.; Gavilán, P. Consumptive water use and irrigation performance of strawberries. Agric. Water Manag. 2016, 169, 44–51. [Google Scholar] [CrossRef]
  24. Wang, J.; Cai, H.; Li, H.; Chen, X. Study and evaluation of the calculation methods of reference crop evapotranspiration in Solar-heated greenhouse. J. Irrig. Drain. 2006, 2, 11–14. [Google Scholar]
  25. Chen, X.; Chen, W.; Mi, L.; Gao, Z.; Li, J.; Zhang, Z.; Qu, S. On regressive estimation for leaf area of strawberry. Chin. Agric. Sci. Bull. 2009, 25, 190–193. [Google Scholar]
  26. Xia, G.; Luo, S.; Jie, J.; Yu, J. Analysis of the factors affecting EC and pH value of substrates. J. Gansu Agric. Univ. 2021, 56, 35–40. [Google Scholar]
  27. Tang, Y.; Shen, Y.; Feng, H.; Wu, H.; Mao, R.; Ai, W.; Wu, Z. Study on primary physicochemical characteristics and nutrient adsorption of four plant cultivation substrates. Life Sci. Space Res. 2023, 36, 78–85. [Google Scholar] [CrossRef]
  28. Yang, Y.; Yu, X.; Ou, Y.; Hu, H. Comprehensive evaluation of walnut nutritional quality under different planting modes using principal component analysis and membership function method. For. Sci. Technol. 2022, 2, 33–39. [Google Scholar]
  29. Venkata, T.R.; Ravi, B.K.; Subba, L.R.; Srinivas, T.; Anand, K.A. Principal component analysis of yield and quality traits in Zinc rich landraces of rice (Oryza sativa L.). Electron. J. Plant Breed. 2022, 13, 1162–1169. [Google Scholar]
  30. Shi, S.; Wang, E.; Li, C.; Zhou, H.; Cai, M.; Cao, C.; Jiang, Y. Comprehensive evaluation of 17 qualities of 84 types of rice based on principal component analysis. Foods 2021, 10, 2883. [Google Scholar] [CrossRef]
  31. Liu, Y.; Luo, J.; Su, T.; Fan, R.; Lu, X.; Yan, S.; Zhang, Z. Physico-chemical properties of a soilless substrate and growth of pepper influenced by exogenous humic acid. J. Jiangsu Agric. 2016, 32, 647–655. [Google Scholar]
  32. Hill, J.; Drake, J.; Sleep, B. Comparisons of extensive green roof media in Southern Ontario. Ecol. Eng. 2016, 94, 418–426. [Google Scholar] [CrossRef]
  33. Wei, X.; Li, G.; Lv, L. Water and nutrient preservation of agri-Forest residues used as nursery matrix. Sci. Silvae Sin. 2015, 51, 26–34. [Google Scholar]
  34. Wei, L.; Huang, L.; Li, X.; Wang, Z.; Chen, W.; Huang, Q.; Huang, Y.; Liu, Z. Biochar medium could significantly improve banana seedling growth. Ecol. Environ. Sci. 2022, 31, 732–739. [Google Scholar]
  35. Martins, T.C.; Machado, R.; Alves-Pereira, I.; Ferreira, R.; Gruda, N.S. Coir-Based Growing Media with Municipal Compost and Biochar and Their Impacts on Growth and Some Quality Parameters in Lettuce Seedlings. Horticulturae 2023, 9, 105. [Google Scholar] [CrossRef]
  36. De la Rosa, J.M.; Campos, P.; Diaz-Espejo, A. Soil Biochar Application: Assessment of the Effects on Soil Water Properties, Plant Physiological Status, and Yield of Super-Intensive Olive Groves under Controlled Irrigation Conditions. Agronomy 2022, 12, 2321. [Google Scholar] [CrossRef]
  37. Bellitürk, K.; Fang, L.; Görres, J.H. Effect of post-production vermicompost and thermophilic compost blending on nutrient availability. Waste Manag. 2023, 155, 146–152. [Google Scholar] [CrossRef]
  38. Yu, S.; Xiao, M.; Yang, Z.; Yu, S. Effects of different cultivation substrates on growth of Dalbergia odorifera seedlings. Hubei Agric. Sci. 2023, 62, 98–102. [Google Scholar]
  39. Wang, D.; Gabriel, M.Z.; Legard, D.; Sjulin, T. Characteristics of growing media mixes and application for open-field production of strawberry (Fragaria ananassa). Sci. Hortic. 2016, 198, 294–303. [Google Scholar] [CrossRef]
  40. Skrzypczak, D.; Izydorczyk, G.; Taf, R.; Moustakas, K.; Chojnacka, K. Cellulose-based fertilizers for sustainable agriculture: Effective methods for increasing crop yield and soil health. Ind. Crops Prod. 2023, 205, 117500. [Google Scholar] [CrossRef]
  41. Sun, C.; Feng, M.; Liu, L.; Chen, W.; Chen, H.; Zhang, M.; Li, X. Study on the main Physico-chemical Properties of Coir Culture Medium in Hainan. Chin. J. Trop. Crops 2011, 32, 407–411. [Google Scholar]
  42. Ahmad, A.; Aslam, Z.; Belltrk, K.; Hussain, S.; Bibi, I. Soil application of wheat straw vermicompost enhances morpho-physiological attributes and antioxidant defense in wheat under drought stress. Front. Environ. Sci. 2022, 10, 894517. [Google Scholar] [CrossRef]
  43. Abbey, L.; Young, C.; Teitel-Payne, R.; Howe, K. Evaluation of proportions of vermicompost and coir in a medium for container-grown Swiss chard. Int. J. Veg. Sci. 2012, 18, 109–120. [Google Scholar] [CrossRef]
  44. Wang, X.; Li, Z.; Ma, W.; Zhang, F. Effects of fertilization on yield increase of wheat in different agro-ecological regions of China. Sci. Agric. Sin. 2010, 43, 2469–2476. [Google Scholar]
  45. Du, C.; Wu, D.; Li, J.; Bai, J.; Dai, K.; Li, J.; He, Y.; Li, J. Nitrogen application rate affects soil nitrogen and phosphorus loss and tobacco nitrogen utilization in the Fuxian Lake basin. Chin. Agric. Sci. Bull. 2023, 39, 80–87. [Google Scholar]
  46. Duan, Y.; Xu, M.; Gao, S.; Yang, X.; Huang, S.; Liu, H.; Wang, B. Nitrogen use efficiency in a wheat–corn cropping system from 15 years of manure and fertilizer applications. Field Crops Res. 2014, 157, 47–56. [Google Scholar] [CrossRef]
  47. Phares, C.A.; Amoakwah, E.; Danquah, A.; Akaba, S.; Frimpong, K.A.; Mensah, T.A. Improved soil physicochemical, biological properties and net income following the application of inorganic NPK fertilizer and biochar for maize production. Acta Ecol. Sin. 2022, 42, 289–295. [Google Scholar] [CrossRef]
  48. Panjaitan, E.; Sidauruk, L.; Manalu, C.J.; Pratiwi, S.; Sianturi, P. Impacts of agricultural waste and NPK fertilizers on soil chemical properties, production and phosphorus uptake of sweet corn plants on ultisol soil. IOP Conf. Ser. Earth Environ. Sci. 2022, 1005, 012031. [Google Scholar] [CrossRef]
  49. Zhao, H.; Wei, C.; Hou, J.; Zhu, J.; Zhang, S.; Hu, J. Acidic materials on mobilization of phosphorus in calcareous soil and its impact on phosphorus uptake of drip-irrigated cotton. Siols 2015, 47, 847–852. [Google Scholar]
  50. Wu, Q.; Zhang, J.; Liu, X.; Chang, T.; Wang, Q.; Shaghaleh, H.; Hamoud, Y.A. Effects of biochar and vermicompost on microorganisms and enzymatic activities in greenhouse soil. Front. Environ. Sci. 2023, 10, 1060277. [Google Scholar] [CrossRef]
  51. Li, S.; Sun, X.; Liu, Y.; Li, S.; Zhou, W.; Ma, Q.; Zhang, J. Remediation of Cd-contaminated soils by GWC application, evaluated in terms of Cd immobilization, enzyme activities, and pakchoi cabbage uptake. Environ. Sci. Pollut. Res. 2020, 27, 9979–9986. [Google Scholar] [CrossRef]
  52. Huang, L.; Yu, G.; Zou, F.; Long, X.; Wu, Q. Shift of soil bacterial community and decrease of metals bioavailability after immobilization of a multi-metal contaminated acidic soil by inorganic-organic mixed amendments: A field study. Appl. Soil Ecol. 2018, 130, 104–119. [Google Scholar] [CrossRef]
  53. Tavali, I.E.; Ok, H. Comparison of Heat-Treated and Unheated Vermicompost on Biological Properties of Calcareous Soil and Aloe Vera Growth under Greenhouse Conditions in a Mediterranean Climate. Agronomy 2022, 12, 2649. [Google Scholar] [CrossRef]
  54. Gopinath, K.A.; Saha, S.; Mina, B.L.; Pande, H.; Kundu, S.; Gupta, H.S. Influence of organic amendments on growth, yield and quality of wheat and on soil properties during transition to organic production. Nutr. Cycl. Agroecosyst. 2008, 82, 51–60. [Google Scholar] [CrossRef]
  55. Mejía, P.A.; Ruíz-Zubiate, J.L.; Correa-Bustos, A.; LópezLópez, M.J.; SalasSanjuán, M.D.C. Effects of Vermicompost Substrates and Coconut Fibers Used against the Background of Various Biofertilizers on the Yields of Cucumis melo L. and Solanum lycopersicum L. Horticulturae 2022, 8, 445. [Google Scholar] [CrossRef]
  56. Deng, X.; Wu, C.; Li, Q. Effects of Coconut Chaff on the Physicochemical and Enzyme Activity in Coastal Soil. Eng. Adv. 2021, 1, 16–20. [Google Scholar] [CrossRef]
  57. Lv, M.; Li, J.; Zhang, W.; Zhou, B.; Dai, J.; Zhang, C. Microbial activity was greater insoils added with herb residue vermicompost than chemicalfertilizer. Soil Ecol. Lett. 2020, 2, 209–219. [Google Scholar] [CrossRef]
  58. Xue, J.; Bakker, M.R.; Milin, S.; Graham, D. Enhancement in soil fertility, early plant growth and nutrition and mycorrhizal colonization by vermicompost application varies with native and exotic tree species. J. Soils Sediments 2022, 22, 1662–1676. [Google Scholar] [CrossRef]
  59. Arancon, N.Q.; Edwards, C.A.; Bierman, P.; Welch, C.; Metzger, J.D. Influences of vermicomposts on field strawberries: 1. Effects on growth and yields. Bioresour. Technol. 2004, 93, 145–153. [Google Scholar] [CrossRef]
  60. He, L.; Ding, X.; Jin, H.; Zhang, H.; Cui, J.; Chu, J.; Li, R.; Zhou, Q.; Yu, J. Comparison of rockwool and coir for greenhouse cucumber production: Chemical element, plant growth, and fruit quality. Heliyon 2022, 8, e10930. [Google Scholar] [CrossRef]
  61. Singh, S.; Dubey, R.K.; Kukal, S.S. Nitrogen supplemented cocopeat-based organic wastes as potting media mixtures for the growth and flowering of Chrysanthemum. Commun. Soil Sci. Plant Anal. 2016, 47, 1856–1865. [Google Scholar] [CrossRef]
  62. Khandaker, M.M.; Rahmat, S.; ALIAS, N.; Mohd, K.S.; Mat, N. The Effects of Different Growing Media on Growth, Flowering and Quality of Petunia grandiflora. J. Agric. Sci. 2019, 25, 373–383. [Google Scholar] [CrossRef]
  63. He, Q.; Peng, Y.; Cao, Y.; Jiang, Y.; Lu, G. Experiment on substrates for container seedling of Dalbergia odorifera. China For. Sci. Technol. 2012, 26, 92–95. [Google Scholar]
  64. Lei, G.; Zeng, W.; Nguyen, T.H.; Zeng, J.; Chen, H.; Kumar, S.A.; Gaiser, T.; Wu, J.; Huang, J. Relating soil-root hydraulic resistance variation to stomatal regulation in soil-plant water transport modeling. J. Hydrol. 2023, 617, 128879. [Google Scholar] [CrossRef]
  65. Zhang, H.; Wang, H.; Li, C.; Dong, Y.; Zhang, Y. Effect of exogenous pressure on growth and physiological characteristics of sweetpotato. J. Jiangsu Norm. Univ. (Nat. Sci. Ed.) 2018, 36, 36–43. [Google Scholar]
  66. Yang, X.; Li, C. Impacts of mechanical compaction on soil properties, growth of crops, soil-borne organisms and environment. Sci. Agric. Sin. 2008, 41, 2008–2015. [Google Scholar]
  67. Wheeldon, C.D.; Walker, C.H.; Josse, M.; Bennett, T. Wheat plants sense substrate volume and root density to proactively modulate shoot growth. Plant Cell Environ. 2021, 44, 1202–1214. [Google Scholar] [CrossRef] [PubMed]
  68. Costa, C.A.; Ramos, S.J.; Sampaio, R.A.; Guilherme, D.O.; Fernandes, L.A. Fibra de coco e resíduo de algodão para substrato de mudas de tomateiro. Hortic. Bras. 2007, 25, 387–391. [Google Scholar] [CrossRef]
  69. Freitas, G.A.; Silva, R.R.; Barros, H.B.; Vaz-de-Melo, A.; Abrahão, W.A.P. Produção de mudas de alface em função de diferentes combinações de substratos. Rev. Ciência Agronômica 2013, 44, 159–166. [Google Scholar] [CrossRef]
  70. Yang, L.; Zhong, N. The relationship between root system growth and soil physical property. J. Agric. Mech. Res. 2007, 8, 22–24, 34. [Google Scholar]
  71. Lu, W.; Qin, C.; Lu, Z.; Wang, X.; Wei, J. Effects of different matrix ratio on growth physiology and photosynthetic characteristics of ‘Orah’ seedlings. Chin. Fruit Tree 2023, 3, 79–84. [Google Scholar]
  72. Chen, K.; Zhang, W.; Li, L.; Su, Y.; Ou, Q. Effect of irrigation volume and biochar application on leaf chlorophyll content of greenhouse tomato plants. Agric. Mach. Agron. 2017, 52, 64–66. [Google Scholar]
  73. Luo, H.; He, L.; Du, B.; Wang, Z.; Zheng, A.; Lai, R.; Tang, X. Foliar application of selenium (Se) at heading stage induces regulation of photosynthesis, yield formation, and quality characteristics in fragrant rice. Photosynthetica 2019, 57, 1007–1014. [Google Scholar] [CrossRef]
  74. Angela, L.; Daniela, R.; Ludovica, L.; Maria, P.; Luigi, M.; Anna, R.R. Enhancement of Yield, Phytochemical Content and Biological Activity of a Leafy Vegetable (Beta vulgaris L. var. cycla) by Using Organic Amendments as an Alternative to Chemical Fertilizer. Plants 2023, 12, 569. [Google Scholar]
  75. Wang, X.; Zhao, F.; Zhang, G.; Zhang, Y.; Yang, L. Vermicompost improves tomato yield and quality and the biochemical properties of soils with different tomato planting history in a greenhouse study. Front. Plant Sci. 2017, 8, 1978. [Google Scholar] [CrossRef] [PubMed]
  76. Yuan, Y.; Kong, Q.; Zheng, Y.; Zheng, H.; Liu, Y.; Cheng, Y.; Zhang, X.; Li, Z.; You, X.; Li, Y. Co-application of biochar and pyroligneous acid improved peanut production and nutritional quality in a coastal soil. Environ. Technol. Innov. 2022, 28, 102886. [Google Scholar] [CrossRef]
  77. Soumya, A.; Usha, C. Impact of different growth media, nutrient sources and nutrient levels on yield and quality of tomato. Trends Biosci. 2015, 8, 3953–3958. [Google Scholar]
  78. Ullah, A.; Ali, M.; Shahzad, K.; Ahmad, F.; Lqbal, S.; Rahman, M.H.U.; Ahmad, S.; Lqbai, M.M.; Danish, S.; Fahad, S. Impact of Seed Dressing and Soil Application of Potassiu on Cotton Plants Productivity and Fiber Quality. Plants 2020, 9, 1444. [Google Scholar] [CrossRef]
  79. Tuckeldoe, R.B.; Maluleke, M.K.; Adriaanse, P. The effect of coconut coir substrate on the yield and nutritional quality of sweet peppers (Capsicum annuum) varieties. Sci. Rep. 2023, 13, 2742. [Google Scholar] [CrossRef]
  80. Naveen, N.E.; Panneerselvam, S.; Anand, S.R.; Sathymorthi, K.; Meena, S. Effect of organic manures on the yield and quality of green chillies (Capsicum annuum L.). Res. Crops 2009, 10, 621–625. [Google Scholar]
Figure 1. Total porosity, aeration porosity and water−holding porosity of different substrates. All the measured data are shown as mean ± standard deviation (SD). Different small letters indicate significant differences between different treatments (p < 0.05).
Agronomy 14 00205 g001
Figure 2. Water absorption ratio, seepage rate and water content of different treatments. (a) water absorption ratio of treatments. (b) water seepage rate of treatments. (c) water content of treatments. All the measured data are shown as mean ± standard deviation (SD). Different small letters indicate significant differences among different treatments (p < 0.05).
Agronomy 14 00205 g002
Figure 3. Evaporation rate of different water−retaining substrates.
Agronomy 14 00205 g003
Figure 4. Effects of different water−retaining materials on matrix nutrients. All the measured data are shown as mean ± standard deviation (SD). Different small letters indicate significant differences among different treatments (p < 0.05).
Agronomy 14 00205 g004
Figure 5. Effect of different water−retaining materials on matrix enzyme activity. (a) urease activity in different treatments. (b) catalase activity in different treatments. (c) invertase activity in different treatments. Numbers followed by a different letter within a panel are significantly different at p < 0.05, according to LSD analysis.
Agronomy 14 00205 g005
Figure 6. Effect of water-retaining substrate on the growth of strawberries at different stages. (a) the plant height during growth and harvesting periods. (b) the stem thickness during growth and harvesting periods. (c) the leaf area during growth and harvesting periods. (d) chlorophyll content during growth and harvesting periods. Numbers followed by a different letter within a panel are significantly different at p < 0.05, according to LSD analysis.
Agronomy 14 00205 g006
Figure 7. PCA of strawberry yield and quality. Samples are shown by colorful solid circles.
Agronomy 14 00205 g007
Table 1. Treatments with different substrate (mass ratio) ratios.
TreatmentsWaste SubstrateOrganic FertilizerVermicompostCoconut BranBiocharHumic Acid
T121.110.05--
T221.11-0.05-
T321.11--0.01
CK121.11---
T421.10.50.1--
T521.10.5-0.1-
T621.10.5--0.02
CK221.10.5---
T721.11.50.15--
T821.11.5-0.15-
T921.11.5--0.05
CK321.11.5---
Notes: The organic fertilizer was composted from sheep manure and rapeseed cake. -: means not added.
Table 2. Bulk density and air–water ratio of different substrates.
TreatmentsBulk Density
(g/cm3)
Air-Water Ratio
T10.50 ± 0.01 a0.21 ± 0.01 e
T20.45 ± 0.01 bcd0.22 ± 0.00 g
T30.48 ± 0.01 abc0.24 ± 0.00 d
CK10.49 ± 0.01 ab0.23 ± 0.00 d
T40.41 ± 0.02 d0.18 ± 0.01 f
T50.41 ± 0.01 d0.19 ± 0.01 f
T60.43 ± 0.01 d0.27 ± 0.01 c
CK20.45 ± 0.01 abcd0.32 ± 0.01 b
T70.42 ± 0.05 d0.34 ± 0.01 a
T80.44 ± 0.01 cd0.28 ± 0.00 c
T90.48 ± 0.01 abc0.23 ± 0.00 d
CK30.50 ± 0.02 a0.35 ± 0.01 a
Notes: All the measured data are shown as mean ± standard deviation (SD). N = 3. Different small letters after data in the same column indicate significant difference between treatments (p < 0.05).
Table 3. Chemical properties of different treatments.
TreatmentspHEC (mS/cm)Total Nutrients (%)
T16.41 ± 0.22 bcd1.05 ± 0.06 cd1.65
T26.60 ± 0.02 ab1.19 ± 0.09 abcd1.90
T36.71 ± 0.22 a1.10 ± 0.05 cd1.88
CK16.25 ± 0.09 cd1.03 ± 0.13 cd1.66
T46.52 ± 0.02 abc1.05 ± 0.09 cd2.66
T56.60 ± 0.24 ab1.48 ± 0.12 a2.48
T66.35 ± 0.03 bcd1.30 ± 0.11 abc2.41
CK26.27 ± 0.04 cd1.14 ± 0.06 bcd2.34
T76.73 ± 0.17 a1.13 ± 0.12 bcd2.24
T86.67 ± 0.04 a0.92 ± 0.12 d1.81
T96.57 ± 0.11 ab1.44 ± 0.07 ab1.86
CK36.25 ± 0.06 d1.25 ± 0.05 abcd1.80
Notes: All the measured data are shown as mean ± standard deviation (SD). N = 3. Different small letters indicate significant differences among different treatments (p < 0.05).
Table 4. Nitrogen and phosphorus utilization of substrates.
TreatmentsNUE (%)PUE (%)
T149.47 ± 0.62 ab54.79 ± 0.25 g
T246.80 ± 0.59 cd58.15 ± 0.15 b
T348.14 ± 1.45 abcd56.16 ± 0.16 f
CK148.40 ± 2.57 abcd57.80 ± 0.79 bc
T450.20 ± 0.23 a57.71 ± 0.15 bc
T549.99 ± 0.18 a55.32 ± 0.14 g
T646.20 ± 0.39 de59.06 ± 0.12 a
CK247.45 ± 0.99 bcd57.43 ± 0.31 cd
T748.62 ± 1.29 abc50.33 ± 0.31 h
T844.22 ± 1.85 e56.85 ± 0.13 de
T946.63 ± 0.57 cd55.33 ± 0.30 g
CK349.39 ± 0.14 ab56.23 ± 0.23 ef
Notes: NUE means nitrogen-use efficiency, and PUE means phosphorus-use efficiency. All the measured data are shown as mean ± standard deviation (SD). N = 3. Different small letters indicate significant differences among different treatments (p < 0.05).
Table 5. Nitrogen and phosphorus uptake by plants.
TreatmentsTN (mg/g)TP (mg/g)
T14.02 ± 0.04 e8.54 ± 0.04 g
T23.79 ± 0.02 f6.90 ± 0.04 i
T34.25 ± 0.06 d7.87 ± 0.01 h
CK12.72 ± 0.06 k4.29 ± 0.02 k
T45.19 ± 0.02 a9.06 ± 0.03 d
T54.93 ± 0.03 b10.72 ± 0.09 a
T64.50 ± 0.02 c6.74 ± 0.04 j
CK22.87 ± 0.07 j8.64 ± 0.04 f
T73.10 ± 0.03 i6.97 ± 0.04 i
T83.40 ± 0.05 h9.63 ± 0.02 c
T93.62 ± 0.02 g10.08 ± 0.02 b
CK31.46 ± 0.06 l8.84 ± 0.05 e
Notes: All the measured data are shown as mean ± standard deviation (SD). N = 3. Different small letters indicate significant differences among different treatments (p < 0.05).
Table 6. Effects of different substrates on strawberry yield.
TreatmentsAverage Fruit WeightMaximum Fruit WeightYield per PlantTotal Yield
kg/hm2
g
T17.07 ± 0.03 de17.10 ± 0.13 d110.14 ± 1.15 f3194.28 ± 38.49 h
T26.22 ± 0.03 e20.25 ± 0.30 c125.85 ± 3.86 e3651.14 ± 27.35 g
T36.50 ± 0.03 e19.90 ± 0.16 c133.21 ± 7.22 e3999.41 ± 17.22 f
CK17.63 ± 0.03 de17.12 ± 0.18 d132.57 ± 2.79 e3848.47 ± 10.14 f
T411.89 ± 1.59 bc23.04 ± 1.52 b192.82 ± 3.97 b5121.54 ± 49.63 c
T515.51 ± 1.00 a27.23 ± 0.91 a180.84 ± 2.57 c4885.55 ± 113.44 d
T611.49 ± 0.66 bc24.46 ± 1.32 b187.57 ± 2.79 bc5319.21 ± 79.00 b
CK212.61 ± 0.76 b19.98 ± 0.52 c159.50 ± 2.29 d4523.16 ± 64.82 e
T710.81 ± 0.55 c16.61 ± 0.68 d192.96 ± 6.83 b5472.16 ± 193.45 b
T810.78 ± 0.56 c18.92 ± 0.18 c215.92 ± 2.43 a6123.32 ± 68.88 a
T98.55 ± 1.02 d12.22 ± 0.66 e219.71 ± 3.93 a6230.56 ± 111.41 a
CK36.94 ± 0.58 e12.99 ± 1.04 e179.73 ± 4.32 c5097.33 ± 122.55 c
Notes: All the measured data are shown as mean ± standard deviation (SD). N = 3. Different small letters indicate significant differences among different treatments (p < 0.05).
Table 7. Effects of different substrates on strawberry fruit quality.
TreatmentsSoluble
Solids
Soluble SugarTitratable AcidReducing SugarVitamin C
mg/100 g
Solid–Acid Ratio
%
T111.85 ± 0.35 a2.35 ± 0.21 e0.52 ± 0.06 d1.18 ± 0.11 e19.22 ± 0.66 b22.96 ± 3.18 ab
T211.30 ± 0.85 ab7.10 ± 0.36 a0.91 ± 0.07 a3.55 ± 0.18 a21.87 ± 0.44 a12.50 ± 1.90 d
T39.00 ± 0.28 b7.33 ± 0.16 a0.57 ± 0.08 cd3.67 ± 0.08 a12.41 ± 1.47 cd16.05 ± 1.70 bcd
CK18.75 ± 0.92 b7.29 ± 0.10 a0.62 ± 0.05 cd3.64 ± 0.05 a18.83 ± 0.26 b14.22 ± 0.35 cd
T413.15 ± 1.48 a5.96 ± 0.08 b0.57 ± 0.03 cd2.98 ± 0.04 b19.97 ± 0.81 ab23.17 ± 3.75 ab
T513.55 ± 2.33 a5.68 ± 0.37 b0.55 ± 0.04 cd2.84 ± 0.18 b13.50 ± 0.57 c24.88 ± 6.16 a
T611.90 ± 0.99 a7.52 ± 0.85 a0.59 ± 0.01 cd3.76 ± 0.42 a8.43 ± 1.56 f20.16 ± 1.20 abc
CK211.40 ± 1.27 a4.59 ± 0.16 c0.67 ± 0.08 bc2.30 ± 0.08 c12.16 ± 1.36 cd17.35 ± 4.20 bcd
T713.10 ± 1.13 a6.26 ± 0.34 b0.75 ± 0.02 b3.13 ± 0.17 b11.02 ± 0.14 de17.57 ± 1.02 bcd
T812.95 ± 0.35 a3.26 ± 0.12 d0.64 ± 0.01 bcd1.63 ± 0.06 d9.86 ± 0.18 ef20.24 ± 0.11 abc
T911.50 ± 0.85 ab5.83 ± 0.12 b0.63 ± 0.03 bcd2.92 ± 0.06 b11.14 ± 0.42 de18.31 ± 2.17 abcd
CK312.05 ± 0.49 a4.73 ± 0.13 c0.58 ± 0.07 cd2.37 ± 0.06 c9.27 ± 0.06 ef20.85 ± 1.65 abc
Notes: The data in the table represents mean ± standard error, and different lowercase letters after the same column of data indicate significant differences between different treatments (p < 0.05).
Table 8. Eigenvalues, cumulative variance contribution and cumulative contribution of principal components.
Principal ComponentEigenvalueContribution Rate (%)Accumulated Contribution Rate (%)
13.74537.45237.452
22.28522.85560.307
31.82718.27478.581
41.05610.55589.136
Table 9. Loadings matrix for principal component analysis.
IndicatorsPrincipal Component 1Principal Component 2Principal Component 3Principal Component 4
Total Yield0.965−0.050.1570.057
Yield per plant0.934−0.070.2510.036
Vitamin C−0.821−0.0460.0990.276
Reducing Sugars0.0010.9630.0220.143
Soluble Sugar0.0010.9630.0220.144
Maximum Fruit Weight−0.2410.3250.835−0.13
Average fruit weight0.317−0.0110.825−0.118
Soluble solids0.359−0.4640.6870.129
Solid–Acid Ratio0.17−0.4590.572−0.553
Titratable acid−0.0560.173−0.0940.965
Table 10. Principal component comprehensive score.
Treatmentsy1y2y3y4YOrder
T1−0.56−0.885−1.605−0.175−0.8159
T2−1.931.5051.345−1.865−0.377
T3−1.915−0.655−0.015−0.685−1.05511
CK1−2.01−0.691.26−1.175−0.910
T41.280.650.671.2250.991
T51.950.5−0.561.150.9652
T60.5050.39−0.20.6650.354
CK20.52−0.405−0.345−0.815−0.0556
T70.3350.5850.36−0.1050.354
T82.03−0.05−0.7450.620.763
T90.2−0.3550.750.6250.225
CK3−0.395−0.59−0.9150.53−0.4458
Disclaimer/Publisher’s Note: The statements, opinions and data contained in all publications are solely those of the individual author(s) and contributor(s) and not of MDPI and/or the editor(s). MDPI and/or the editor(s) disclaim responsibility for any injury to people or property resulting from any ideas, methods, instructions or products referred to in the content.

