
Impacts of Liquid Fractions from Two Solid–Liquid Separation Technologies on the Soil Porosity, Ammonia, and Greenhouse Gas Emissions


Abstract
1. Introduction
2. Materials and Methods
2.1. Description of Soil and Liquid Manure
2.2. Experimental Design
2.2.1. Preparation of Soil Incubation
2.2.2. Application of Liquid Manure
2.3. Gas Sampling and Measurement
2.4. Measurement of Soil Properties
2.5. Calculation of Gas Emissions
2.6. Calculation of Gas and Water Conductivities
2.7. Statistical Analysis
3. Results
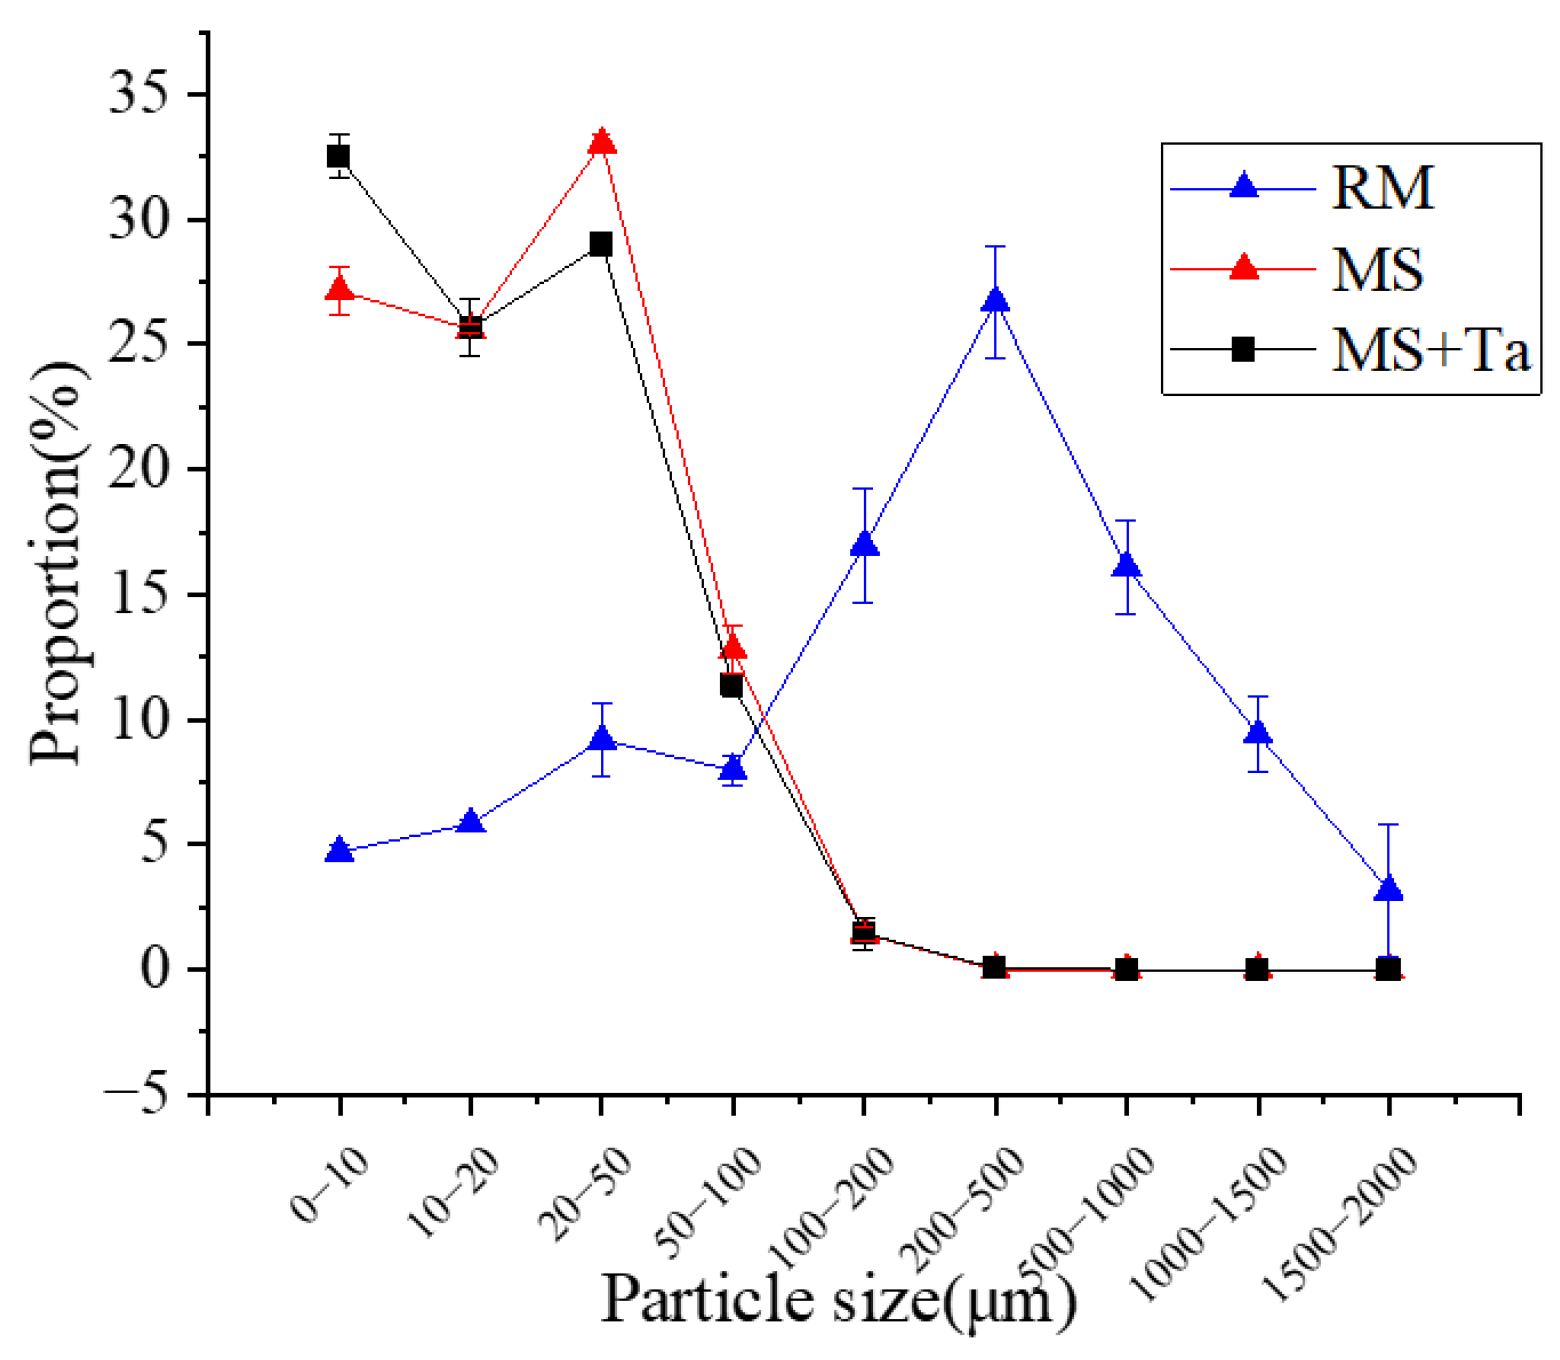
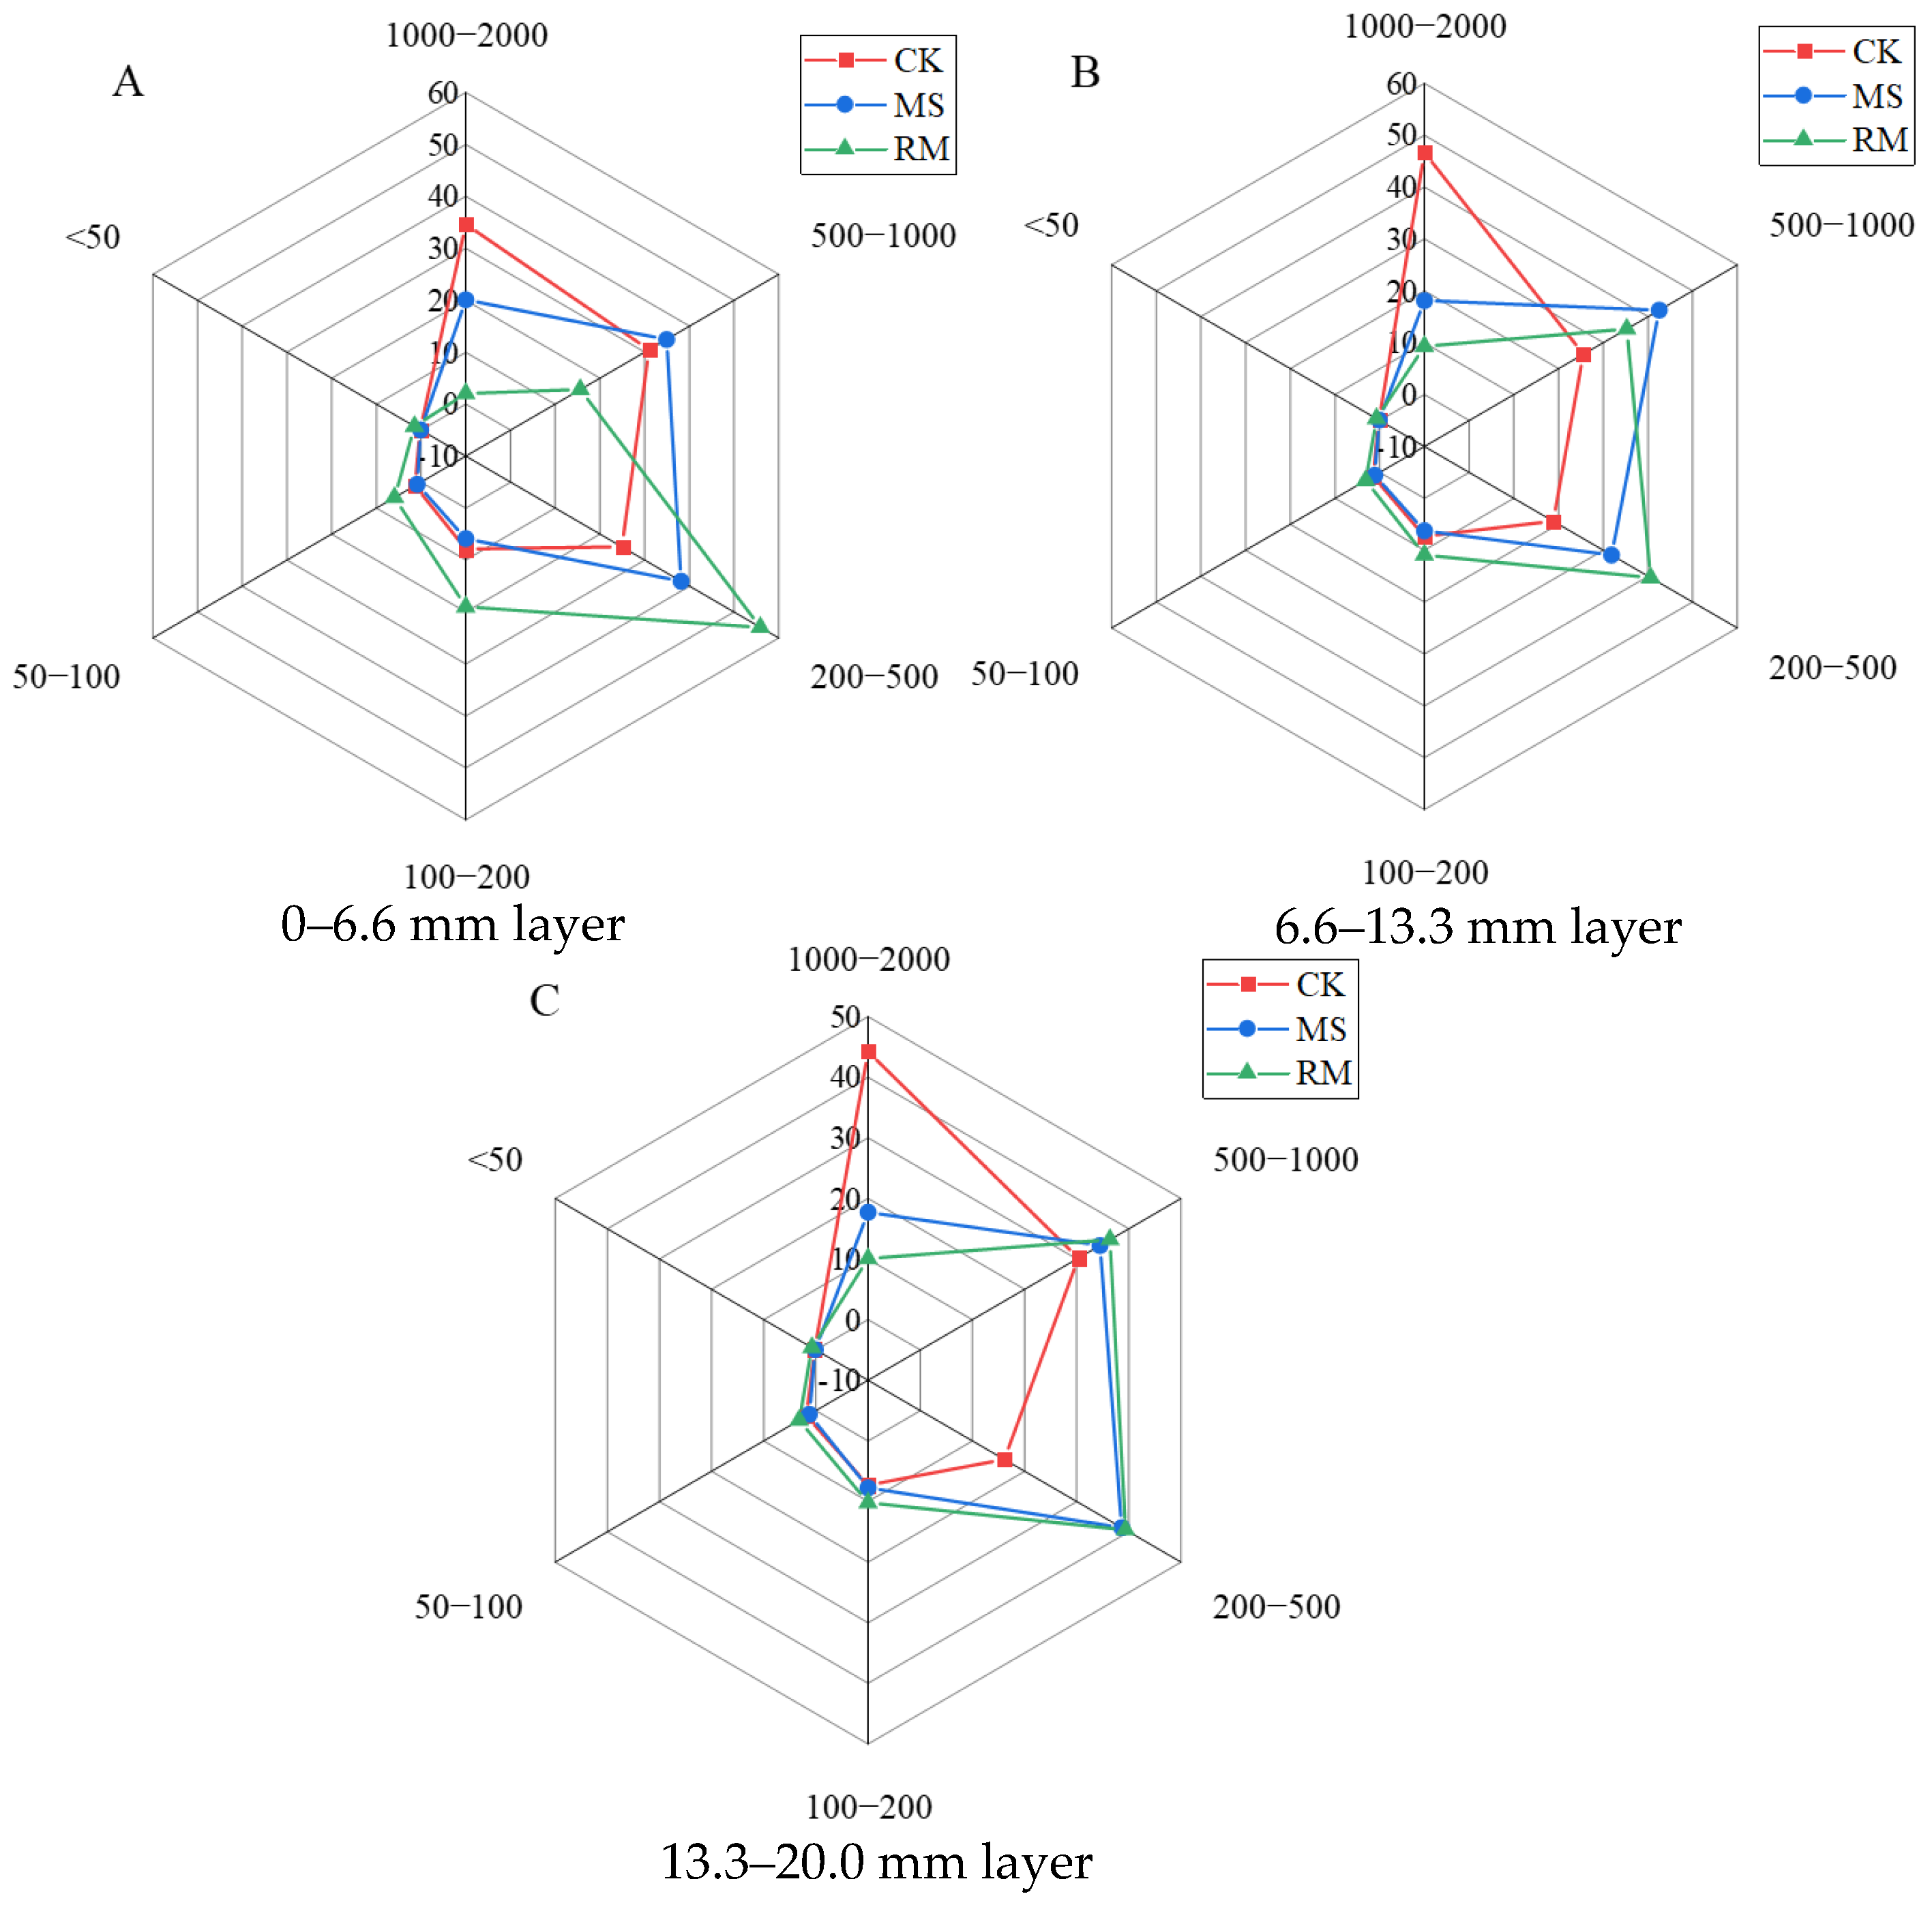
3.1. Effect of the Application of Liquid Manure on Physical Properties of Soil
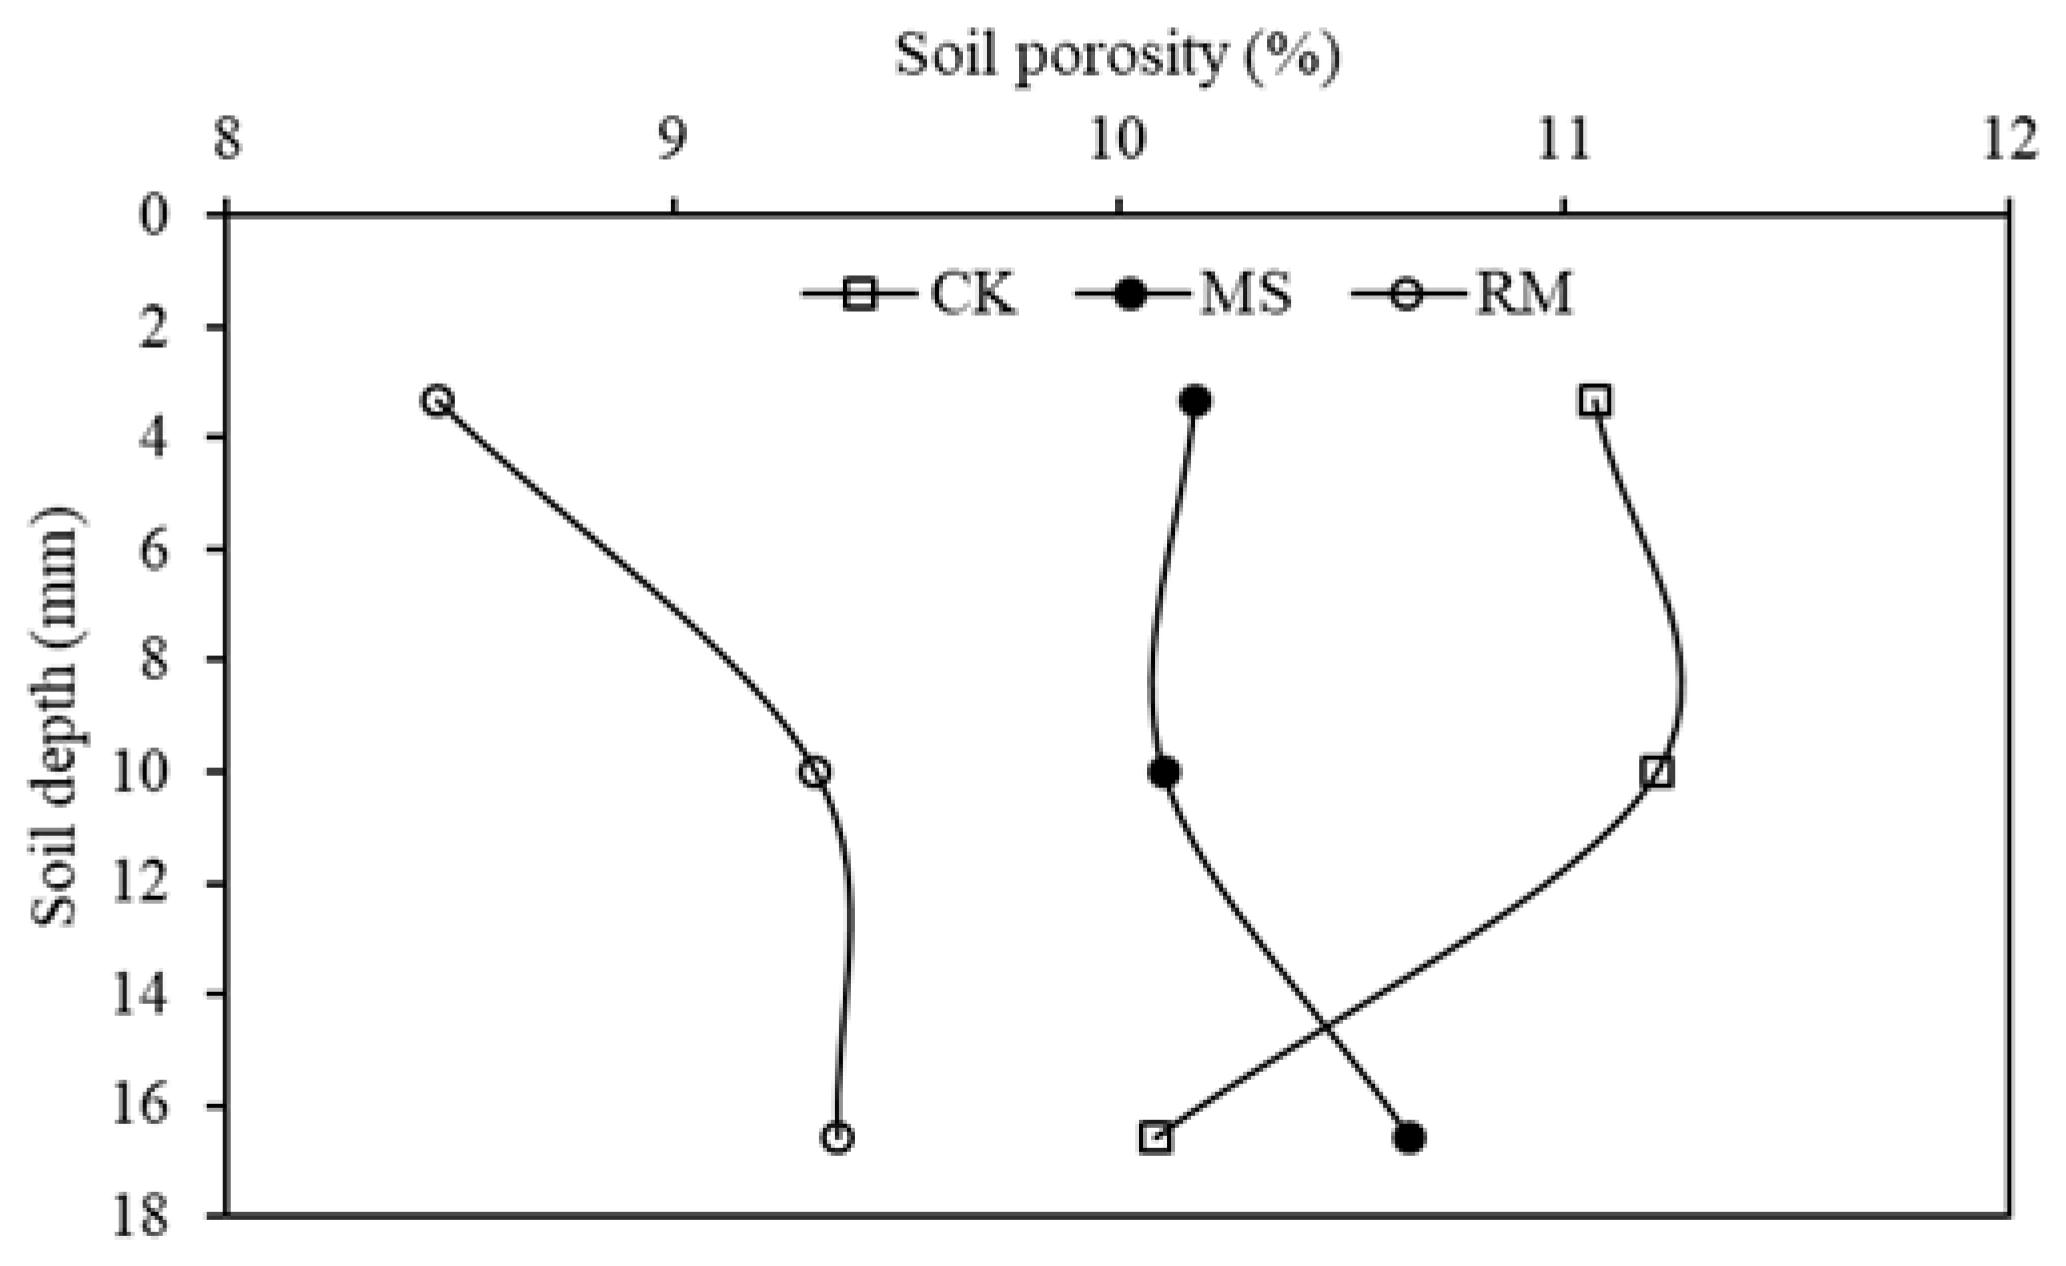
3.1.1. Soil Porosity
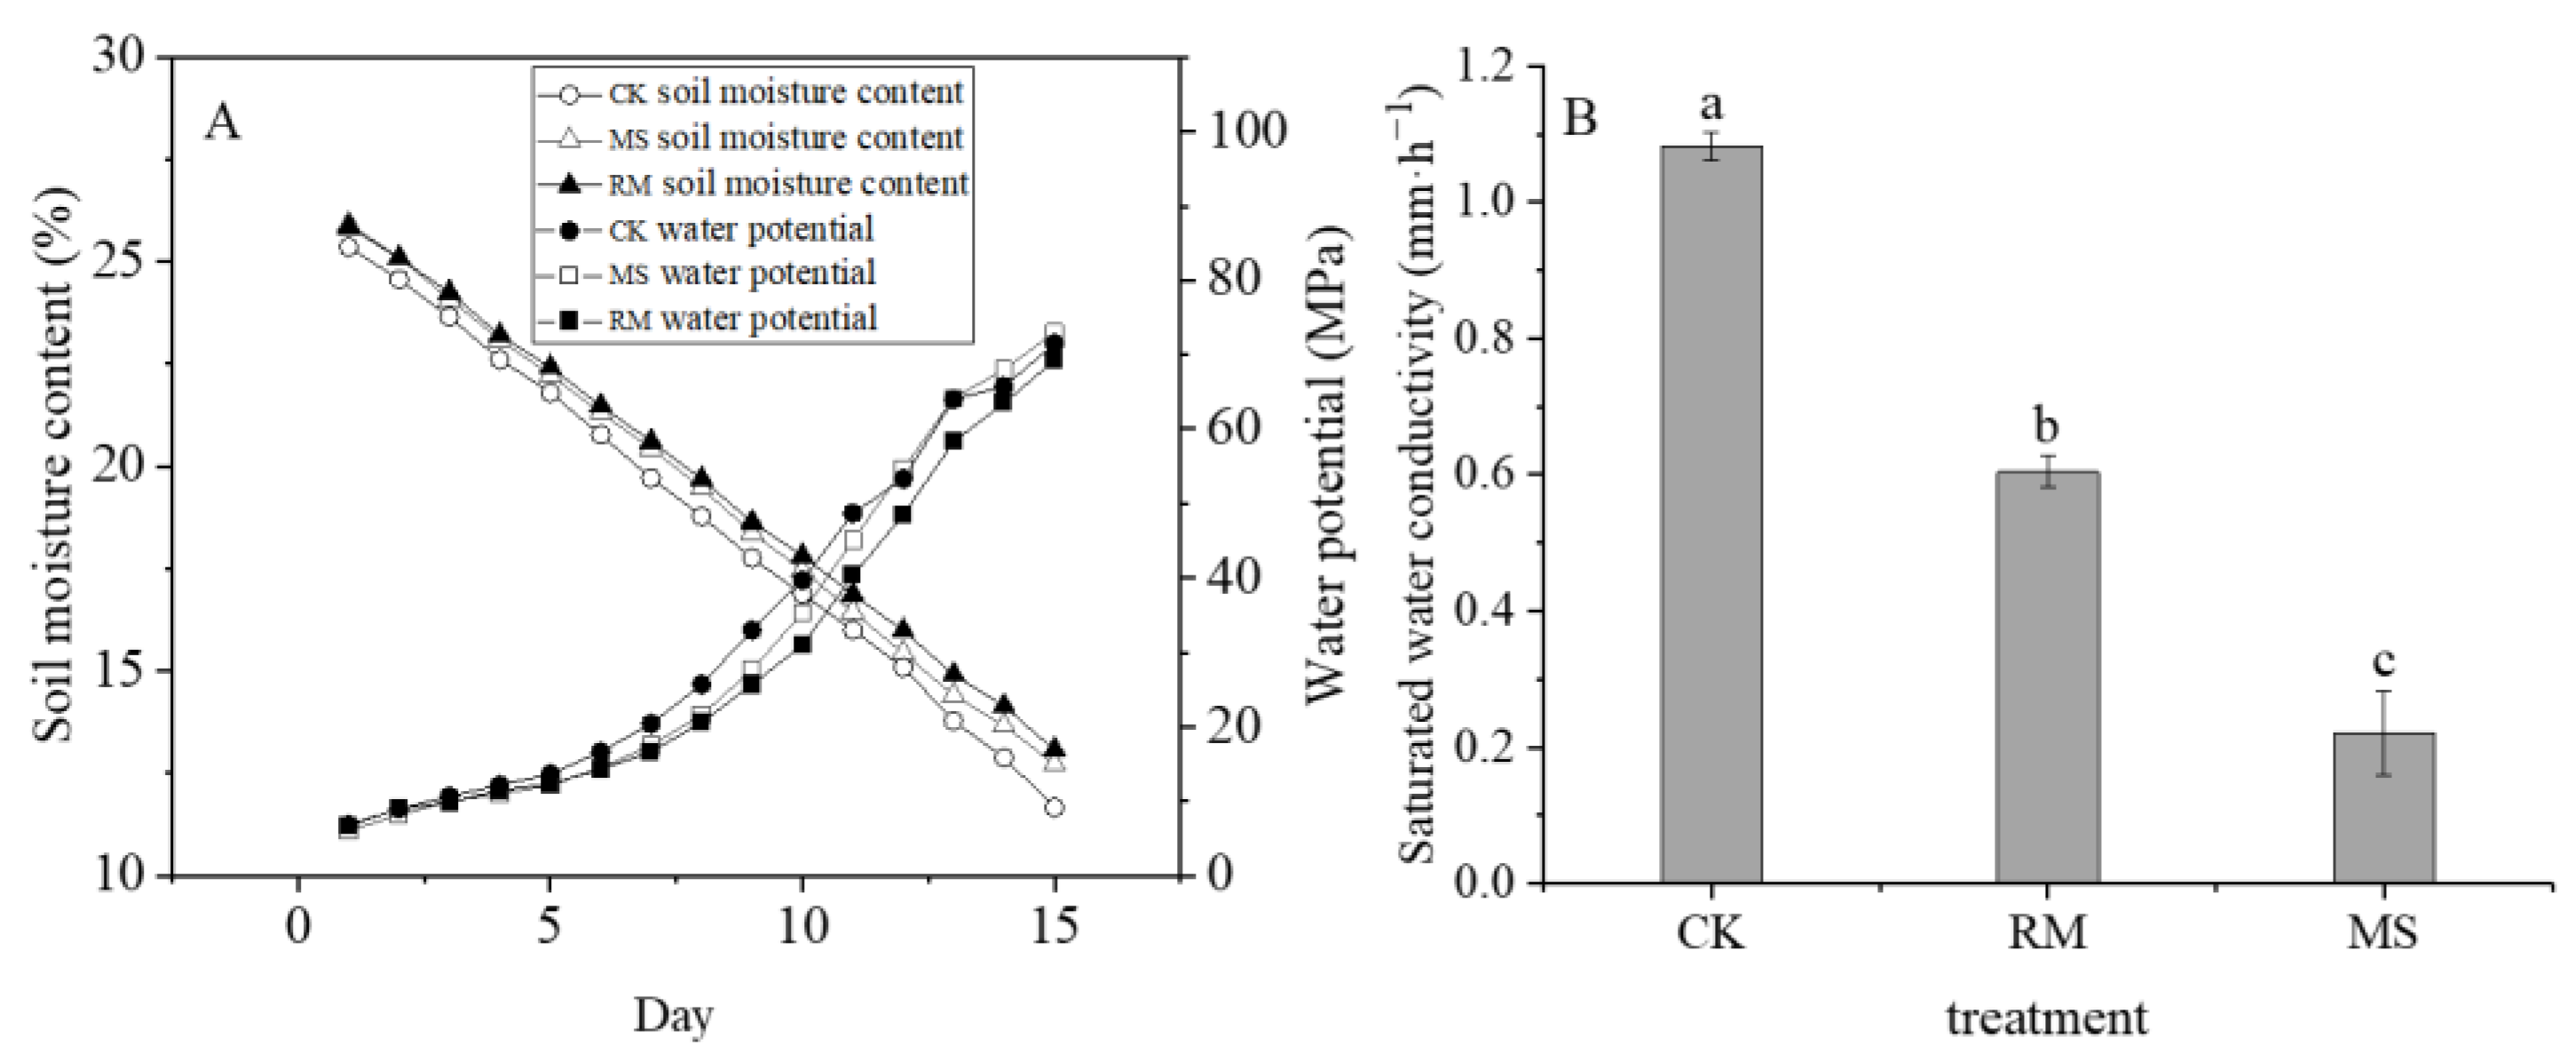
3.1.2. Soil Water Potential and Saturated Water Conductivity
3.2. Gaseous Nitrogen Emissions
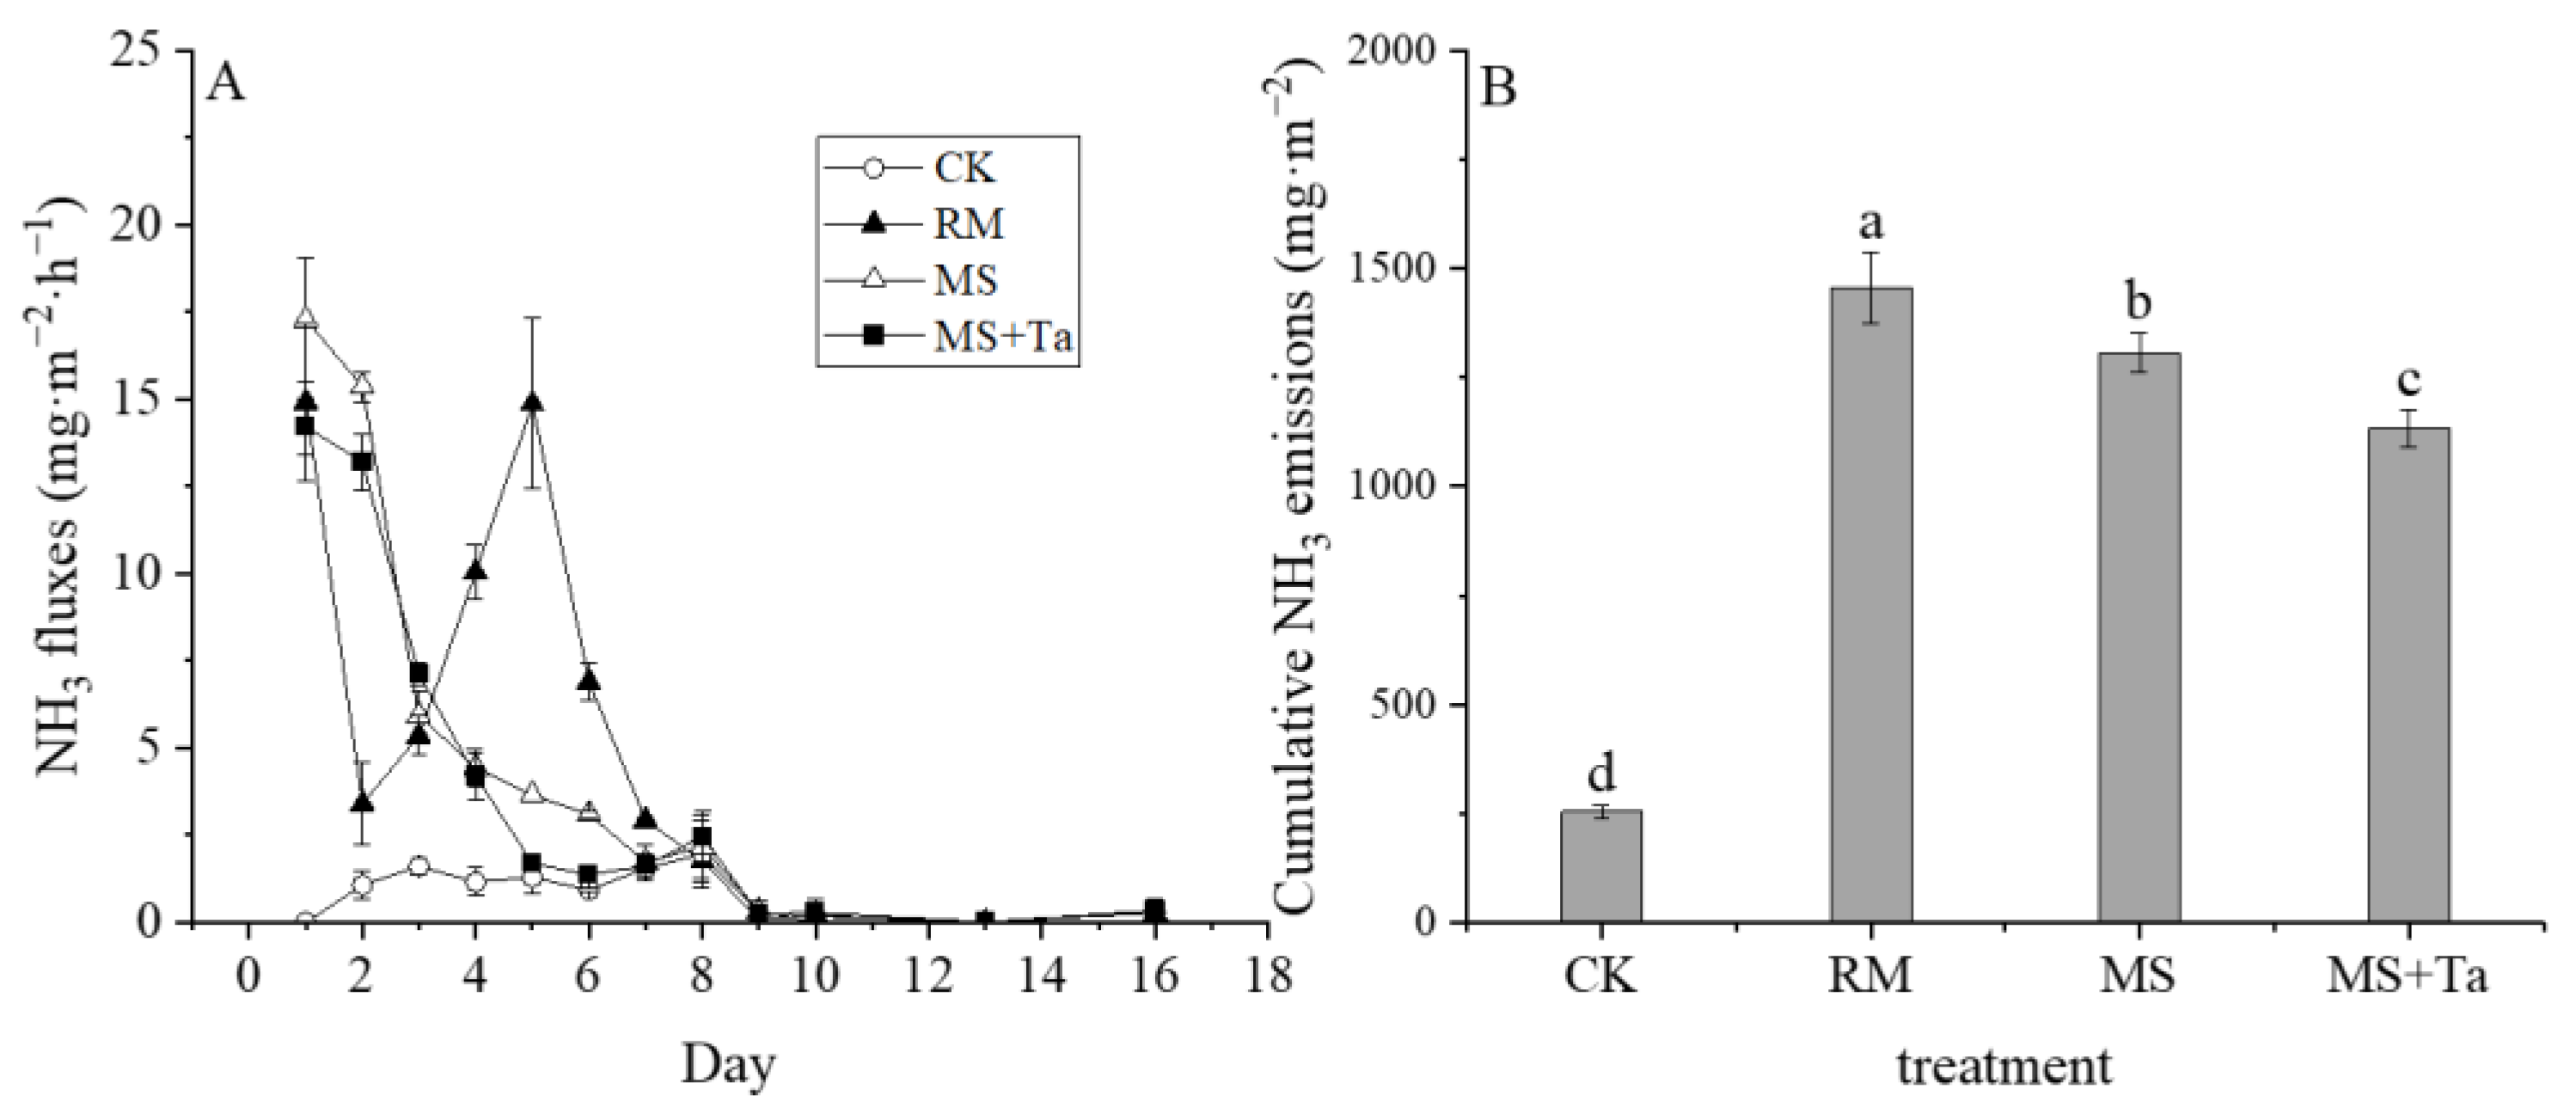
3.2.1. NH3 Emissions
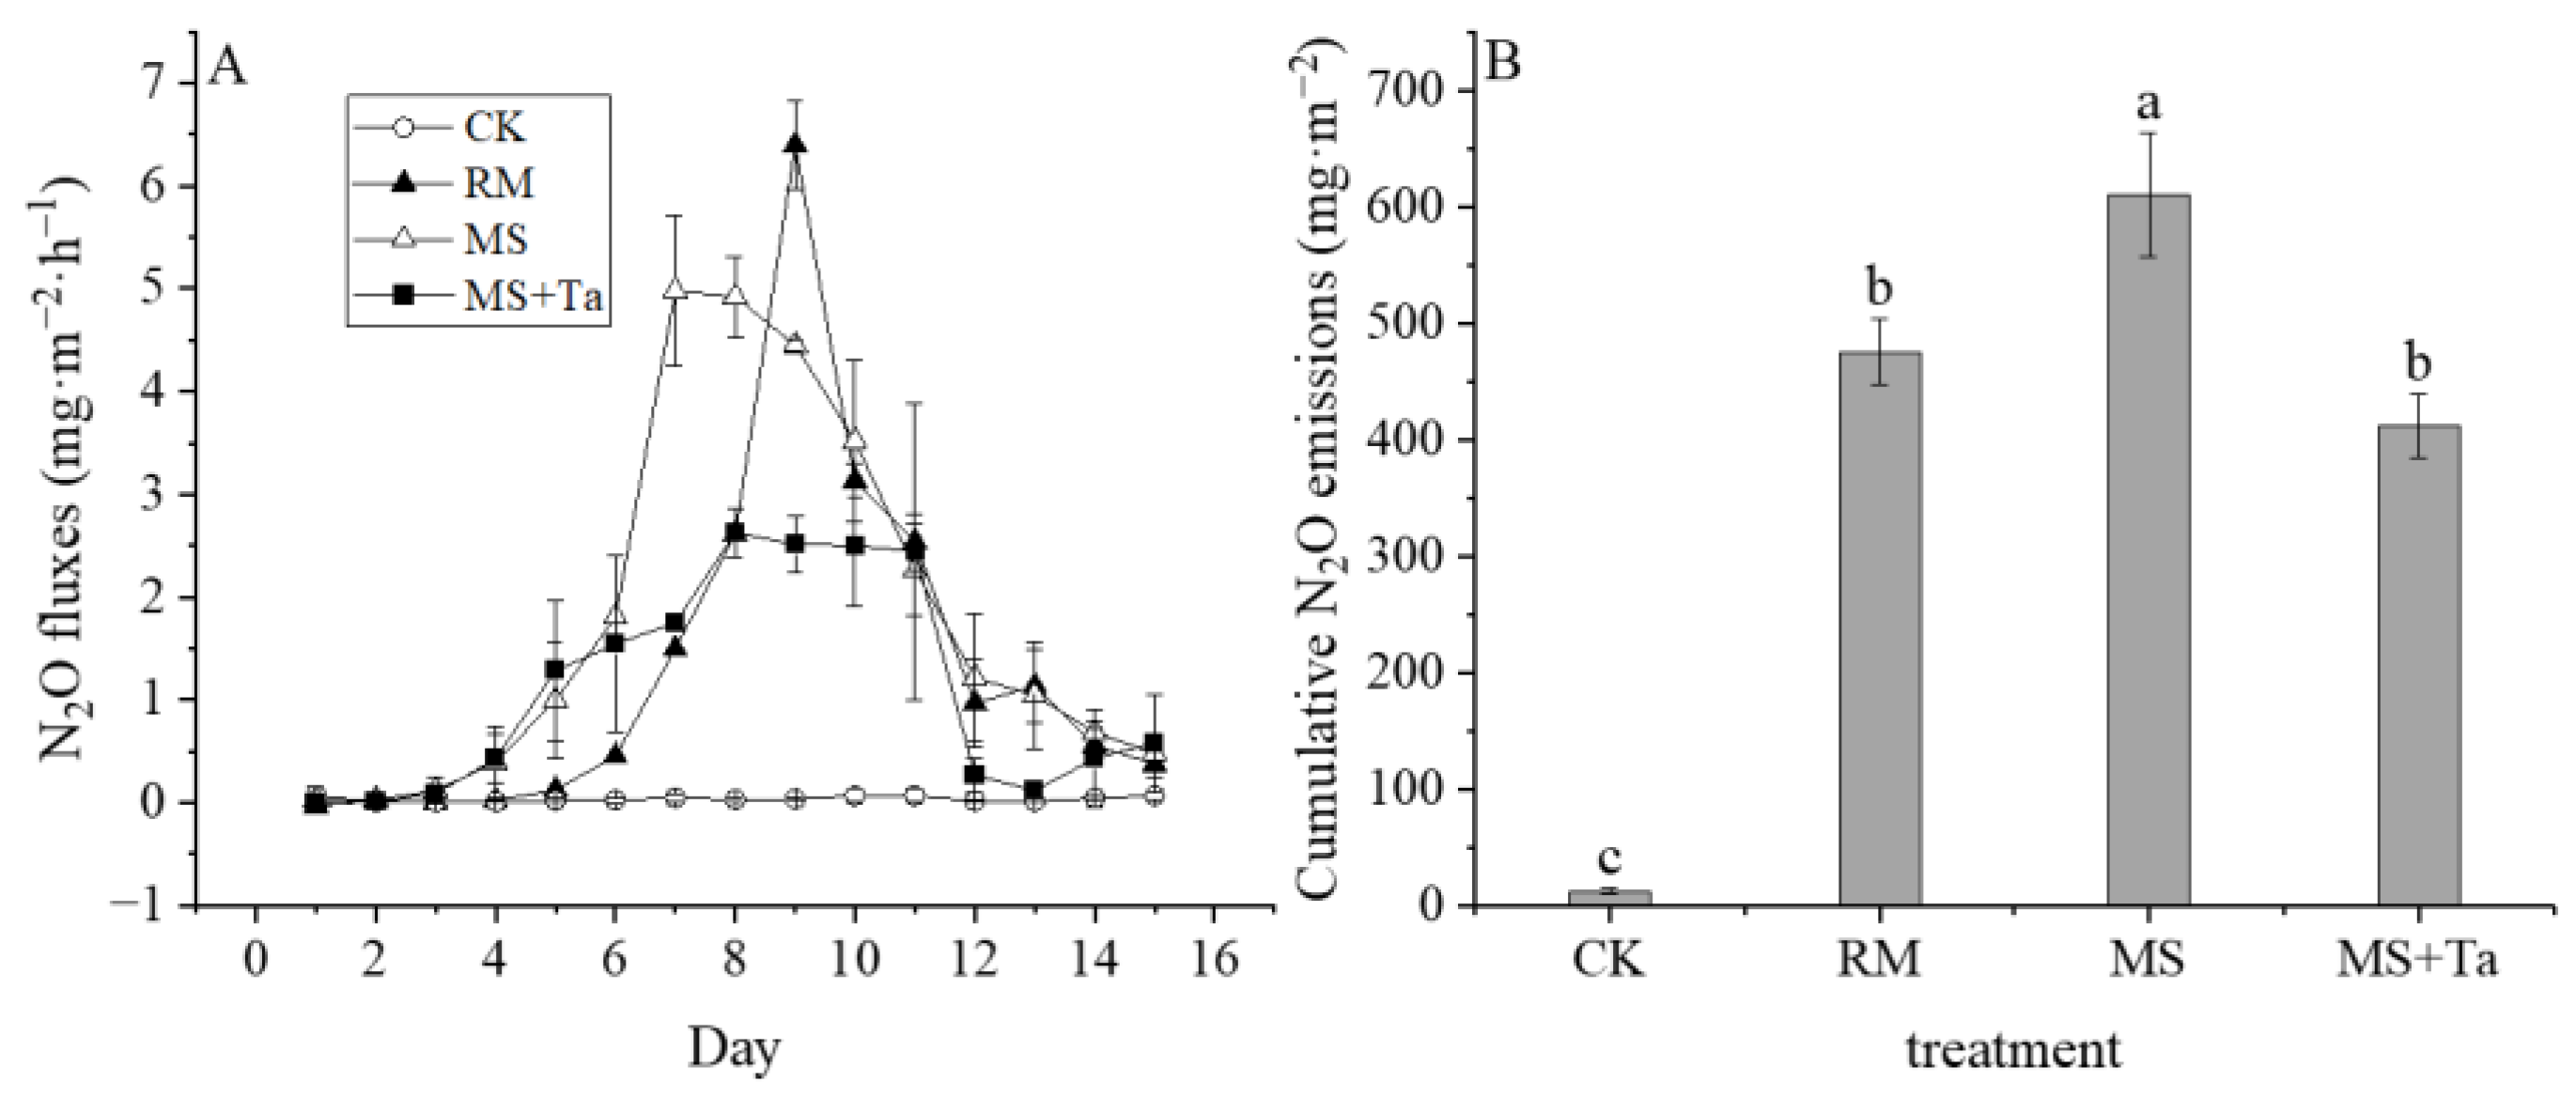
3.2.2. N2O Emissions
3.2.3. Total Gaseous Nitrogen Losses
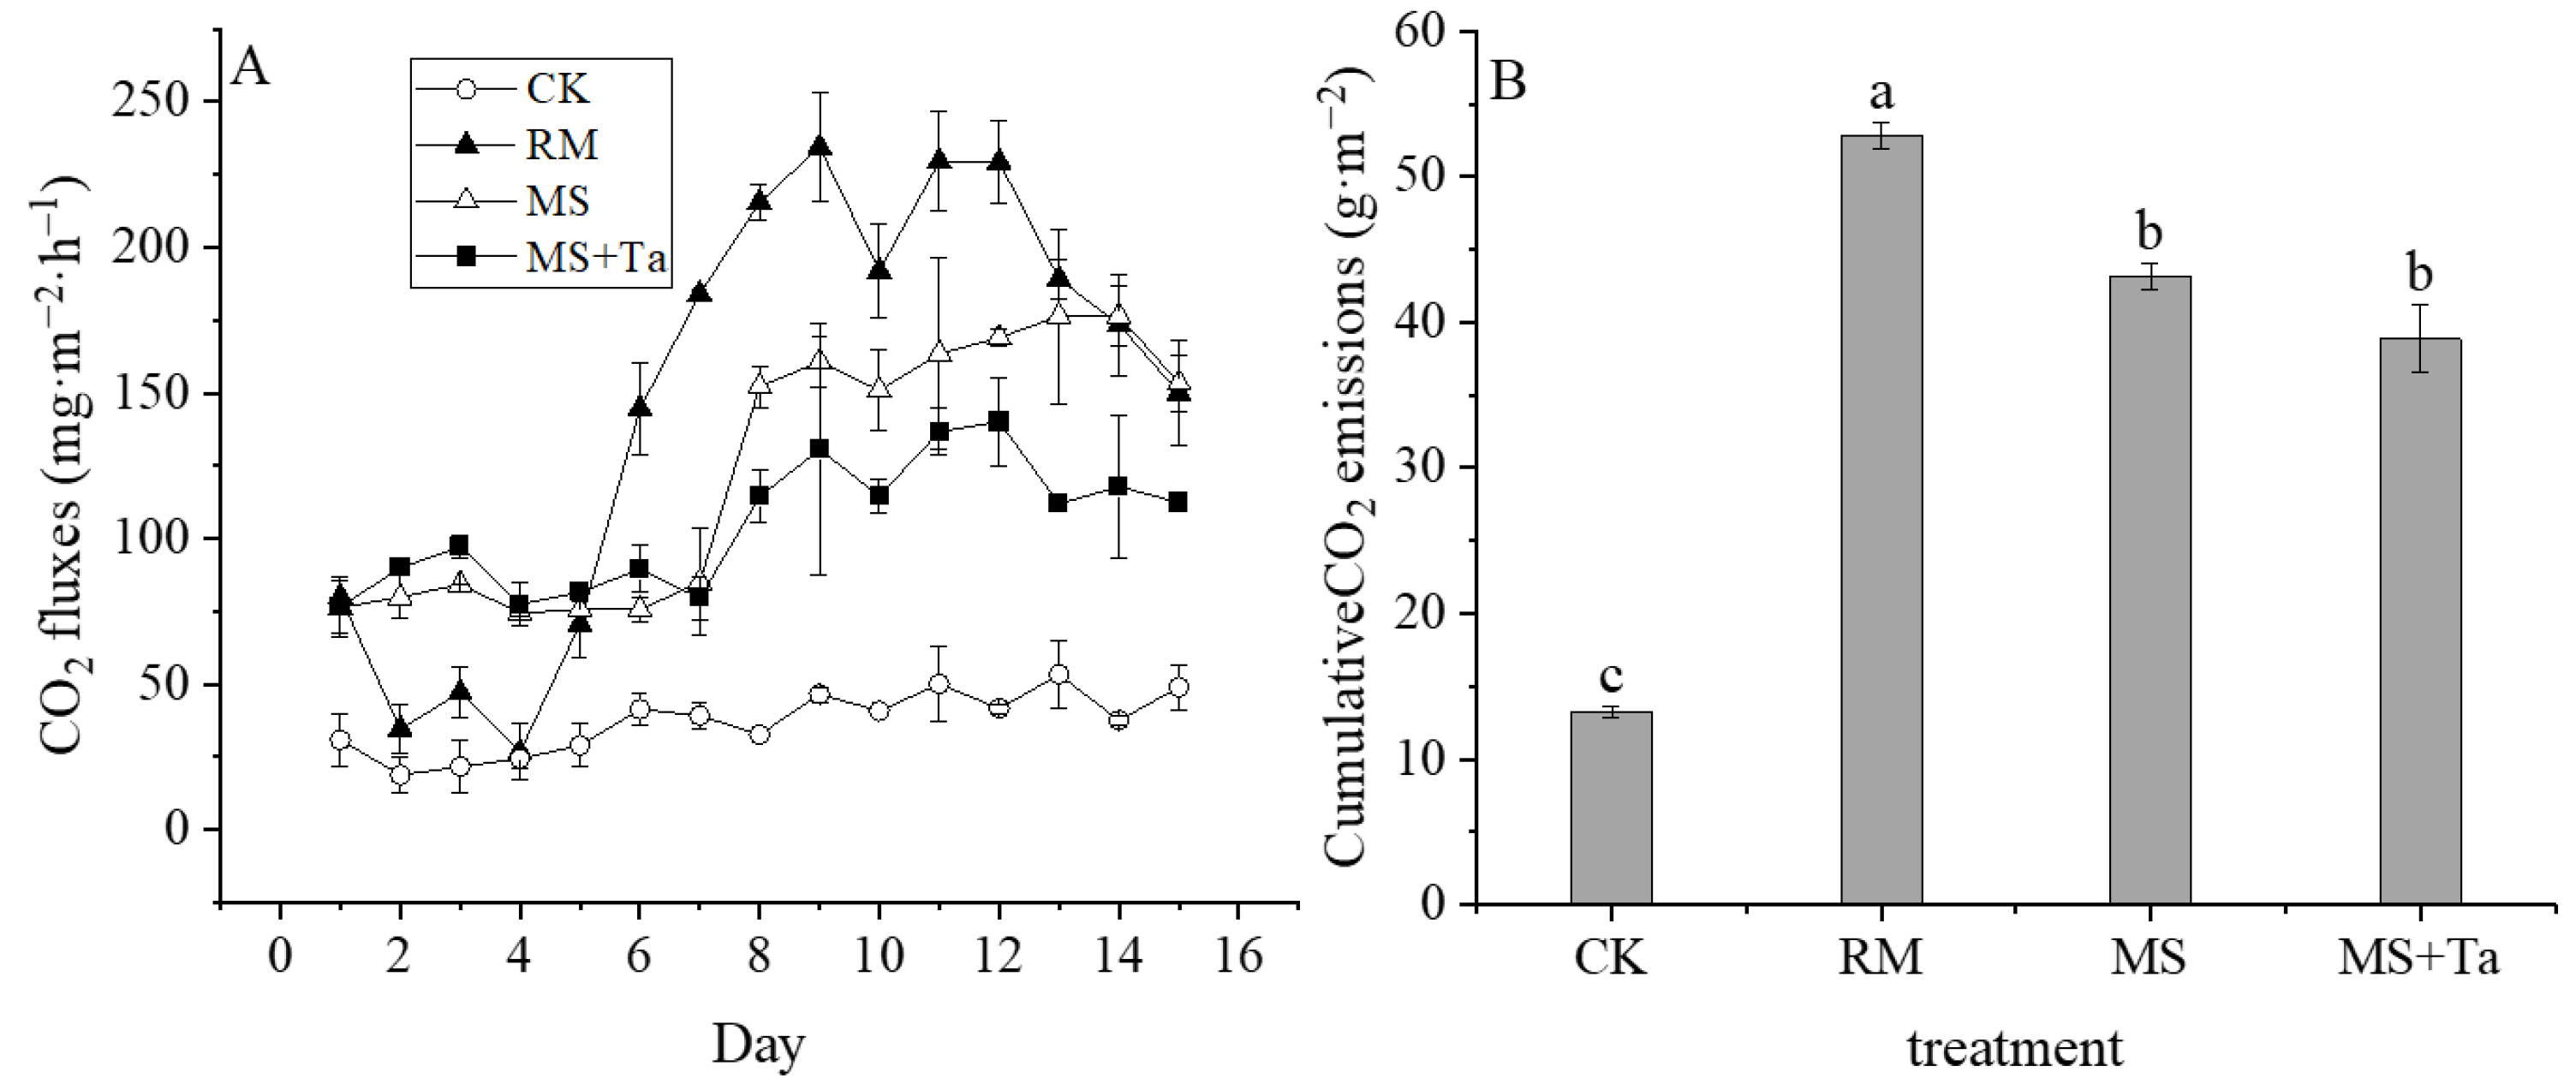
3.3. CO2 Emissions
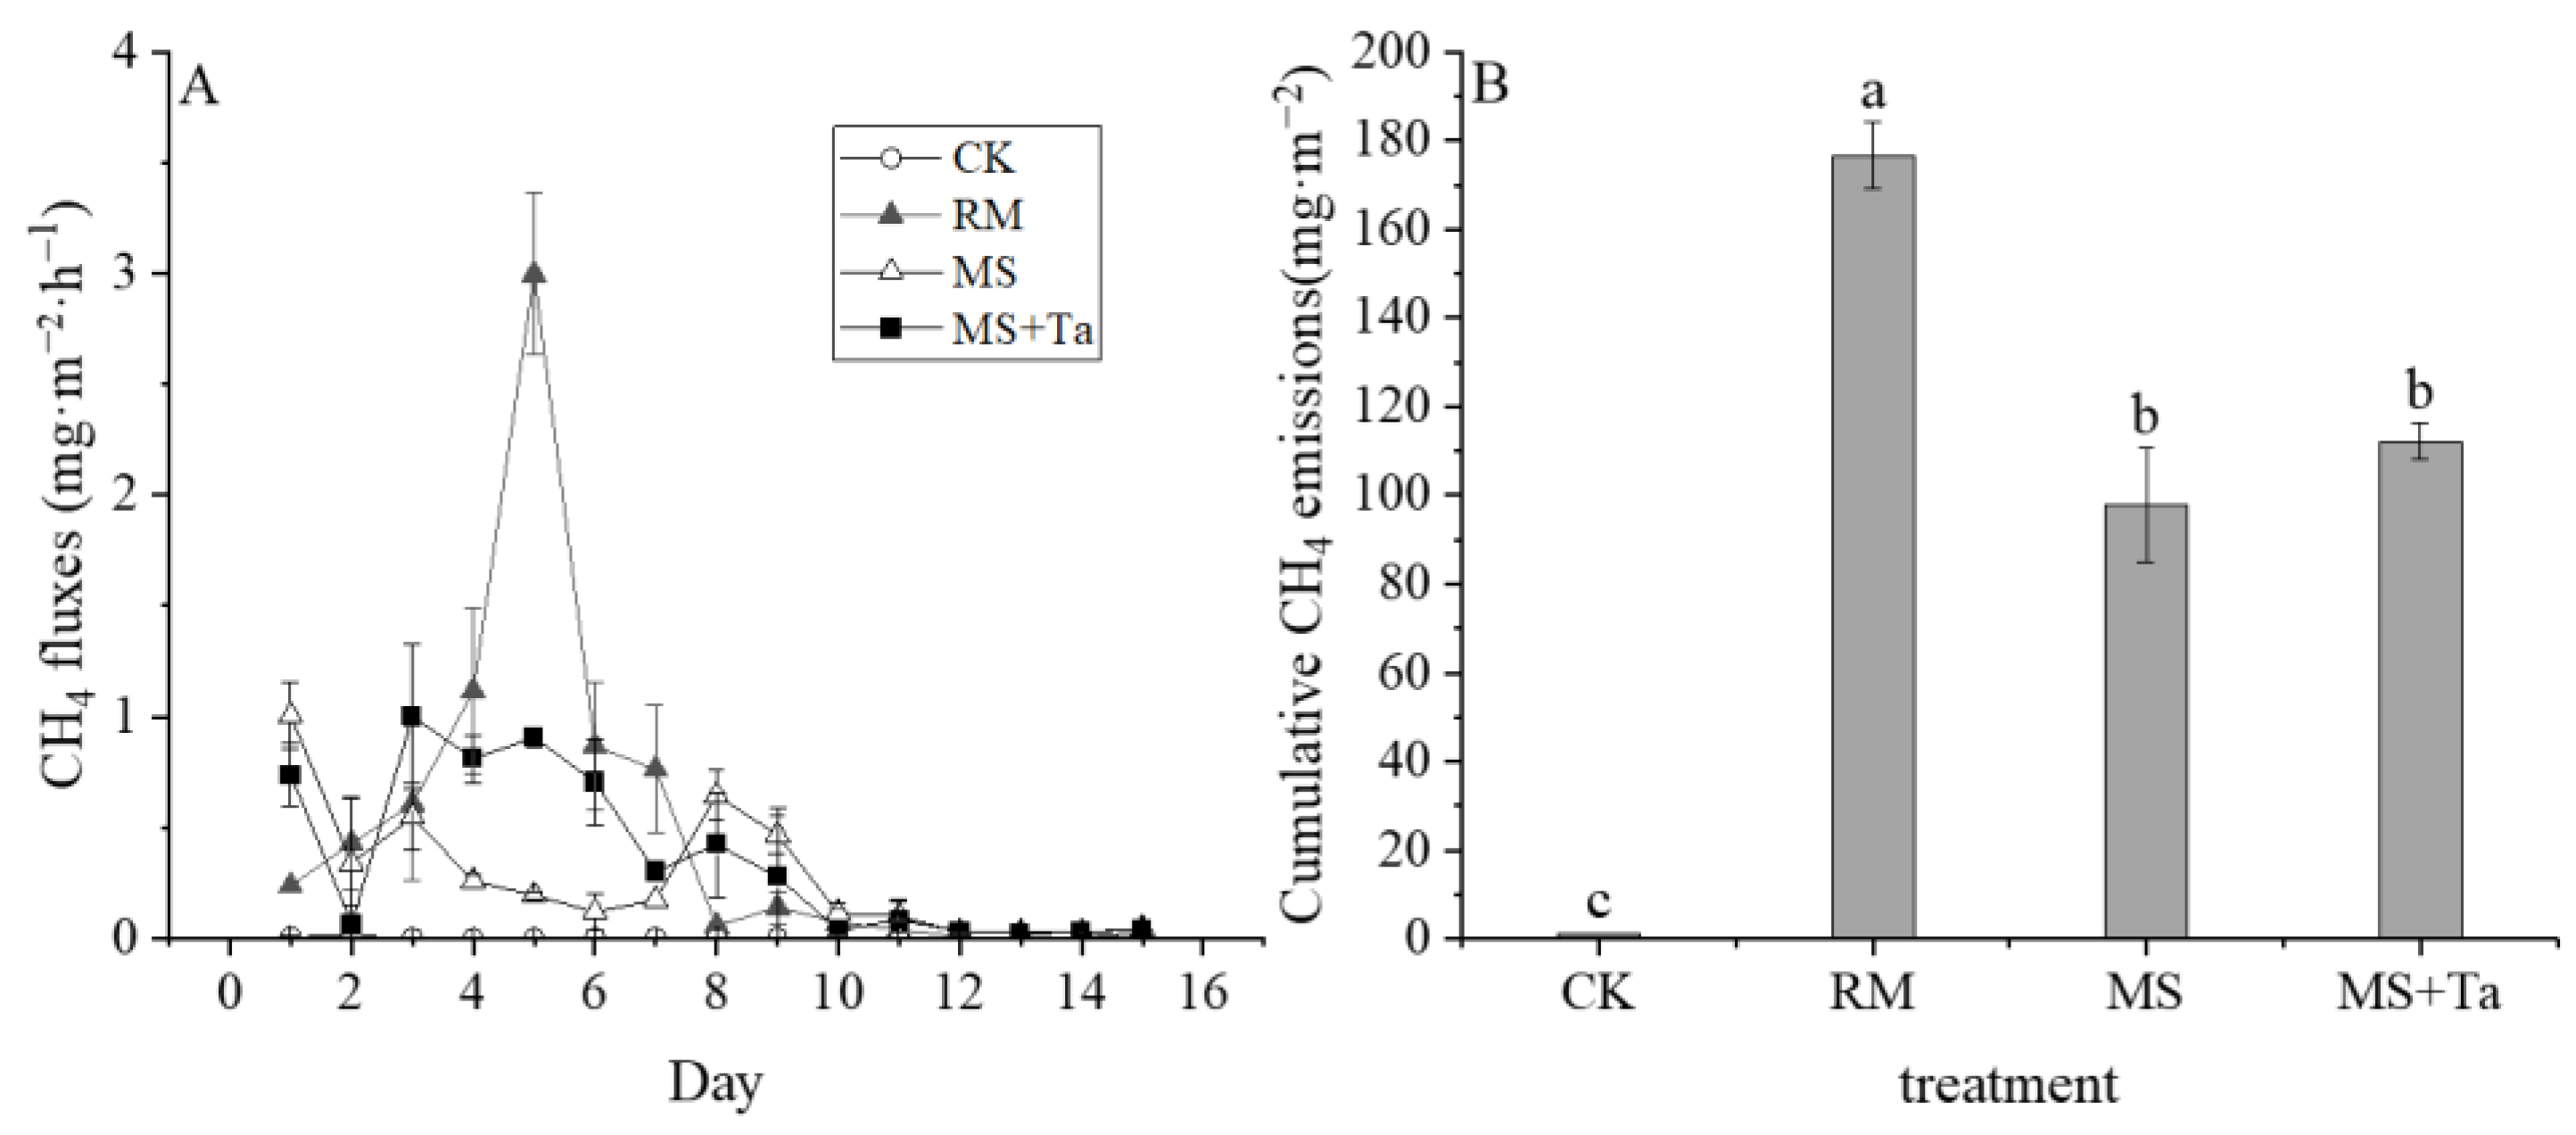
3.4. CH4 Emissions
3.5. Dynamics of Soil Properties
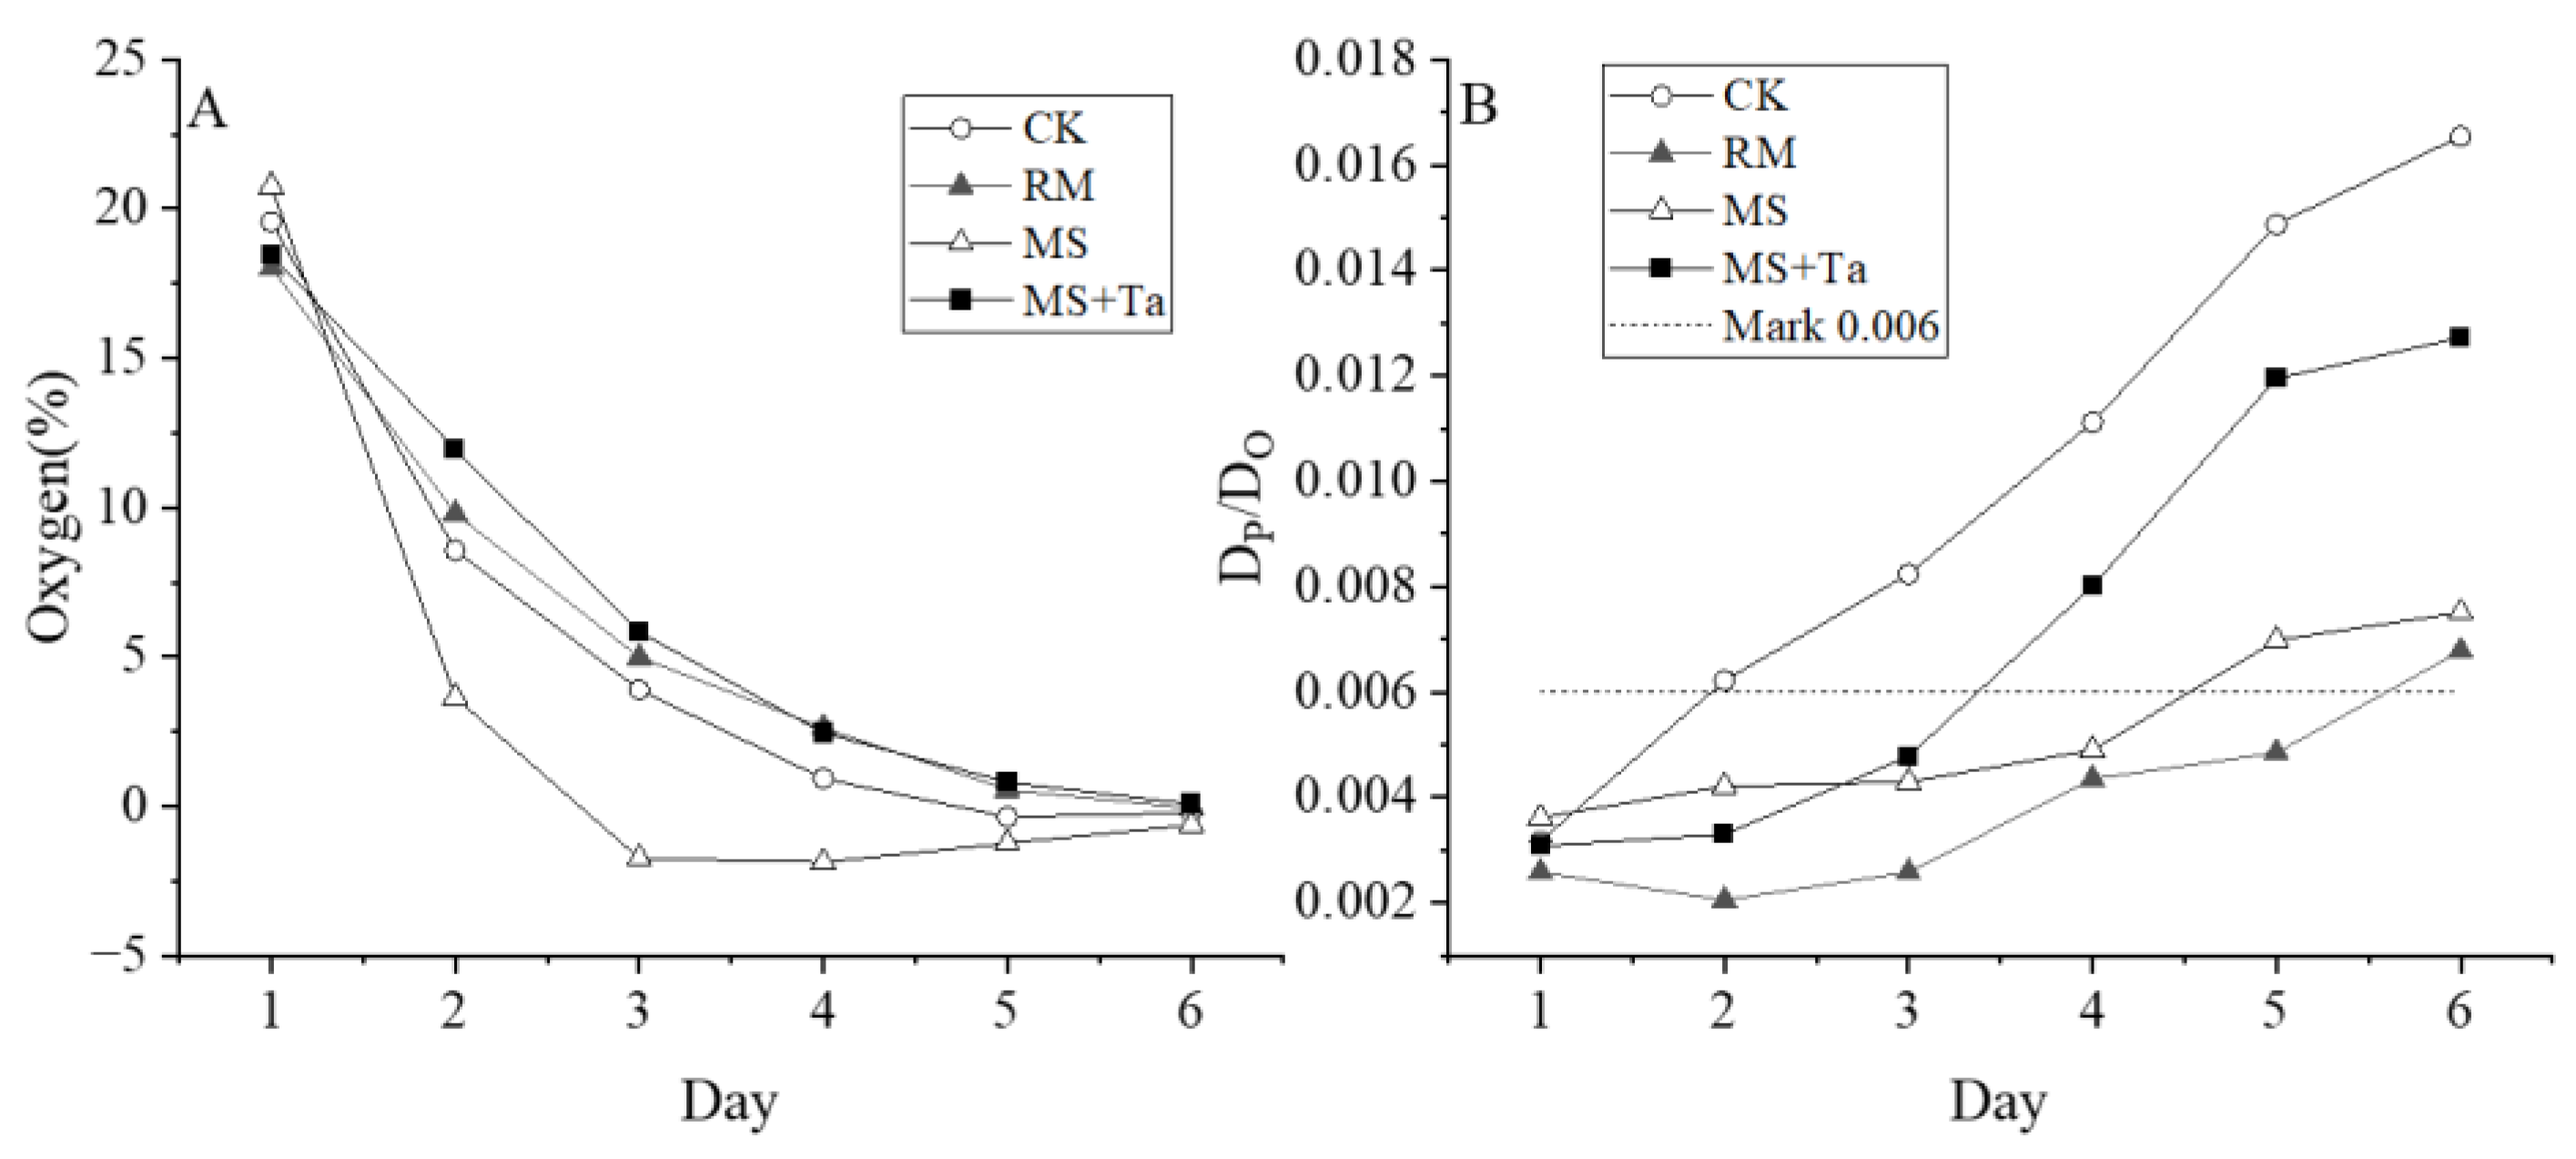
3.5.1. O2 and Gas Diffusion
3.5.2. Dynamics of Soil NO3−-N, NH4+-N, and DOC
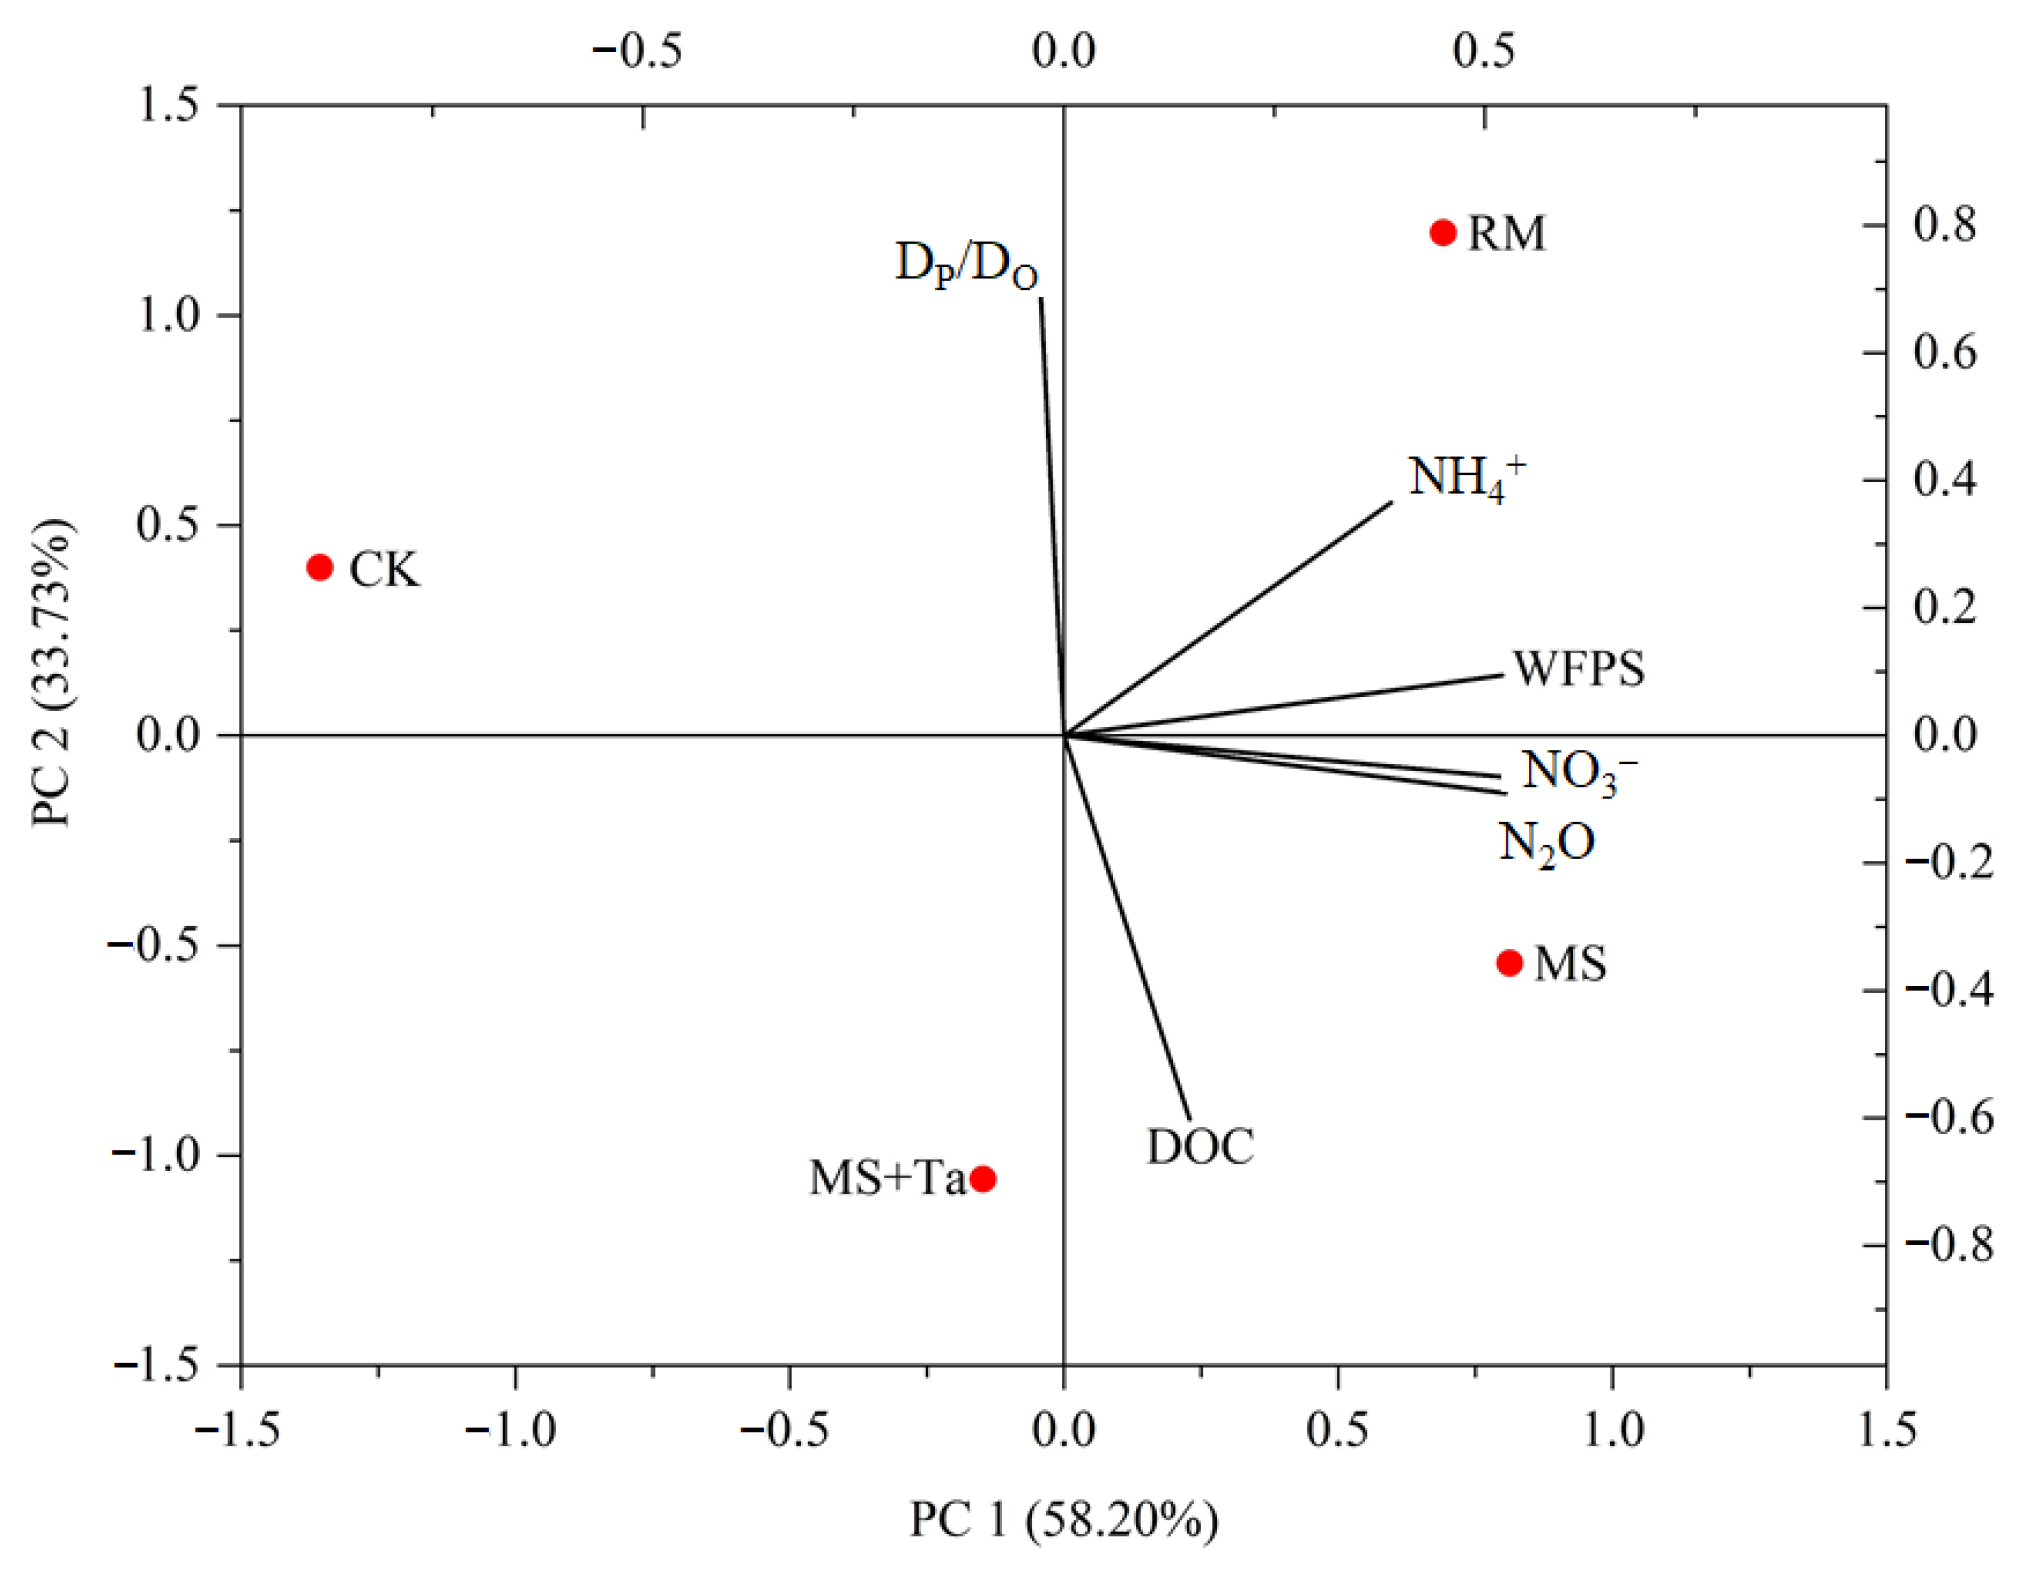
3.6. Integral Impacts of the Soil Environmental Variables on N2O Emissions
3.7. CO2-e Emissions of Different Treatments
4. Discussion
4.1. Impact on NH3 Emissions
4.2. Impact on N2O Emissions
4.3. Impact on Soil Respiration
4.4. Implications
5. Conclusions
Author Contributions
Funding
Data Availability Statement
Conflicts of Interest
References
- Veltman, K.; Rotz, C.A.; Chase, L.; Cooper, J.; Ingraham, P.; Izaurralde, R.C.; Jones, C.D.; Gaillard, R.; Larson, R.A. A quantitative assessment of beneficial management practices to reduce carbon and reactive nitrogen footprints and phosphorus losses on dairy farms in the us great lakes region. Agric. Syst. 2018, 166, 10–25. [Google Scholar] [CrossRef]
- Zervas, G.; Tsiplakou, E. An assessment of GHG emissions from small ruminants in comparison with GHG emissions from large ruminants and monogastric livestock. Atmos. Environ. 2012, 49, 13–23. [Google Scholar] [CrossRef]
- Abelenda, A.M.; Semple, K.T.; Aggidis, G.; Aiouache, F. Dataset on the solid-liquid separation of anaerobic digestate by means of wood ash-based treatment. Data Brief 2022, 44, 108536. [Google Scholar] [CrossRef]
- Aguirre-Villegas, H.A.; Larson, R.A. Evaluating greenhouse gas emissions from dairy manure management practices using survey data and lifecycle tools. J. Clean. Prod. 2017, 143, 169–179. [Google Scholar] [CrossRef]
- Pedersen, J.; Hafner, S.D.; Adamsen, A.P.S. Effectiveness of mechanical separation for reducing ammonia loss from field-applied slurry: Assessment through literature review and model calculations. J. Environ. Manag. 2022, 323, 116196. [Google Scholar] [CrossRef] [PubMed]
- Wang, L.; Chen, L.; Wu, S. Nutrient reduction of dairy manure through solid-liquid separation with flocculation and subsequent microalgal treatment. Appl. Biochem. Biotechnol. 2020, 190, 1425–1437. [Google Scholar] [CrossRef] [PubMed]
- Evans, L.; Vanderzaag, A.C.; Sokolov, V.; Baldé, H.; Macdonald, D.; Wagner-Riddle, C.; Gordon, R. Ammonia emissions from the field application of liquid dairy manure after anaerobic digestion or mechanical separation in ontario, canada. Agric. For. Meteorol. 2018, 258, 89–95. [Google Scholar] [CrossRef]
- Guilayn, F.; Jimenez, J.; Rouez, M.; Crest, M. Digestate mechanical separation: Efficiency profiles based on anaerobic digestion feedstock and equipment choice. Bioresour. Technol. 2019, 274, 180–189. [Google Scholar] [CrossRef]
- Meng, X.; Ma, C.; Petersen, S.O. Sensitive control of N2O emissions and microbial community dynamics by organic fertilizer and soil interactions. Biol. Fertil. Soils 2022, 58, 771–788. [Google Scholar] [CrossRef]
- Meyer, D.; Ristow, P.; Lie, M. Particle size and nutrient distribution in fresh dairy manure. Appl. Eng. Agric. 2007, 23, 113–118. [Google Scholar] [CrossRef]
- Peters, K.; Hjorth, M.; Jensen, L.S.; Magid, J. Carbon, nitrogen, and phosphorus distribution in particle size–fractionated separated pig and cattle slurry. Environ. Qual. 2011, 40, 224–232. [Google Scholar] [CrossRef] [PubMed]
- Grell, T.; Marchuk, S.; William, I.; Mccabe, B.K.; Tait, S. Resource recovery for environmental management of dilute livestock manure using a solid-liquid separation approach. J. Environ. Manag. 2023, 325, 116254. [Google Scholar] [CrossRef] [PubMed]
- Vanotti, M.; Rashash, D.; Hunt, P. Solid–liquid separation of flushed swine manure with pam: Effect of wastewater strength. Trans. ASAE 2002, 45, 1959–1969. [Google Scholar] [CrossRef]
- Liu, Z.; Carroll, Z.S.; Long, S.C.; Gunasekaran, S. Use of cationic polymers to reduce pathogen levels during dairy manure separation. J. Environ. Manag. 2016, 166, 260–266. [Google Scholar] [CrossRef]
- Zhang, Z.; Wang, J.; Liu, D.; Li, J.; Wang, X.L.; Song, B.Y.; Yue, B.; Zhao, K.H.; Song, Y. Hydrolysis of polyaluminum chloride prior to coagulation: Effects on coagulation behavior and implications for improving coagulation performance. Environ. Sci. 2017, 57, 162–169. [Google Scholar] [CrossRef] [PubMed]
- Aljuboori AH, R.; Idris, A.; Abdullah, N.; Mohamad, R. Production and characterization of a bioflocculant produced by aspergillus flavus. Bioresour. Technol. 2013, 127, 489–493. [Google Scholar] [CrossRef] [PubMed]
- Singh, R.; Kumar, S.; Garg, M. Domestic wastewater treatment using tanfloc: A tannin based coagulant. Geostat. Geospat. Approaches Charact. Nat. Resour. Environ. Chall. Process. Strateg. 2016, 53, 349–354. [Google Scholar]
- Hameed, Y.T.; Idris, A.; Hussain, S.A.; Abdullah, N.; Cheman, H. Effect of pre-treatment with a tannin-based coagulant and flocculant on a biofilm bacterial community and the nitrification process in a municipal wastewater biofilm treatment unit. Environ. Chem. Eng. 2020, 8, 103679. [Google Scholar] [CrossRef]
- Nierop, K.G.; Preston, C.M.; Verstraten, J.M. Linking the b ring hydroxylation pattern of condensed tannins to c, n and p mineralization. A case study using four tannins. Soil Biol. Biochem. 2006, 38, 2794–2802. [Google Scholar] [CrossRef]
- Nierop, K.G.; Verstraten, J.M.; Tietema, A.; Westerveld, J.W.; Wartenbergh, P.E. Short-and long-term tannin induced carbon, nitrogen and phosphorus dynamics in corsican pine litter. Biogeochemistry 2006, 79, 275–296. [Google Scholar] [CrossRef]
- IPCC. Climate Change 2014: Mitigation of Climate Change; Technical Report of the Intergovernmental Panel on Climate Change; Cambridge University Press: Cambridge, UK; New York, NY, USA, 2014. [Google Scholar]
- Negassa, W.C.; Guber, A.K.; Kravchenko, A.N.; Marsh, T.L.; Hildebrandt, B.; Rivers, M.L. Properties of soil pore space regulate pathways of plant residue decomposition and community structure of associated bacteria. PLoS ONE 2015, 10, e0123999. [Google Scholar] [CrossRef] [PubMed]
- De Gryze, S.; Jassogne, L.; Six, J.; Bossuyt, H.; Wevers, M.; Merckx, R. Pore structure changes during decomposition of fresh residue: X-ray tomography analyses. Geoderma 2006, 134, 82–96. [Google Scholar] [CrossRef]
- Young, I.M.; Crawford, J.W. Interactions and self-organization in the soil-microbe complex. Science 2004, 304, 1634–1637. [Google Scholar] [CrossRef] [PubMed]
- Cortina-Januchs, M.; Quintanilla-Dominguez, J.; Vega-Corona, A.; Tarquis, A.; Andina, D. Detection of pore space in ct soil images using artificial neural networks. Biogeosciences 2011, 8, 279–288. [Google Scholar] [CrossRef]
- Bartlett, R.J.; Ross, D.S. Colorimetric Determination of Oxidizable Carbon in Acid Soil Solutions. Soil Sci. Soc. Am. J. 1988, 52, 1191–1192. [Google Scholar] [CrossRef]
- Moldrup, P.; Olesen, T.; Gamst, J.; Schjønning, P.; Yamaguchi, T.; Rolston, D. Predicting the gas diffusion coefficient in repacked soil water-induced linear reduction model. Soil Sci. Soc. 2000, 64, 1588–1594. [Google Scholar] [CrossRef]
- Moldrup, P.; Chamindu Deepagoda TK, K.; Hamamoto, S.; Komatsu, T.; Kawamoto, K.; Rolston, D.; Jonge, L.W. Structure-dependent water-induced linear reduction model for predicting gas diffusivity and tortuosity in repacked and intact soil. Vadose Zone J. 2013, 12, 1–11. [Google Scholar] [CrossRef]
- Marshall, T. The diffusion of gases through porous media. Soil Sci. 1959, 10, 79–82. [Google Scholar] [CrossRef]
- Wu, J.; Zhong, X. Relationship between the particle size and nutrient distribution of feces and nutrients in pigs and dairy cows and the efficiency of solid-liquid separation. IOP Conference Series: Earth and Environmental Science. IOP Conf. Ser. Earth Environ. Sci. 2020, 514, 052035. [Google Scholar] [CrossRef]
- Baral, K.R.; Guillaume, J.; Barbara, A.; Chantigny, M.; Olesen, J.; Petersen, S. Greenhouse gas emissions during storage of manure and digestates: Key role of methane for prediction and mitigation. Agric. Syst. 2018, 166, 26–35. [Google Scholar] [CrossRef]
- Hjorth, M.; Christensen, K.V.; Christensen, M.L.; Sommer, S. Solid–liquid separation of animal slurry in theory and practice. Sustain. Agric. 2011, 2, 953–986. [Google Scholar]
- Morris, D.R.; Lathwell, D.J. Anaerobically digested dairy manure as fertilizer for maize in acid and alkaline soils. Commun. Soil Sci. Plant Anal. 2004, 35, 1757–1771. [Google Scholar] [CrossRef]
- Pedersen, J.; Nyord, T.; Feilberg, A.; Labouriau, R.; Hunt, D.; Bittman, S. Effect of reduced exposed surface area and enhanced infiltration on ammonia emission from untreated and separated cattle slurry. Biosyst. Eng. 2021, 211, 141–151. [Google Scholar] [CrossRef]
- Sahiner, N.; Sagbas, S.; Sahiner, M.; Silan, C.; Aktas, N.; Turk, M. Biocompatible and biodegradable poly (tannic acid) hydrogel with antimicrobial and antioxidant properties. Int. J. Biol. Macromol. 2016, 82, 150–159. [Google Scholar] [CrossRef] [PubMed]
- Bhandral, R.; Bolan, N.S.; Saggar, S.; Hedley, M. Nitrogen transformation and nitrous oxide emissions from various types of farm effluents. Nutr. Cycl. Agroecosyst. 2007, 79, 193–208. [Google Scholar] [CrossRef]
- Fangueiro, D.; Senbayran, M.; Trindade, H.; Chadwick, D. Cattle slurry treatment by screw press separation and chemically enhanced settling: Effect on greenhouse gas emissions after land spreading and grass yield. Bioresour. Technol. 2008, 99, 7132–7142. [Google Scholar] [CrossRef]
- Wen, Y.C.; Li, H.Y.; Lin, Z.A.; Zhao, B.Q.; Sun, Z.B.; Yuan, L.; Xu, J.K.; Li, Y.Q. Long-term fertilization alters soil properties and fungal community composition in fluvo-aquic soil of the north China Plain. Sci. Rep. 2020, 10, 7198. [Google Scholar] [CrossRef]
- Blanco-Canqui, H. Biochar and soil physical properties. Soil Sci. Soc. Am. J. 2017, 81, 687–711. [Google Scholar] [CrossRef]
- Wen, T.; Wang, P.; Shao, L.; Guo, X.X. Experimental investigations of soil shrinkage characteristics and their effects on the soil water characteristic curve. Eng. Geol. 2021, 284, 106035. [Google Scholar] [CrossRef]
- Zhu, K.; Bruun, S.; Larsen, M.; Glud, R.N.; Jensen, L.S. Spatial oxygen distribution and nitrous oxide emissions from soil after manure application: A novel approach using planar optodes. J. Environ. Qual. 2014, 43, 1809–1812. [Google Scholar] [CrossRef]
- Domeignoz-Horta, L.A.; Philippot, L.; Peyrard, C.; Bru, D.; Breuil, M.; Bizouard, F.; Justes, E.; Mary, B.; Léonard, J. Peaks of in situ N2O emissions are influenced by N2O-producing and reducing microbial communities across arable soils. Glob. Chang. Biol. 2018, 24, 360–370. [Google Scholar] [CrossRef] [PubMed]
- Blagodatskaya, E.; Zheng, X.; Blagodatsky, S.; Wiegl, R.; Dannenmann, M.; Butterbach-Bahl, K. Oxygen and substrate availability interactively control the temperature sensitivity of CO2 and N2O emission from soil. Biol. Fertil. Soils 2014, 50, 775–783. [Google Scholar] [CrossRef]
- Charles, A.; Rochette, P.; Whalen, J.K.; Angers, D.A.; Chantigny, M.H.; Bertrand, N. Global nitrous oxide emission factors from agricultural soils after addition of organic amendments: A meta-analysis. Agric. Ecosyst. Environ. 2017, 236, 88–98. [Google Scholar] [CrossRef]
- Xu, X.; Liu, Y.; Singh, B.P.; Yang, Q.; Zhang, Q.; Wang, H.; Xia, Z.; Di, H.; Singh, B.K.; Xu, J.M. Nosz clade ii rather than clade i determine in situ N2O emissions with different fertilizer types under simulated climate change and its legacy. Soil Biol. Biochem. 2020, 150, 107974. [Google Scholar] [CrossRef]
- Fangueiro, D.; Chadwick, D.; Dixon, L.; Bol, R. Quantification of priming and CO2 emission sources following the application of different slurry particle size fractions to a grassland soil. Soil Biol. Biochem. 2007, 39, 2608–2620. [Google Scholar] [CrossRef]
- Masse, L.; Massé, D.; Beaudette, V.; Muir, M. Size distribution and composition of particles in raw and anaerobically digested swine manure. Trans. ASAE 2005, 48, 1943–1949. [Google Scholar] [CrossRef]
- Dalby, F.R.; Hansen, M.J.; Feilberg, A.; Kuemmel, S.; Nikolausz, M. Effect of tannic acid combined with fluoride and lignosulfonic acid on anaerobic digestion in the agricultural waste management chain. Bioresour. Technol. 2020, 307, 123171. [Google Scholar] [CrossRef]
- Dalby, F.R.; Svane, S.; Sigurdarson, J.J.; Sorensen, M.K.; Hansen, M.J.; Karring, H.; Feilberg, A. Synergistic tannic acid-fluoride inhibition of ammonia emissions and simultaneous reduction of methane and odor emissions from livestock waste. Environ. Sci. Technol. 2020, 54, 7639–7650. [Google Scholar] [CrossRef]
- Aguerre, M.; Wattiaux, M.; Powell, J. Emissions of ammonia, nitrous oxide, methane, and carbon dioxide during storage of dairy cow manure as affected by dietary forage-to-concentrate ratio and crust formation. J. Dairy Sci. 2012, 95, 7409–7416. [Google Scholar] [CrossRef]
- Dinuccio, E.; Berg, W.; Balsari, P. Effects of mechanical separation on ghg and ammonia emissions from cattle slurry under winter conditions. Anim. Feed Sci. Technol. 2011, 166, 532–538. [Google Scholar] [CrossRef]
- Adamczyk, S.; Kiikkilä, O.; Kitunen, V.; Smolander, A. Potential response of soil processes to diterpenes, triterpenes and tannins: Nitrification, growth of microorganisms and precipitation of proteins. Appl. Soil Ecol. 2013, 67, 47–52. [Google Scholar] [CrossRef]


| Treatments | Organic Matter (%) | TN (g kg−1) | TAN (g kg−1) | pH |
|---|---|---|---|---|
| RM | 3.50 | 1.68 | 0.51 | 8.67 |
| MS | 1.24 | 0.96 | 0.47 | 8.74 |
| MS + Ta | 0.91 | 0.86 | 0.45 | 8.67 |
| Treatments | Organic Matter (g) | TN (mg) | TAN (mg) |
|---|---|---|---|
| RM | 5.51 a | 264.93 a | 80.92 c |
| MS | 3.39 b | 264.93 a | 128.63 b |
| MS + Ta | 2.81 c | 264.93 a | 140.03 a |
| Treatment | NH3-N/(%) | N2O-N/(%) | (NH3 + N2O)-N/(%) |
|---|---|---|---|
| RM | 7.96 a | 3.08 b | 11.04 a |
| MS | 7.02 a | 3.98 a | 10.10 a |
| MS + Ta | 5.87 b | 2.66 c | 8.53 b |
| Treatment | CH4/(g m−2) | N2O/(g m−2) | NH3/(g m−2) | Total (g m−2) |
|---|---|---|---|---|
| CK | 0.03 c | 3.47 d | 1.06 c | 4.56 d |
| RM | 4.94 a | 126.04 b | 6.02 a | 137.00 b |
| MS | 2.74 b | 161.70 a | 5.44 a | 169.88 a |
| MS + Ta | 3.60 b | 109.21 c | 4.72 b | 117.53 c |
Disclaimer/Publisher’s Note: The statements, opinions and data contained in all publications are solely those of the individual author(s) and contributor(s) and not of MDPI and/or the editor(s). MDPI and/or the editor(s) disclaim responsibility for any injury to people or property resulting from any ideas, methods, instructions or products referred to in the content. |
© 2024 by the authors. Licensee MDPI, Basel, Switzerland. This article is an open access article distributed under the terms and conditions of the Creative Commons Attribution (CC BY) license (https://creativecommons.org/licenses/by/4.0/).
Share and Cite
Wang, S.; Wang, W.; Cui, Y.; Bai, Y.; Liu, C.; Liao, W.; Gao, Z. Impacts of Liquid Fractions from Two Solid–Liquid Separation Technologies on the Soil Porosity, Ammonia, and Greenhouse Gas Emissions. Agronomy 2024, 14, 186. https://doi.org/10.3390/agronomy14010186
Wang S, Wang W, Cui Y, Bai Y, Liu C, Liao W, Gao Z. Impacts of Liquid Fractions from Two Solid–Liquid Separation Technologies on the Soil Porosity, Ammonia, and Greenhouse Gas Emissions. Agronomy. 2024; 14(1):186. https://doi.org/10.3390/agronomy14010186
Chicago/Turabian StyleWang, Shanshan, Wenjing Wang, Yingxin Cui, Yichao Bai, Chunjing Liu, Wenhua Liao, and Zhiling Gao. 2024. "Impacts of Liquid Fractions from Two Solid–Liquid Separation Technologies on the Soil Porosity, Ammonia, and Greenhouse Gas Emissions" Agronomy 14, no. 1: 186. https://doi.org/10.3390/agronomy14010186
APA StyleWang, S., Wang, W., Cui, Y., Bai, Y., Liu, C., Liao, W., & Gao, Z. (2024). Impacts of Liquid Fractions from Two Solid–Liquid Separation Technologies on the Soil Porosity, Ammonia, and Greenhouse Gas Emissions. Agronomy, 14(1), 186. https://doi.org/10.3390/agronomy14010186