Article

Gene Mapping of a Yellow-to-Lethal Mutation Based on Bulked-Segregant Analysis-Seq in Soybean

1
Huai’an Key Laboratory for Agricultural Biotechnology, Key Laboratory of Germplasm Innovation in Lower Reaches of the Huaihe River, Ministry of Agriculture and Rural Affairs, Huaiyin Institute of Agricultural Sciences of Xuhuai Region in Jiangsu, Huai’an 223001, China
2
Soybean Research Institute, National Center for Soybean Improvement (Nanjing), Key Laboratory for Biology and Genetic Improvement of Soybean (General), Ministry of Agriculture and Rural Affairs, National Key Laboratory of Crop Genetics and Germplasm Enhancement, Nanjing Agricultural University, Nanjing 210095, China
3
Agronomy College, Gansu Agricultural University, Lanzhou 730070, China
4
State Key Laboratory of Aridland Crop Science, Gansu Agricultural University, Lanzhou 730070, China
5
Department of Botany, Jagannath University, Dhaka 1100, Bangladesh
*
Authors to whom correspondence should be addressed.
Agronomy 2024, 14(1), 185; https://doi.org/10.3390/agronomy14010185
Submission received: 9 December 2023 / Revised: 9 January 2024 / Accepted: 10 January 2024 / Published: 15 January 2024
(This article belongs to the Section Crop Breeding and Genetics)

Abstract

:
Plant photosynthesis is mainly dependent on leaf color, and this has an impact on yield. Mutants lacking in chlorophyll have been analyzed to gain insight into the genetic processes involved in photosynthesis, chloroplast development, and chlorophyll metabolism. A yellow-to-lethal mutant, ytl, was selected from the M6 generation of the 60Coγ ray irradiation-treated soybean cultivar Nannong 1138-2. The mutant exhibited reduced chlorophyll content, with the thylakoid structure disrupted. Segregation of the cross between Williams 82 (W82) and ytl indicated that a recessive allele controlled yellow-to-lethal traits. The bulked-segregant analysis (BSA)-Seq method performed preliminary mapping, followed by simple sequence repeat (SSR) marker validation and further mapping. The candidate gene was mapped to a 418 Kb region containing 53 genes. High-throughput sequencing and first-generation sequencing results showed a two bp deletion in the second exon of Glyma.08g106500, leading to a frameshift mutation in ytl. As a promising candidate gene, Glyma.08g106500 encoded a chloroplast-localized pentatricopeptide repeat (PPR) domain-containing protein involved in the assembly of chloroplast proteins. These results will contribute to cloning the mutant ytl gene and provide insight into the regulatory processes controlling photosynthesis and chloroplast development and growth in soybean.

1. Introduction

Leaves play a crucial role in photosynthesis and significantly contribute to the overall productivity of green plants. Leaves are responsible for exchanging gases, allowing plants to take in carbon dioxide and release oxygen into the atmosphere. Without leaves, photosynthesis would not occur, and the survival of green plants would be compromised. The insufficiency of chlorophyll in plants leads to a decline in their photosynthetic efficacy, causing a decrease in overall production. In recent years, extensive research on the genome has led to the identification of chlorophyll-deficient mutants, which have proven to be crucial in identifying genes related to chlorophyll metabolism. These mutants have provided valuable insights into the molecular mechanisms involved in chlorophyll synthesis and degradation. By studying these genes, the genetic variations help to develop strategies to enhance chlorophyll production in plants, ultimately improving their photosynthetic efficiency and overall productivity [1,2,3,4,5,6,7]. Several investigations have demonstrated that specific mutants lacking chlorophyll exhibit a gain in photosynthetic efficiency rather than a decrease [8,9]. These mutants are crucial to elucidating the metabolic pathways underlying chlorophyll photosynthesis.
Chlorophyll-deficient mutants can be divided into nonlethal and lethal groups according to their viability in the field. In recent years, more and more chlorophyll-deficient mutants have been found in soybean, including over ten nuclear gene-lethal mutants [10]. Mostly, the leaves of the lethal mutant are bright yellow and die quickly in the field. The Y11 mutant is the earliest reported lethal mutation [11]. The segregating lines exhibited incomplete dominance: 1 Y11Y11 (normal green); 2 Y11y11 (light green); 1 y11y11 (yellow, lethal). Further research has shown that a single base mutation in the Glyma13g30560 gene, which codes for the Mg-chelatase subunit (ChlI1a), causes a phenotype that ranges from yellow to lethal [12]. However, a mutation in ChlI1b, a paralog of ChlI1a, led to a nonlethal mutant CD-5. Noble et al. [13] reported a soybean mutant called lethal yellow (LY), which can survive until the pod-setting stage if given an appropriate carbon source. The researchers believe that the difference in the content of chlorophyll levels in LY is due to the rapid degradation of chlorophyll rather than an inability to synthesize it. Reed et al. [14] revealed a recessive allele controlling leaf color by identifying a lethal mutant from the cultivar “BSR 101” in soybean. Sandhu et al. [15] found a yellow chlorophyll-deficient mutant in soybeans that was lethal because it could not make grana in the chloroplast and died three weeks after sprouting.
BSA-Seq is an efficient way to find causal loci in plants that combines the BSA method with a high-throughput sequencing technique. It has shown significant benefits in QTL/gene mapping [16,17]. Populations used in BSA include F2, F2:3, BC1, recombinant inbred lines (RILs), doubled haploids (DHs), nested association mapping (NAM) [18], multi-parent advanced generation inter-cross (MAGIC) [19], and natural populations [20]. Data collected from next-generation sequencing at all DNA, RNA, and protein levels are used for genetic polymorphism [21]. DNA bulks of individuals with significant phenotypic differences for the target trait are used for whole genome resequencing. After the analysis of the ΔSNP index between the data of the two gene bulks, the initial mapping intervals can be calculated. Then, the traditional molecular markers, SSR and InDel markers, validate the BSA-Seq results and narrow down the causal region. This method has been widely used to mine candidate genes for target traits in Arabidopsis [16], rice [22,23,24], cotton [25], maize [26], wheat [27], sunflower [28], soybean [29], and peanut [30].
This study identified a yellow-to-lethal mutant (ytl) from Nannong 1138-2 (NN1138-2) treated with 60Coγ ray irradiation. Then, it used the BSA-Seq method combined with SSR markers to map the target gene to a 418 Kb interval on chromosome 8. Sequencing results and functional annotation showed Glyma.08g106500 was predicted to be the candidate gene. This study lays the groundwork for cloning genes related to chlorophyll mechanisms or chloroplast development pathways to enhance photosynthetic efficiency in soybean varieties.

2. Materials and Methods

2.1. Plant Materials and Genetic Analysis

Soybean accessions NN1138-2 underwent irradiation with a 150 Gy dose of 60Coγ ray irradiation in 2011. The M1 plants were harvested and pooled, and the M2 generation began to be harvested individually. In 2016, a yellow-to-lethal mutant (ytl) was identified from the segregating lines of the M6 generation. Through consecutive selfing and selection, we achieved residual heterozygous lines with a relatively pure background except for the causal locus.
Due to the inability of the mutant to generate seeds, we used the plants of a residual heterozygous line as the male parent to cross with Williams 82 (W82) to construct F2 populations. The green leaf individuals of the segregating F2 population were harvested to generate F2:3 and F3:4 populations. For genetic analysis, the segregation ratio of alleles was evaluated based on the chi-square (χ2) test [31]. Due to the easy discrimination of leaf color, the phenotype of the individuals was assessed by visual inspection. The plants grew in the field with rows of 2 m in length and a space of 0.5 m between rows.

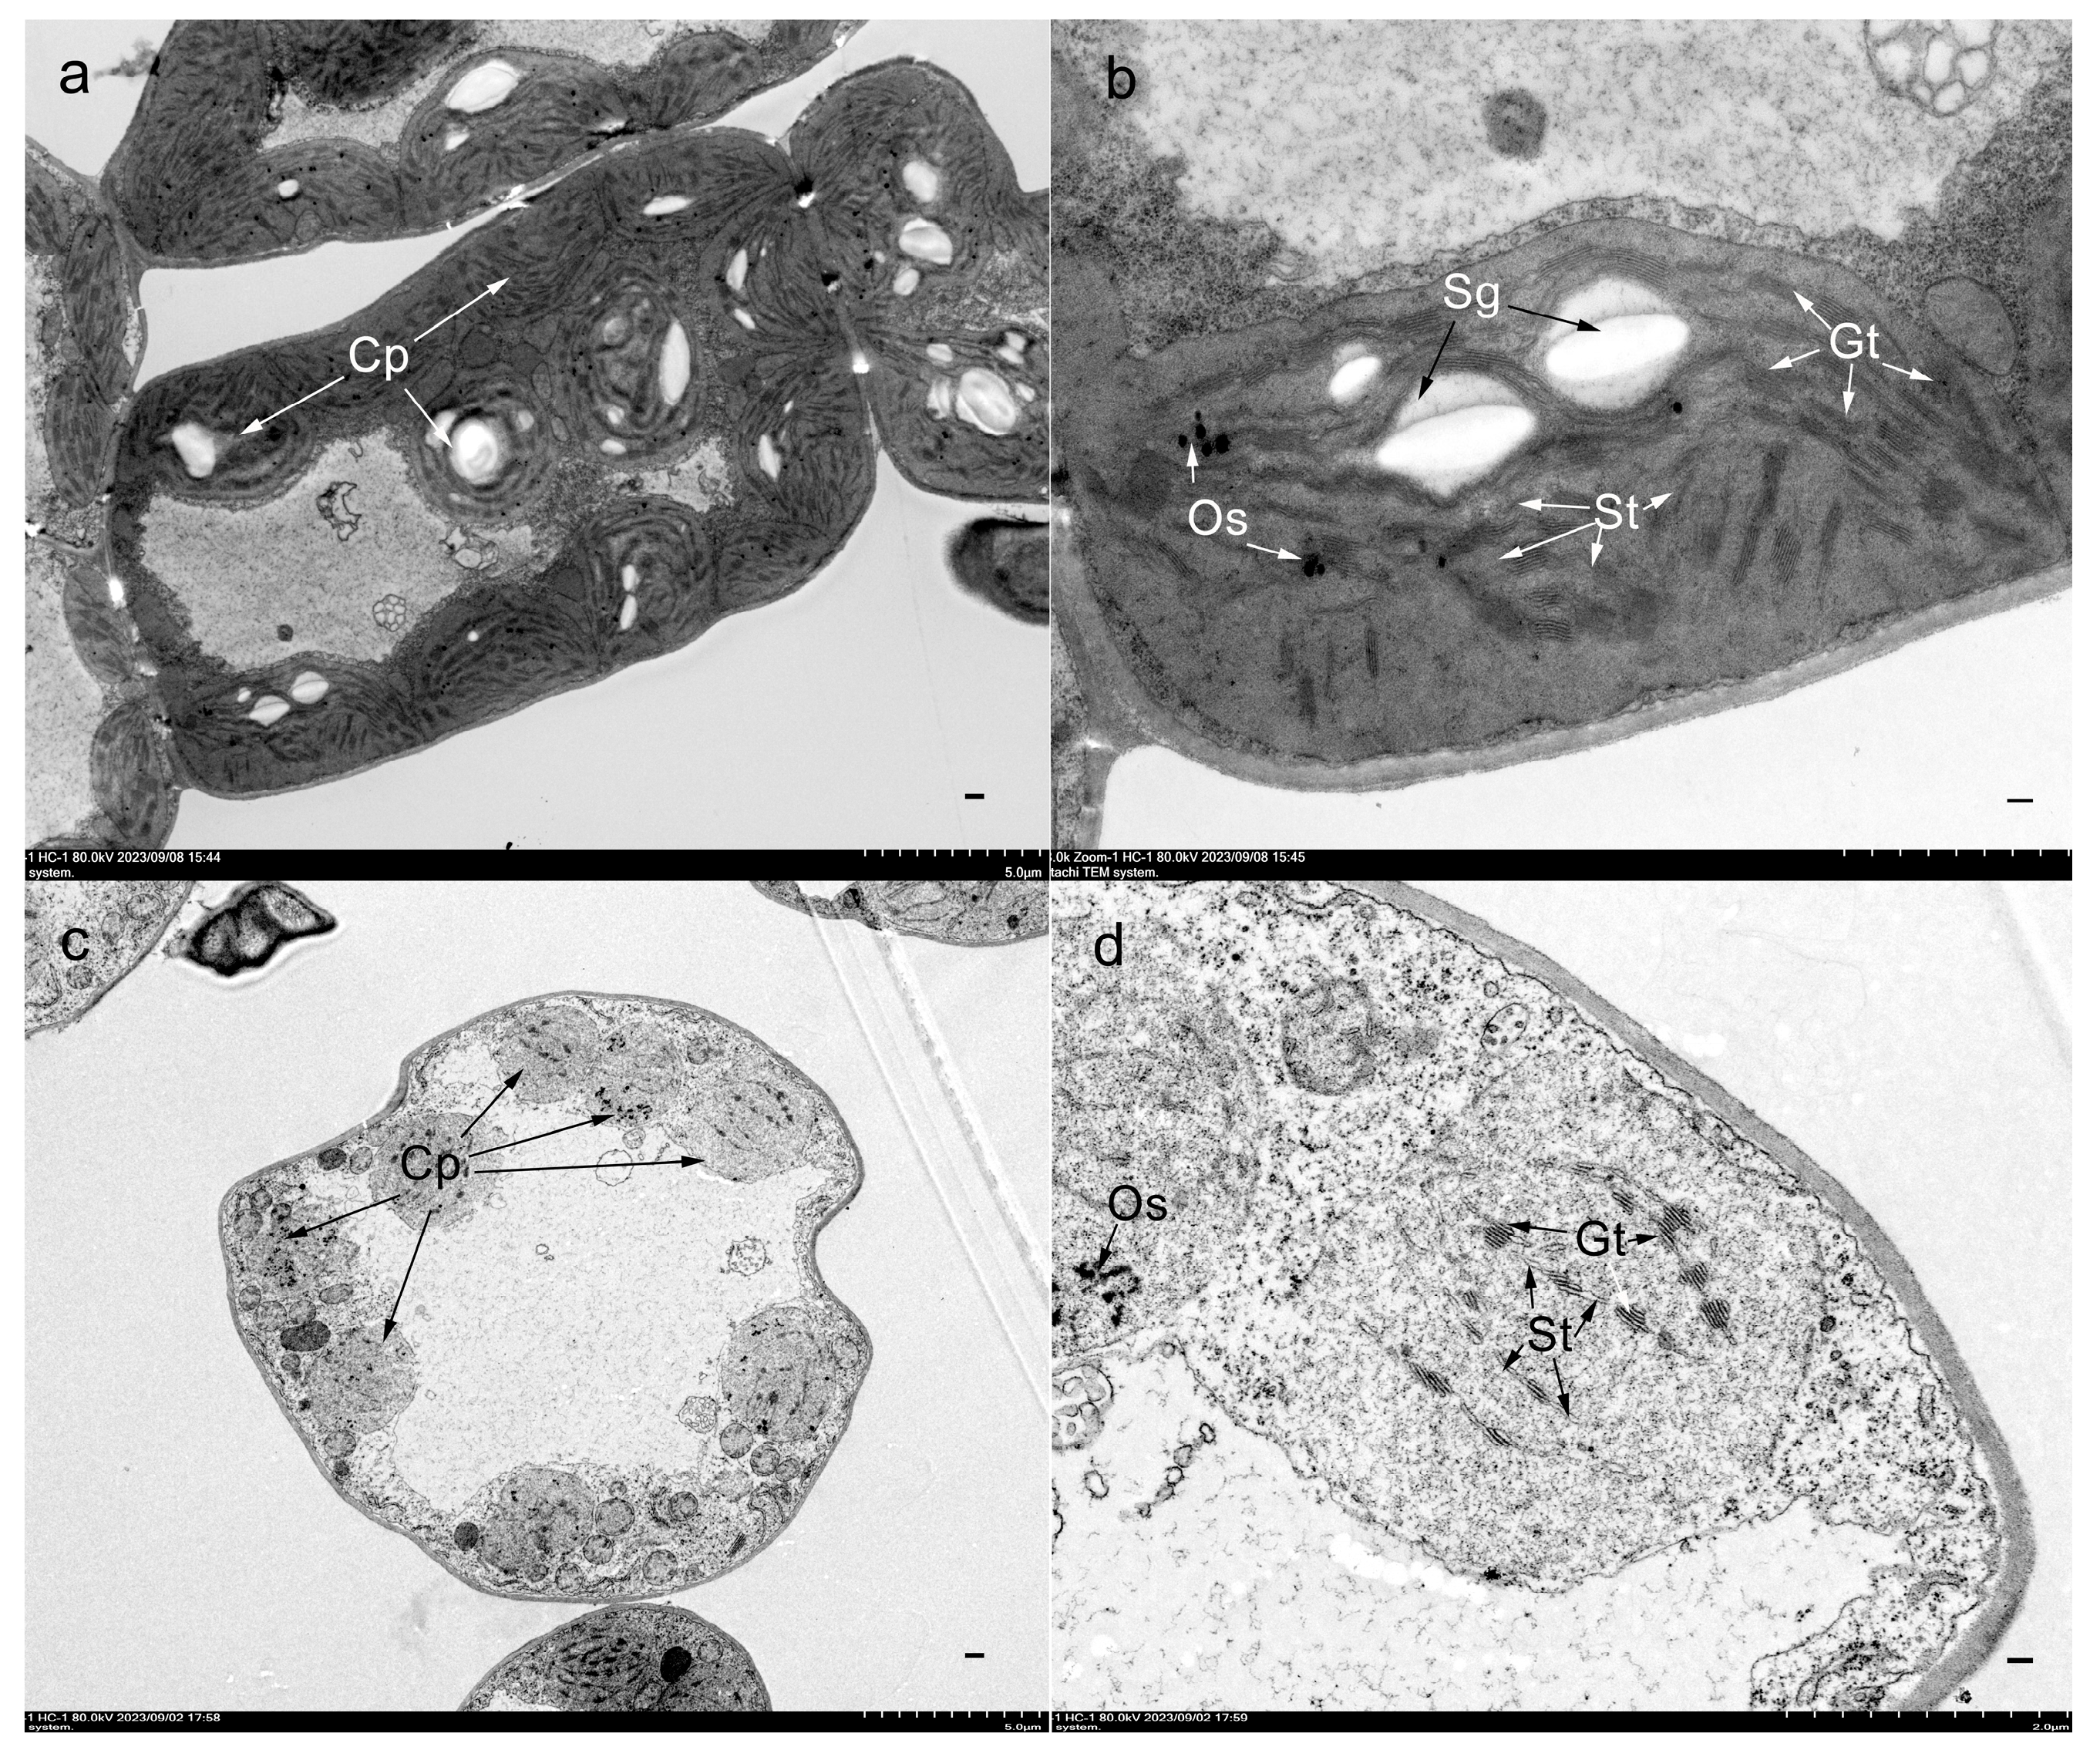
2.2. Chlorophyll Quantification and Transmission Electron Microscopy (TEM) Analysis

The chlorophyll content of the wild-type and mutant plants was directly measured in the field using the SPAD-502 Plus portable chlorophyll meter when the mutant leaves exhibited yellow. A total of ten plants were sampled for each material. The leaf tissue sections (5 mm × 3 mm) were collected from 2-week-old seedlings for transmission electron microscopy analysis. First, we used a pre-fixative solution on the sections with 2.5% (w/v) glutaraldehyde in 0.1 M sodium phosphate buffer (PBS, pH = 7.4) for 8 h at 4 °C. Following air extraction to aid in sinking, the sections underwent three washes using the same buffer. The samples were post-fixed in a 1% (w/v) osmic acid solution in 0.1 M PBS buffer (pH = 7.4) for 5 h. Afterward, samples were rinsed three times with the same buffer and dehydrated using a series of increasing concentrations of acetone (30–50–70–80–90–95–100–100%). After being permeated in a graded series of acetone embedding agents, the samples were embedded and polymerized in Spurr’s resin medium at 60 °C for 48 h. Before being stained with a 1% (w/v) solution of uranyl acetate and a 1% (w/v) solution of Reynolds’ lead citrate dye, the specimens were dehydrated with a graded series of acetone and cut into ultrathin slices [32]. An HT7700 Hitachi transmission electron microscope (Hitachi High Technology Corporation, Tokyo, Japan) was used for observation.

2.3. BSA-Seq

Resequencing was performed using the BSA technique. We used mutant phenotypic data from the F2:3 generation of the W82 × ytl cross to make the DNA pool for sequencing. The DNA pool comprised the same amount of DNA from 30 wild-type and mutant individuals. They were selected at F2:3 from a single F2 plant. After liquid nitrogen freezing, the genomic DNA for bulk was isolated from the soybean leaves using hexadecyltrimethylammonium bromide (CTAB) method [33]. The DNA samples were sent to Biomarker Technologies Co., Ltd. (Qingdao, China) to construct a paired-end sequencing library with an average sequencing depth of 30×.
The experiment was conducted following the typical methodology given by Illumina HiSeq® 2500 (Illumina Inc., San Diego, CA, USA) [34]. DNA was then modified with A at the 3′ end and linked with the sequencing adapter. It was fragmented using ultrasonic disruption. Afterward, agarose gel electrophoresis was employed to isolate DNA fragments with a size range of around 200~300 bp. These fragments were then subjected to PCR amplification to generate the sequencing library. The library that successfully underwent quality assessment was sequenced using the Illumina platform.

2.4. Quality Control and Analysis of Sequencing Data

The generated sequencing data have paired-end 150 base (PE150) reads, and the corresponding Q20 and Q30 are calculated using the sequencing Phred value (QPred) for each base error rate. The percentage of samples with sequencing greater than Q20 and Q30 is calculated to qualify the sequencing data of the sample. Paired-end sequencing reads were mapped to the soybean Williams 82 reference genome (Wm82.a2.v1, http://phytozome-next.jgi.doe.gov/info/Gmax_Wm82_a2_v1 (accessed on 4 August 2014)) using BWA software (Version: 0.7.17-r1188) with the default parameters [35]. Duplicated reads were filtered with the Picard package (picard.sourceforge.net, Version:1.87). The Genome Analysis Toolkit (GATK, Version 4.2.5.0) was used to identify single nucleotide polymorphisms (SNPs) and insertion and deletion (InDels) variations in both gene bulks with default parameters: ‘–filter-expression “QD < 2.0 || MQ < 40.0 || FS > 60.0 || SOR > 3.0 || MQRankSum < −12.5 || ReadPosRankSum < −8.0”’ [36]. The ANNOVAR package (Version: 2017-07-17) was used for the functional annotation of variants. The seven algorithms, including deep learning (DL), K values, ED4, ΔSNP index, SmoothG, SmoothLOD, and Ridit in DeepBSA software version 1.4 [37], were used to calculate candidate intervals associated with leaf color. Finally, the overlapped regions based on the above multi-methods were the most likely considered candidate intervals for leaf color.

2.5. Gene Mapping, Candidate Gene Prediction, and Clone

SSR markers within the primary mapping interval were used to screen for polymorphic markers between two bulks [38,39]. Then, the polymorphic markers were used to detect the genotype of recessive individuals in the F2:3 and F3:4 populations from the W82 × ytl cross. Based on the genotyping results, the target gene was mapped to a candidate interval flanked by SSR markers selected from SoyBase (http://www.soybase.org/ (accessed on 27 February 2004)) and Song et al. [40]. They were synthesized by General Biology Co., Ltd. (Hefei, China). The DNA was extracted from soybean leaves using a One Step Plant Direct PCR kit (Senweis Co., Ltd., Huai’an, China). The SSR-PCR process was performed as reported before [32]. The PCR reactions took 10 μL of DNA (10–100 ng) as the template, 2 × Taq Master Mix (Sangon Biotech Co., Ltd., Shanghai, China), and 0.4 μM (10 μM) each of the forward and reverse primers. The PCR thermal cycler was programmed for 30 s at 95 °C, 30 s at 55 °C, 30 s at 72 °C, and a final cycle of 5 min at 72 °C before cooling to 4 °C. PCR products were separated with a capillary electrophoresis system (Agilent ZAG DNA Analyzer, Agilent Technologies, Inc. Santa Clara, CA, USA).
The genes within the mapping interval were downloaded from the SoyBase (https://www.soybase.org/ (accessed on 4 August 2014)) website and annotated on the Phytozome (https://phytozome-next.jgi.doe.gov/ (accessed on 4 August 2014)) website. According to the functional annotation, the candidate gene conferring chlorophyll content and chloroplast development were predicted. The candidate genes were cloned as follows: 100–1000 ng genomic DNA and 25 μL 2 × Phanta Max Master Mix (Vazyme, P515, Nanjing, China) were added to a 50 μL mixture with 2 μL (10 μM) each of the forward and reverse primers, which were programmed for 30 s at 95 °C, 30 s at 58 °C, 2.5 min at 72 °C, and a final cycle of 10 min at 72 °C before cooling to 4 °C in PCR thermal cycler. The samples used for amplifying the candidate genes came from residual heterozygous lines with contrasting patterns. PCR products of candidate genes were separated with 1% agarose gels stained with GoldViewTM (Beijing Solarbio Science & Technology Co., Ltd. Beijing, China) and sequenced via Sanger (3730XL) DNA sequencing on an Applied Biosystems Automated 3730 DNA Analyzer (Applied Biosystems, Foster City, CA, USA).

3. Results

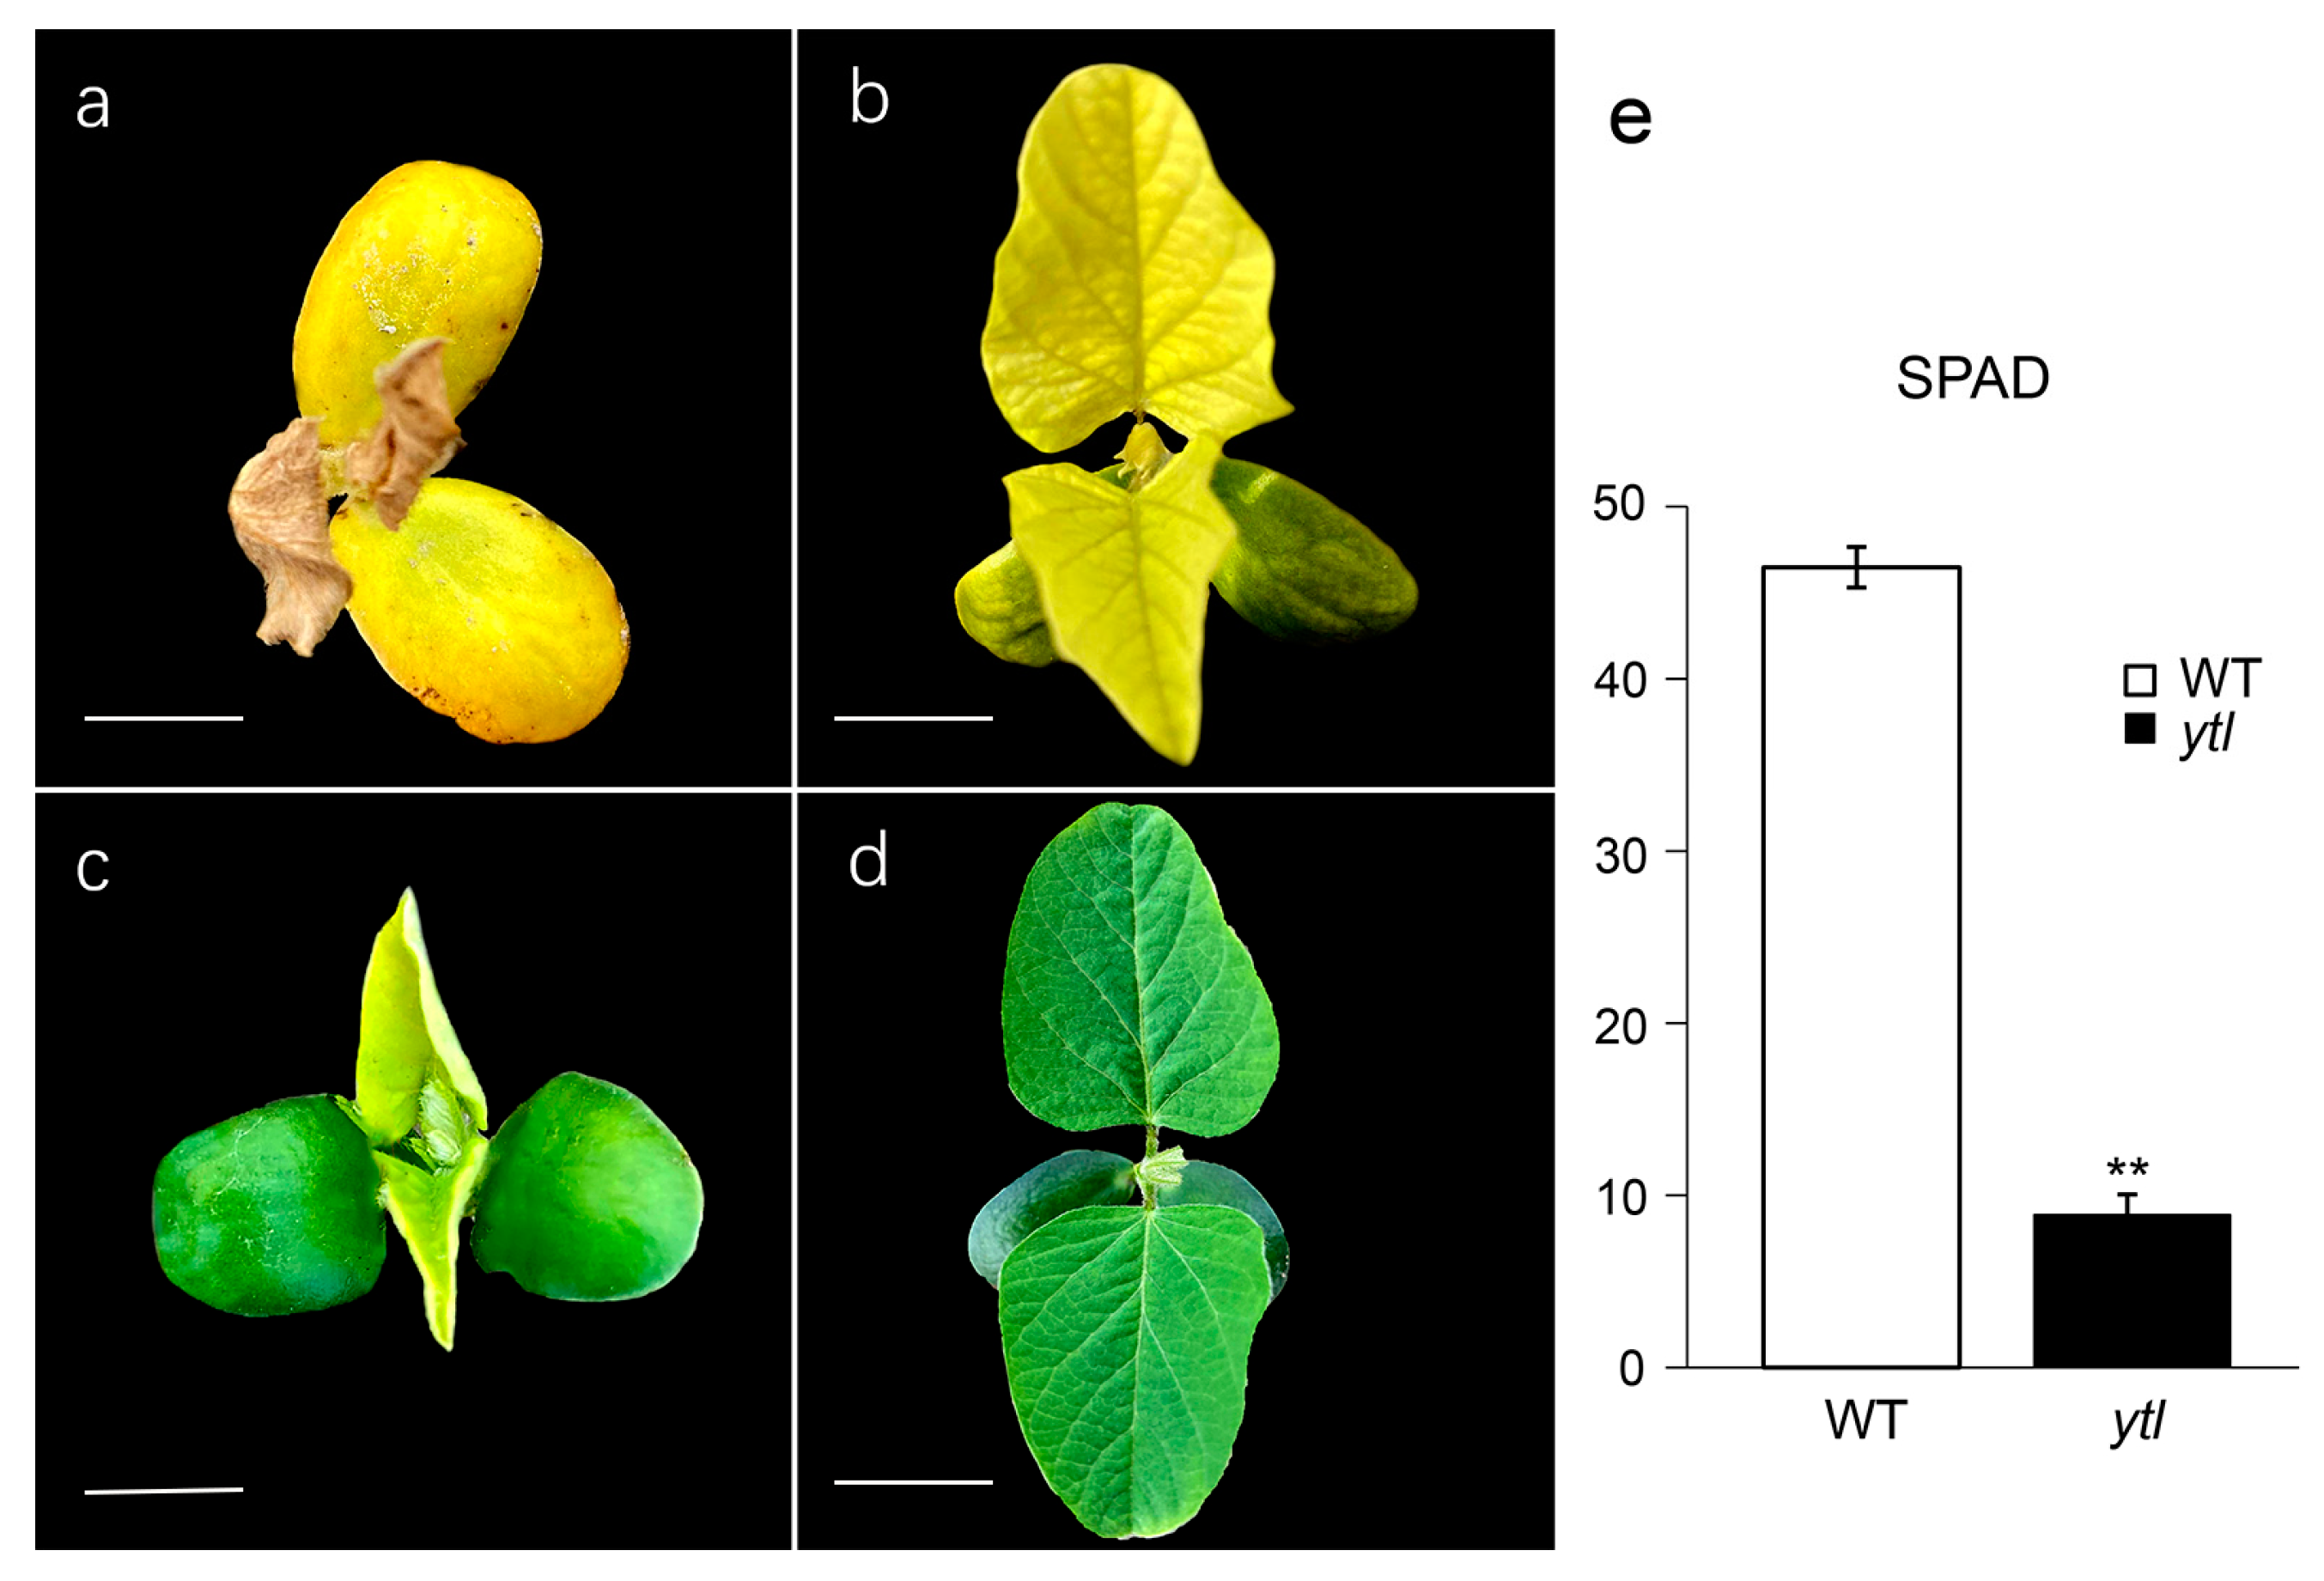
3.1. Characterization of the Mutant ytl

Under natural field conditions, the cotyledons of the wild type exhibited a green color (Figure 1d). In contrast, the ytl’s cotyledons were green and yellow (Figure 1a–c). However, all the true leaves of the ytl variant were consistently yellow. The seedlings exhibiting yellow cotyledons died rapidly (Figure 1a,b), whereas those displaying green cotyledons died gradually before reaching the first trifoliolate stage (Figure 1c). The chlorophyll content of both the wild type and mutant was measured in the field using portable chlorophyll meters during the true leaf stage. The mean chlorophyll content in wild-type leaves was 46.48, with a highest value of 47.6 and a lowest value of 44.9. The mean chlorophyll level in ytl leaves was 8.88, with a high of 11.1 and a minimum of 7.4. An analysis of variance revealed that the wild type had considerably greater relative chlorophyll content than the mutant plant (Figure 1e).
A transmission microscopy study revealed a higher abundance of chloroplasts with well-defined and intact membrane systems in the wild type than those with unclear and partial membrane systems in ytl (Figure 2a,c). The stroma lamellae in wild-type chloroplasts connect the grana structure. On the other hand, the stroma thylakoid was not easily visible in ytl chloroplasts, where the grana stack was smaller and more distorted (Figure 2b,d). Compared to the well-developed starch grains found in wild-type chloroplasts, the ytl chloroplasts could not produce starch grains (Figure 2b,d). Therefore, abnormalities in the formation of chloroplasts and decreases in chlorophyll could account for the ytl phenotype.

3.2. Genetic Analysis

It was observed that a segregating line of M7 derived from NN1138-2 treated with 60Coγ ray showed a 3:1 segregation ratio between the wild type and mutant (45:14, χ2 = 0.01 < χ20.05 = 3.84, p = 0.94). Then, the inheritance of phenotypes of F2 populations derived from the W82 × ytl cross was investigated (Table 1). Of the 208 plants, 46 exhibited a yellow leaf color, while the remaining 162 showed green. The statistical analysis using the chi-square test indicated a value of 0.78, less than the critical value of 3.84 at a significance level of 0.05, which fit the expected ratio of 3:1. These data revealed that a single recessive nuclear allele governed the yellow-to-lethal phenotype according to Mendelian laws of inheritance.

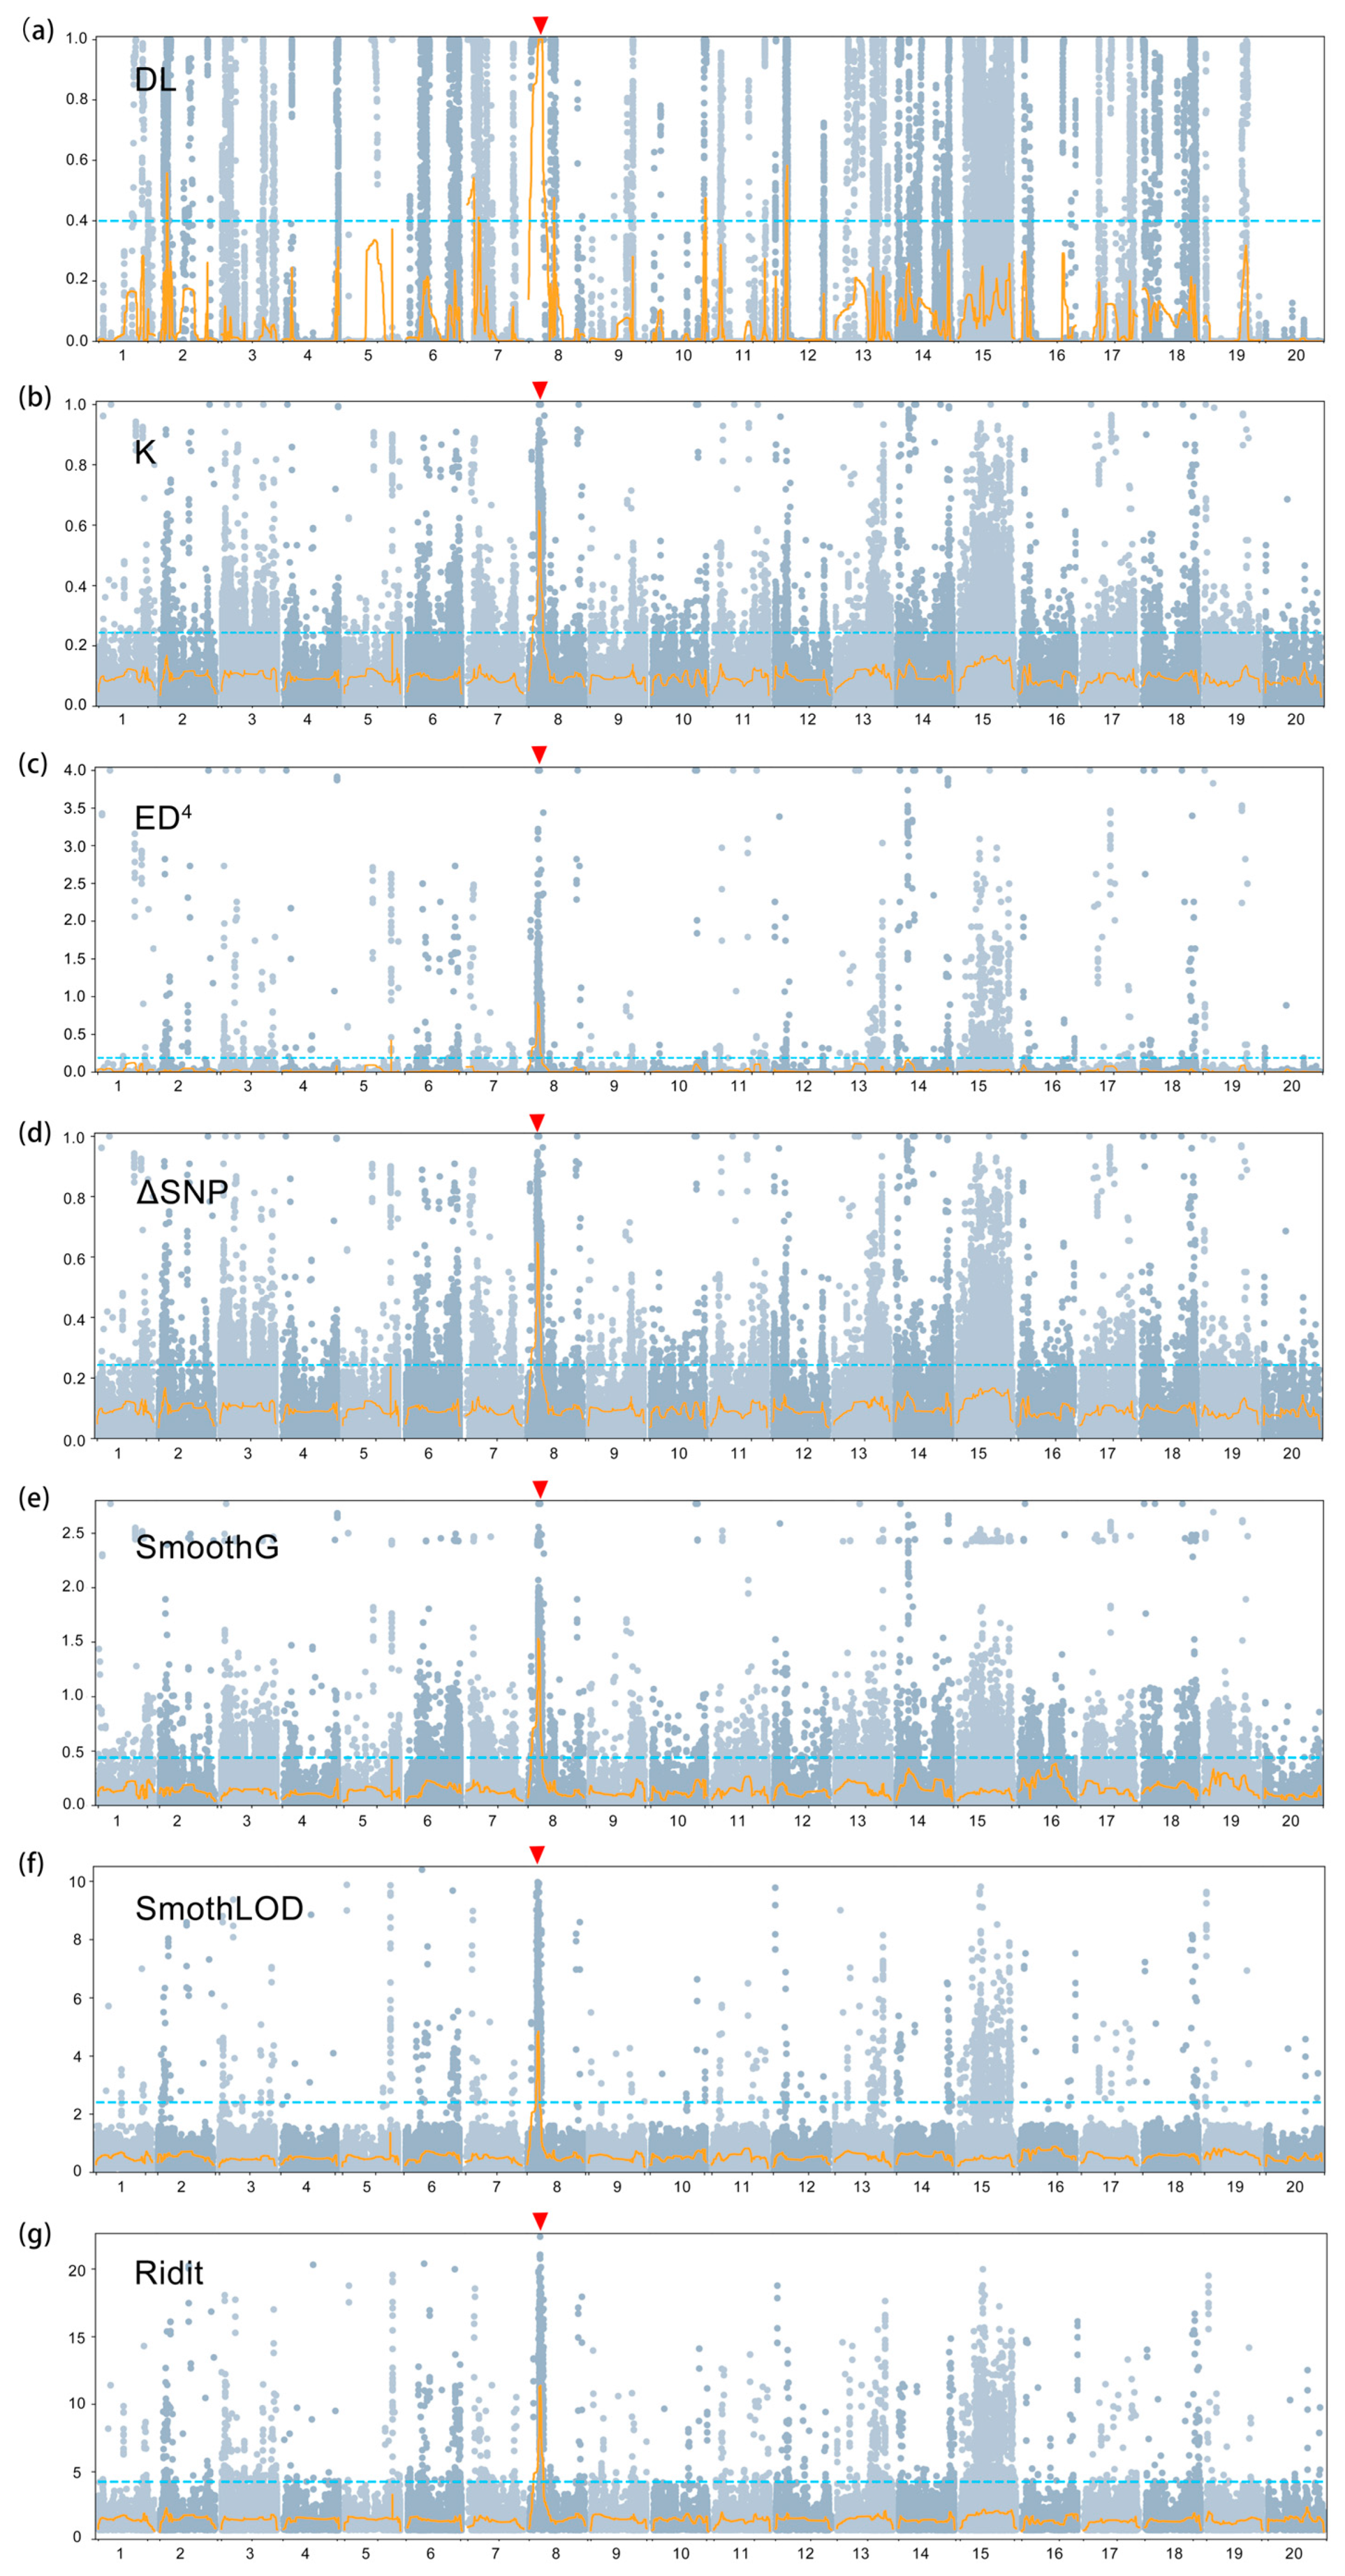
3.3. Analysis of BSA-Seq Quality

Thirty wild-type and thirty mutant plants from a segregating line of the F2:3 generation were selected, and constructed green leaf and yellow leaf bulks. Through library construction and next-generation resequencing, we obtained approximately 209.26 M clean reads and 62.32 Gb clean data, which were evaluated as shown in Table S1. After filtering, the data volumes of green and yellow leaf bulk were 27.72 G and 34.60 G, respectively. The correct base recognition rates of 99% (Q20) and 99.9% (Q30) reached 98% and 91% of the total bases, with a GC content of about 35%. The base quality and the GC content meet the requirements for further analysis.
The reference genome size of soybean Williams 82 is 955,932,237 bp. Each mapping rate of wild-type bulk and mutant bulk was 89.58% and 88.49%. The sequencing quality of each chromosome is presented in Table S2. The coverage of each chromosome in the green leaf gene bulk was between 96.9% and 98.3%, and the sequencing depth was between 24.9% and 31.8%. The coverage of each chromosome in the yellow leaf bulk was between 96.9% and 98.4%, and the sequencing depth was between 31.9% and 38.5%. The sequencing data met the criteria of resequencing analysis and were suitable for SNP and InDel testing.

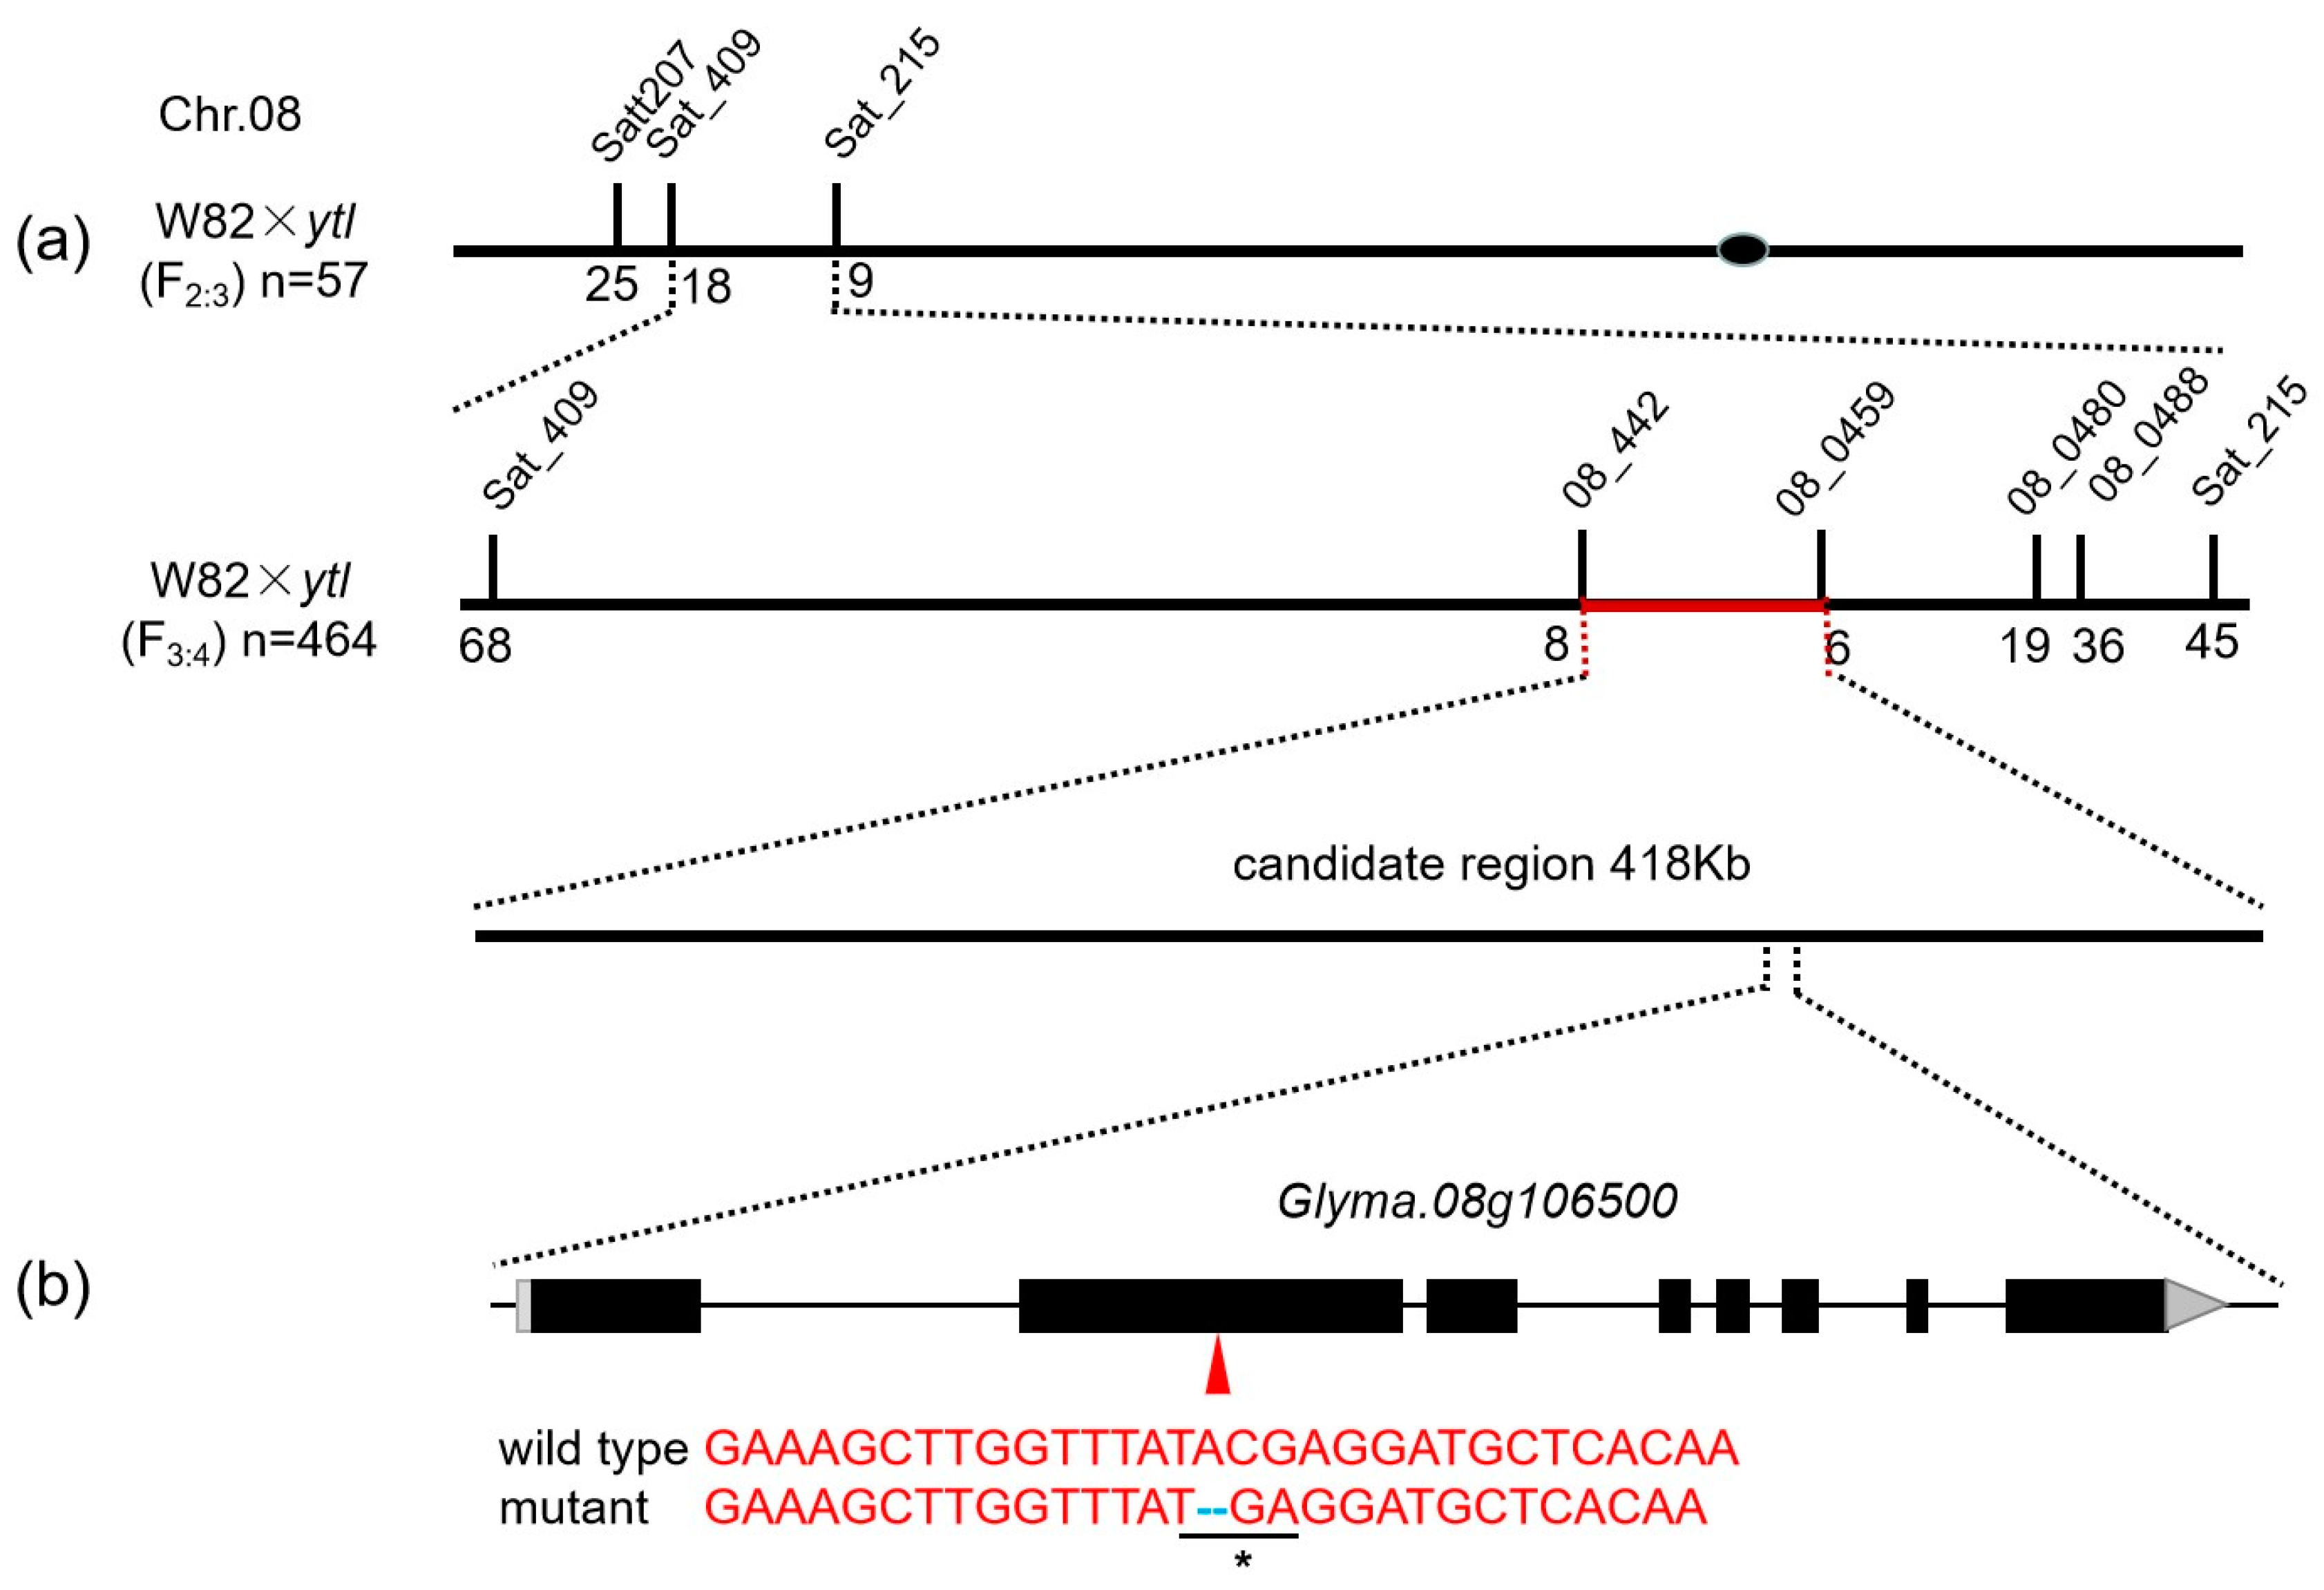
3.4. Preliminary Mapping Based on the BSA-Seq

Two bulks yielded 11,522,230 SNPs covered in the 20 soybean chromosomes. The seven algorithms included in DeepBSA software version 1.4 [37] were employed to compare the SNP frequency differences between the two bulks (ΔSNP index) and estimate the mapping region related to the leaf color. As shown in Figure 3 and Table S3, one predominant signal located on chromosome 8 was detected by all the algorithms. Taking the intersection of the seven algorithms, the mapping interval was anchored finally to the region between 7,435,009 and 10,766,043 with a peak of 8,758,861~9,666,879.

3.5. Fine Mapping by Using SSR Markers

During the preliminary mapping stage on chromosome 8, we examined sixteen SSR markers from the published SSR genetic map on SoyBase (http://soybase.org/ (accessed on 27 February 2004)) to identify polymorphic markers between the green leaf and ytl leaf bulks. Polymorphism was seen only in Satt207, Sat_409, and Sat_215 among the two bulks. The sequences of these polymorphic markers are provided in Table 2. Fifty-seven F2:3 mutant individuals were genotyped using the three markers. Figure 4 showed 25, 18, and 9 recombinant individuals for SSR markers Satt207, Sat_409, and Sat_215, respectively. Based on the genotyping results, the target gene was located between Sat_409 and Sat_215. Among the twenty-four newly acquired SSR markers from Song et al. [40] located between Sat_409 and Sat_215, only four markers showed a variation between the wild-type and mutant bulks (Table 2). A total of 464 F3:4 mutant individuals were genotyped using 4 markers. Among these, SSR markers BARCSOYSSR_08_0442, BARCSOYSSR_08_0459, BARCSOYSSR_08_0480, and BARCSOYSSR_08_0488 had 8, 6, 19, and 36 recombinant individuals, respectively. As a result, the ytl was narrowed down to a 418 kb region between BARCSOYSSR_08_0442 and BARCSOYSSR_08_459 markers containing 53 candidate genes.
By searching the Phytozome database (http://phytozome-next.jgi.doe.gov/pz/portal.html (accessed on 4 August 2014)), the functional annotation of the 53 genes was downloaded and is shown in Table 3, only 11 genes of which had SNPs or InDels within their exon regions according to the BSA-Seq results: Glyma.08g103200, Glyma.08g103300, Glyma.08g103400, Glyma.08g103700, Glyma.08g104000, Glyma.08g105400, Glyma.08g105600, Glyma.08g106500, Glyma.08g106700, Glyma.08g106900, and Glyma.08g107700. Among these genes was a two bp deletion in the exon of Glyma.08g106500, leading to a frameshift with amino acid sequence changes. Glyma.08g106500 encoded a PPR_long domain-containing protein and was an ortholog of AT5G27270 in Arabidopsis, whose T-DNA mutant showed a seedling-lethal and albino phenotype with the chloroplasts broken down [41]. However, according to the Arabidopsis orthologs, the mutations in the other 10 genes could not lead to a yellow-to-lethal phenotype. Then, we sequenced the genomic DNA sequence of Glyma.08g106500 between the wild type and mutant of a residual heterozygous line with three pairs of primers (Table 2), and a two bp deletion causing a frameshift and premature stop codon was observed in the second exon of mutant (Figure 4b). Then, the same deletion was detected in all 113 recombinant mutants from the segregating F3:4 population. Therefore, Glyma.08g106500 was predicted as the candidate gene for ytl.

4. Discussion

The BSA-Seq strategy can be applied to multiple populations with genetic differences and combined with traditional gene mapping or association analysis methods. Several soybean genes controlling development and traits related to stress resistance or quality were mapped based on BSA-Seq in recent years. Song et al. [42] identified two candidate genes controlling soybean cotyledon color through a next-generation sequencing (NGS)-based BSA approach and marker-based classical gene mapping. Zhong et al. [43] finely mapped RpsHC18 governing Phytophthora sojae resistance on soybean chromosome 3 based on QTL-seq, which was performed by the whole-genome resequencing (WGRS) of highly resistant and susceptible bulks from an F2:3 population. Ochar et al. [34] mapped the candidate gene conferring crinkled leaf phenotype based on BSA-Seq technology and promised Glyma.19G207100 would be a candidate gene. Zhang et al. [20] employed 1551 natural accessions with diverse worldwide origins to do BSA-Seq and identified 130 candidate genes underlying seed oil content in soybean. This research revealed that NGS-based BSA methods could be quickly and effectively used for mapping and mining agronomic traits and stress-resistance genes in soybean. DeepBSA is a deep learning-driven BSA method, and it is the first time deep learning has been applied to BSA for QTL detection or functional gene cloning [37]. DeepBSA outperforms all other algorithms regarding absolute deviation and the signal-to-noise ratio and performs well in various animal and plant databases. However, this method has yet to be reported in soybean. In the present study, green leaf and yellow leaf bulk from the F2:3 population of a biparental population (W82 × ytl) was constructed for BSA-Seq. According to the results of ΔSNP performed by DeepBSA, we detected the most probable gene linked to a region with a physical distance of about 3.33 Mb on chromosome 8. Then, the SSR markers were used to validate the preliminary intervals and narrow them down to a 418 Kb region between SSR markers BARCSOYSSR_08_0442 and BARCSOYSSR_08_459.
Many genes cause chlorophyll deficiency to lethality in plants, including nuclear and cytoplasmic genes, most of which are recessive nuclear genes involved in several pathways. Some genes participate in the biosynthesis and degradation of photosynthetic pigments pathway, and some genes are related to chloroplast development, viz., plastid-encoded RNA polymerase (PEP), posttranscriptional modification of plastid genes, nuclear-cytoplasmic signal transduction, and chloroplast protease. In Arabidopsis, the inactivation of ATAB2 leads to an albino phenotype, which strongly affects development and thylakoid membrane biogenesis because it damages proteins photosystem I and photosystem II [44]. The mutations in the G- or M-domain of atToc159 could cause a severe albino phenotype in Arabidopsis, and the atToc159 functions in the recognition and import of proteins into chloroplasts [45,46,47]. Moon et al. [48] reported that a T-DNA insertion in the OsPDF1B gene led to a seedling lethal phenotype in rice, which affected the development of chloroplasts and perhaps mitochondria. A single, nonsynonymous substitution in Glyma13g30560 encoding the Mg-chelatase subunit (ChlI1a) led to a chlorophyll-deficient and lethal phenotype in soybean [12]. A single base insertion in the GmPsbP, encoding an extrinsic photosystem II protein critical for oxygen evolution during photosynthesis, caused lethal yellow mutants [15].
The PPR proteins were characterized by a PPR repeat with highly degenerate units of 35 amino acids and participated in every step of chloroplast gene expression: transcription, RNA cleavage, RNA splicing, translation, and so on [49]. PPR mutants had various phenotypes attributed to little redundancy between family members, many related to leaf color mutants. A mutant of thylakoid assembly 8 (tha8) led to a phenotype of pale green and lethal seedling, and the gene encoded several PPR families [50]. As a chloroplast splicing factor, THA8 indirectly affected thylakoid energetics [50]. The LPA66-defect plant showed a high chlorophyll fluorescence phenotype and pale green leaf in Arabidopsis, and it is a chloroplast PPR protein editing psbF transcripts [51]. In this study, the mutant ytl showed a yellow-to-lethal phenotype with significantly decreased chlorophyll contents. TEM exhibited an abnormal chloroplast with a thylakoid structure mainly disrupted, indicating that the defects in chloroplast development caused the lethal phenotype. In the mapped region, a two bp deletion caused a frameshift mutation in Glyma.08g106500 of ytl. The Arabidopsis ortholog of Glyma.08g106500, AT5G27270, encodes a chloroplast-localized P-type PPR protein with the function of the splicing of group II introns. The T-DNA insertion mutant lost the chloroplast development with defective pigment and seedling-lethal phenotype [41]. Thus, based on the results of gene mapping and the similar mutant phenotype in soybean and Arabidopsis, the PPR-encoded gene Glyma.08g106500 was a promising candidate for mutant ytl. Further functional verification will be performed in the future.

5. Conclusions

In the present study, we identified a soybean yellow-to-lethal mutant, ytl, which showed a seedling-lethal phenotype and a significant decrease in chlorophyll content. The ytl showed developmental defects in the chloroplast membrane system and could not form starch granules. Genetic analysis showed that the phenotype of the mutant was controlled by a recessive allele, which was mapped to a 418 Kb interval flanked by SSR markers BARCSOYSSR_08_0442 and BARCSOYSSR_08_459 with 53 candidate genes. According to sequencing results, a two bp deletion in the second exon of Glyma.08g106500 led to a frameshift mutation with a premature stop codon. Glyma.08g106500 is a strong candidate for ytl because of the similar functions of its ortholog in Arabidopsis, whose T-DNA mutant showed a seedling-lethal and albino phenotype with the chloroplasts broken down. Glyma.08g106500 encodes a PPR_long domain-containing protein, which plays a vital role in the transcription and translation of proteins involved in chloroplast development. Further study of Glyma.08g106500, such as gene expression, identification of interacting proteins, and the regulation of downstream genes, may provide a better understanding of the assembly of chloroplast developmental proteins.

Supplementary Materials

The following supporting information can be downloaded at: https://www.mdpi.com/article/10.3390/agronomy14010185/s1. Table S1: Statistical analysis on sequencing data quality; Table S2: Matching of quality control data with reference genome; Table S3: Mapping regions by different algorithms based on DeepBSA.

Author Contributions

Conceptualization, Y.W. and T.Z.; data curation, Y.W. and F.C.; investigation, S.L., M.F. and H.X.; resources, G.M.A.A.; writing—original draft preparation, Y.W.; writing—review and editing, F.C. and G.M.A.A.; visualization, X.Y. and Z.Z.; supervision, T.Z. and H.X.; funding acquisition, Y.W., T.Z. and H.X. All authors have read and agreed to the published version of the manuscript.

Funding

This research was funded by the National Natural Science Foundation of China (32201729), the Scientific Research Fund of Startup and Development for Introduced High-level Talents, Huai’an Academy of Agricultural Sciences, China (0112023014B), the Research and Development Fund Project of Huai’an Academy of Agricultural Sciences, China (HNY202221), the Core Technology Development for Breeding Program of Jiangsu Province (JBGS [2021]057), and the Jiangsu Collaborative Innovation Center for Modern Crop Production (JCIC-MCP) Program.

Data Availability Statement

The raw data of BSA-Seq can be downloaded from NCBI with the BioProject ID PRJNA1061757. The sequences for the candidate gene in wild type and mutant (PP098297 and PP098298) can be searched at NCBI when the paper is published.

Conflicts of Interest

The authors declare no conflict of interest.

References

  1. Sharrock, R.A.; Parks, B.M.; Koornneef, M.; Quail, P.H. Molecular analysis of the phytochrome deficiency in an aurea mutant of tomato. Mol. Gen. Genet. (MGG) 1988, 213, 9–14. [Google Scholar] [CrossRef]
  2. Kato, K.K.; Palmer, R.G. Duplicate chlorophyll-deficient loci in soybean. Genome 2004, 47, 190–198. [Google Scholar] [CrossRef] [PubMed]
  3. Palmer, R.G.; Nelson, R.L.; Bernard, R.L.; Stelly, D.M. Genetics and linkage of three chlorophyll-deficient mutants in soybean: y19, y22, and y23. J. Hered. 1990, 81, 404–406. [Google Scholar] [CrossRef]
  4. Palmer, R.G.; Burzlaff, J.D.; Shoemaker, R.C. Genetic analyses of two independent chlorophyll-deficient mutants identified among the progeny of a single chimeric foliage soybean plant. J. Hered. 2000, 91, 297–303. [Google Scholar] [CrossRef] [PubMed]
  5. Davis, S.J.; Kurepa, J.; Vierstra, R.D. The Arabidopsis thaliana HY1 locus, required for phytochrome-chromophore biosynthesis, encodes a protein related to heme oxygenases. Proc. Natl. Acad. Sci. USA 1999, 96, 6541–6546. [Google Scholar] [CrossRef]
  6. Ki-Hong, J.; Junghe, H.; Choong-Hwan, R.; Youngju, C.; Yong-Yoon, C.; Akio, M.; Hirochika, H.; An, G. Characterization of a rice chlorophyll-deficient mutant using the T-DNA gene-trap system. Plant Cell Physiol. 2003, 44, 463–472. [Google Scholar] [CrossRef]
  7. Sakuraba, Y.; Rahman, M.L.; Cho, S.H.; Kim, Y.S.; Koh, H.J.; Yoo, S.C.; Paek, N.C. The rice faded green leaf locus encodes protochlorophyllide oxidoreductaseb and is essential for chlorophyll synthesis under high light conditions. Plant J. 2013, 74, 122–133. [Google Scholar] [CrossRef]
  8. Gu, J.; Zhou, Z.; Li, Z.; Chen, Y.; Wang, Z.; Zhang, H. Rice (Oryza sativa L.) with reduced chlorophyll content exhibit higher photosynthetic rate and efficiency, improved canopy light distribution, and greater yields than normally pigmented plants. Field Crops Res. 2017, 200, 58–70. [Google Scholar] [CrossRef]
  9. Liu, M.; Wang, Y.; Nie, Z.; Gai, J.; Bhat, J.A.; Kong, J.J.; Zhao, T. Double mutation of two homologous genes yl1 and yl2 results in a leaf yellowing phenotype in soybean [Glycine max (L.) Merr]. Plant Mol. Biol. 2020, 103, 527–543. [Google Scholar] [CrossRef]
  10. Sandhu, D.; Coleman, Z.; Atkinson, T.; Krishan, M.R.; Mendu, V. Genetics and physiology of the nuclearly inherited yellow foliar mutants in soybean. Front. Plant Sci. 2018, 9, 471. [Google Scholar] [CrossRef]
  11. Weber, C.R.; Weiss, M.G. Chlorophyll mutant in soybeans provides teaching aid. J. Hered. 1959, 50, 53–54. [Google Scholar] [CrossRef]
  12. Campbell, B.W.; Mani, D.; Curtin, S.J.; Slattery, R.A.; Stupar, R.M. Identical substitutions in magnesium chelatase paralogs result in chlorophyll-deficient soybean mutants. G3-Genes Genom. Genet. 2015, 5, 123–131. [Google Scholar] [CrossRef] [PubMed]
  13. Noble, R.D.; Czarnota, C.D.; Cappy, J.J. Morphological and physiological characteristics of an achlorophyllous mutant soybean variety sustained to muturation via grafting. Am. J. Bot. 1977, 64, 1042–1045. [Google Scholar] [CrossRef]
  14. Reed, S.; Atkinson, T.; Gorecki, C.; Espinosa, K.; Przybylski, S.; Goggi, A.S.; Palmer, R.G.; Sandhu, D. Candidate gene identification for a lethal chlorophyll-deficient mutant in soybean. Agronomy 2014, 4, 462–469. [Google Scholar] [CrossRef]
  15. Sandhu, D.; Atkinson, T.; Noll, A.; Johnson, C.; Espinosa, K.; Boelter, J.; Abel, S.; Balpreet, K.; Dhatt, B.K.; Barta, T.; et al. Soybean proteins GmTic110 and GmPsbP are crucial for chloroplast development and function. Plant Sci. 2016, 252, 76–87. [Google Scholar] [CrossRef] [PubMed]
  16. Schneeberger, K.; Ossowski, S.; Lanz, C.; Juul, T.; Petersen, A.H.; Nielsen, K.L.; Jrgensen, J.-E.; Weigel, D.; Andersen, S.U. SHOREmap: Simultaneous mapping and mutation identification by deep sequencing. Nat. Methods 2009, 6, 550–551. [Google Scholar] [CrossRef]
  17. Baek, G.; Kim, C.W.; Kim, S. Development of a molecular marker tightly linked to the C locus conferring a white bulb color in onion (Allium cepa L.) using bulked segregant analysis and RNA-Seq. Mol. Breed. 2017, 37, 94. [Google Scholar] [CrossRef]
  18. Yu, J.; Holland, J.B.; McMullen, M.D.; Buckler, E.S. Genetic design and statistical power of nested association mapping in maize. Genetics 2008, 178, 539–551. [Google Scholar] [CrossRef]
  19. Kover, P.X.; Valdar, W.; Trakalo, J.; Scarcelli, N.; Ehrenreich, I.M.; Purugganan, M.D.; Durrant, C.; Mott, R. A multiparent advanced generation inter-cross to fine-map quantitative traits in Arabidopsis thaliana. PLoS Genet. 2009, 5, e1000551. [Google Scholar] [CrossRef]
  20. Zhang, S.; Abdelghany, A.M.; Azam, M.; Qi, J.; Li, J.; Feng, Y.; Liu, Y.; Feng, H.; Ma, C.; Gebregziabher, B.S.; et al. Mining candidate genes underlying seed oil content using BSA-seq in soybean. Ind. Crops Prod. 2023, 194, 116308. [Google Scholar] [CrossRef]
  21. Zou, C.; Wang, P.; Xu, Y. Bulked sample analysis in genetics, genomics and crop improvement. Plant Biotechnol. J. 2016, 14, 1941–1955. [Google Scholar] [CrossRef] [PubMed]
  22. Abe, A.; Kosugi, S.; Yoshida, K.; Natsume, S.; Takagi, H.; Kanzaki, H.; Matsumura, H.; Yoshida, K.; Mitsuoka, C.; Tamiru, M.; et al. Genome sequencing reveals agronomically important loci in rice using MutMap. Nat. Biotechnol. 2012, 30, 174–178. [Google Scholar] [CrossRef]
  23. Takagi, H.; Tamiru, M.; Abe, A.; Takagi, H.; Tamiru, M.; Abe, A.; Yoshida, K.; Uemura, A.; Yaegashi, H.; Obara, T.; et al. MutMap accelerates breeding of a salt-tolerant rice cultivar. Nat. Biotechnol. 2015, 33, 445–449. [Google Scholar] [CrossRef] [PubMed]
  24. Frouin, J.; Filloux, D.; Taillebois, J.; Grenier, C.; Montes, F.; Lamotte, F.D.; Verdeil, J.; Courtois, B.; Ahmadi, N. Positional cloning of the rice male sterility gene ms-IR36, widely used in the inter-crossing phase of recurrent selection schemes. Mol. Breed. 2014, 33, 555–567. [Google Scholar] [CrossRef]
  25. Rodriguez-Uribe, L.; Higbie, S.M.; Stewart, J.M.; Wilkins, T.; Lindemann, W.; Sengupta-Gopalan, C.; Zhang, J. Identification of salt responsive genes using comparative microarray analysis in Upland cotton (Gossypium hirsutum L.). Plant Sci. 2011, 180, 461–469. [Google Scholar] [CrossRef]
  26. Klein, H.; Xiao, Y.; Conklin, P.A.; Govindarajulu, R.; Kelly, J.A.; Scanlon, M.J.; Whipple, C.J.; Bartlett, M. 2018. Bulked-segregant analysis coupled to whole genome sequencing (BSA-Seq) for rapid gene cloning in maize. G3-Genes Genom. Genet. 2018, 8, 3583–3592. [Google Scholar] [CrossRef]
  27. Forrest, K.; Pujol, V.; Bulli, P.; Pumphrey, M.; Wellings, C.; Herrera-Foessel, S.; Huerta-Espino, J.; Singh, R.; Lagudah, E.; Hayden, M.; et al. Development of a SNP marker assay for the Lr67 gene of wheat using a genotyping by sequencing approach. Mol. Breed. 2014, 34, 2109–2118. [Google Scholar] [CrossRef]
  28. Livaja, M.; Wang, Y.; Wieckhorst, S.; Haseneyer, G.; Seidel, M.; Hahn, V.; Knapp, S.J.; Taudien, S.; Schön, C.-C.; Bauer, E. BSTA: A targeted approach combines bulked segregant analysis with next-generation sequencing and de novo transcriptome assembly for SNP discovery in sunflower. BMC Genom. 2013, 14, 628. [Google Scholar] [CrossRef]
  29. Al Amin, G.M.; Kong, K.; Sharmin, R.A.; Kong, J.; Bhat, J.A.; Zhao, T. Characterization and Rapid Gene-Mapping of Leaf Lesion Mimic Phenotype of spl-1 Mutant in Soybean (Glycine max (L.) Merr.). Int. J. Mol. Sci. 2019, 20, 2193. [Google Scholar] [CrossRef]
  30. Galya, K.; Yael, B.; Adi, F.D.; Abhinandan, P.; Ilan, H.; Ran, H. Fine-mapping the branching habit trait in cultivated peanut by combining bulked segregant analysis and high-throughput sequencing. Front. Plant Sci. 2017, 8, 467. [Google Scholar] [CrossRef]
  31. Pearson, K.X. On the criterion that a given system of deviations from the probable in the case of a correlated system of variables is such that it can be reasonably supposed to have arisen from random sampling. Philos. Mag. 1900, 50, 157–175. [Google Scholar] [CrossRef]
  32. Wang, Y.; Liu, M.; Ge, D.; Bhat, J.A.; Li, Y.; Kong, J.; Liu, K.; Zhao, T. Hydroperoxide lyase modulates defense response and confers lesion-mimic leaf phenotype in soybean (Glycine max (L.) merr.). Plant J. 2020, 104, 1315–1333. [Google Scholar] [CrossRef]
  33. Porebski, S.; Bailey, L.G.; Baum, B.R. Modification of a CTAB DNA extraction protocol for plants containing high polysaccharide and polyphenol components. Plant Mol. Biol. Rep. 1997, 15, 8–15. [Google Scholar] [CrossRef]
  34. Ochar, K.; Bo-Hong, S.U.; Zhou, M.; Liu, Z.; Gao, H.; Flamlom, S.; Qiu, L. Identification of the genetic locus associated with the crinkled leaf phenotype in a soybean (Glycine max L.) mutant by BSA-Seq technology. J. Integr. Agric. 2022, 21, 3524–3539. [Google Scholar] [CrossRef]
  35. Li, H.; Durbin, R. Fast and accurate short read alignment with Burrows–Wheeler transform. Bioinformatics 2009, 25, 1754–1760. [Google Scholar] [CrossRef]
  36. McKenna, A.; Hanna, M.; Banks, E.; Sivachenko, A.; Cibulskis, K.; Kernytsky, A.; Garimella, K.; Altshuler, D.; Gabriel, S.; Daly, M.; et al. The Genome Analysis Toolkit: A MapReduce framework for analyzing next-generation DNA sequencing data. Genome Res. 2010, 20, 1297–1303. [Google Scholar] [CrossRef]
  37. Li, Z.; Chen, X.; Shi, S.; Zhang, H.; Wang, X.; Chen, H.; Li, W.; Li, L. DeepBSA: A deep-learning algorithm improves bulked segregant analysis for dissecting complex traits. Mol. Plant 2022, 15, 1418–1427. [Google Scholar] [CrossRef]
  38. Wang, Y.; Chen, W.; Zhang, Y.; Liu, M.; Kong, J.; Yu, Z.; Jaffer, A.M.; Gai, J.; Zhao, T. Identification of two duplicated loci controlling a disease-like rugose leaf phenotype in soybean. Crop Sci. 2016, 56, 1611–1618. [Google Scholar] [CrossRef]
  39. Garzon, L.N.; Blair, M.W. Development and mapping of SSR markers linked to resistance-gene homologue clusters in common bean. Crop J. 2014, 2, 183–194. [Google Scholar] [CrossRef]
  40. Song, Q.; Jia, G.; Zhu, Y.; Grant, D.; Nelson, R.T.; Hwang, E.Y.; Hyten, D.L.; Cregan, P.B. Abundance of SSR motifs and development of candidate polymorphic SSR markers (BARCSOYSSR_1.0) in soybean. Crop Sci. 2010, 50, 1950–1960. [Google Scholar] [CrossRef]
  41. Wang, X.; Zhao, L.; Man, Y.; Li, X.; Xiao, J. Pdm4, a pentatricopeptide repeat protein, affects chloroplast gene expression and chloroplast development in Arabidopsis thaliana. Front. Plant Sci. 2020, 11, e1198. [Google Scholar] [CrossRef]
  42. Song, J.; Li, Z.; Liu, Z.; Guo, Y.; Qiu, L. Next-generation sequencing from bulked-segregant analysis accelerates the simultaneous identification of two qualitative genes in soybean. Front. Plant Sci. 2017, 8, e919. [Google Scholar] [CrossRef] [PubMed]
  43. Zhong, C.; Sun, S.; Li, Y.; Duan, C.; Zhu, Z. Next-generation sequencing to identify candidate genes and develop diagnostic markers for a novel phytophthora resistance gene, RpsHC18, in soybean. Theor. App. Genet. 2018, 131, 525–538. [Google Scholar] [CrossRef]
  44. Barneche, F.; Winter, V.; Crèvecoeur, M.; Rochaix, J.D. ATAB2 is a novel factor in the signalling pathway of light-controlled synthesis of photosystem proteins. Embo J. 2014, 25, 5907–5918. [Google Scholar] [CrossRef] [PubMed]
  45. Bauer, J.; Hiltbrunner, A.; Weibel, P.; Vidi, P.A.; Alvarez-Huerta, M.; Smith, M.D.; Schnell, D.J.; Kessler, F. Essential role of the G-domain in targeting of the protein import receptor atToc159 to the chloroplast outer membrane. J. Cell Biol. 2002, 159, 845–854. [Google Scholar] [CrossRef] [PubMed]
  46. Lee, K.H.; Kim, S.J.; Lee, Y.J.; Jin, J.B.; Hwang, I. The M domain of atToc159 plays an essential role in the import of proteins into chloroplasts and chloroplast biogenesis. J. Biol. Chem. 2003, 278, 36794–36805. [Google Scholar] [CrossRef]
  47. Agne, B.; Infanger, S.; Wang, F.; Hofstetter, V.; Rahim, G.; Martin, M.; Lee, D.W.; Hwang, I.; Schnell, D.; Kessler, F. A Toc159 import receptor mutant, defective in hydrolysis of GTP, supports preprotein import into chloroplasts. J. Biol. Chem. 2009, 284, 8670–8679. [Google Scholar] [CrossRef]
  48. Moon, S.; Giglione, C.; Lee, D.Y.; An, S.; Jeong, D.H.; Meinnel, T.; An, G. Rice peptide deformylase PDF1B is crucial for development of chloroplasts. Plant Cell Physiol. 2008, 49, 1536–1546. [Google Scholar] [CrossRef]
  49. Barkan, A.; Small, I. Pentatricopeptide pepeat proteins in plants. Annu. Rev. Plant Biol. 2014, 65, 415–442. [Google Scholar] [CrossRef]
  50. Khrouchtchova, A.; Monde, R.A.; Barkan, A. A short PPR protein required for the splicing of specific group II introns in angiosperm chloroplasts. RNA 2012, 18, 1197–1209. [Google Scholar] [CrossRef]
  51. Cai, W.; Ji, D.; Peng, L.; Guo, J.; Ma, J.; Zou, M.; Lu, C.; Zhang, L. LPA66 is required for editing psbF chloroplast transcripts in Arabidopsis. Plant Physiol. 2009, 150, 1260–1271. [Google Scholar] [CrossRef] [PubMed]
Figure 1. Phenotypes of wild type and ytl mutant in the field. (ac). Phenotypes of ytl mutant with different cotyledon color; (d) phenotypes of wild type; (e) chlorophyll content in the true leaves of wild type and ytl mutant. Bars: 1 cm. The significant test was carried out by the student’s t-test (**: p ≤ 0.01). Each value represents an average of ten replicates. Values are expressed as mean ± SD.
Agronomy 14 00185 g001
Figure 2. Ultrastructure of chloroplast in wild type and ytl mutant. The thylakoid membrane organization in the chloroplasts of wild type (a,b) and ytl (c,d). Bars: 5 μm (a,c); 2 μm (b,d). Well-developed chloroplast in wild type and abnormal chloroplasts in ytl mutant. Each component was marked with arrows. Cp, chloroplast; Gt, grana thylakoid (stacked); St, stromal thylakoid (unstacked); Sg, starch granule. Os, osmiophilic granule.
Agronomy 14 00185 g002
Figure 3. Mapping intervals of yellow-to-lethal locus based on the different algorithms in DeepBSA. The x-axis represents the soybean genome chromosome, and the y-axis represents the association value of the SNPs calculated by the algorithm. Each gray dot represents the position and association value of an SNP, the yellow line is a Tri-kernel smooth fitting for all dots, the blue line is the default threshold, which is three standard deviations above the genome-wide median, and the red triangle indicates the mapping interval identified by the algorithms. (a) DL algorithm; (b) K algorithm; (c) ED4 algorithm; (d) ΔSNP index algorithm; (e) SmoothG algorithm; (f) SmoothLOD algorithm; (g) Ridit algorithm.
Agronomy 14 00185 g003
Figure 4. Map-based cloning of ytl with SSR markers. (a) Gene mapping of ytl on chromosome 8 using F2:3 and F3:4 populations of W82 × ytl. (b) Schematic diagram of Glyma.08g106500 gene structure and variation in the wild type and mutant. There is a two bp deletion in the second exon of mutant ytl. The red triangle indicates the approximate position of the deletion in mutant ytl. Asterisk indicates the stop codon.
Agronomy 14 00185 g004
Table 1. Chi-square tests of wild-type and mutant plants of F2 population of W82 × ytl cross.
PopulationTotal No. of PlantsNo. of Green Leaf PlantsNo. of Yellow-to-Lethal PlantsExpected Ratioχ2 (3:1)p
F2 (W82 × ytl)208162463:10.780.38
Table 2. Polymorphic SSR markers for the genetic linkage map of the ytl mutant gene.
Primer NameForward Primer Sequence (5′-3′)Reverse Primer Sequence (5′-3′)
Satt207GCGTTTTTCTCATTTTGATTCCTAAACGCGATTGTGATTGTAGTCCCTAAA
Sat_409GCGGAGGTTTGTGCATTTCTAGGTCTTCGCGACGCGTATGTACATAAAATATGCTGTT
Sat_215GCGTAGCAACAAAGCAATCTACAGGCGTCCCATTTTATTCCACACTATGTAAT
BARCSOYSSR_08_0442GAAACGGTTGGAGAATAGCGTCCATGCCCACTTAACAACA
BARCSOYSSR_08_0459CAACTTTCGCATCGGTTACACGGAAACTGCTTATGGTTGC
BARCSOYSSR_08_0480TCGTTGACTGCAATATGGTCACCGAATGAAGCGTAAAGGA
BARCSOYSSR_08_0488TCTCATGGGAACCTGGAAAACGAAACAGCAACGAATCAAA
Glyma.08g106500-1TTGGAGCTGGCAGAGTCTAATCAATGAGCTGATGGCCACTGTA
Glyma.08g106500-2GCCAGATGGGGACGTCATAAGTCAATTGATGGAGCAACACCG
Glyma.08g106500-3CAGGAAAACATCAGGAGGCAGAGCTGCATTGCATCAAACGTGG
Table 3. Predicted genes and their putative functions within the mapped region.
Gene IDGene Start (bp)Gene End (bp)Putative Function
Glyma.08G1031007,902,8207,907,892RING-type E3 ubiquitin transferase
Glyma.08G1032007,918,3067,932,242Mannosyl-oligosaccharide glucosidase
Glyma.08G1033007,934,8667,944,355Peptidase_M28 domain-containing protein
Glyma.08G1034007,945,6677,949,720F-box domain-containing protein
Glyma.08G1035007,947,8437,948,181Unknown
Glyma.08G1036007,954,8587,956,497Signal peptidase complex subunit 1
Glyma.08G1037007,959,2507,962,513Large subunit ribosomal protein L17e
Glyma.08G1038007,966,2987,969,958Exostosin domain-containing protein
Glyma.08G1039007,970,5077,974,378Caffeoyl-CoA O-methyltransferase
Glyma.08G1040007,976,0437,980,358S-adenosyl-L-methionine-dependent methyltransferases
Glyma.08G1041007,993,3177,995,690Flavonol biosynthesis
Glyma.08G1042008,004,9608,006,787REF domain-containing protein
Glyma.08G1043008,007,8438,011,052Aerobic respiration I (cytochrome c)
Glyma.08G1044008,016,7668,018,606MYND-type domain-containing protein
Glyma.08G1045008,041,1758,044,478DUF493
Glyma.08G1046008,045,6028,047,222Polysacc_synt_4 domain-containing protein
Glyma.08G1047008,055,0398,059,859Ribosome assembly protein RRB1
Glyma.08G1048008,063,0608,066,966F-box domain-containing protein
Glyma.08G1049008,067,5688,069,734RAMP4 in endoplasmic reticulum
Glyma.08G1050008,079,6878,087,576Arabidopsis histidine kinase 2/3/4 (cytokinin receptor)
Glyma.08G1051008,091,8208,093,816NTF2 domain-containing protein
Glyma.08G1052008,094,7168,102,735TIG DNA binding
Glyma.08G1053008,109,4868,110,128DUF3339
Glyma.08G1054008,113,9908,126,799K-box domain-containing protein
Glyma.08G1055008,128,2458,135,906K-box domain-containing protein
Glyma.08G1056008,154,8348,161,846DNA primase large subunit
Glyma.08G1057008,166,2008,168,551Rho GDP-dissociation inhibitor
Glyma.08G1058008,171,5828,177,075MACPF domain-containing protein
Glyma.08G1059008,182,6568,185,890U6 snRNA-associated Sm-like protein LSm7
Glyma.08G1060008,189,5888,192,602Amidase domain-containing protein
Glyma.08G1061008,194,0068,194,604Unknown
Glyma.08G1062008,194,8648,196,276Amidase domain-containing protein
Glyma.08G1063008,197,9118,199,307PORR domain-containing protein
Glyma.08G1064008,199,6368,206,598kinesin family member 15
Glyma.08G1065008,208,9878,215,162PPR_long domain-containing protein
Glyma.08G1066008,215,3848,215,533Unknown
Glyma.08G1067008,216,3388,219,979FK506-binding protein 4/5
Glyma.08G1068008,221,0558,223,572Small subunit ribosomal protein S19
Glyma.08G1069008,228,3808,228,919Unknown
Glyma.08G1070008,229,6948,231,371mTERF domain-containing protein
Glyma.08G1071008,232,7848,238,471C2H2-type domain-containing protein
Glyma.08G1072008,242,3468,245,459Tic22 domain-containing protein
Glyma.08G1073008,250,6778,253,307Xyloglucan:xyloglucosyl transferase
Glyma.08G1074008,255,1028,260,380Unknown
Glyma.08G1075008,266,7338,268,742Glycosyltransferase
Glyma.08G1076008,276,7598,278,195Glycosyltransferase
Glyma.08G1077008,284,6898,288,765Protein kinase domain-containing protein
Glyma.08G1078008,296,1968,307,328Bifunctional aspartokinase/homoserine dehydrogenase 1
Glyma.08G1079008,308,0388,310,337Histone H3
Glyma.08G1080008,311,5398,314,951Selenium-binding protein 1
Glyma.08G1081008,315,6348,315,795RALF domain-containing protein
Glyma.08G1082008,317,3408,318,268RALF domain-containing protein
Glyma.08G1083008,321,3038,325,907Microfibrillar-associated protein 1
Disclaimer/Publisher’s Note: The statements, opinions and data contained in all publications are solely those of the individual author(s) and contributor(s) and not of MDPI and/or the editor(s). MDPI and/or the editor(s) disclaim responsibility for any injury to people or property resulting from any ideas, methods, instructions or products referred to in the content.

