Article

Impact of Integrated Rice-Crayfish Farming on Soil Aggregates and Organic Matter Distribution

1
Key Laboratory for Geographical Process Analysis and Simulation of Hubei Province, Central China Normal University, Wuhan 430079, China
2
College of Urban and Environmental Sciences, Central China Normal University, Wuhan 430079, China
*
Author to whom correspondence should be addressed.
Agronomy 2024, 14(1), 16; https://doi.org/10.3390/agronomy14010016
Submission received: 1 November 2023 / Revised: 14 December 2023 / Accepted: 18 December 2023 / Published: 20 December 2023

Abstract

:
This study evaluates the effects of a combined rice-crayfish farming model and compares this model with traditional paddy fields. The focus is on soil aggregate characteristics, organic matter content, and also the distribution of soil aggregates. This research was conducted in Qianjiang, Hubei Province. The surface soil samples were collected from two types of arable land: paddy fields (WR) and rice-crayfish fields (CR). We performed an analysis of soil aggregate distribution and organic matter content. Results reveal that the majority of soil aggregates exceed 2 mm in size (≥74.94%). The integrated rice-crayfish farming model significantly enhances the presence of large soil aggregates. And these parameters such as the average weight diameter (MWD), average geometric diameter (GWD), and agglomerate stability (PAD) also increase. Moreover, it mitigates agglomerate fragmentation (WASR). However, the net increase in total soil organic matter due to the integrated farming model remains modest. Organic matter content within the agglomerates follows an initial increase followed by a decrease. The highest content occurs in the 0.25–0.5 mm grain size (D4). When examining the distribution of soil aggregates and organic matter, it becomes evident that organic matter primarily originates from grain sizes larger than 2 mm (≥71.92%). Notably, the rice-crayfish paddy field (CR) exhibits a substantially higher contribution compared to the traditional rice paddy field (WR). This study demonstrates several positive outcomes of the integrated rice-crayfish farming model compared to traditional paddy farming. It promotes the development of larger soil aggregates, enhances the structural integrity of soil aggregates, and improves their mechanical and hydrological stability. Additionally, it marginally increases the organic matter content within each component of soil aggregates. Furthermore, integrated modelling increases the impact of larger soil aggregates on soil organic matter. This improves the quality of the soil and as a result, crop yields are increased. The health of the soil is also improved and this contributes positively to food security.

1. Introduction

In the 21st century, the global population is on the rise, and per capita food consumption is steadily increasing. This trend has intensified the pressure on food production, elevating the significance of food security concerns. The rising demand for sustainable agriculture has highlighted the significance of soil, leading to initiatives aimed at enhancing or preserving soil health. Within this context, soil health emerges as a pivotal determinant of food security [1]. Specifically, soil aggregate stability and organic matter content stand out as key factors with substantial influence on soil health [2].
Soil aggregates represent the fundamental building blocks of soil. Soil aggregates exert a profound influence on various soil physicochemical properties, thus affecting crop growth. As such, they serve as vital indicators of soil quality [3]. Soil aggregates can be categorized into two primary types based on particle size: macroaggregates (>0.25 mm) and microaggregates (<0.25 mm) [4]. As outlined by Sun, Z. et al., soil macroaggregates result from a complex interplay of physical, chemical, and biological processes [5].
The presence and characteristics of cementing substances within the soil play a pivotal role in both the formation and stability of soil aggregates. These cementing substances can be broadly classified into three categories: organic cementing substances, inorganic cementing substances, and organic-inorganic composites [5]. Owing to the cementing influence of organic substances, the organic matter content of macroaggregates surpasses that of microaggregates. These organic components serve to bind microaggregates together, ultimately giving rise to the formation of macroaggregates [6,7]. Zotarelli et al. have shown that macroaggregates are developed through the ionic bonding and cementation of inorganic substances such as iron and aluminum oxides. It is important to emphasize that the organic matter content in macroaggregates is not necessarily higher than that found in microaggregates [8]. Several studies have consistently revealed a positive correlation between the presence of soil macroaggregates and soil fertility [9,10,11]. Nonetheless, a substantial proportion of soil macroaggregates is recognized as a significant indicator of sound soil structure. The higher the concentration of soil macroaggregates, the greater the stability of soil aggregates. It enhances soil fertility, bolsters resistance to soil erosion, and augments the potential for soil carbon sequestration. Notably, the organic matter within soil macroaggregates is more dynamic and actively contributes to soil health.
The stability of soil aggregates is subject to the influence of several factors. These factors encompass the soil-forming parent material, soil organic matter, soil microorganisms, and human-induced disruptions. Anthropogenic disturbances consist of alterations in land use, management practices, and modifications in vegetation cover. Anthropogenic disturbances can impact soil organic matter content and the activity of soil microbes, thereby exerting effects on the stability of soil aggregates [9,12,13,14,15]. Augmented organic carbon inputs have the potential to elevate soil organic matter content and enhance soil microbial activity. Finally, this phenomenon leads to an improvement in soil aggregate stability. A higher degree of stability in soil aggregates contributes to enhanced safeguarding of soil organic matter, prolonging its retention within the soil over an extended period.
A significant correlation is evident between soil organic matter and soil aggregates. The organic matter content within soil aggregates exerts a pronounced influence on both the distribution of soil aggregates and the characteristics of macro and microaggregates [16]. Soil aggregates play a crucial role in influencing soil organic matter and nutrient dynamics. Moreover, soil organic matter and nutrient dynamics have a substantial impact on crop yield [17]. The organic matter contained within soil aggregates serves as a vital nutrient source for supporting crop growth. A higher organic matter content in soil aggregates can significantly bolster the nutritional resources available to crops, effectively enhancing their overall nutritional status [18]. Hence, the influence of various farming models on soil aggregates and soil organic matter has drawn the keen interest of numerous researchers.
Rice-crayfish integrated farming is a notable and innovative model in China. Rice-crayfish integrated farming integrates rice cultivation with crayfish farming within the same field. This integration not only enhances agricultural efficiency but also augments soil fertility, thereby exerting a beneficial impact on soil aggregates [19,20]. The roots of rice plants play a crucial role in the maintenance of soil structure. By absorbing nutrients, rice plants contribute to the enhancement of soil structure [21]. Furthermore, the presence of crayfish in the fields elevates the soil’s organic matter content, which is advantageous for soil aggregates [22]. Previous studies have examined the impact of rice-crayfish integrated farming on soil aggregates and organic matter. But there is limited research comparing this integrated farming model with traditional paddy fields. The rice-crayfish farming model has increased rice yields by 17.63% compared with traditional monoculture [23].
In this study, our primary aim was to conduct a comparative analysis of the influence of the integrated rice-crayfish farming model in contrast to traditional paddy fields on soil aggregates and organic matter. The principal objective involved the examination of disparities in soil aggregate quantity, stability, organic matter content, and the distribution characteristics of soil aggregates between these two distinct farming models. This study is poised to provide valuable insights into the potential advantages of integrated rice-crayfish farming for bolstering soil health and optimizing crop production. The specific objectives of this investigation were as follows: to analyze and compare the quantity of soil aggregates in both paddy fields and rice-crayfish fields; to evaluate and compare the stability of soil aggregates within paddy fields and rice-crayfish fields; to assess and compare the organic matter content present in paddy fields and rice-crayfish fields; to scrutinize the distribution characteristics of soil aggregates in paddy fields and rice-crayfish fields; to discern the contribution of organic matter to varying size fractions of soil aggregates in paddy fields and rice-crayfish fields. The outcomes of this study are poised to enhance our comprehension of the impact of integrated rice-crayfish farming on soil aggregates and organic matter. Such insights can subsequently inform the adoption of sustainable agricultural practices and contribute to the promotion of food security.

2. Materials and Methods

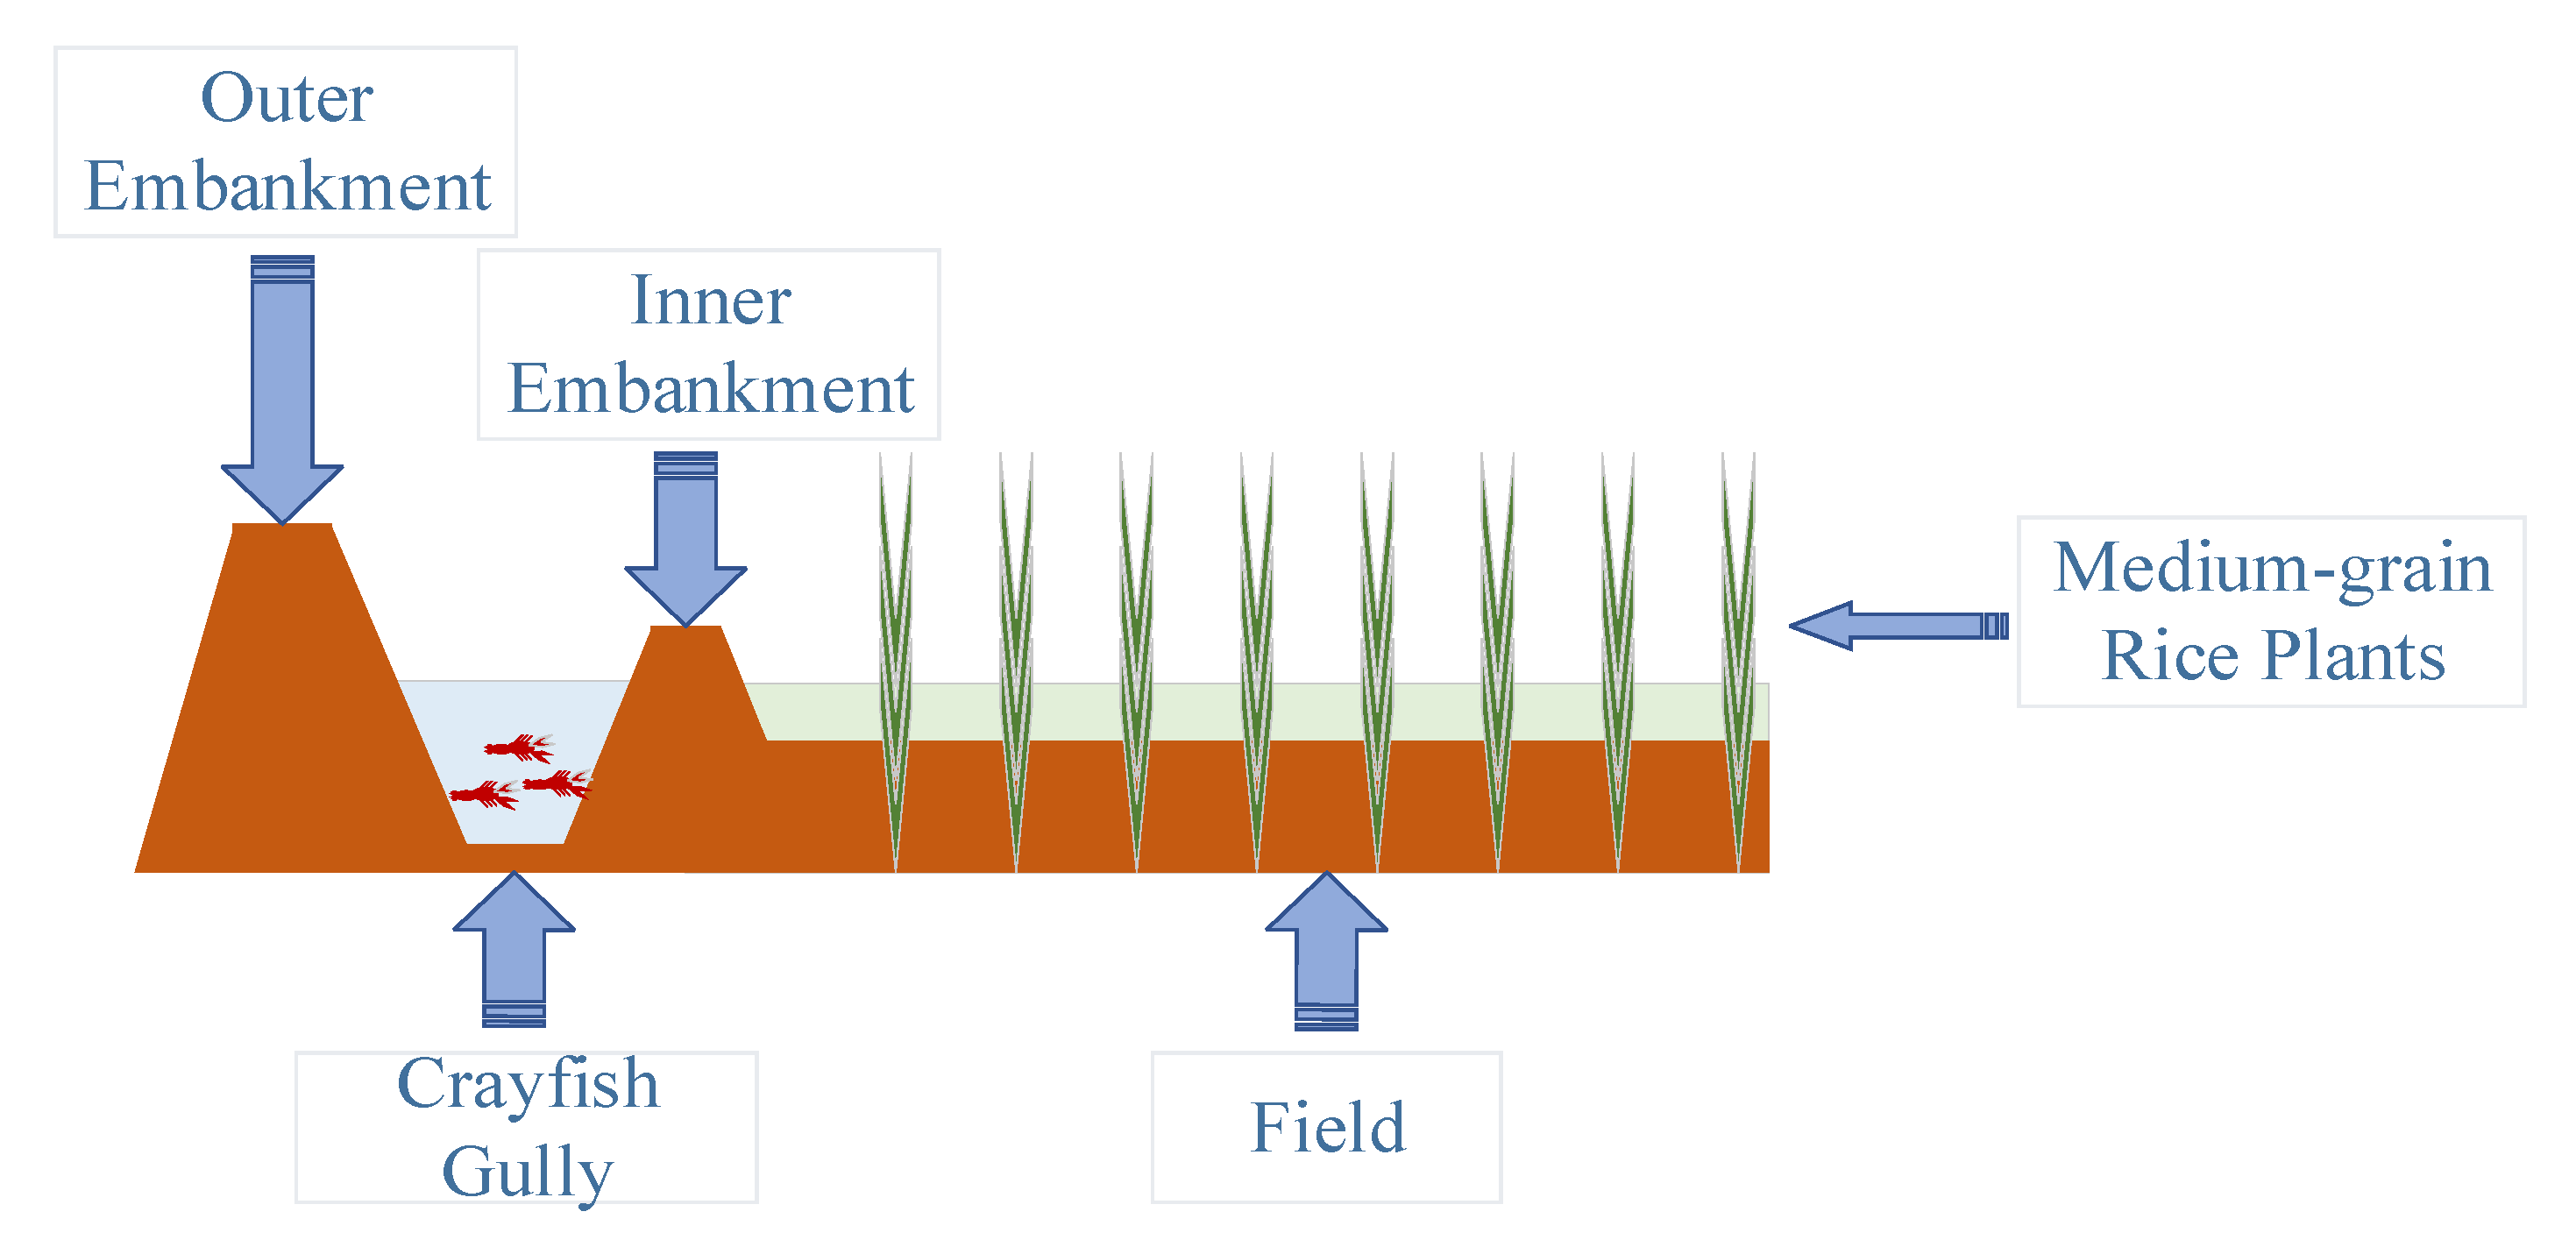
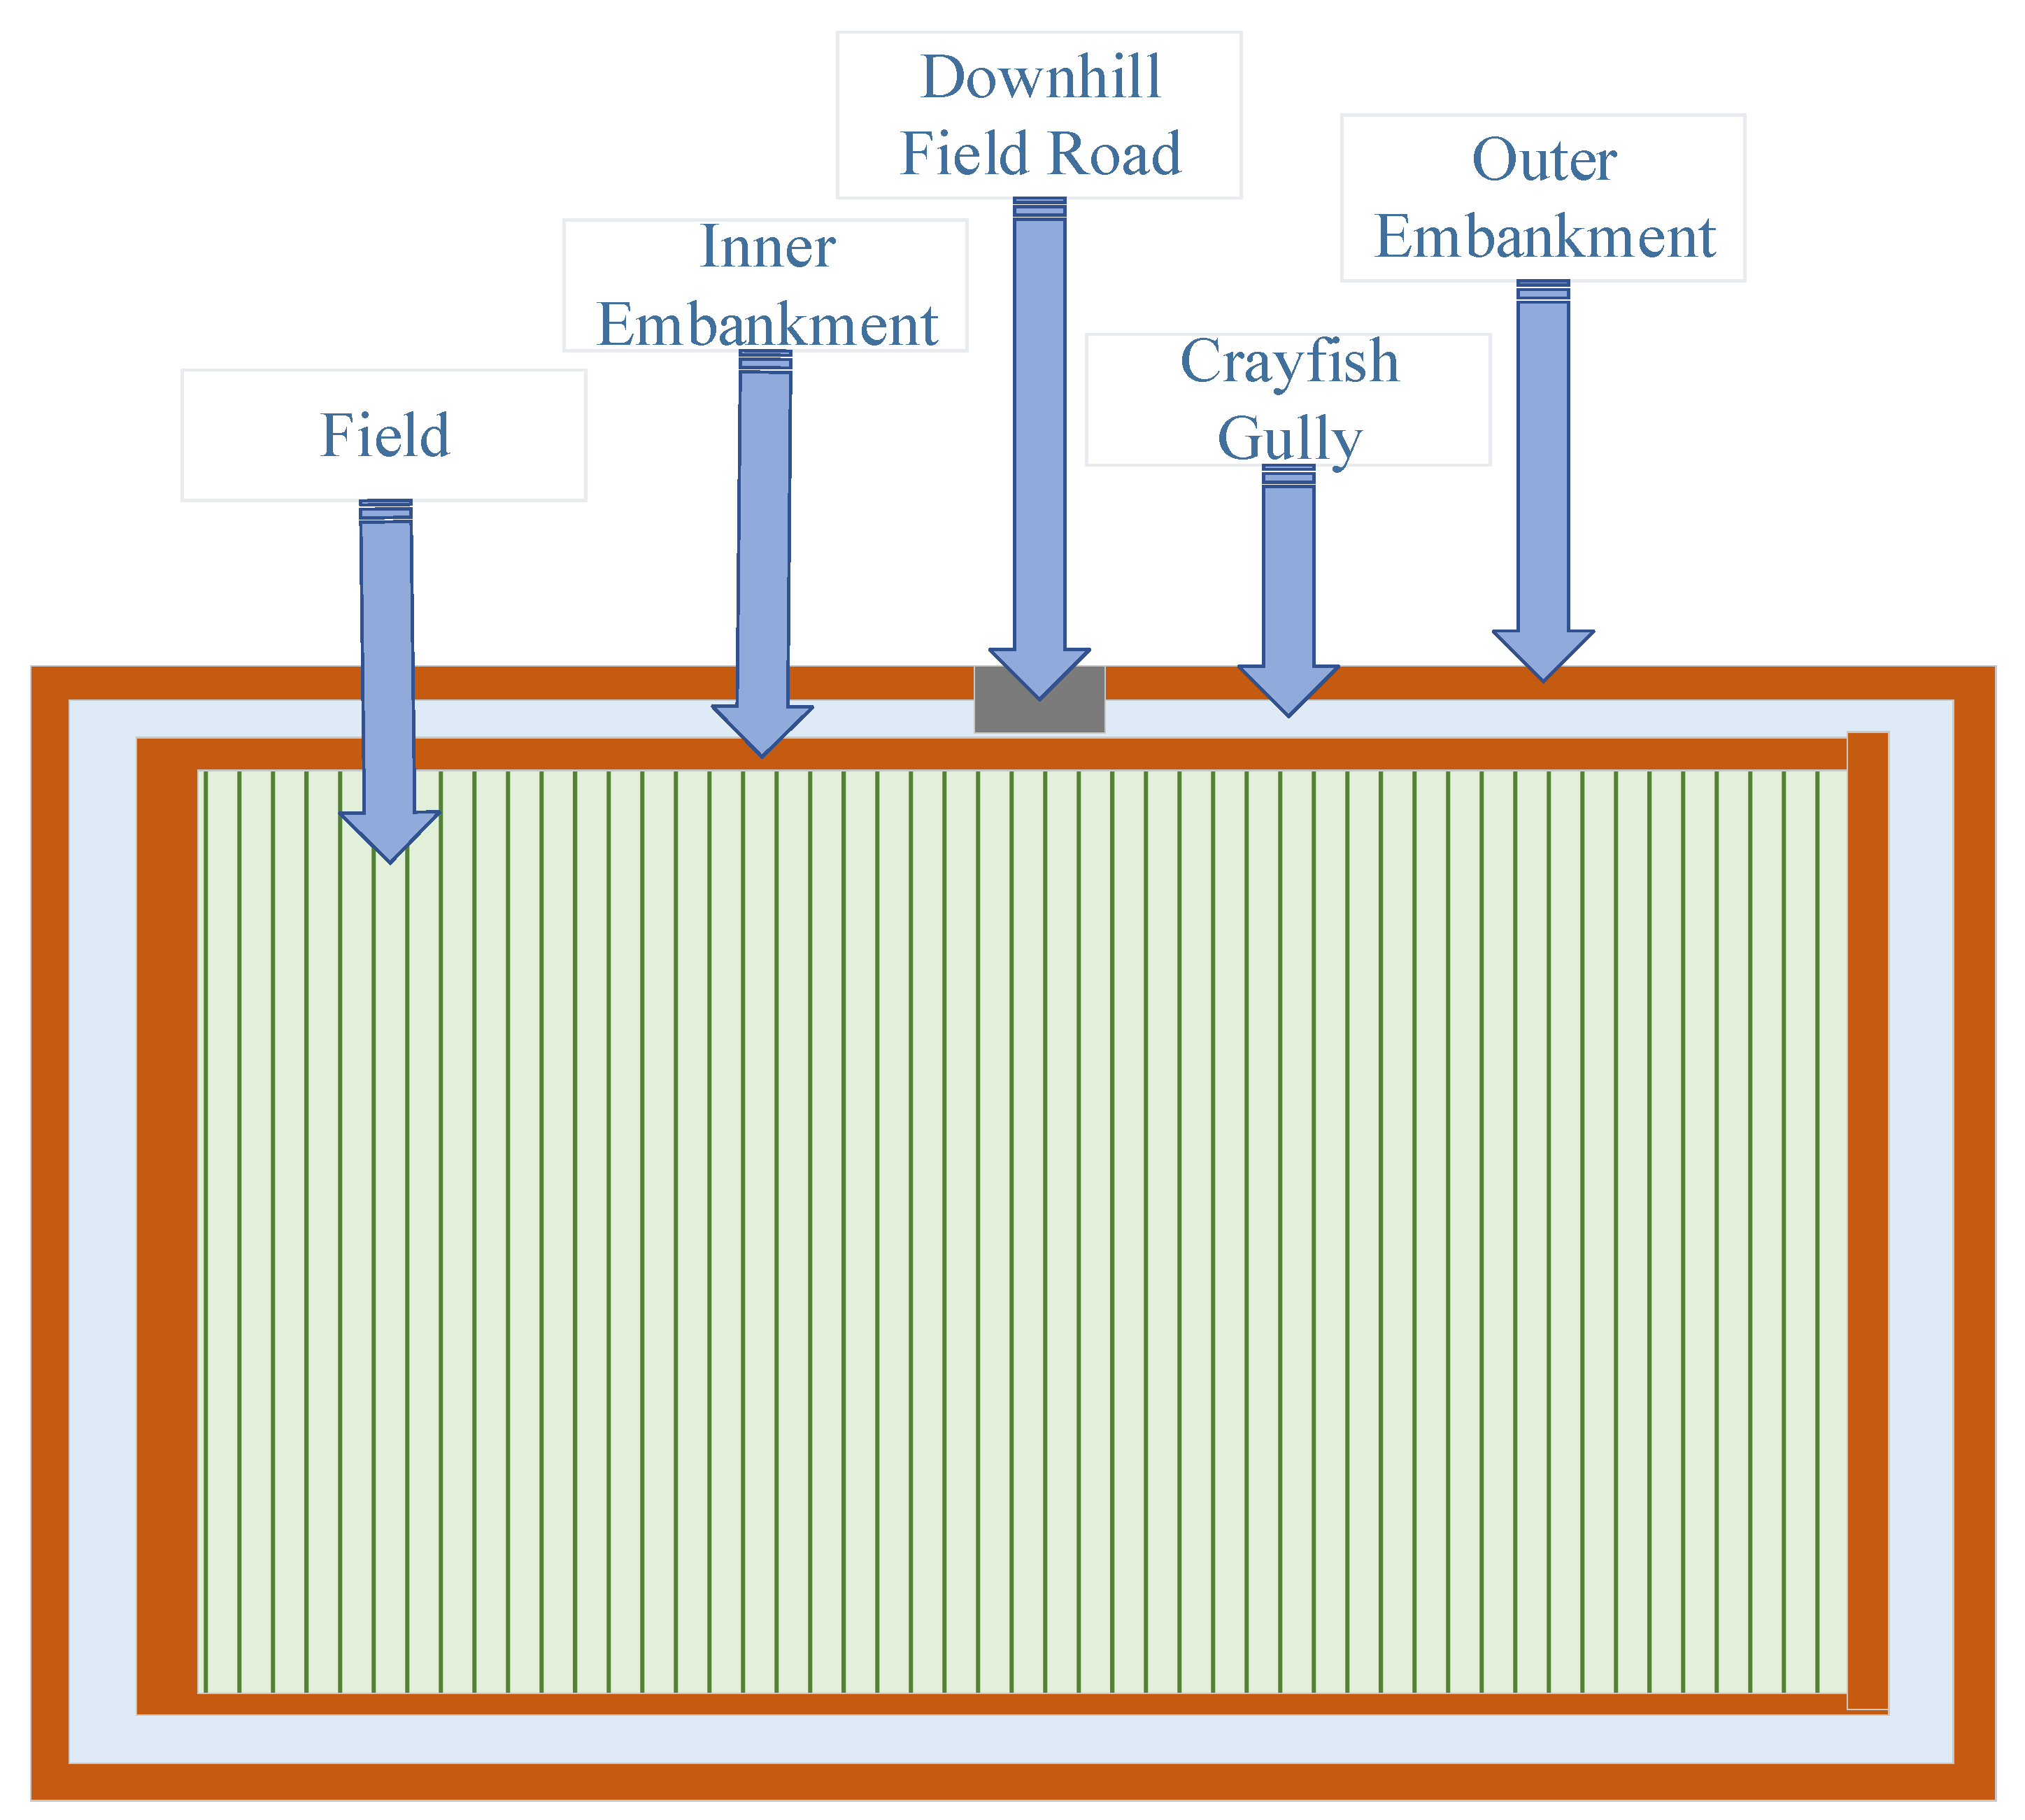
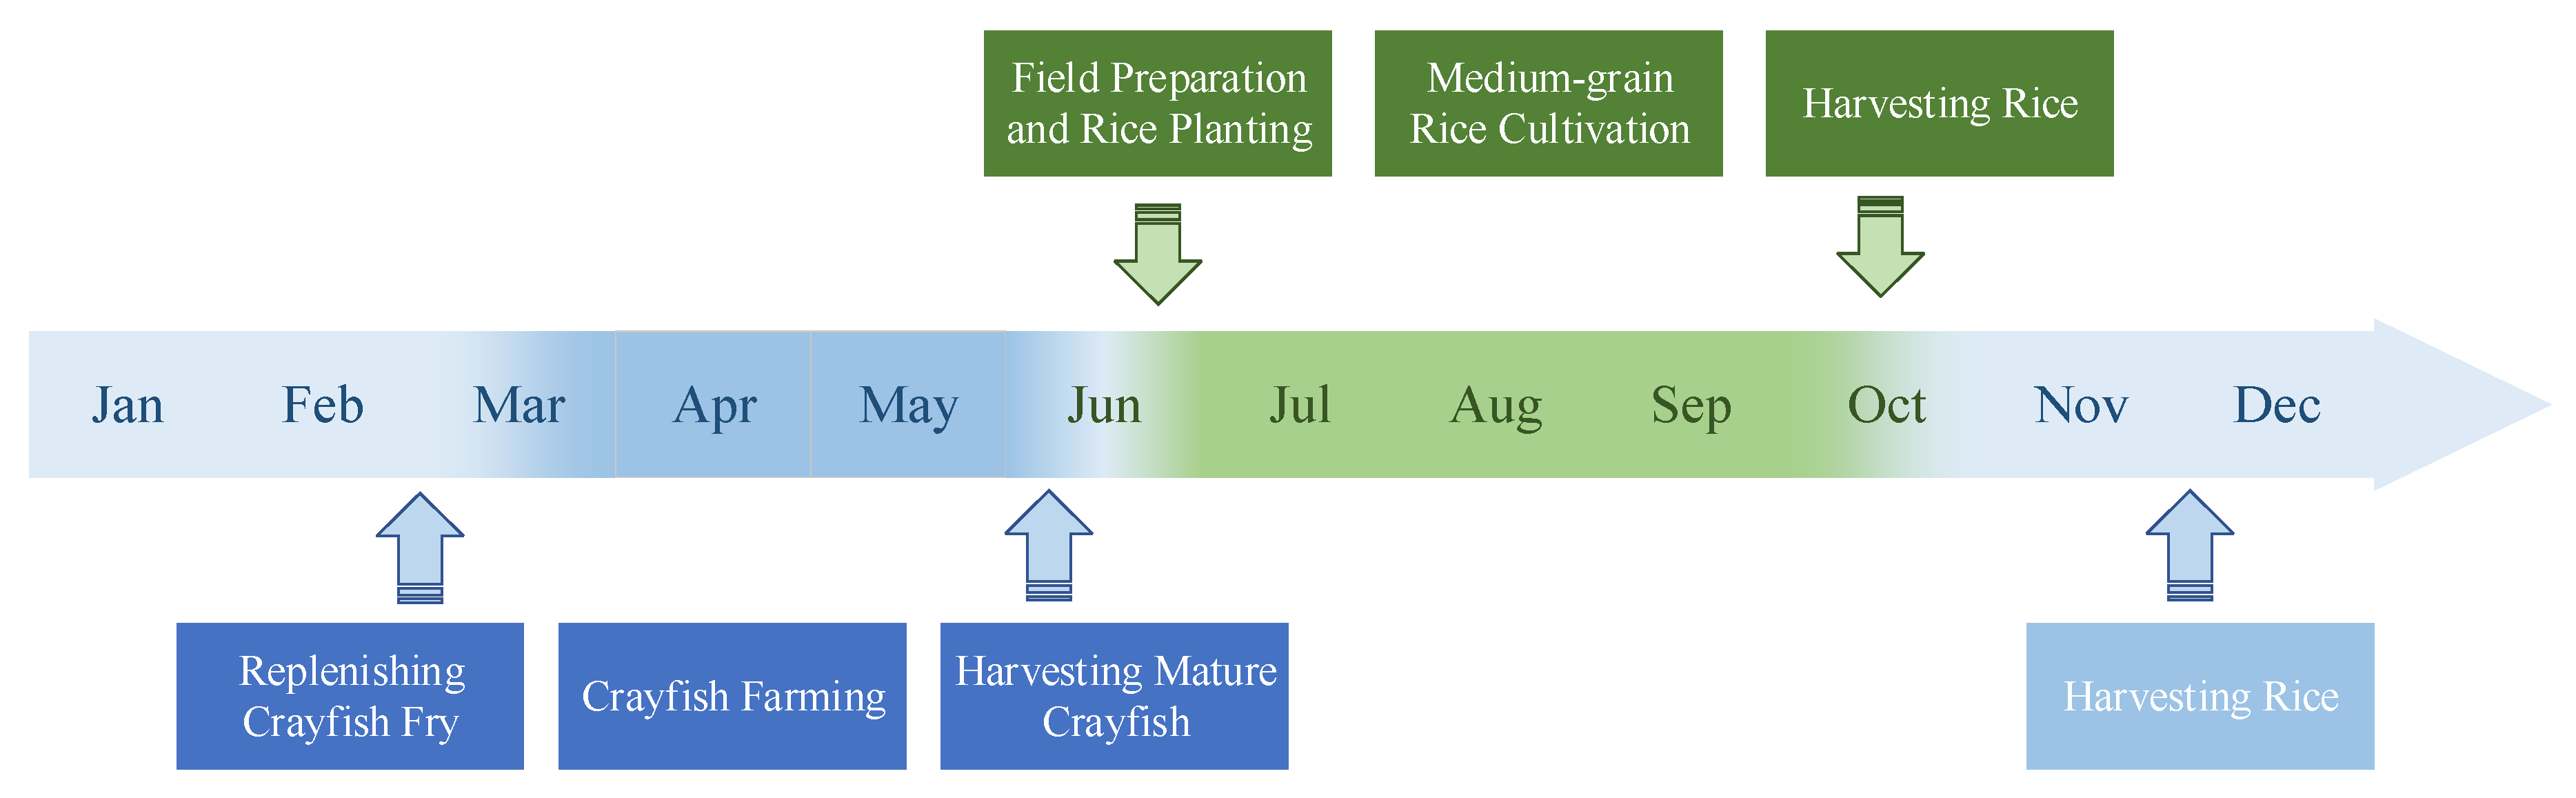
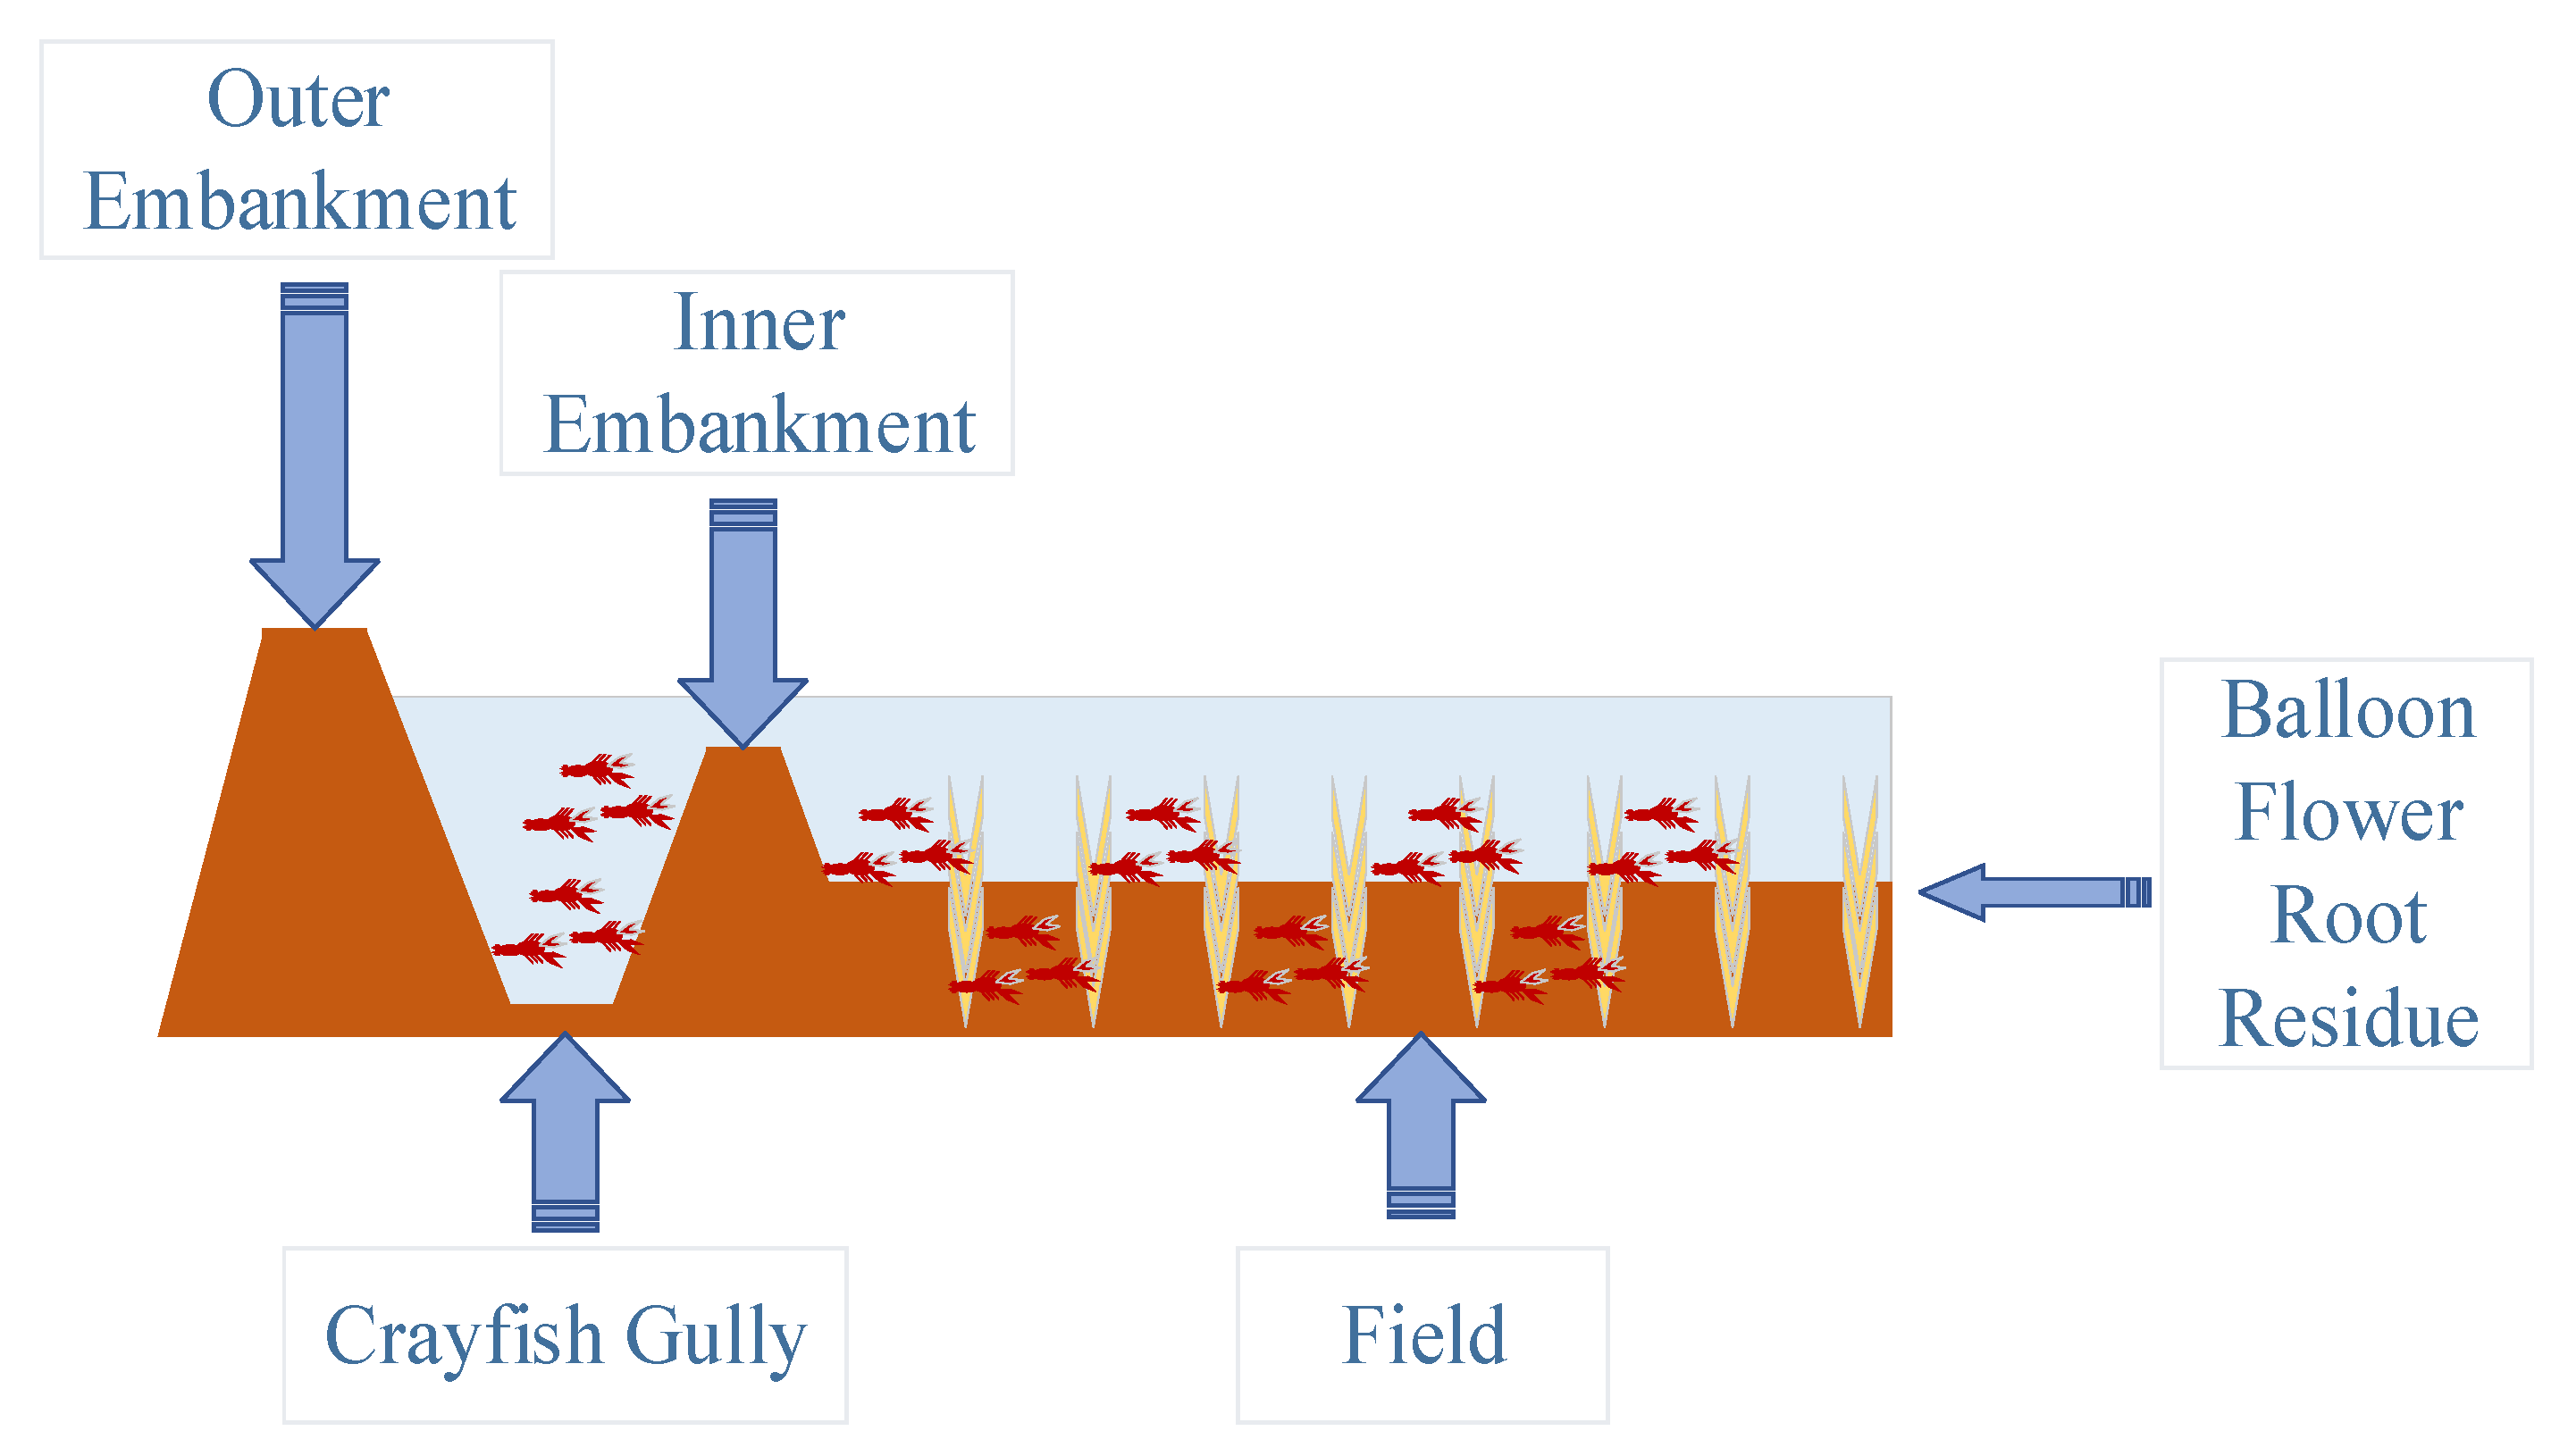
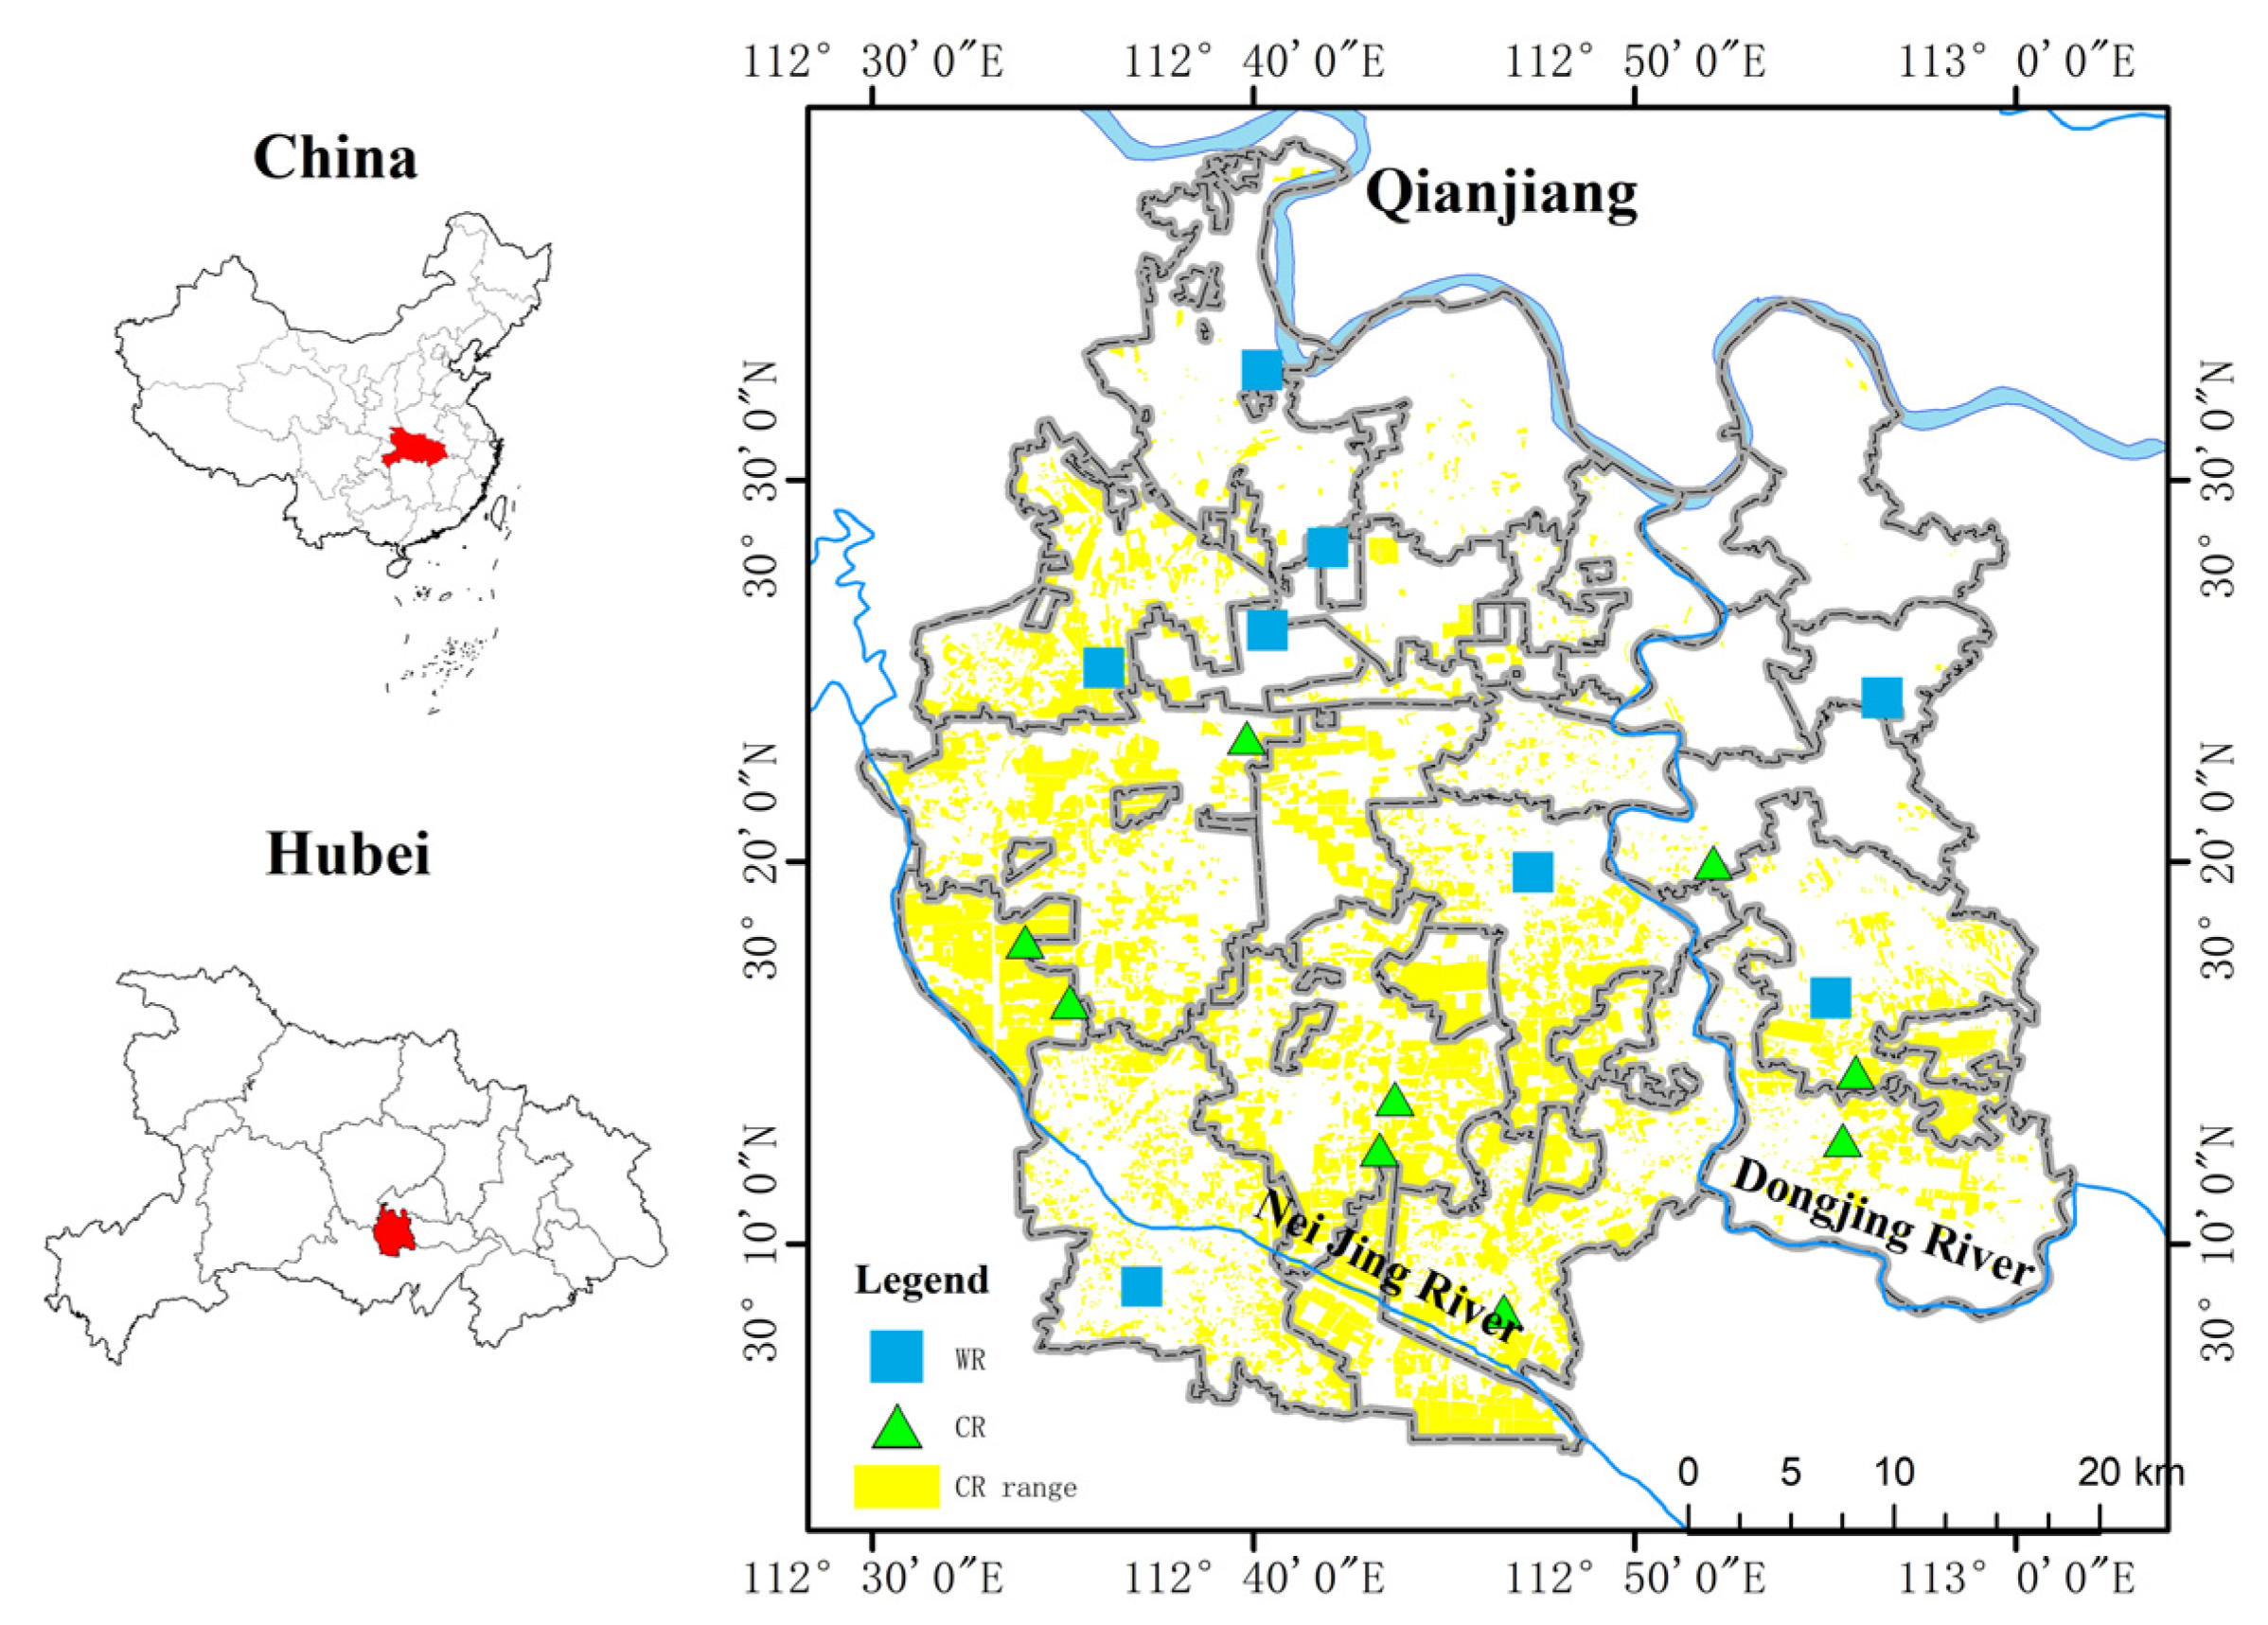
2.1. Overview of The Research Area

Qianjiang City, a county-level city in the south-central region of China’s Hubei Province, is geographically positioned between latitudes 30°05′ N and 30°39′ N, and longitudes 112°29′ E and 113°01′ E. The city has a subtropical monsoon climate. The climate is characterized by a comfortable average annual temperature of 16.1 °C and abundant rainfall, with an annual average of approximately 1100 mm. Located within the expansive Jianghan Plain, Qianjiang City is distinguished by its flat and open terrain. The region is hydrologically rich, with the Han River flowing to its north and the Yangtze River to its south. This combination of geographical features creates an ideal environment for rice-crayfish agriculture. The agricultural potential of the area is further enhanced by a well-developed network of irrigation ditches and waterways that support farming activities.
In addition, Qianjiang City is both a grain production base in China with a long history of rice cultivation. And Qianjiang City is the birthplace of the integrated rice-crayfish farming model, with more standardized specifications for the construction of its rice-crayfish fields; the farming system of paddy fields is mainly rice-oilseed rape rotation, and that of rice-crayfish fields is mainly rice-crayfish rotation. Sample fields with high representativeness and typicality can be selected for this study.
The rice-crayfish integrated aquaculture model is to rice cultivation and crayfish farming alternately. Crayfish species are fed with water at the time of rice harvest and harvested into crayfish before rice planting in the following year, and crayfish are not released when rice is planted. This model is generally only around the paddy field to dig about 1–2 m wide, about 1.5–2 m deep ring or U-shaped ring ditch to culture crayfish, ring ditch inside the large field planting rice (Figure 1). A corner of the rice-crayfish field will be left for large-scale machinery to enter the field of flat land, where the crayfish ditch is not dug. In addition, the crayfish ditch will often be surrounded by plastic nets or nylon nets to prevent the crayfish from escaping and the entry of foreign hostile organisms.
The specific operational process of the rice-crayfish cropping mode is illustrated in Figure 2. Each year, in June, rice cultivation commences in the field, as depicted in Figure 3. Rice is harvested by the end of September and early October, and the rice stalks are deliberately left in the field. Following the rice harvest, the field is flooded in preparation for the winter season. During this time, crayfish seedlings are introduced, primarily to utilize the remaining rice stubble as a food source, as shown in Figure 4.
The crayfish overwinter by burrowing into holes within the field. With the advent of spring, the crayfish become active, necessitating an increased supply of feed to promote their rapid growth. From the end of March to the close of May, crayfish are successively harvested. The fishing activities continue until June, marking the commencement of preparations for the next rice planting cycle.

2.2. Sample Setup and Collection

In late September 2022, after the rice harvest, a survey sampling was conducted in the study area. A total of 17 sample sites were selected, including 8 paddy fields and 9 rice crayfish fields. The paddy fields were mainly located in the northeastern part of Qianjiang City, while the rice crayfish fields were predominantly found in the southwestern part of Qianjiang City (Figure 5). The geographical differences are obvious. The soil types of both paddy fields and rice-crayfish fields are paddy soil. The WR and CR belong to the same rice-growing area, and the CR is changed by farmers on the basis of the WR. Both differ only in cropping system; the parent material, climate, and other factors are the same. At each sample site, soil samples were collected and taken to the laboratory. The samples were carefully processed to remove plant roots, animal residues, and debris. Subsequently, the soil samples were naturally dried for the determination of soil aggregate structure, organic matter content, and other physicochemical indicators.

2.3. Experimental Methods

2.3.1. Determination of Soil Aggregate Structure

Soil aggregate structure was determined by Dry Sieving (D) and Wet Sieving (W) methods. 200 g of naturally air-dried in situ soil that had passed through an 8 mm sieve mesh was placed into a combined sieve mesh (pore sizes of 5, 2, 1, 0.5 and 0.25 mm in turn), sieved with sufficient shaking, and the agglomerates retained by each sieve mesh were collected and weighed to obtain the mechanically stable agglomerates at each granularity level of the soil after dry sieving treatment. According to the proportion of mechanical stability agglomerates of each particle level after dry sieving, 50 g of samples were configured, and the samples were placed in the agglomerates analyzer (the aperture of the agglomerates analyzer screen was 5, 2, 1, 0.5 and 0.25 mm in order), soaked for 10 min and then vibrated and sieved at a frequency of 30 times/min for 30 min, and then the agglomerates retained by each sieve screen were collected and weighed and dried, and then the wet agglomerates were obtained. The water stability of the soil aggregates at each grain level after sieving was obtained. The average weight diameter (MWD), the average geometric diameter (GMD) and the content of >0.25 mm agglomerates after dry sieving (DR) were selected to reflect the mechanical stability of the aggregates and the content of >0.25 mm agglomerates after wet sieving (WR), the agglomerate destructive rate (PAD) and the stability of aggregates (WASR) were selected to reflect the water stability of the aggregates, and the calculation formulas were as follows [9]:
M W D = R i × M i M T
G M D = E X P R i × ln M i M T
D R = M D < 0.25 M T × 100 %
W R = M W < 0.25 M T × 100 %
PAD = D R W R D R × 100 %
W A S R = W R D R × 100 %
where i is the ith level of agglomerates; n is the total number of sets of agglomerates, n = 6; EXP (x) =   e x ; R i is the average diameter of the ith level of agglomerates (mm); M i is the mass of the ith level of agglomerates (g); M T is the total mass of agglomerates in each particle level (g); M D < 0.25 is the sum of the mass of agglomerates in dry sieve >0.25 mm (g); and M W < 0.25 is the sum of the mass of agglomerates in wet sieve >0.25 mm (g).

2.3.2. Determination of Soil Organic Matter

Soil organic carbon was determined by the external heating method of dichromate. 0.3 g of soil sample passed a 0.15 mm sieve was taken in a test tube, and the soil sample was oxidized with 0.8 mol/L (1/6 K 2 C r 2 O 7 H 2 S O 4 ) standard solution. Under the condition of external heating, the temperature of the oil bath was 200 °C, and it was heated to boiling for 5 min. The remaining C r 2 O 7 2− was reacted and titrated with 0.2 mol/L F e S O 4 standard solution, thus calculating the amount of consumed potassium dichromate, and then calculating the organic matter content according to the amount of consumed potassium dichromate in each grain size agglomerate. Morpholine as an indicator, titrate with 0.2 mol/L F e S O 4 standard solution, to calculate the amount of potassium dichromate consumed, calculate the organic matter content, and the calculation formula is as follows:
S O M = C   ×   5 V 0   ×   V V 0   ×   10 3   ×   3.0   ×   1.724   ×   1.1 M   ×   1000
where c is the concentration of 0.8 mol/L (1/6 K 2 C r 2 O 7 H 2 S O 4 ) standard solutions; 5 is the volume of potassium dichromate standard solution added (mL); V 0 is the volume of 0.2 mol/L F e S O 4 standard solutions consumed in the calibration of the blank (mL); V is the volume of 0.2 mol/L F e S O 4 standard solution consumed for calibration of soil samples (mL); 3.0 is the molar mass of 1/4 carbon atom (mol/L); 1.724 is the factor for conversion of organic carbon to organic matter; 1.1 is the oxidation correction factor; and m is the mass of the soil sample (g).

2.3.3. Calculation of Effective Value and Contribution of Soil Organic Matter

Then, calculate the effective value of organic matter and the contribution rate of soil aggregates at each grain level according to the mass fraction of each particle-level aggregate and the organic matter content:
R S O M = S O M i   ×   M i M T
W i = S O M i   ×   M i S O M i   ×   M i
where S O M i is the organic matter content of soil aggregates at level i; M i is the mass of the ith level of agglomerates (g); and M T is the total mass of agglomerates in each particle level (g).

2.4. Methods of Statistical Analysis

Microsoft Excel 2019 was used for data processing. The data were analyzed using SPSS 27.0 software’s functions of significance analysis (LSD method, α = 0.05), descriptive statistical analysis, and plotting using Origin 2022 to visualize the data and to complete the investigation on the mechanism of the influence of soil aggregate stability and organic carbon on the different arable land types.

3. Results

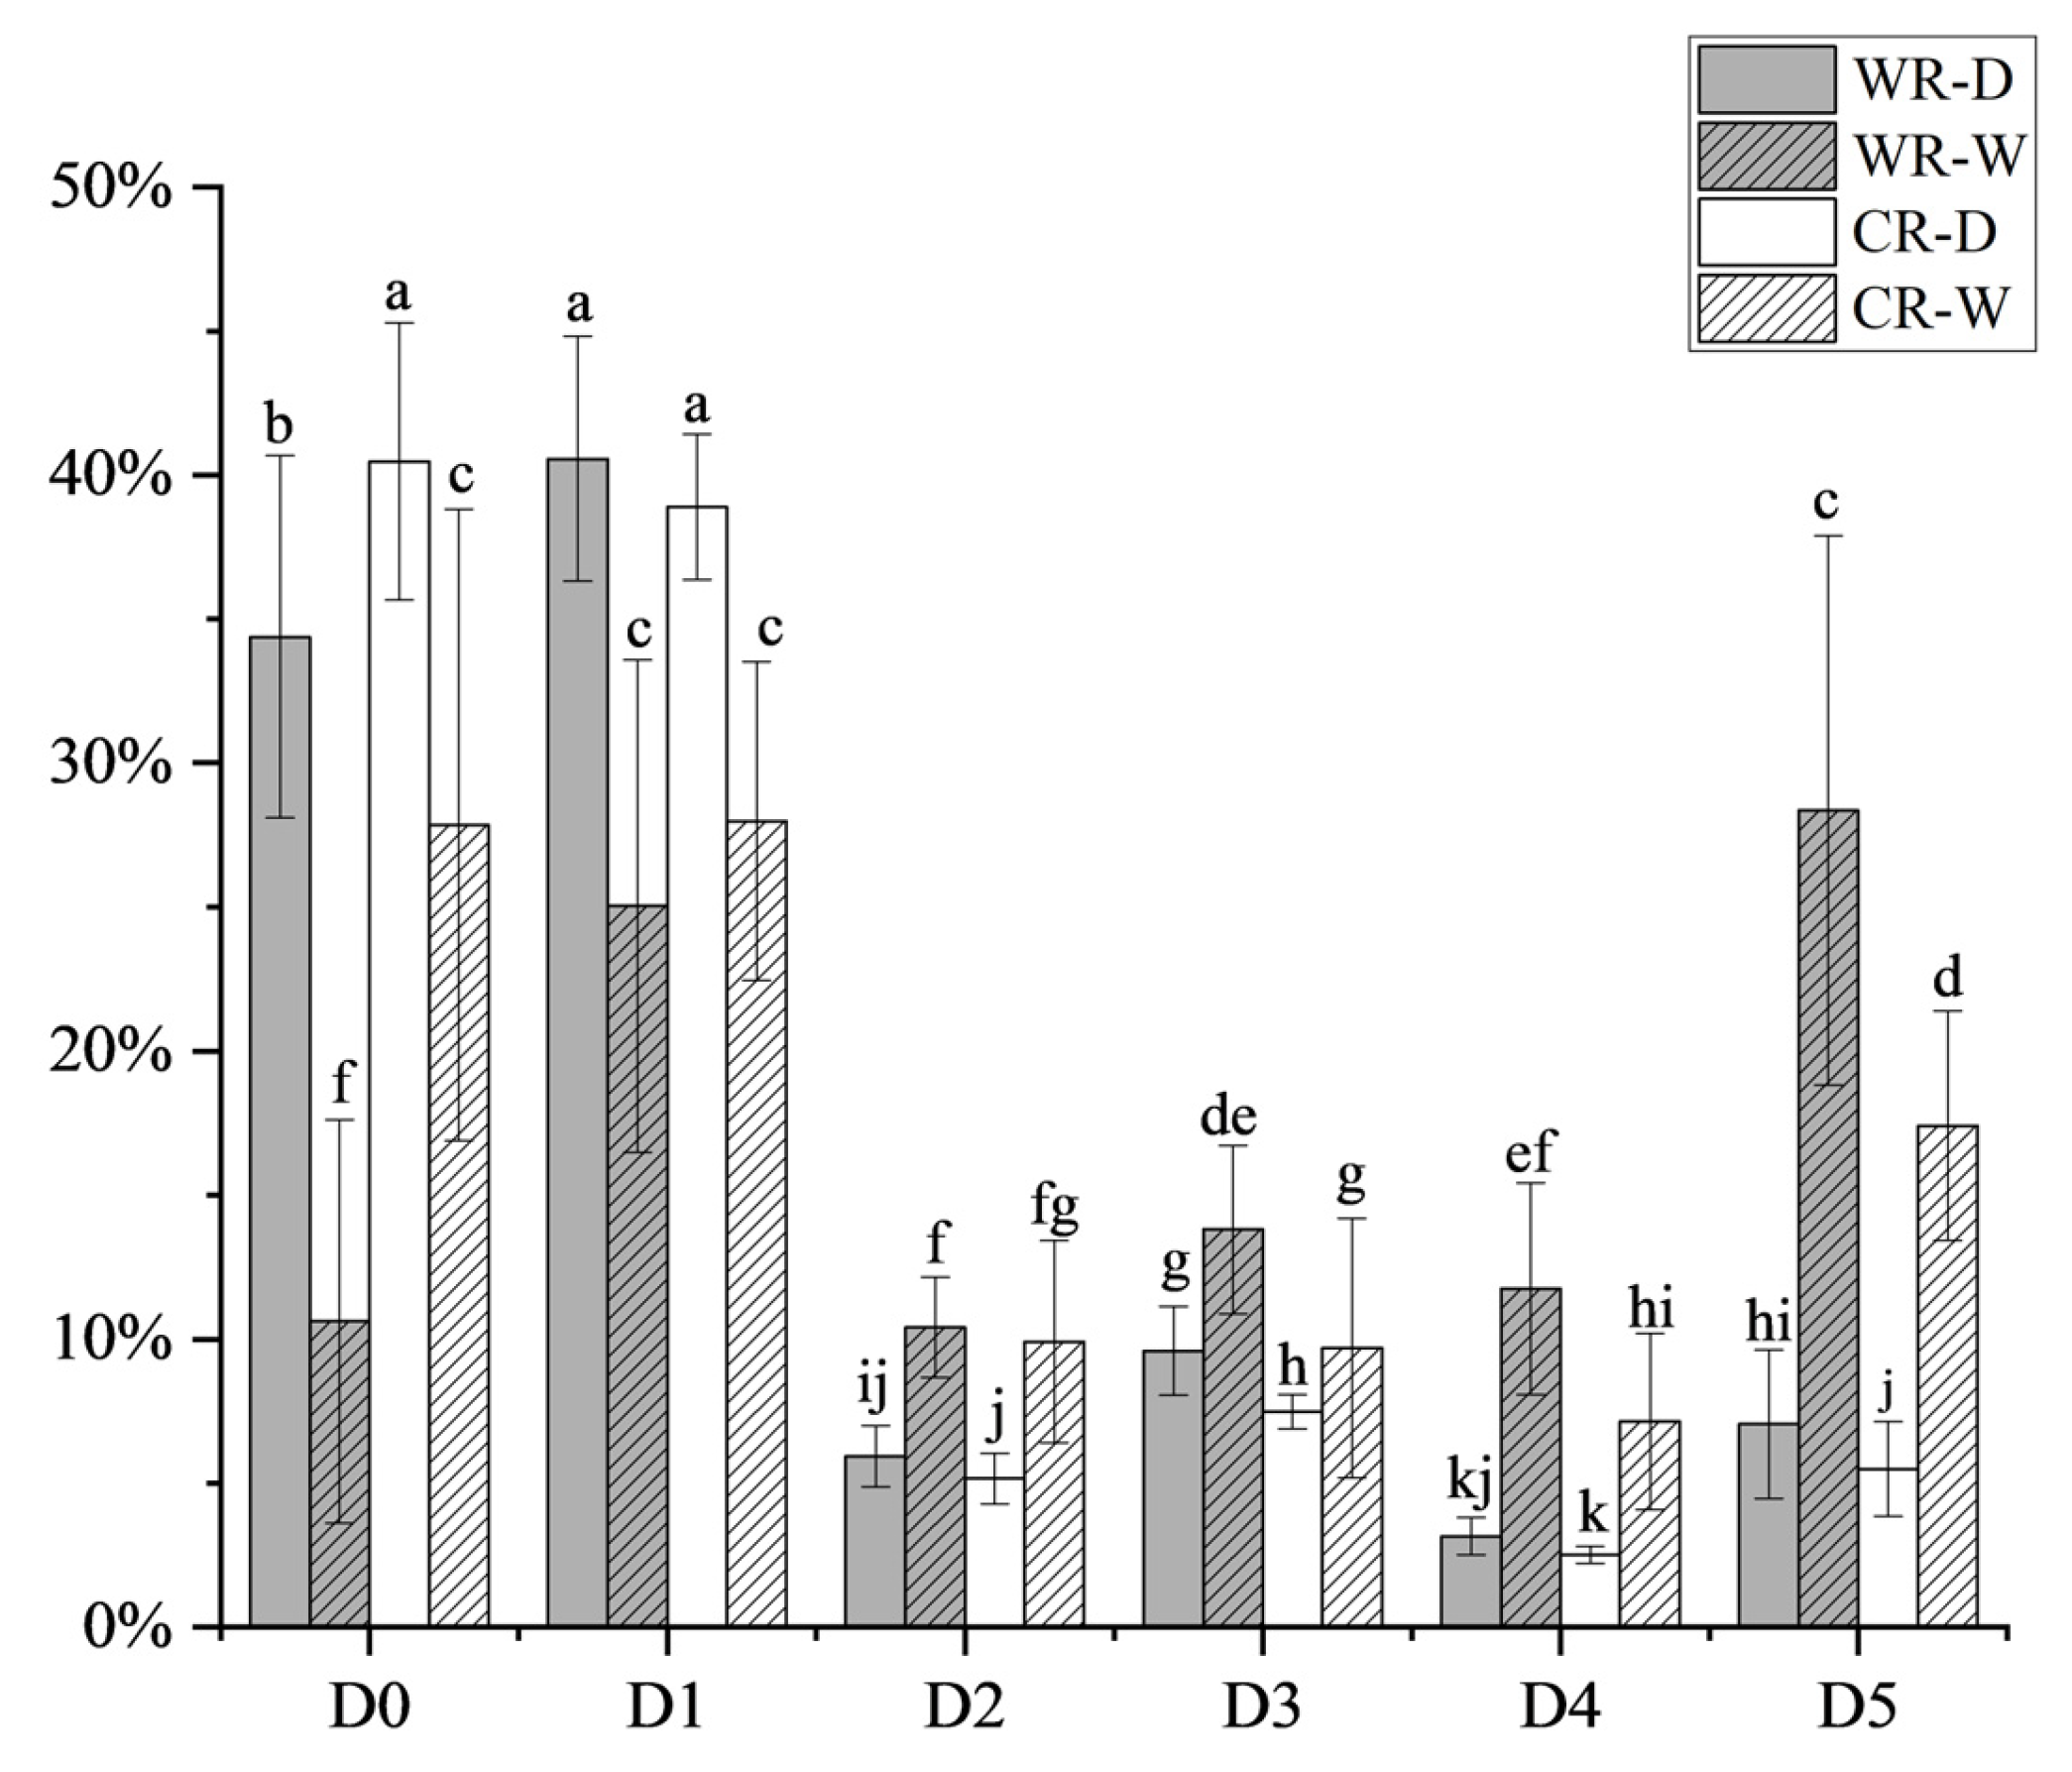
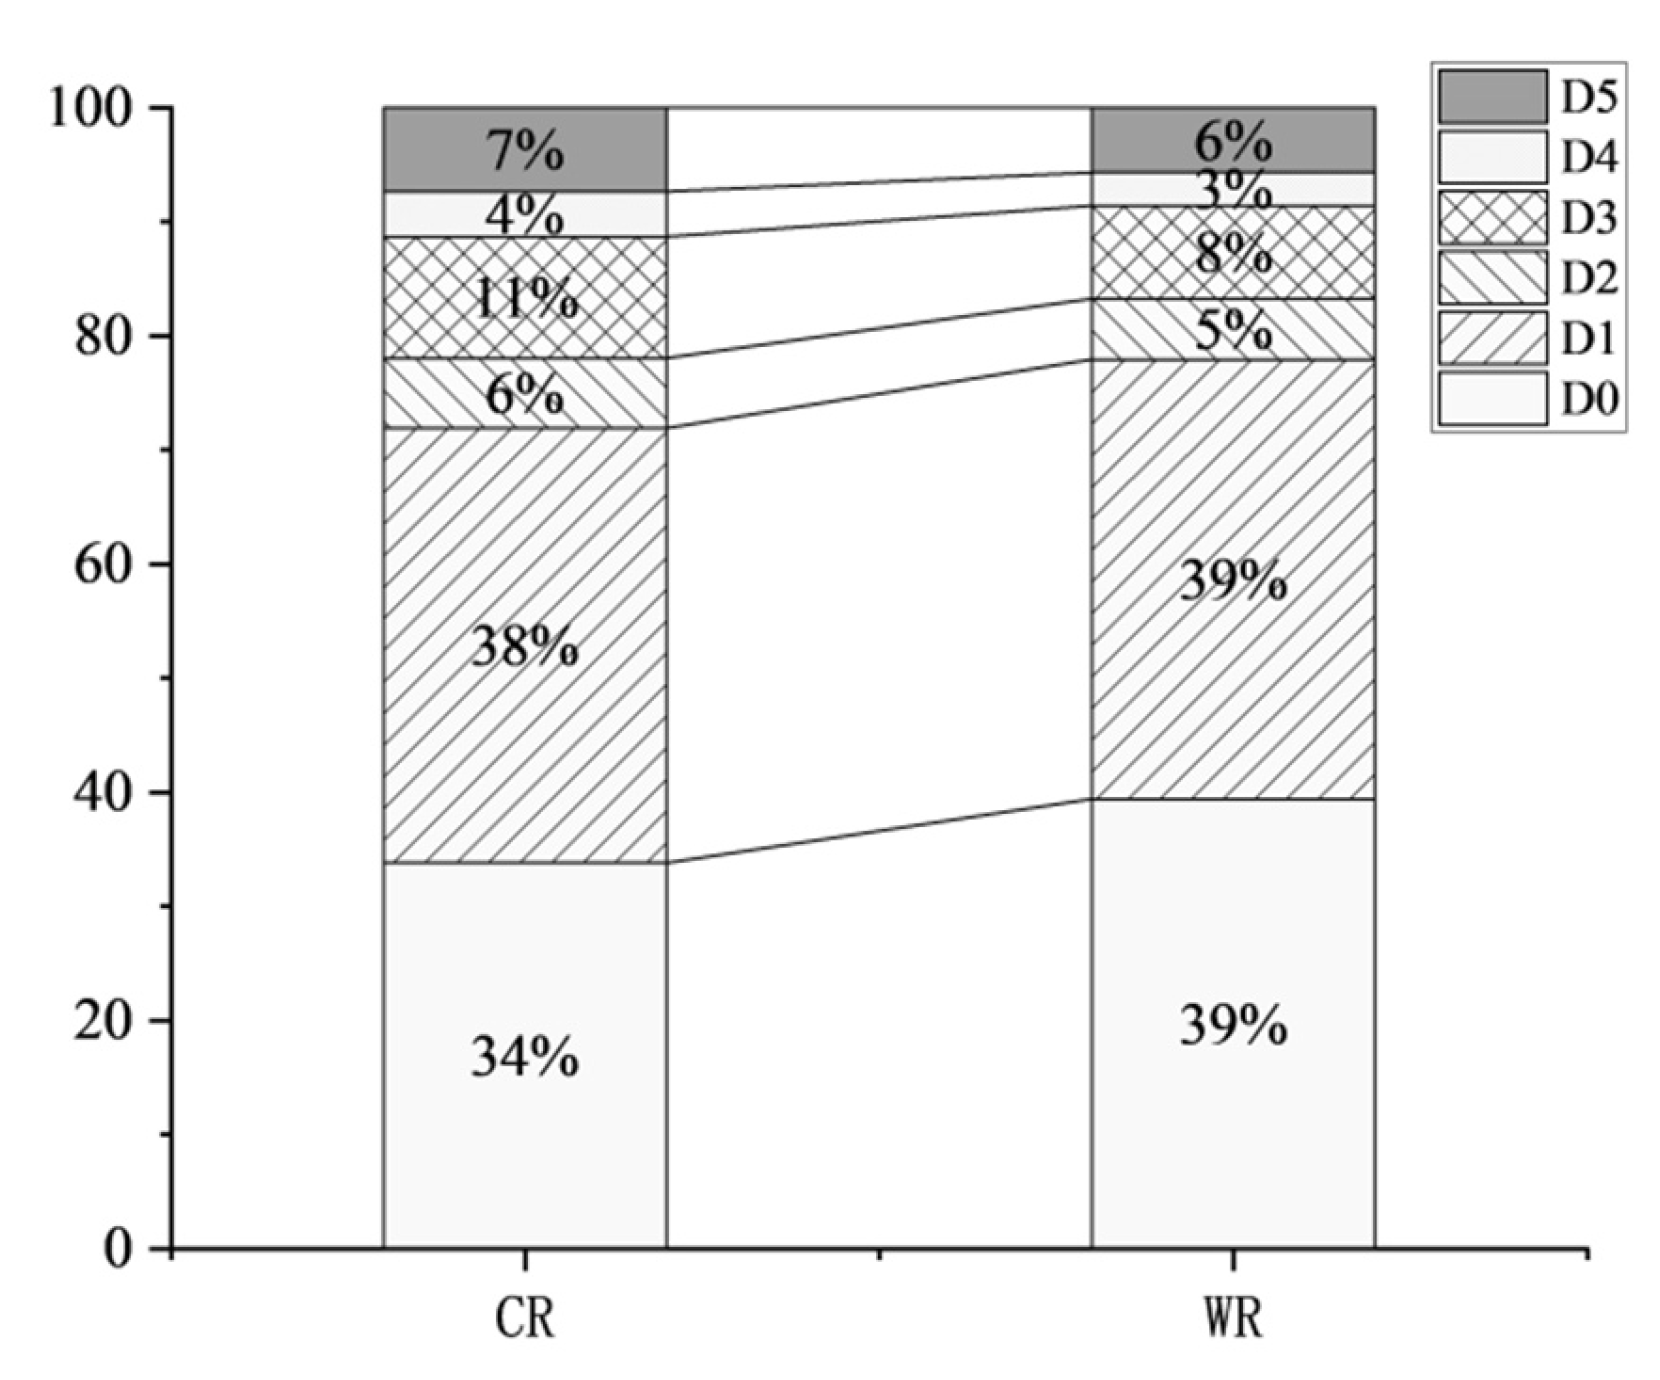
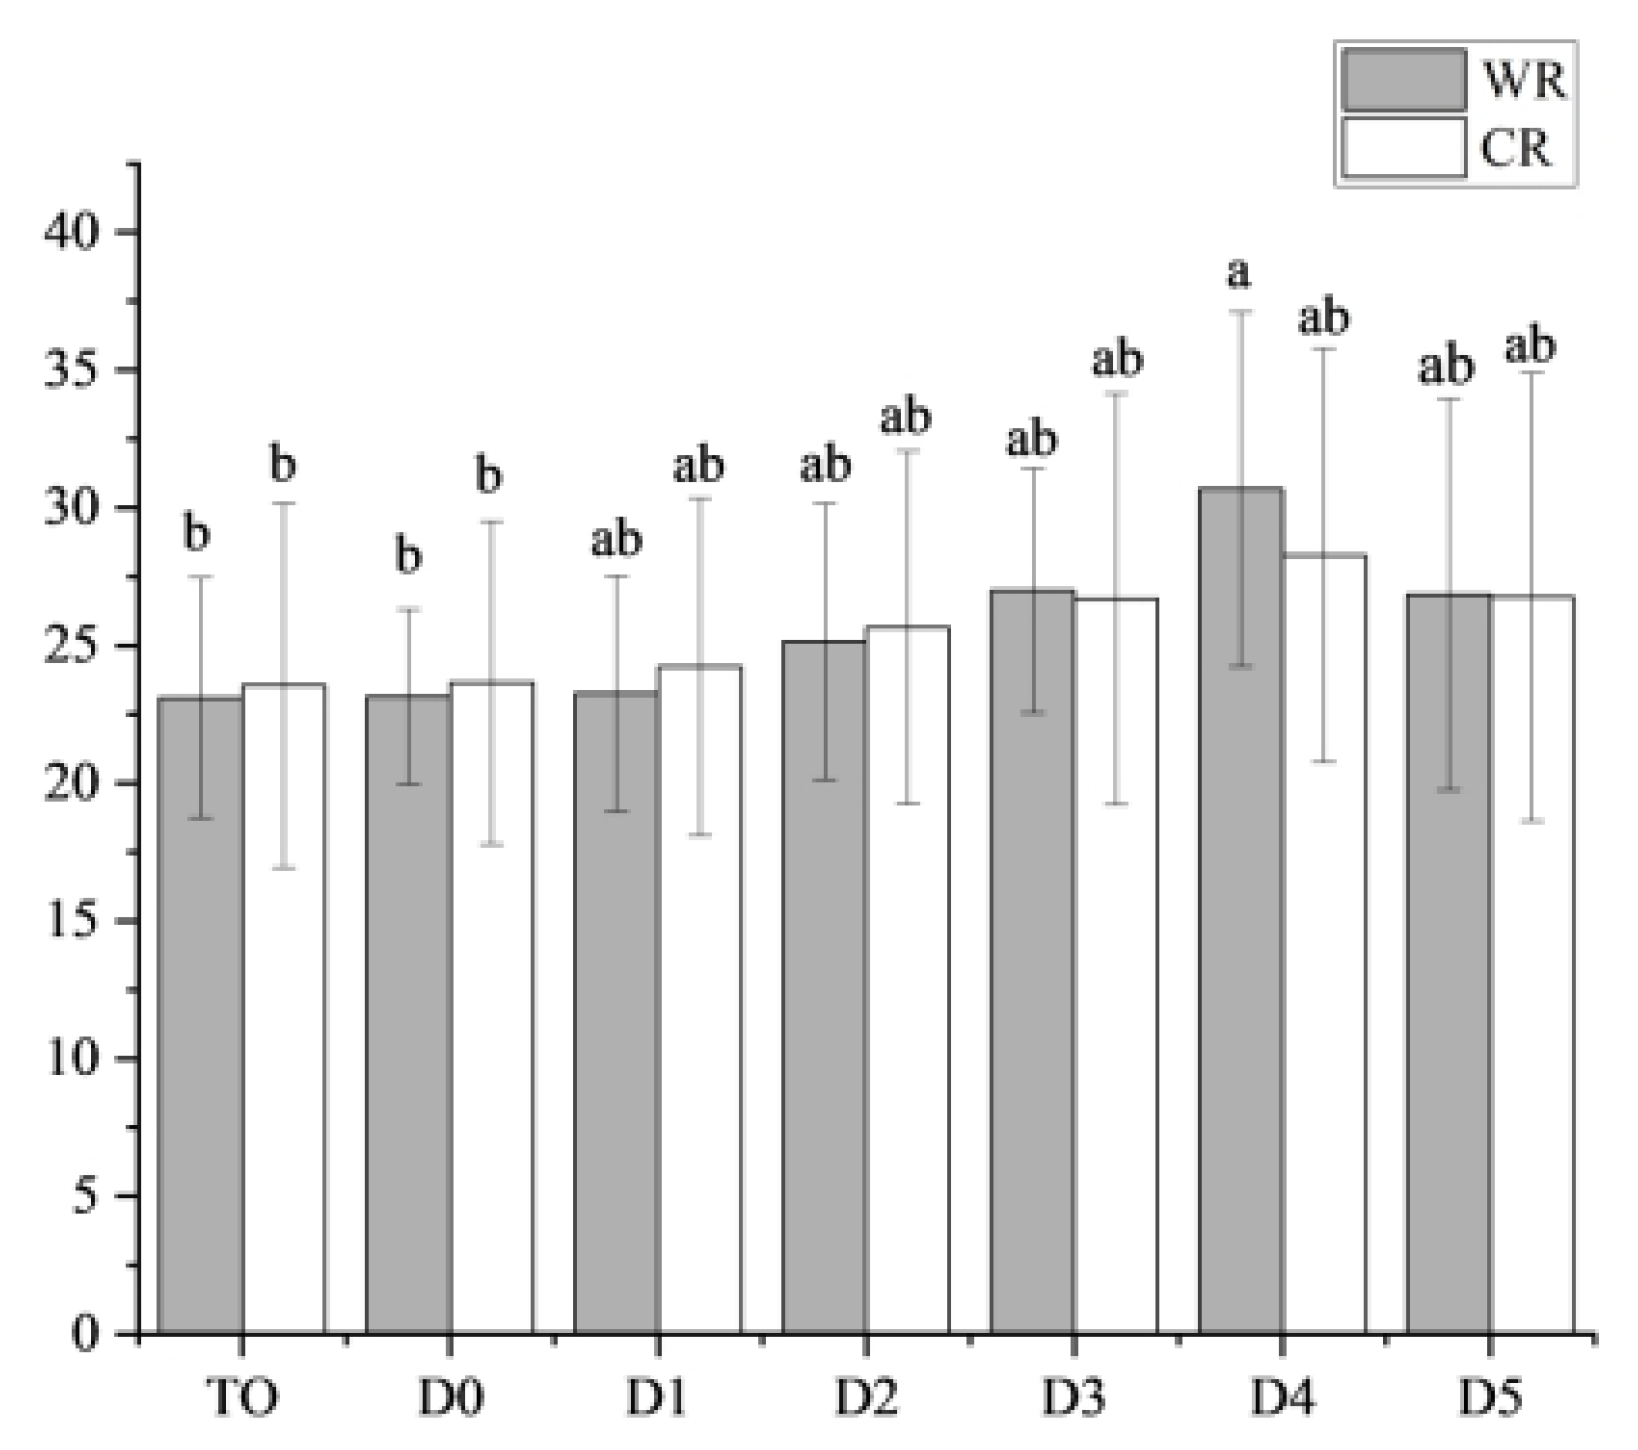
3.1. Structural Analysis of Soil Aggregates

The pattern of the percentage of water field agglomerate grain size after dry sieving from large to small decreased as follows: D1 (40.56 ± 4.25%), D0 (34.38 ± 6.29%), D3 (9.59 ± 1.55%), D5 (7.05 ± 2.58%), D2 (5.94 ± 1.06%), and D4 (3.16 ± 0.64%). The pattern of the grain size of the wet sieved water field agglomerates from large to small was D5 (28.35 ± 9.53%), D1 (25.04 ± 8.55%), D3 (13.81 ± 2.92%), D4 (11.75 ± 3.67%), D0 (10.62 ± 7.00%), and D2 (10.41 ± 1.74%). The percentage of agglomerate grain sizes of both D0 and D2 decreased by 23.76% and 15.52%, and D4 and D5 agglomerate grain level share increased by 8.59% and 21.3%, respectively (Figure 6).
The percentage of agglomerates in rice-crayfish fields after dry sieving changed as follows: D0 (40.47 ± 4.81%), D1 (38.89 ± 2.52%), D3 (7.48 ± 0.59%), D5 (5.49 ± 1.65%), D2 (5.16 ± 0.88%), and D4 (2.51 ± 0.29%) in descending order. That of wet sieving decrease as follows: D0 (27.99 ± 0.52%). were D0 (27.99 ± 5.53%), D1 (27.85 ± 10.96%), D5 (17.41 ± 3.98%), D2 (9.91 ± 3.51%), D3 (9.69 ± 4.50%), and D4 (7.14 ± 3.06%). The percentage of agglomerates in the two agglomerates, D0 and D1, was reduced by 12.62 and 10.90%, and the percentage of D4 and D5 agglomerates grain level share increased by 4.63% and 11.92%, respectively (Figure 6).
After dry sieving, the size relationship between the two types of cultivated land in the D0 soil agglomerate grain level was significantly larger in rice-crayfish fields (40.47 ± 4.81%) than in paddy fields (34.38 ± 6.29%), and was no significant difference between the contents of the two types of cultivated land in the other grain levels; after wet sieving, the size relationship between the two types of cultivated land in the D 0 soil agglomerate grain level was significantly larger in rice-crayfish fields (27.85 ± 10.96%) than in paddy fields (10.62 ± 7.00%). The size relationship between the two types of cultivated land in D5 soil aggregates was significantly smaller in rice-crayfish fields (17.41 ± 3.98%) than in paddy fields (28.35 ± 9.53%), and there was no significant difference between the contents of the two types of cultivated land in the other aggregate classes.

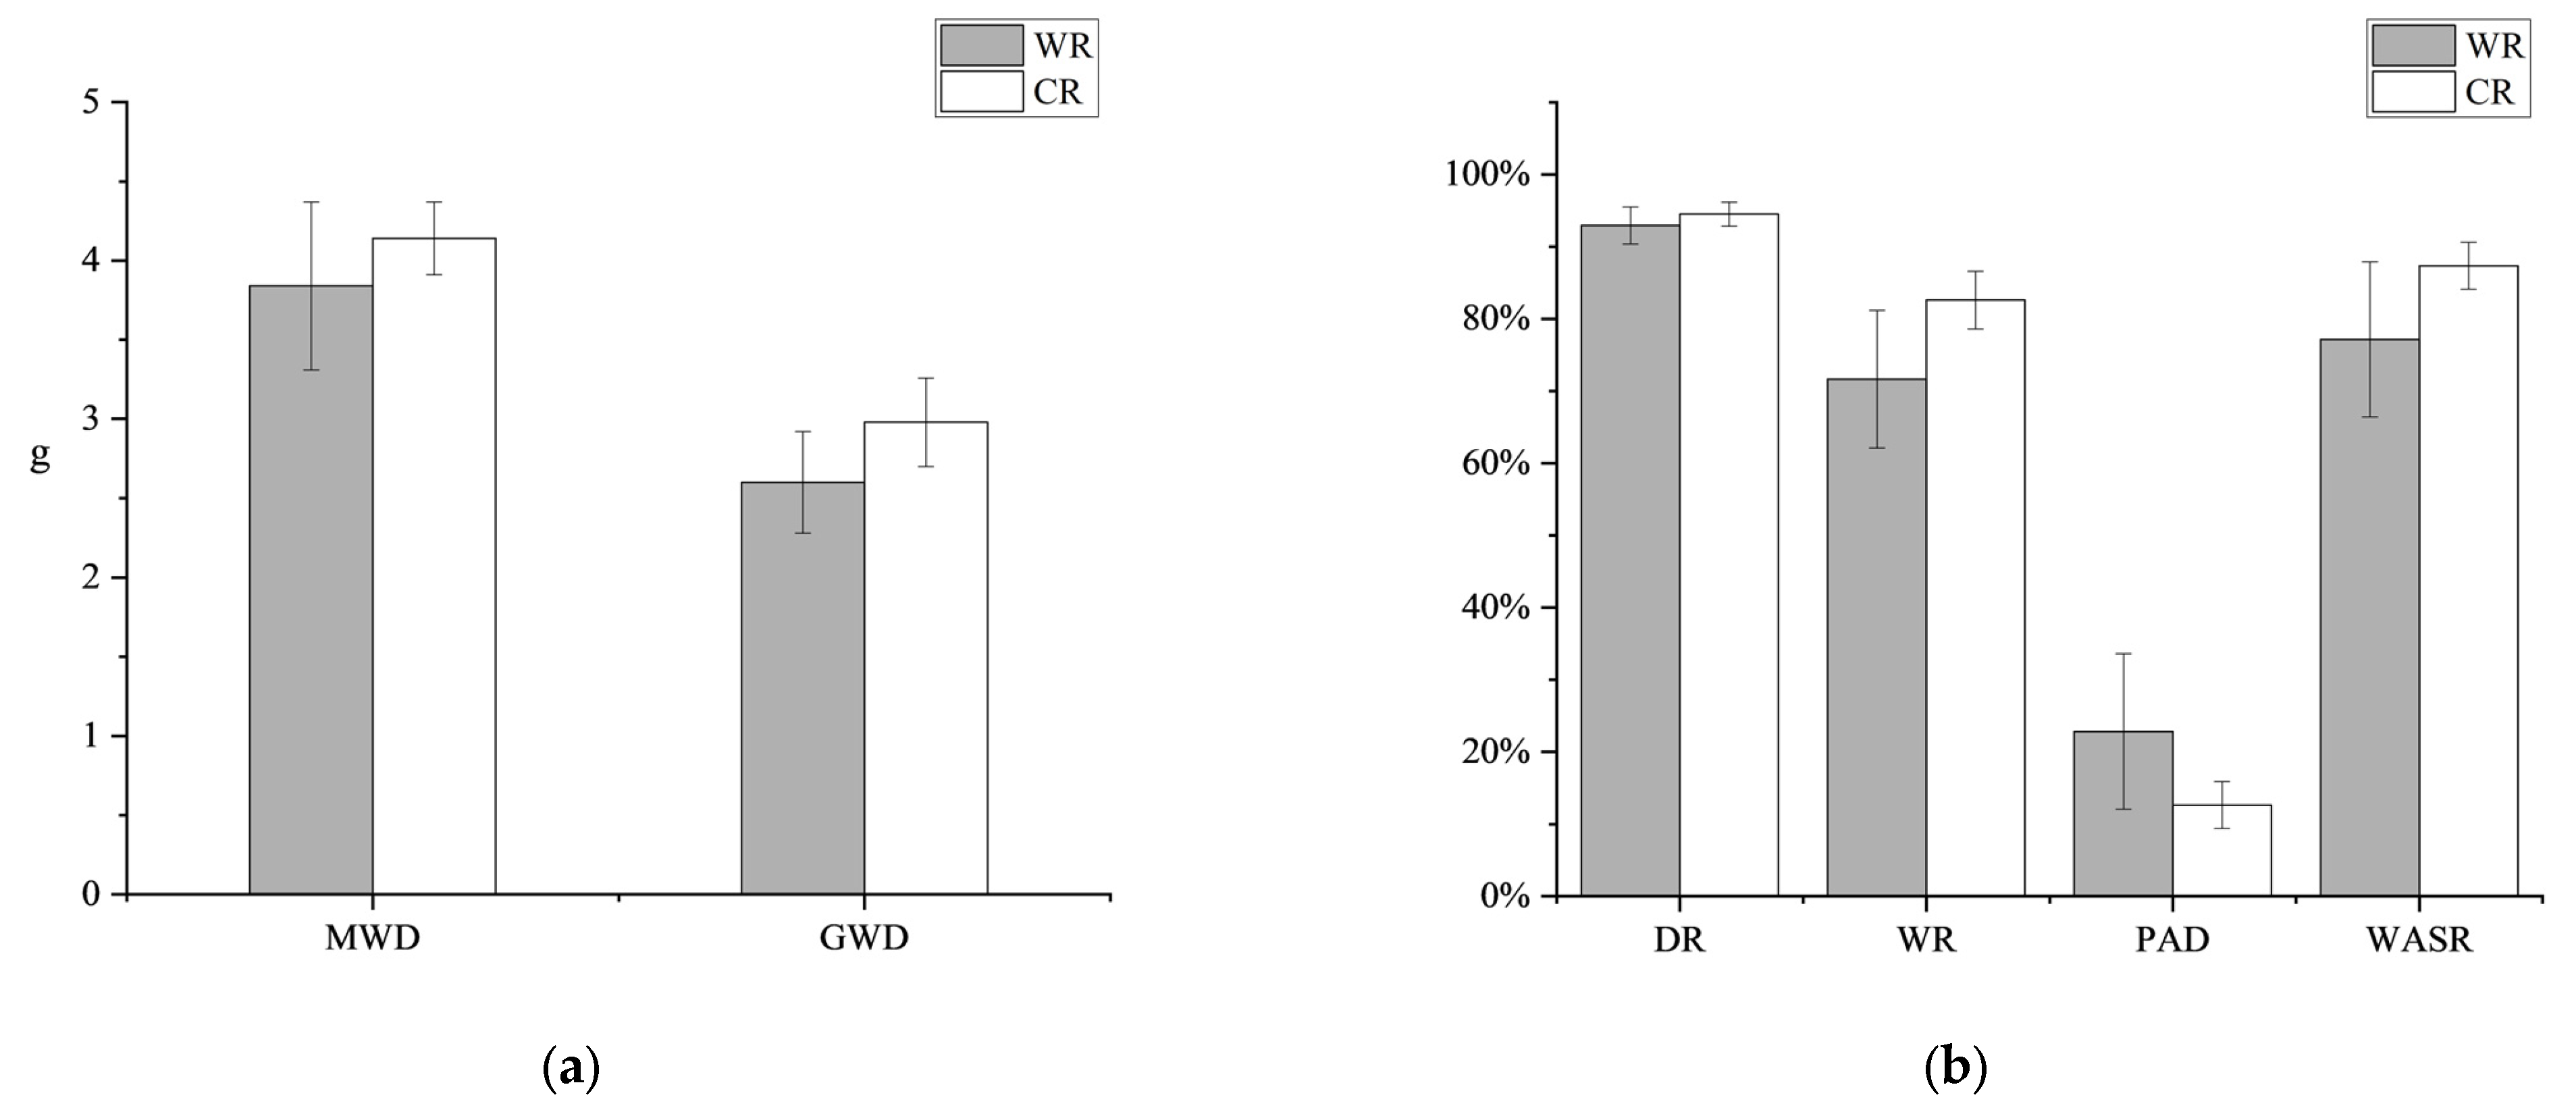
3.2. Stability Analysis of Soil Aggregates

The size relationship between the mean weight diameter MWD of agglomerates in the two cultivation types was greater in rice-crayfish fields (4.14 ± 0.23 mm) than in paddy fields (3.84 ± 0.53 mm), and the size relationship between the mean geometrical diameter GWD of agglomerates under the two types of cultivation was greater in rice-crayfish fields (2.98 ± 0.28 mm) than in paddy fields (2.60 ± 0.32 mm); the size relationship of >0.25 mm agglomerate content after dry sieving between the two types of cultivated land was greater in rice-crayfish field (94.51 ± 1.65%) than in paddy field (92.94 ± 2.57%); the size relationship of >0.25 mm agglomerate content after wet sieving between the two types of cultivated land was greater in rice-crayfish field (82.59 ± 3.98%) than in paddy field (71.64 ± 9.52%); the size relationship of PAD size relationship of agglomerate destruction rate was greater in paddy field (22.84 ± 10.76%) than in rice-crayfish field (12.64 ± 3.26%); and the size relationship of WASR size of agglomerate stability in two cultivated land types was greater in rice-crayfish field (87.36 ± 3.26%) than in paddy field (77.16 ± 10.76%) (Figure 7).

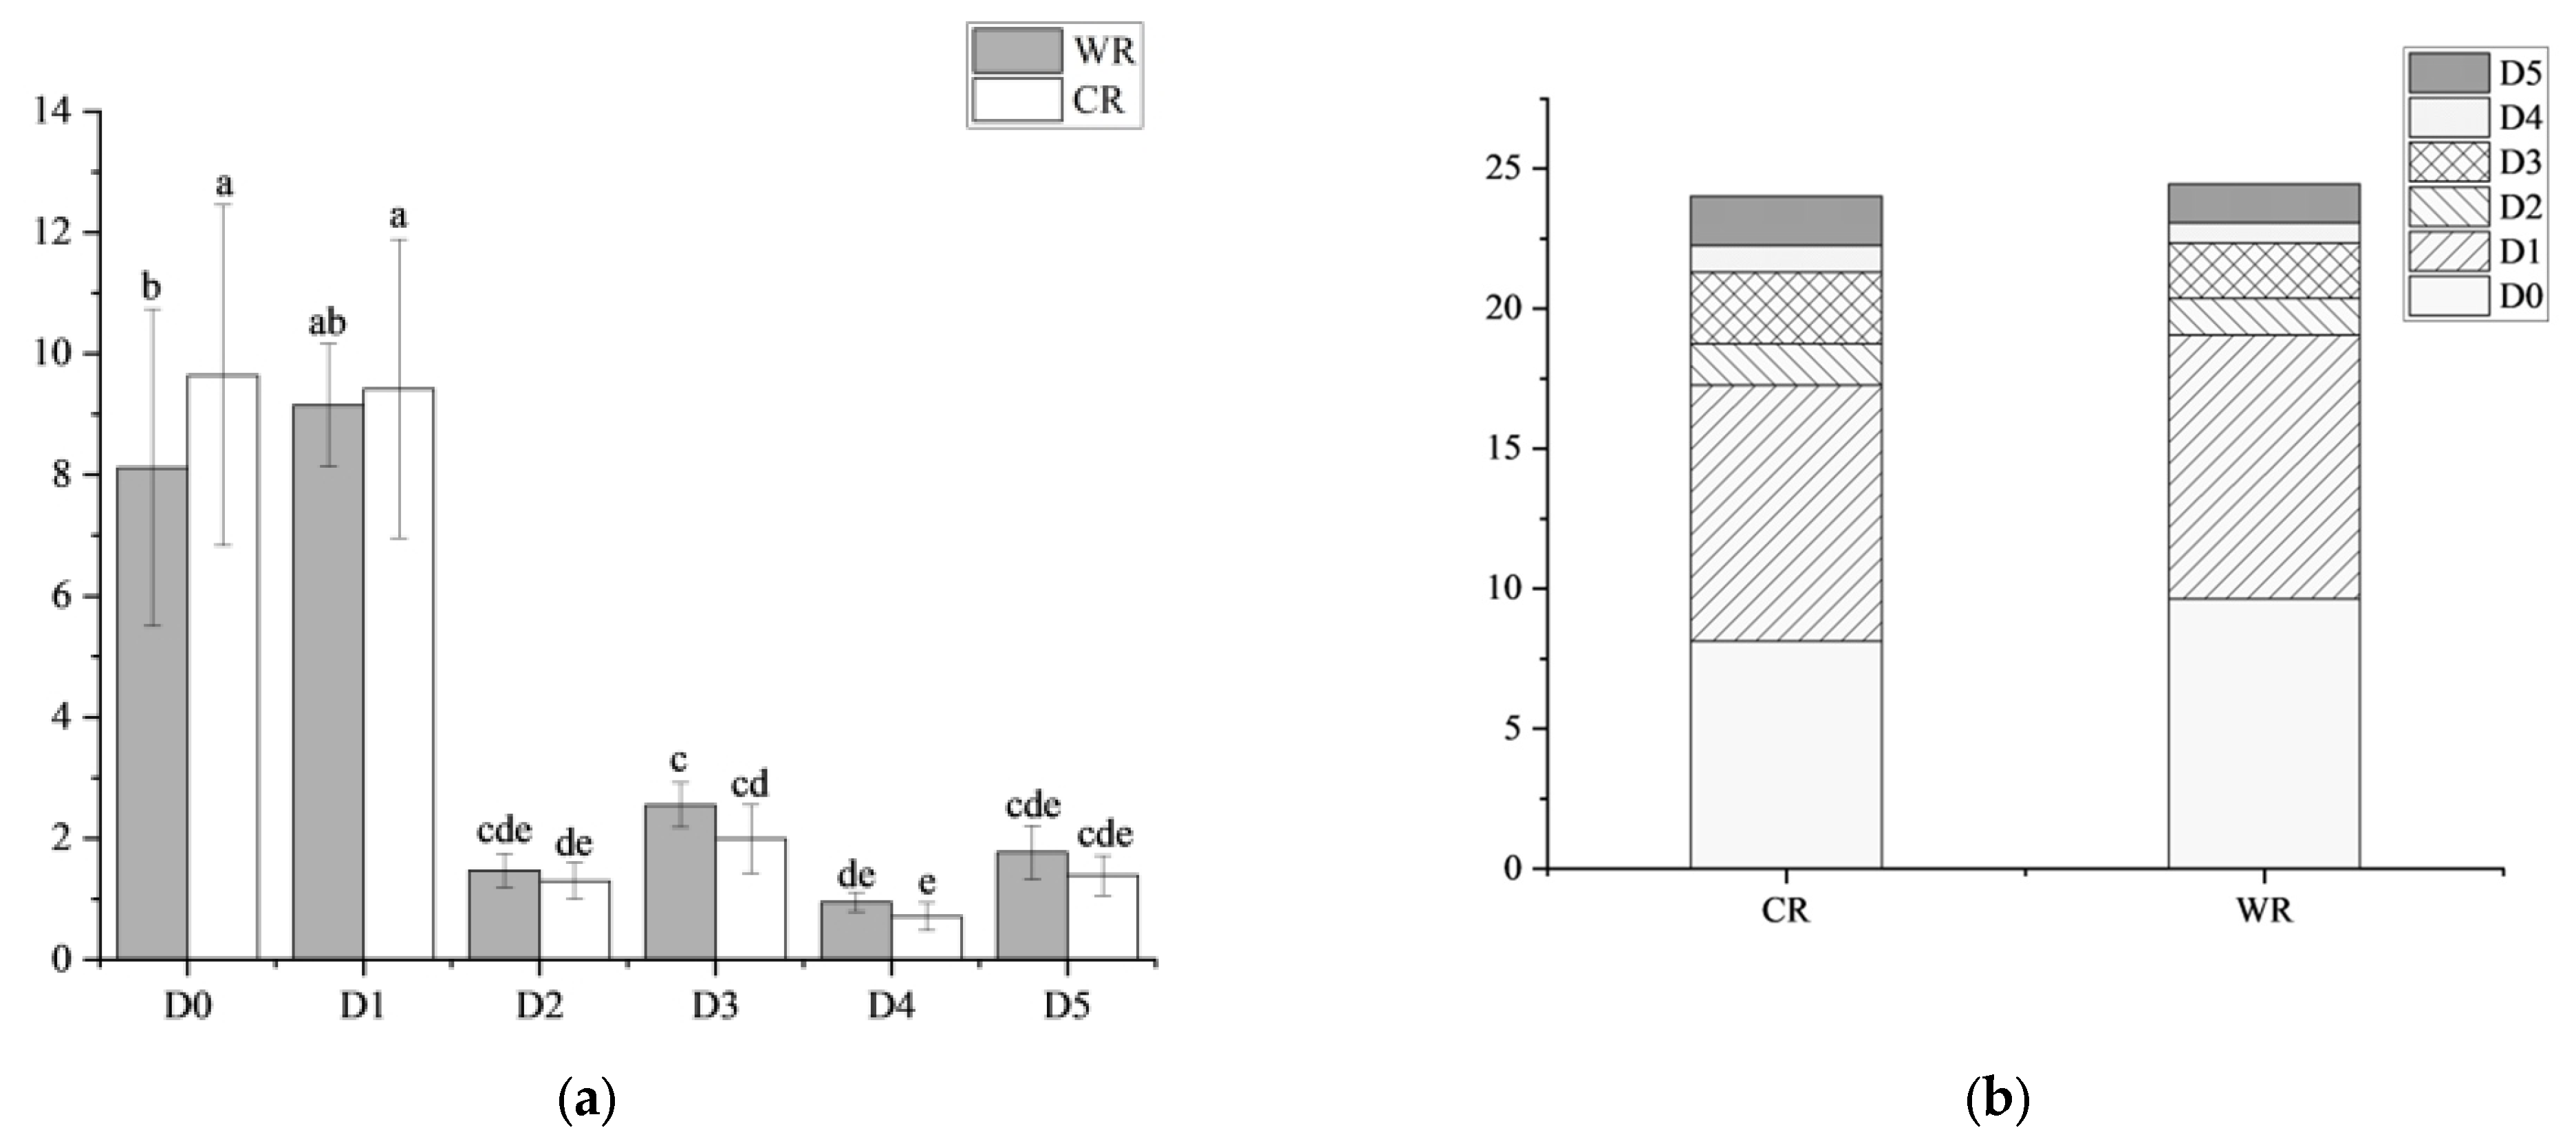
3.3. Soil Aggregate Structure and Soil Organic Matter Analysis

The relationship between the content of total soil organic matter of the two cultivation types was greater in rice-crayfish fields (23.54 ± 6.60 g/kg) than in paddy fields (23.10 ± 4.35 g/kg); the organic matter content of soil aggregates of the two types of cultivation showed a trend of increasing and then decreasing with decreasing grain size, and the organic matter content of the D4 grain size was significantly greater than that of another grain size; the organic matter content of the three grain sizes, D0, D1 and D2, presented a greater trend than that of paddy fields (23.65 ± 5.88 g/kg, 24.26 ± 6.13 g/kg, 25.65 ± 6.41 g/kg). The organic matter content of D0, D1, and D2 grain levels showed a pattern that rice-crayfish fields were larger than that of paddy fields (23.15 ± 3.17 g/kg, 23.27 ± 4.27 g/kg, and 25.15 ± 5.01 g/kg), and that of the three-grain levels of D3, D4, and D5 showed the opposite pattern, i.e., water and water were larger than that of the other grain levels. Content showed an opposite pattern, i.e., greater in paddy fields (26.99 ± 4.44 g/kg, 30.67 ± 6.43 g/kg, 28.86 ± 7.10 g/kg) than in rice-crayfish fields (26.68 ± 7.27 g/kg, 28.74 ± 7.52 g/kg, 26.76 ± 8.14 g/kg) (Figure 8).
The relationship between the content of the total RMS of soil organic matter in the two cultivated land types was greater in rice-crayfish fields (24.45 g/kg) than in paddy fields (24.02 g/kg) which is consistent with the law of the total soil organic matter; the RMS content of organic matter in each particle size of the soil aggregates of paddy fields was in the following pattern from the largest to the smallest: D1, D0, D3, D5, D2, and D4, and the RMS content of organic matter at each grain level of soil aggregates in rice-crayfish field was in the following pattern, from largest to smallest: D0, D1, D3, D5, D2, and D4; the two grain levels with the largest contribution to the organic matter content were D0 and D1, and the combined organic matter contribution of the two cultivated land types at the grain levels of D0 and D1 were, respectively, rice-crayfish field (77.94%) and paddy field (71.92%), and in these two grain levels, the relationship between the magnitude of the organic matter RMS of the two cultivated land types was significantly larger in rice-crayfish field (9.64 ± 2.81 g/kg and 9.42 ± 2.46 g/kg) than in paddy field (8.12 ± 2.61 g/kg and 9.15 ± 1.01 g/kg) (Figure 9 and Figure 10).

4. Discussion

4.1. Distribution of Soil Aggregates

The integrated rice-crayfish farming model affected the formation of soil aggregates compared to traditional paddy fields. Soil aggregates are a key factor affecting soil quality, and the content of aggregates at different grain sizes directly affects soil quality [24,25]. The present study showed that the integrated rice-crayfish farming model significantly increased the content of soil aggregates at >5 mm grain size. This may be due to the increased organic carbon input from straw left to the field and crayfish deshelling in the integrated rice-crayfish farming model, which increased the content of organic cementing material, which is conducive to the attachment of small aggregates to the large aggregates and promotes the formation of large aggregates [26].

4.2. Stability of Soil Aggregates

Average weight direct MWD, average geometric diameter GWD, and the number of large aggregates after dry sieving DR > 0.25 mm indicators reflect the size of the mechanical stability of soil aggregates. The larger the above indicators, the better the mechanical stability of soil aggregates [27,28]. The integrated rice-crayfish farming model can significantly improve the mechanical stability of soil aggregates. Its essence lies in the increase in the number of large aggregates. The soil structure can be more stable when small aggregates are cemented into larger ones.
Agglomerate destruction rate PAD, agglomerate stability WASR, the number of large agglomerates after wet sieving WR > 0.25 mm indicators reflect the size of soil aggregate water stability. The number of large agglomerates after wet sieving WR > 0.25 mm the larger, the smaller the agglomerate destruction rate PAD, the better the water stability of soil aggregates [7,29]. Under the mechanical perturbation of crayfish life activities and the interference of long-term soaking, the soil aggregate water stability indexes of rice-crayfish fields were better than those of paddy fields. The result shows that the life activities of crayfish accelerated the decomposition of straw and the generation of organic cemented material, thus improving the soil aggregate water stability. The greater the soil water stability, the greater the soil’s ability to retain water and soil during rice cultivation, and the more stable the soil structure.

4.3. Organic Matter in Soil Aggregates by Particle Size

Different from most studies, the changing trend of the organic matter content of each particle-level agglomerate in the two types of cultivated land was first increasing and then decreasing [30,31,32,33]. The organic matter content of rice-crayfish fields was greater than that of paddy fields in the structure of agglomerates of >1 mm particle size. This indicates that more small agglomerates are cemented into large agglomerates, resulting in higher organic matter content. The concept of the organic matter contribution rate of aggregates at each grain level was introduced to explore the quantitative relationship of organic matter of aggregates at each grain level in combination with the content of aggregates at each grain level. The contribution rate of >2 mm soil aggregates to soil organic matter can reach more than 72%. This result indicates that the more large aggregates there are, the more favorable the accumulation of soil organic matter is [34,35]. Increased soil organic matter content improves crop yields and safeguards soil health.

4.4. Research Shortcomings and Future Prospects

Rice-crayfish fields of organic matter content and organic matter effective value content compared to paddy fields increased but not significantly, but the increase in the number and stability of agglomerates has a significant effect. The interaction mechanism is different from that of aggregates and organic matter because most of the rice-crayfish fields in the study area are transformed from paddy fields, with a time span of about 5 to 10 years. The accumulation of organic matter is a long-term dynamic process. We ignored the organic matter accumulation in the study area, but we did not find any significant effect on the organic matter accumulation. Our study ignored the type of organic matter, and the input of organic matter would enhance the amount of activated carbon in soil aggregates to the detriment of the accumulation of inert carbon [36,37,38]. So, we guessed that the integrated rice-crayfish farming model would increase the amount of activated carbon and reduce inert carbon, but the total amount of organic matter would not change much, which could also improve the amount and stability of soil aggregates, improve soil quality and increase crop yields.

5. Conclusions

Compared to the traditional paddy cultivation mode, the integrated rice-crayfish farming approach, driven by crayfish life activities and straw decomposition, results in an amplified input of organic matter. This increase contributes to elevated levels of soil organic cementing material, subsequently raising the proportion of soil macroaggregates. The outcome is an improved structural integrity of soil aggregates, characterized by enhanced mechanical stability. Notably, parameters such as the average weight diameter (MWD) and average geometric diameter (GWD) are larger in the rice-crayfish fields than in the conventional paddy fields. Moreover, water stability, as represented by the agglomerate damage rate (PAD), is lower in rice-crayfish fields and agglomerate stability (WASR) is higher compared to paddy fields. Although the increase in soil organic matter content is modest, these findings underscore the considerable potential of integrated rice-crayfish farming in enhancing soil health and structure.
The augmented presence of large and stable soil aggregates is particularly advantageous for crop growth, as it promotes improved aeration, water retention, and nutrient availability within the root zone. Furthermore, the enhanced distribution of organic matter within larger aggregates contributes to heightened soil fertility, further supporting crop productivity.

Author Contributions

Conceptualization, L.Y. and T.L.; methodology, L.Y.; software, T.L.; validation, T.L., C.W. and Y.X.; formal analysis, T.L.; investigation, T.L.; resources, L.Y.; data curation, T.L.; writing—original draft preparation, T.L.; writing—review and editing, X.Z.; visualization, T.L.; supervision, F.H.; project administration, L.Y.; funding acquisition, L.Y. All authors have read and agreed to the published version of the manuscript.

Funding

This research was funded by National Natural Science Foundation of China (NSFC), grant number 42171270.

Data Availability Statement

The data reported in this study are contained within the article.

Conflicts of Interest

The authors declare no conflict of interest.

References

  1. Rojas, R.V.; Achouri, M.; Maroulis, J.; Caon, L. Healthy soils: A prerequisite for sustainable food security. Environ. Earth Sci. 2016, 75, 180. [Google Scholar] [CrossRef]
  2. Dynarski, K.A.; Bossio, D.A.; Scow, K.M. Dynamic Stability of Soil Carbon: Reassessing the “Permanence” of Soil Carbon Sequestration. Front. Environ. Sci. 2020, 8, 514701. [Google Scholar] [CrossRef]
  3. Barthès, B.; Roose, E. Aggregate stability as an indicator of soil susceptibility to runoff and erosion; validation at several levels. Catena 2002, 47, 133–149. [Google Scholar] [CrossRef]
  4. Okolo, C.C.; Gebresamuel, G.; Zenebe, A.; Haile, M.; Eze, P.N. Accumulation of organic carbon in various soil aggregate sizes under different land use systems in a semi-arid environment. Agric. Ecosyst. Environ. 2020, 297, 106924. [Google Scholar] [CrossRef]
  5. Sun, Z.; Liu, Z.; Han, J.; Wang, H.; Zhang, H.; Yan, J. Long-term effects of soft rock amendment on changes of soil aggregate cementing agents of sandy soil by SEM-EDS. Front. Environ. Sci. 2023, 11, 1207781. [Google Scholar] [CrossRef]
  6. Bongiovanni, M.D.; Lobartini, J.C. Particulate organic matter, carbohydrate, humic acid contents in soil macro- and microaggregates as affected by cultivation. Geoderma 2006, 136, 660–665. [Google Scholar] [CrossRef]
  7. Pihlap, E.; Steffens, M.; Koegel-Knabner, I. Initial soil aggregate formation and stabilisation in soils developed from calcareous loess. Geoderma 2021, 385, 114854. [Google Scholar] [CrossRef]
  8. Zotarelli, L.; Alves, B.J.R.; Urquiaga, S.; Boddey, R.M.; Six, J. Impact of tillage and crop rotation on light fraction and intra-aggregate soil organic matter in two Oxisols. Soil Tillage Res. 2007, 95, 196–206. [Google Scholar] [CrossRef]
  9. Kamau, S.; Barrios, E.; Karanja, N.K.; Ayuke, F.O.; Lehmann, J. Dominant tree species and earthworms affect soil aggregation and carbon content along a soil degradation gradient in an agricultural landscape. Geoderma 2020, 359, 113983. [Google Scholar] [CrossRef]
  10. Liu, Y.; Liu, W.; Wu, L.; Liu, C.; Wang, L.; Chen, F.; Li, Z. Soil aggregate-associated organic carbon dynamics subjected to different types of land use: Evidence from 13C natural abundance. Ecol. Eng. 2018, 122, 295–302. [Google Scholar] [CrossRef]
  11. Rabbi, S.M.F.; Wilson, B.R.; Lockwood, P.V.; Daniel, H.; Young, I.M. Soil organic carbon mineralization rates in aggregates under contrasting land uses. Geoderma 2014, 216, 10–18. [Google Scholar] [CrossRef]
  12. Tisdall, J.M.; Cockroft, B.; Uren, N.C. The stability of soil aggregates as affected by organic materials, microbial activity and physical disruption. Aust. J. Soil Res. 1978, 16, 9–17. [Google Scholar] [CrossRef]
  13. Are, M.; Kaart, T.; Selge, A.; Reintam, E. The Effects of Crops Together with Winter Cover Crops on the Content of Soil Water-Stable Aggregates in Organic Farming. Agriculture 2021, 11, 1035. [Google Scholar] [CrossRef]
  14. Tobiášová, E.S.A.U. Land use influence on micro-aggregates. Folia Oecologica 2011, 38, 126. [Google Scholar]
  15. Mbagwu, J.S.C.; Bazzoffi, P. Properties of soil aggregates as influenced by tillage practices. Soil Use Manag. 2007, 5, 180–188. [Google Scholar] [CrossRef]
  16. Dong, X.; Guan, T.; Li, G.; Lin, Q.; Zhao, X. Long-term effects of biochar amount on the content and composition of organic matter in soil aggregates under field conditions. J. Soil Sediment 2016, 16, 1481–1497. [Google Scholar] [CrossRef]
  17. Fonte, S.J.; Barrios, E.; Six, J. Earthworm impacts on soil organic matter and fertilizer dynamics in tropical hillside agroecosystems of Honduras. Pedobiologia 2010, 53, 327–335. [Google Scholar] [CrossRef]
  18. Waters, A.G.; Oades, J.M. Organic Matter in Water-stable Aggregates. In Advances in Soil Organic Matter Research; Wilson, W.S., Ed.; Woodhead Publishing: Cambridge, UK, 2003; pp. 163–174. [Google Scholar]
  19. Zhang, D.; Zhang, W.; Cao, Y.; Zhu, J.; Gao, H.; Ye, X.; Hou, J. Integrative analysis of poor rice yield and influencing factors in rice-fishery aquaculture system in China. Jiangsu Agric. Sci. 2022, 50, 88–95. [Google Scholar] [CrossRef]
  20. Xiao, L.; Yang, H.; Lai, Z.; Lai, S.; Ni, C.; Chen, X.; Jian, M. Characteristics of soil microbial communities in paddy fields in response to rice-turtle cropping. J. Agric. Eng. 2022, 38, 102–109. [Google Scholar] [CrossRef]
  21. Yu, S.; Ouyang, Y.; Zhang, Q.; Peng, G.; Xu, D.; Jin, Q. Effects of a rice-duck complex system on rice growth and yield. J. Appl. Ecol. 2005, 16, 1252–1256. [Google Scholar]
  22. Zheng, H.B.; Hu, T.; Chen, Y.; Huang, J. Analysis of rice yield and economic benefits of rice-mallard duck composite ecological farming technology. Crop Res. 2012, 26, 127–130. [Google Scholar]
  23. Ni, M.L.; Deng, K.; Zhang, W.Y.; Shang, Y.Q.; Wei, F.; Yuan, P.L.; Li, Z.; Fan, D.; Cao, M.G.; Wang, J.P. Impacts of rice-shrimp aquaculture on rice yield and food security. Chin. J. Ecol. Agric. 2022, 30, 1293–1300. (In English) [Google Scholar] [CrossRef]
  24. Zhu, Y.; Shen, H.; Feng, Y.; Li, H.; Akinyemi, D.S.; Hu, H.; Fang, J. Effects of shrub encroachment on soil aggregates and organic carbon vary in different grasslands in Inner Mongolia, China. Ecosphere 2021, 12, e03363. [Google Scholar] [CrossRef]
  25. Totsche, K.U.; Amelung, W.; Gerzabek, M.H.; Guggenberger, G.; Klumpp, E.; Knief, C.; Lehndorff, E.; Mikutta, R.; Peth, S.; Prechtel, A.; et al. Microaggregates in soils. J. Plant Nutr. Soil Sci. 2018, 181, 104–136. [Google Scholar] [CrossRef]
  26. Hernandez, T.; Hernandez, M.C.; Garcia, C. The effects on soil aggregation and carbon fixation of different organic amendments for restoring degraded soil in semiarid areas. Eur. J. Soil Sci. 2017, 68, 941–950. [Google Scholar] [CrossRef]
  27. Annabi, M.; Le Bissonnais, Y.; Le Villio-Poitrenaud, M.; Houot, S. Improvement of soil aggregate stability by repeated applications of organic amendments to a cultivated silty loam soil. Agric. Ecosyst. Environ. 2011, 144, 382–389. [Google Scholar] [CrossRef]
  28. Teixeira, P.C.; Misra, R.K. Erosion and sediment characteristics of cultivated forest soils as affected by the mechanical stability of aggregates. Catena 1997, 30, 119–134. [Google Scholar] [CrossRef]
  29. Yudina, A.; Klyueva, V.; Romanenko, K.; Fomin, D. Micro- within macro: How micro-aggregation shapes the soil pore space and water-stability. Geoderma 2022, 415, 115771. [Google Scholar] [CrossRef]
  30. Zou, L.; Chen, F.; Duncan, D.S.; Fang, X.; Wang, H. Reforestation and slope-position effects on nitrogen, phosphorus pools, and carbon stability of various soil aggregates in a red soil hilly land of subtropical China. Can. J. For. Res. 2015, 45, 26–35. [Google Scholar] [CrossRef]
  31. Das, B.; Chakraborty, D.; Singh, V.; Aggarwal, P.; Singh, R.; Dwivedi, B. Effect of Organic Inputs on Strength and Stability of Soil Aggregates Under Rice-Wheat Rotation. Int. Agrophys. 2014, 28, 163–168. [Google Scholar] [CrossRef]
  32. Li, W.; Zheng, Z.; Li, T.; Zhang, X.; Wang, Y.; Yu, H.; He, S.; Liu, T. Effect of tea plantation age on the distribution of soil organic carbon fractions within water-stable aggregates in the hilly region of Western Sichuan, China. Catena 2015, 133, 198–205. [Google Scholar] [CrossRef]
  33. Ussiri, D.; Lal, R.; Jacinthe, P. Post-Reclamation Land Use Effects on Properties and Carbon Sequestration in Minesoils of Southeastern Ohio. Soil Sci. 2006, 171, 261–271. [Google Scholar] [CrossRef]
  34. Goh, K.; Rafter, T.; Stout, J.; Walker, T. The accumulation of soil organic matter and its carbon isotope in a chronosequence of soils developed on aeolian sand in New Zealand. J. Soil Sci. 2006, 27, 89–100. [Google Scholar] [CrossRef]
  35. Wei, X.; Xiong, J.; Li, T.; Wen, J.; Zeng, X.; Yu, D. Effects of different organic amendments on soil organic carbon and its labile fractions in the paddy soil of a double rice cropping system. Ying Yong Sheng Tai Xue Bao = J. Appl. Ecol. 2020, 31, 2373–2380. [Google Scholar] [CrossRef]
  36. Almendros, G.; Giampaolo, S.; Pardo, M. Laboratory appraisal of carbon sequestration and nutrient availability after different organic matter inputs in virgin and cultivated Zimbabwean soils. Commun. Soil Sci. Plant Anal. 2007, 32, 877–894. [Google Scholar] [CrossRef]
  37. Civeira, G.I.D.S. Estimation of carbon inputs to soils from wheat in the Pampas Region, Argentina. Czech J. Genet. Plant 2011, 47, S39–S42. [Google Scholar] [CrossRef]
  38. Phaneendra, B.; Ramamurthy, V.; Maske, S. Pedological Assessment of Soil Organic Carbon and Total Nitrogen Contents in Wetland Rice Ecosystems of Majuli River Island, Assam, India. In Soil Nitrogen Ecology; Springer International Publishing: Cham, Switzerland, 2021; pp. 93–109. [Google Scholar]
Figure 1. Top view of rice-crayfish field.
Agronomy 14 00016 g001
Figure 2. Timeline of rice-crayfish field planting patterns.
Agronomy 14 00016 g002
Figure 3. Rice-crayfish field planting pattern—middle rice planting period.
Agronomy 14 00016 g003
Figure 4. Rice-crayfish field planting patterns—crayfish fry culture phase.
Agronomy 14 00016 g004
Figure 5. Distribution of sample points of arable soil samples. (The administrative division data was derived from the base map of the standard map of the Geographic Information Bureau of the State Bureau of Surveying and Mapping (http://bzdt.ch.mnr.gov.cn/; accessed on 31 October 2023).
Agronomy 14 00016 g005
Figure 6. Percentage (%) of each grain size of soil aggregates in paddy fields and rice-crayfish fields after dry sieving (D) or wet sieving (W) treatments. (Note: WR: paddy field; CR: rice-crayfish field; D: dry sieving treatment; W: wet sieving treatment; D0: >5 mm; D1: 5–2 mm; D2: 2–1 mm; D3: 1–0.5 mm; D4: 0.5–0.25 mm; D5: <0.25 mm. Different letters indicate the difference up to the 5% significant level).
Agronomy 14 00016 g006
Figure 7. Indicators of agglomerate stability for both cropland types ((a)—g; (b)—%). (Note: WR: paddy field; CR: rice-crayfish field; MWD: mean weight diameter; GWD: mean geometric diameter; DR: content of >0.25 mm agglomerates after dry sieving; WR: content of >0.25 mm agglomerates after wet sieving; PAD: agglomerate destruction rate; WASR: agglomerate stability).
Agronomy 14 00016 g007
Figure 8. Organic matter content (g/kg) of soil aggregates of both types at each grain level. (Note: WR: paddy field; CR: rice-crayfish field; D: dry sieving treatment; W: wet sieving treatment; D0: >5 mm; D1: 5–2 mm; D2: 2–1 mm; D3: 1–0.5 mm; D4: 0.5–0.25 mm; D5: <0.25 mm; TO: total organic matter. Different letters indicate the difference up to the 5% significant level.).
Agronomy 14 00016 g008
Figure 9. RMS of organic matter content (g/kg) of soil aggregates of different arable land types at each grain level ((a): distribution at all levels; (b): Accumulation at all levels). (Note: WR: paddy field; CR: rice-crayfish field; D: dry sieving treatment; W: wet sieving treatment; D0: >5 mm; D1: 5–2 mm; D2: 2–1 mm; D3: 1–0.5 mm; D4: 0.5–0.25 mm; D5: <0.25 mm; eTO: total organic matter rms. Different letters indicate the difference up to the 5% significant level).
Agronomy 14 00016 g009
Figure 10. Contribution of organic matter (g/kg) to soil aggregates of both arable land types at each grain level.
Agronomy 14 00016 g010
Disclaimer/Publisher’s Note: The statements, opinions and data contained in all publications are solely those of the individual author(s) and contributor(s) and not of MDPI and/or the editor(s). MDPI and/or the editor(s) disclaim responsibility for any injury to people or property resulting from any ideas, methods, instructions or products referred to in the content.

