Article

Long-Term Study of the Crop Forcing Technique on cv. Tempranillo (Vitis vinifera L.) Vines and Suggested Irrigation Strategies to Improve Water Use Efficiency of Forced Vines

1
Efficient Use of Water in Agriculture, Institute of Agrifood Research and Technology (IRTA), 25003 Lleida, Spain
2
Departamento de Ingeniería Agraria y del Medio Natural, Universidad de La Laguna, 38206 La Laguna, Spain
*
Author to whom correspondence should be addressed.
Agronomy 2024, 14(1), 130; https://doi.org/10.3390/agronomy14010130
Submission received: 7 December 2023 / Revised: 27 December 2023 / Accepted: 1 January 2024 / Published: 4 January 2024

Abstract

:
Recently, the crop forcing technique (summer pruning that “forces” the vine to start a new cycle) has proven to be effective in delaying the harvest date and increasing must acidity, but also reducing the yield. However, recent information on deficit irrigation strategies combined with the crop forcing technique reveals that the crop forcing technique reduces irrigation water use efficiency. Two experiments were conducted. Experiment 1 was a 4-year trial to test the effect of the forcing pruning date on the phenology, yield, yield components and water requirements when post-veraison water stress is applied. In this experiment, the treatments were unforced vines (UF-RDI) and forced vines with a forcing pruning date about 70 (F1-RDI) and 100 (F2-RDI) days after budburst. The harvest date was delayed 34 (F1) and 66 (F2) days increasing the must acidity and malic acid concentration in the forced treatments. However, both forced treatments had a reduced yield (36% in F1 and 49% in F2) and irrigation water use efficiency (12% in F1 and 65% in F2). Experiment 2 was a 2-year trial in which irrigation was suppressed before the forcing pruning in F1 (F1-Pre) and F2 (F2-Pre) and after veraison. The yield, yield components, must quality and irrigation were compared to forced vines with irrigation suppression only after veraison (F1-RDI and F2-RDI). For the entire experiment, both treatments in which irrigation was suppressed before the forcing pruning reduced the amount of irrigation supplied (10% in F1-Pre and 30% in F2-Pre) with no negative effects on the yield, yield components or must quality when compared to F-RDI treatments.

1. Introduction

Recently, some research in viticulture has focused on different management techniques with the aim of minimizing the effects of climate change on grape and wine quality [1,2]. Some of the main negative effects of global warming on berry and must quality are lower must acidity and anthocyanin content and increased sugar content [1]. The crop forcing technique (also known as the forcing regrowth technique) has become a topic of research interest since it has proven to be a useful technique to delay the harvest date by as much as two months [3]. As a result, the berries ripen under cooler conditions with an increase in must acidity and malic acid concentration [3,4,5,6,7]. However, vines in which the crop forcing technique is carried out have a reduced yield [4,5,6,7]. The crop forcing technique consists of a summer pruning (removing all the leaves, grapes and laterals and trimming the remaining shoots to a number of buds ranging from two to eight), which forces the vines to a start a new biological cycle after the dormant buds are forced to unlock, because removing the shoot tips breaks correlative inhibition [3]. The exact date on which the forcing pruning should be performed has been a topic of research. If the forcing pruning date is too late, the yield is reduced to almost zero [3,5], but if forcing pruning is performed too early (at full bloom), the number of bunches per vine may be reduced [3,4,5,6,7].
As global warming advances, irrigation strategies that minimize water consumption and improve the yield and berry quality are necessary tools in hot and semiarid areas [8]. In Spain, the most common irrigation strategy in red varieties is to stop irrigation after veraison, partly because of some Spanish wine quality certificate restrictions and partly because of the belief that irrigation after veraison impairs the berry quality [9]. However, with a post-veraison water deficit strategy, forced vines have a reduced irrigation water use efficiency (IWUE), which is the ratio between the yield and the amount of water applied through irrigation, when compared to unforced vines with the same irrigation strategy [7]. Recently, a pre-veraison irrigation deficit strategy based on a stem water potential threshold of −1.1 MPa to activate irrigation also failed to improve IWUE in forced vines when compared to unforced vines [10]. However, promising results were found in forced vines with a forcing pruning date (the time when the vines are pruned to force the dormant buds to unlock) 85 days after budburst when irrigation was suppressed in the pre-forcing pruning period, although this strategy reduced the number of bunches per vine and, therefore, the yield [7]. Therefore, since in a water scarcity scenario techniques that increase water use efficiency must be a priority [11], it seems that the crop forcing technique does not presently meet the required objective.
The goal of this study is to assess the crop forcing technique in terms of the phenology, yield, yield components and must quality on two different dates of crop forcing pruning (F1 crop forcing pruning 70 and F2 100 days after budburst) with a post-veraison irrigation water deficit in four consecutive years (2017, 2018, 2019 and 2020). In addition, an analysis is made of the attempt to improve irrigation water use efficiency in forced vines through the addition of two treatments with pre-forcing pruning irrigation suppression (F1-Pre and F2-Pre) in two consecutive years (2019 and 2020).

2. Materials and Methods

2.1. Experimental Site

The trial was divided into two sub-experiments (Experiment 1 and Experiment 2) and was conducted in 2017, 2018, 2019 and 2020 in a commercial vineyard in Lleida (Spain) (41°39′2″ N; 0°31′9″ E; 320 m above sea level) on Tempranillo vines grafted on R110 rootstock and planted in 2013. The rows were north–south (31.6° N-E) oriented with a slope of 2% and with 1.65 m between vines and 2.5 m between rows. Vines were trained with double cordons and had a vertically positioned canopy. The criterion for winter pruning was to leave about 12 spurs on each vine and two buds per spur. The soil was poor in organic matter (<1.5%), non-saline (EC = 0.27 dS/m) and stony (≈35%), with a silty loam texture (22.7% clay, 49.3% silt, 28% sand) and a maximum deepness explorable by the roots of 1 m. Vines were drip irrigated with 2.3 L/h pressure compensating emitters spaced at 0.6 m intervals. The climate is characterized by cold winters with fog and hot summers with the possibility of heat waves with temperatures above 40 °C exceptionally. The regional Winkler index is 1905 growing degree days (GDD) calculated according to the Winkler method [12] and classified as III but close to IV. The mean annual precipitation and reference evapotranspiration are 340 mm and 1064 mm, respectively (data from 2007 to 2017). Rainfall events occur mainly in spring and autumn, mostly outside the growing season.

2.2. Experiment 1: Assessing the Long-Term Effect of the Crop Forcing Technique Performed on Two Different Dates: Experimental Design

This experiment was designed to assess the long-term effects of two crop forcing pruning dates. Three treatments were tested from season 2017 to season 2020: unforced vines conducted conventionally (UF-RDI), forced vines about 70 days after budburst (DABB) (F1-RDI) and forced vines about 100 DABB (F2-RDI). The main phenological stages and forcing dates for each year are summarized in Table 1. The crop forcing pruning was performed mechanically with a pre-pruner (Pellenc DISCO, Pellenc SAS, Pertuis, France) attached to a tractor, leaving 6–8 buds per shoot, and manually removing the remaining leaves and bunches. In UF-RDI vines, a standard removal of excessive/basal lateral shoots was undertaken in early summer, together with the removal of the bunch zone leaves (below nodes 3–6) to allow exposure of the bunch to the sun, and mechanical hedging and lateral trimming were executed. Additionally, fruit thinning was performed 1 month before veraison to establish a fruit load of about 20 bunches per vine. In forced treatments, no other management operation was performed apart from the crop forcing. Due to requirements of the plot owners to facilitate differentiated disease and pest control and to reduce experimental costs, plots were not randomly distributed in Experiment 1. Based on a high-resolution Normalized Difference Vegetation Index (NDVI) map generated in 2016 of the same field and previously described in [13], in an area as homogeneous as possible, three parallel and adjacent plots with four rows of 300 m (182 vines per row) per plot were established. In each plot, one forcing treatment was assigned randomly. Then, each plot was divided into four replicates of 88 vines (four rows of 22 vines) per replicate following the most likely gradient of vigor observed in the NDVI map. In each repetition, 20 central vines were used as the main plot and the rest as borders. The maximum distance between two vines of each replicate of different treatments was 22.5 m (between the UF and the F1). The experimental design and the NDVI map mentioned above are depicted in Figure S1.
Weather data were collected from a weather station located 6.8 km from the plot. The weather station forms part of the regional weather service of Catalonia. Vine phenology was assessed weekly according to the modified E-L system [14] and a particular phenological stage was considered to have been reached when 50% of the population was at the same phenological stage. Growing degree days (GDD) were calculated with 10 °C as the baseline temperature [12].

2.3. Experiment 1: Irrigation Management and Vine Water Status

In the year 2017, all treatments were irrigated according to the owners’ criteria and no irrigation data were taken. From 2018 to 2020, all the treatments were irrigated following a regulated deficit irrigation (RDI) strategy consisting of providing 100% of the estimated plant water requirements until veraison, when irrigation was suppressed up to harvest. This irrigation strategy is the most common irrigation management in the region. The daily irrigation amount (mm/day) was calculated through Equation (1):
I r r i g a t i o n   A m o u n t = ( E T c P e f f 0.9 ) / 7
where ETc is the weekly crop evapotranspiration (mm/week) for non-stressed vines calculated from the ETo Penman–Monteith formula of ETc = ETo Kc [15] with crop coefficients Kc1 = 0.2 (from budburst), Kc2 = 0.7 (mid-season, from veraison until harvest) and Kc3 = 0.3 (at leaf senescence) based on a maximum Kc of 0.7 for vines with a midday percent shaded area of 40% [16]. Peff is the effective rainfall in mm/week, estimated as 60% of the rainfall for a week with more than 10 mm of precipitation and otherwise considered to be zero. The factor 0.9 is the efficiency of the irrigation system. Unfortunately, irrigation applied was not measured in the year 2017 due to technical issues.
The stem water potential (Ψs) was measured every 15 days from May to October following a method described in [17]. On two vines per replicate, a shaded leaf located near the trunk was placed in an aluminum bag 30 min before the measurement. Measurements were carried out between 11:30 and 12:30 (GMT) using a pressure chamber (Model 3005, Soil Moisture Equipment Co., Ltd. Sta. Barbara, CA, USA). The Ψs thresholds for well-hydrated vines were −0.6 MPa from budburst to fruit set and −0.75 MPa from fruit set to veraison [7].
The irrigation water use efficiency (IWUE) (kg/(mm ha)) was calculated as the ratio between the yield in kg/ha and the water provided by irrigation in mm during the growing season (from non-forced budburst to leaf fall).

2.4. Experiment 1: Fraction of Intercepted Radiation

In 2017, the fraction of photosynthetically active radiation intercepted by the vines (FIPAR) was not measured due to technical problems with the equipment. From 2018 to 2020, FIPAR was measured before forcing and at the end of the season (considered maximum FIPAR). All measurements were carried out between 11:00 and 12:00 (GMT) using a Li-191R line quantum sensor (Li-191R, Li-Cor, Inc., Lincoln, NE, USA). For each plot, one measurement was taken above the canopy (Iabove) and two rows of 50 measurements were taken below the canopy of 10 vines per plot (Ibelow). Measurements below the canopy were taken perpendicular to the row and 0.5 m apart to cover the entire ground allocated per vine. The FIPAR was calculated through Equation (2):
F I P A R = 1 I b e l o w / 100 I a b o v e

2.5. Experiment 1: Yield, Yield Components and Must Quality

The optimal harvest date was set when the grape total soluble solids (TSS) content was between 23.5 and 24.5° Brix for all treatments. Thus, to ensure the optimal harvest date, from one month after veraison until harvest a sample of berries was collected approximately every three days to extract the juice and measure the TSS with a refractometer (Pallette, PR-32α, ATAGO Co., LTD., Tokyo, Japan). At harvest, the yield, number of bunches per vine and bunch weight were determined. A sub-sample of 50 berries per replicate was also weighed (berry weight). The number of berries per bunch and per vine was then estimated as the ratio between bunch weight and yield by berry fresh weight. All samples were weighed shortly after collection and dried at 65 °C to a constant weight to determine the dry weight. Berry juice was extracted from one sample of each replicate and the TSS content was determined. The same juice was used to measure the pH using a pHmeter (Crison PLG-22, HACH LANGE, SLU, Barcelona, Spain) and titratable acidity (TA). To measure the must TA (g/L tartaric acid), 10 mL of filtered juice was diluted with 10 mL of distilled water and titrated with a 0.1 N NaOH solution to a final pH of 8.2.

2.6. Experiment 2: Improving Irrigation Water Use Efficiency in Forced Vines Experimental Design

Experiment 2 was performed to improve the IWUE in forced-treatment vines by suppressing irrigation before forcing. Experiment 2 was carried out in 2019 and 2020. A new treatment was added to the F1 and F2 plots in which irrigation was suppressed before the forcing pruning and from veraison to harvest (F1-Pre and F2-Pre). Each replicate of F1-Pre and F2-Pre was exactly equal to their analogous RDI plots and was randomly located adjacent to each RDI replicate. Therefore, the experimental design was split-plot with four replicates per treatment and the forcing treatment as the A factor and irrigation as the B factor.
The irrigation dose was estimated as described for Experiment 1. Also, FIPAR measurements were performed as described for Experiment 1 and were taken before and after forcing pruning. Vine water status was measured as described for Experiment 1. The relative Ψs was calculated as the ratio between the Ψs of the Pre and RDI treatments for each forcing pruning date.
The yield, yield components and must quality were measured as described for Experiment 1.

2.7. Statistical Analysis

A univariate analysis of variance (ANOVA) was performed to reveal differences between treatments (p < 0.05) for Experiment 1. In Experiment 2, a multivariant analysis of variance (MANOVA) was performed to reveal differences between treatments (p < 0.05). The normal distribution of experimental errors was assessed with the Shapiro–Wilk test. Homogeneity of error variances was assessed with Levene’s test (p < 0.05). Differences between means were determined using the Tukey test (p < 0.05). All statistical analyses were performed with JMP14.3 software (SAS Institute Inc., Cary, NC, USA, 1989–2021).

3. Results

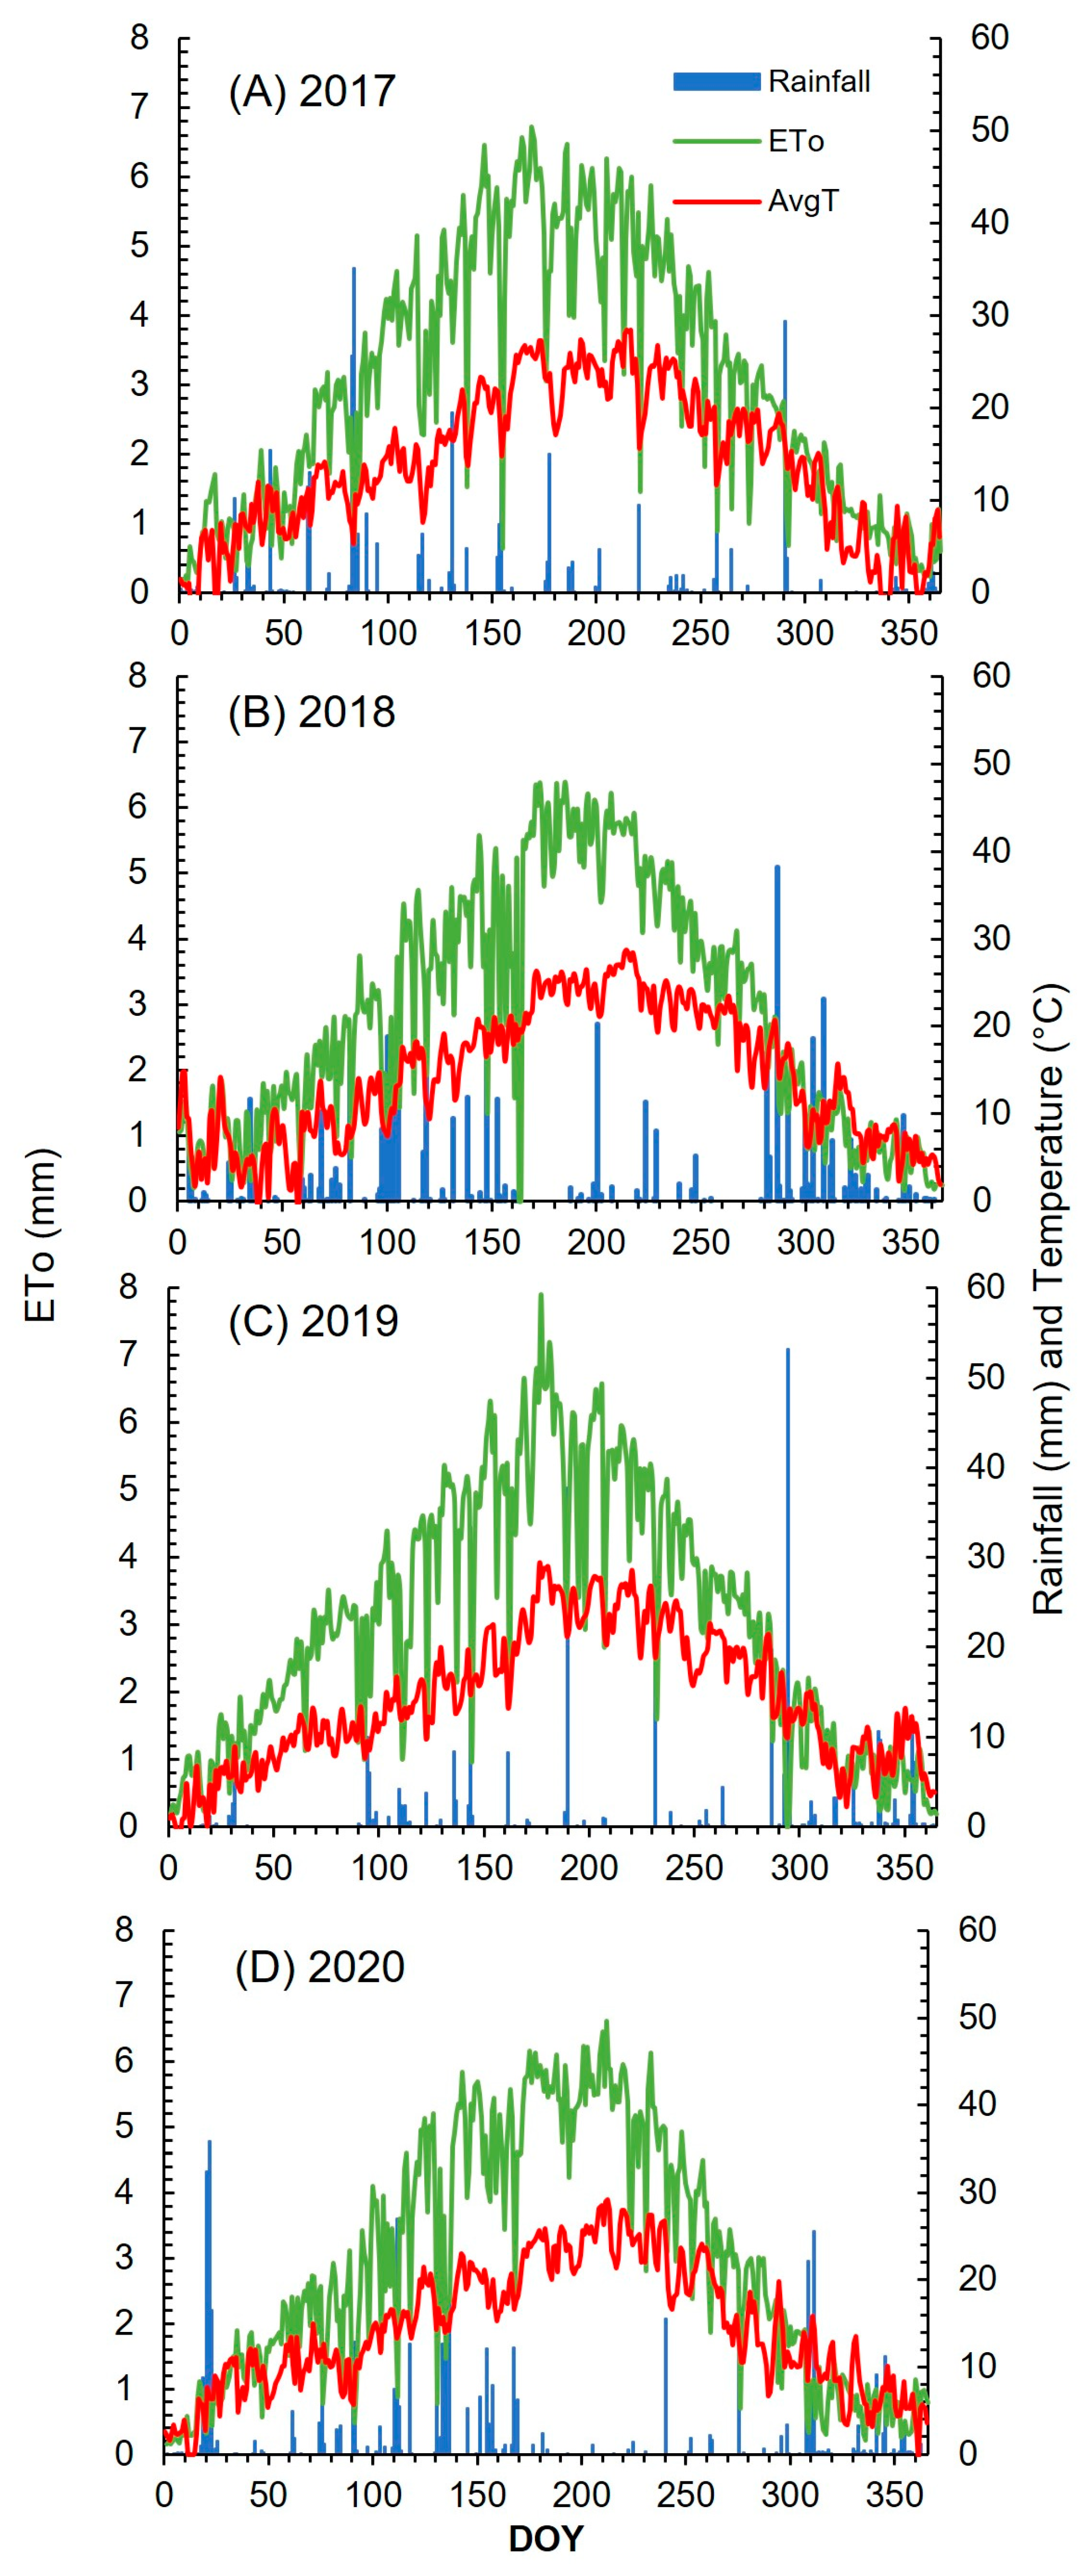
3.1. Experiment 1: Phenology and Weather Data

On average, F1 delayed veraison (E-L 35) and, therefore, the onset of the berry ripening phase, by 41 days and F2 by 70 days when compared to UF, while the harvest date was delayed by 34 days (F1) and by 66 days (F2) (Table 1). However, it should be noted that the harvest date was a technical decision based on berry total soluble solids evolution. On average, F treatments required 11 days after forcing to unlock the forced buds, although this period varied by 23% (F1) and 16% (F2) between years, values which increased when GDD were considered instead of Julian days (Table 2). Forced treatments required fewer days (30 days F1 and 29 days F2) but more GDD (444 GDD F1 and 438 GDD F2) to reach the fruit-set stage (E-L 27) than UF treatments (63 days and 381 GDD). However, differences in the length of the period from fruit set to veraison were reduced between the UF (56 days) and F treatments (51 days F1 and 52 days F2), and the UF treatment required more GDD (741) from fruit set to reach veraison than F1 (696) and F2 (567). Notably, the maximum coefficient of variation observed in days was 11% (BB-FS in UF treatment) and in GDD 12.2% (FS-V in F2 treatment) (Table 2).
Climate data represented typical years of the area with hot summers (daily average temperature close to 28 °C) and cold winters and most of the rainfall events during spring and winter (mainly outside of the growing season) with isolated rainfall events in winter and summer (Figure 1). However, rainfall events were especially scarce during the last 50 days of 2017 (Figure 1A) and during the first 140 days of 2019 (Figure 1C). In contrast, the first 160 days of 2020 were considered wetter than usual in the region (Figure 1D). During summer, the daily ETo reached exceptional values above 7 mm in 2019 (Figure 1C), although it was between 5 and 6.5 mm most of the time (Figure 1A–D). F1 reduced by 5.5 °C and F2 by 10.7 °C the average temperature from veraison to harvest compared to UF (Table 3). However, from budburst to fruit set, the maximum temperature increased by 18% (F1) and 24% (F2) on average, and the average temperature by 60% (F1) and 62% (F2) when compared to UF. The coefficient of variation of Tmax and Tavg never exceeded 8% and therefore, they were quite stable parameters during these four years. Although variance in the ETo parameter was high (reaching 18.2% from veraison to harvest in F2), the cumulative ETo was reduced due to the forcing pruning for each phenological stage in F1 and F2 when compared to UF. Rainfall was an extremely erratic parameter between years, with the coefficient of variance ranging from 15.1% to 89.9%.

3.2. Experiment 1: Irrigation, Plant Water Status and Fraction of Intercepted Radiation

In 2018 and 2020, neither the F1-RDI nor the F2-RDI treatment saved water compared to UF-RDI (Figure 2). Only in the 2019 season was cumulative irrigation lower (16%) in F1-RDI compared to UF-RDI and F2-RDI.
In 2017, since irrigation was managed according to the criteria of the vineyard owners, water stress was observed for all treatments and all phenological stages (Table 4). However, Ψs was higher (less negative) in F2 than F1 and UF from fruit set to veraison and both forced treatments increased Ψs when compared to UF from veraison to harvest. In 2018, 2019 and 2020, from budburst to fruit set, Ψs was generally reduced (more negative) in F2 compared to UF and F2, except for 2018, when no differences were observed between F1 and F2. From fruit set to veraison, both forced treatments tended to show a more negative Ψs except, for 2018, when no differences were observed. Although no differences were observed in average Ψs from veraison to harvest in 2019, the UF treatment tended to be more stressed than the forced treatments.
When FIPAR was measured before forcing pruning for F1 (DOY 144, 141 and 149 for 2018, 2019 and 2020, respectively), only in 2018 was the FIPAR of F1 reduced when compared to UF (Figure 3A–C). Although on DOY 141 for 2019 and DOY 149 for 2020 F2 FIPAR was reduced (Figure 3B,C), this reduction was not observed in measurements taken 40 days (DOY 141 in 2019) and 39 days (DOY 188 in 2020) after. At the last measurement of each year, F2 did not reach FIPAR values comparable to F1 or UF. However, it should be noted that the last measurement in 2018 was performed on DOY 242, when vines might still have been growing.

3.3. Experiment 1: Yield, Yield Components, Irrigation Use Efficiency and Must Quality

After the 4 years of Experiment 1, the yield was reduced in F1-RDI (26%) and F2-RDI (59%) when compared to UF-RDI (Table 5). Interestingly, except for 2018, the yield in F2-RDI was quite stable at about 7 Mg/ha. It should also be noted that in 2018 and 2020 the UF-RDI treatment was affected by downy mildew, which severely impaired the yield and especially the bunch weight due to a reduced number of berries per bunch. Nonetheless, forcing pruning reduced the bunch weight, berry fresh and dry weight and the number of berries per bunch, and the later the forcing pruning date the higher the reduction, meaning that F2-RDI had the greatest reduction in the previously mentioned yield components when compared to F1-RDI. However, the number of bunches per vine was not reduced in forced treatments and in some years even increased when compared to UF-RDI (2018 and 2020 for F1-RDI and 2019 for F2-RDI). The number of berries per vine was reduced in F2 when compared with F1, although this result was not consistent each year. On average, IWUE was only reduced in F2-RDI when compared to UF-RDI. However, the results are difficult to interpret because of the lack of irrigation data in 2017 and the mildew effect in 2018 and 2020. In 2019, IWUE was reduced in the F1-RDI treatment (40%).
When compared to UF, the F1-RDI treatment had a reduced TSS, although it was in the range accepted for well-ripened grapes (Table 6). In contrast, F2-RDI had difficulties reaching the optimum TSS value and was harvested due to adverse climatic conditions favorable for grape diseases. Both forced treatments, when compared to UF-RDI, increased TA, reduced pH and increased malic acid concentration and, because of the reduced TSS and high TA, the TSS:TA ratio was reduced in the forced treatments. These effects were markedly more pronounced in F2-RDI than in F1-RDI.

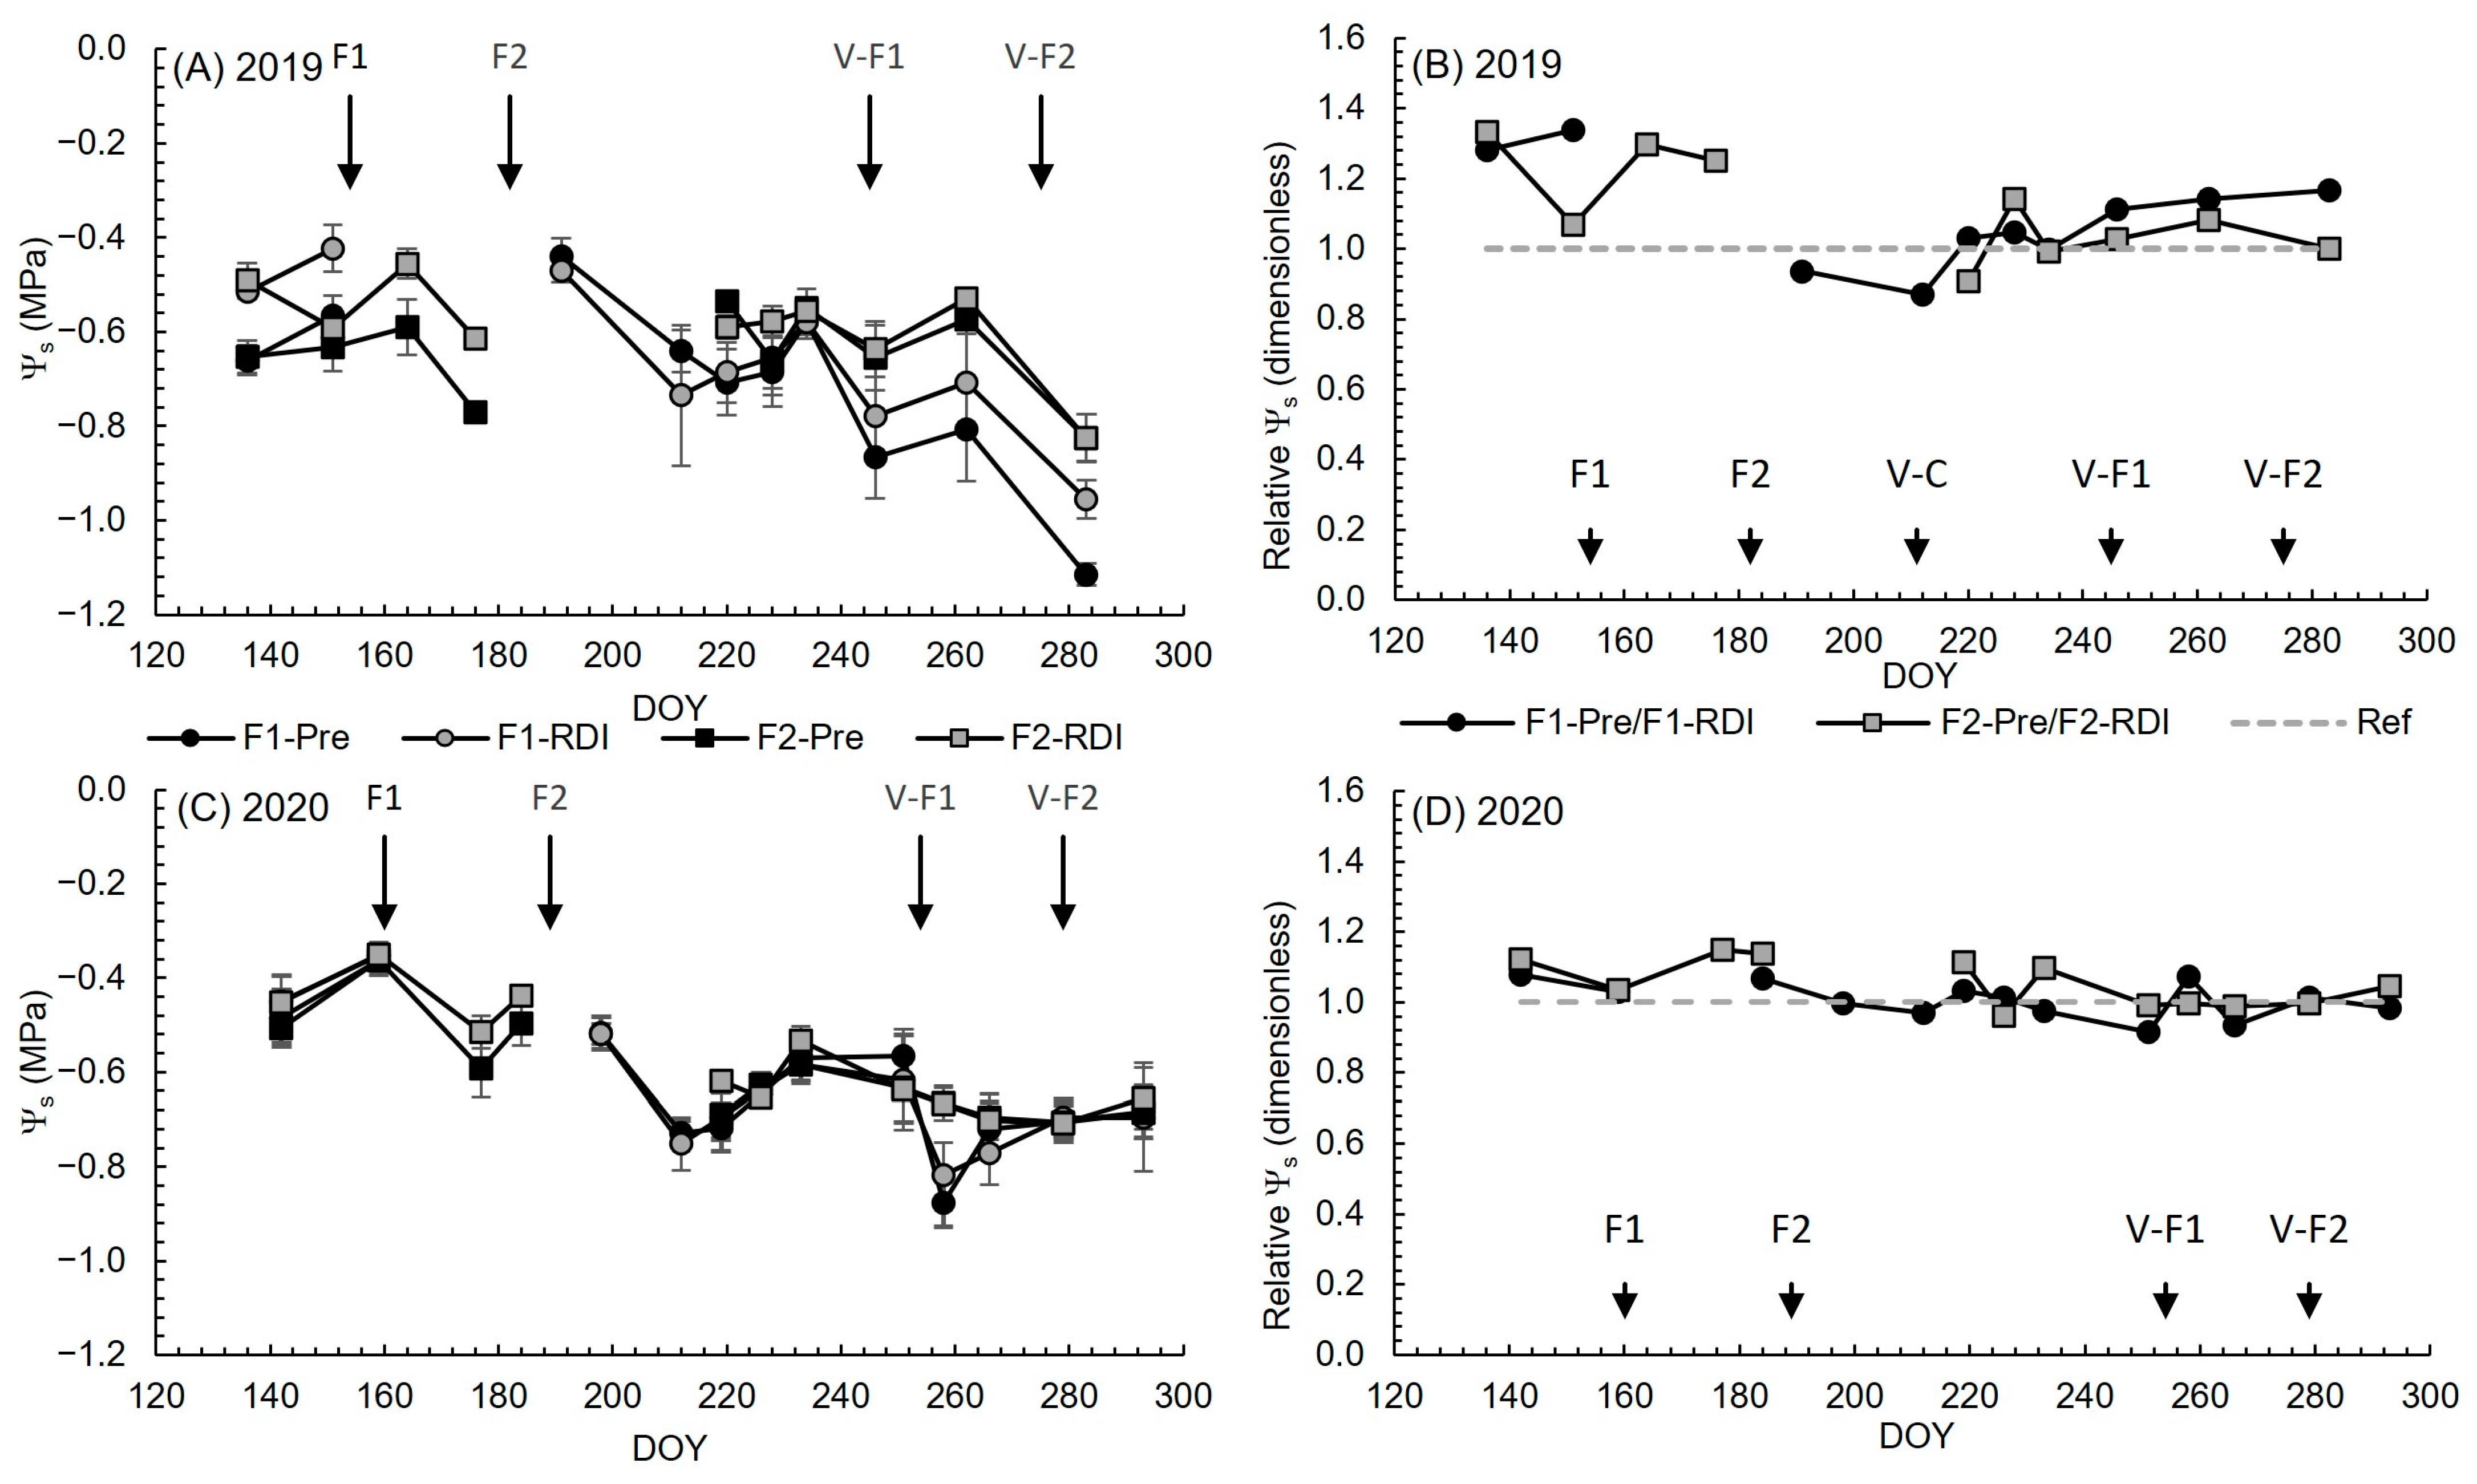
3.4. Experiment 2: Irrigation and Vine Water Status

In 2019, F1-Pre had a reduced irrigation by 18.5% when compared to F1-RDI, and F2-Pre had a reduced irrigation by 34% when compared to F2-RDI (Figure 2B). Notably, F2-Pre was the treatment in which the least cumulative irrigation was applied (147 mm), while F2-RDI was the treatment with the most applied irrigation (230 mm) of the four treatments studied in Experiment 2. On the other hand, in 2020, no reduction in cumulative irrigation was observed in F1-Pre when compared to F1-RDI, whereas F2-Pre had a reduced cumulative irrigation by 24% when compared to the F2-RDI treatment (Figure 2C). When comparing all the treatments involved in Experiment 2, F1-RDI, F1-Pre and F2-Pre used around 216 mm, whereas F2-RDI used 291 mm.
In 2019 during the pre-forcing period, non-irrigated treatments decreased Ψs to values of −0.6 MPa (F1-Pre) and −0.78 MPa (F2-Pre), while irrigated treatments were above −0.5 MPa (F1-RDI) and −0.61 MPa (F2-RDI) (Figure 4A). In fact, during the pre-forcing period, the relative Ψs (the ratio between Pre and RDI treatments) was in the range of 1.25 and 1.35, except for DOY 151 for F2 treatments (Figure 4B). After forcing pruning, Ψs tended to be higher (less negative) in Pre treatments (F1-Pre and F2-Pre) than in RDI treatments (F1-RDI and F2-RDI) (Figure 4A) until they stabilized (Figure 4B). After veraison, F1 treatments saw a fall in Ψs to −0.96 MPa (F1-RDI) and −1.15 MPa (F1-Pre) on DOY 183 and F2 treatments to −0.85 MPa (Figure 4A). After veraison, the F1 relative Ψs increased, which means that F1-Pre tended to be more stressed than F-RDI (Figure 4B). The latter observation was not observed in F2 treatments.
In 2020, during the pre-veraison period, only F2-Pre reached Ψs values of −0.6 MPa on DOY 177, whereas the other treatments were always above this value (Figure 4C). Only F2-Pre Ψs tended to be lower than F2-RDI (ratio F2-Pre/F2 RDI of 1.15 on DOY 177 and 184) (Figure 4D). After forcing pruning, the relative Ψs tended to be quite constant for all treatments until the last measurement (Figure 4D), and after veraison, only the F1 treatments saw a fall in Ψs below −0.8 MPa and only on DOY 258 (Figure 4C), after which Ψs was close to −0.7 MPa for all treatments.

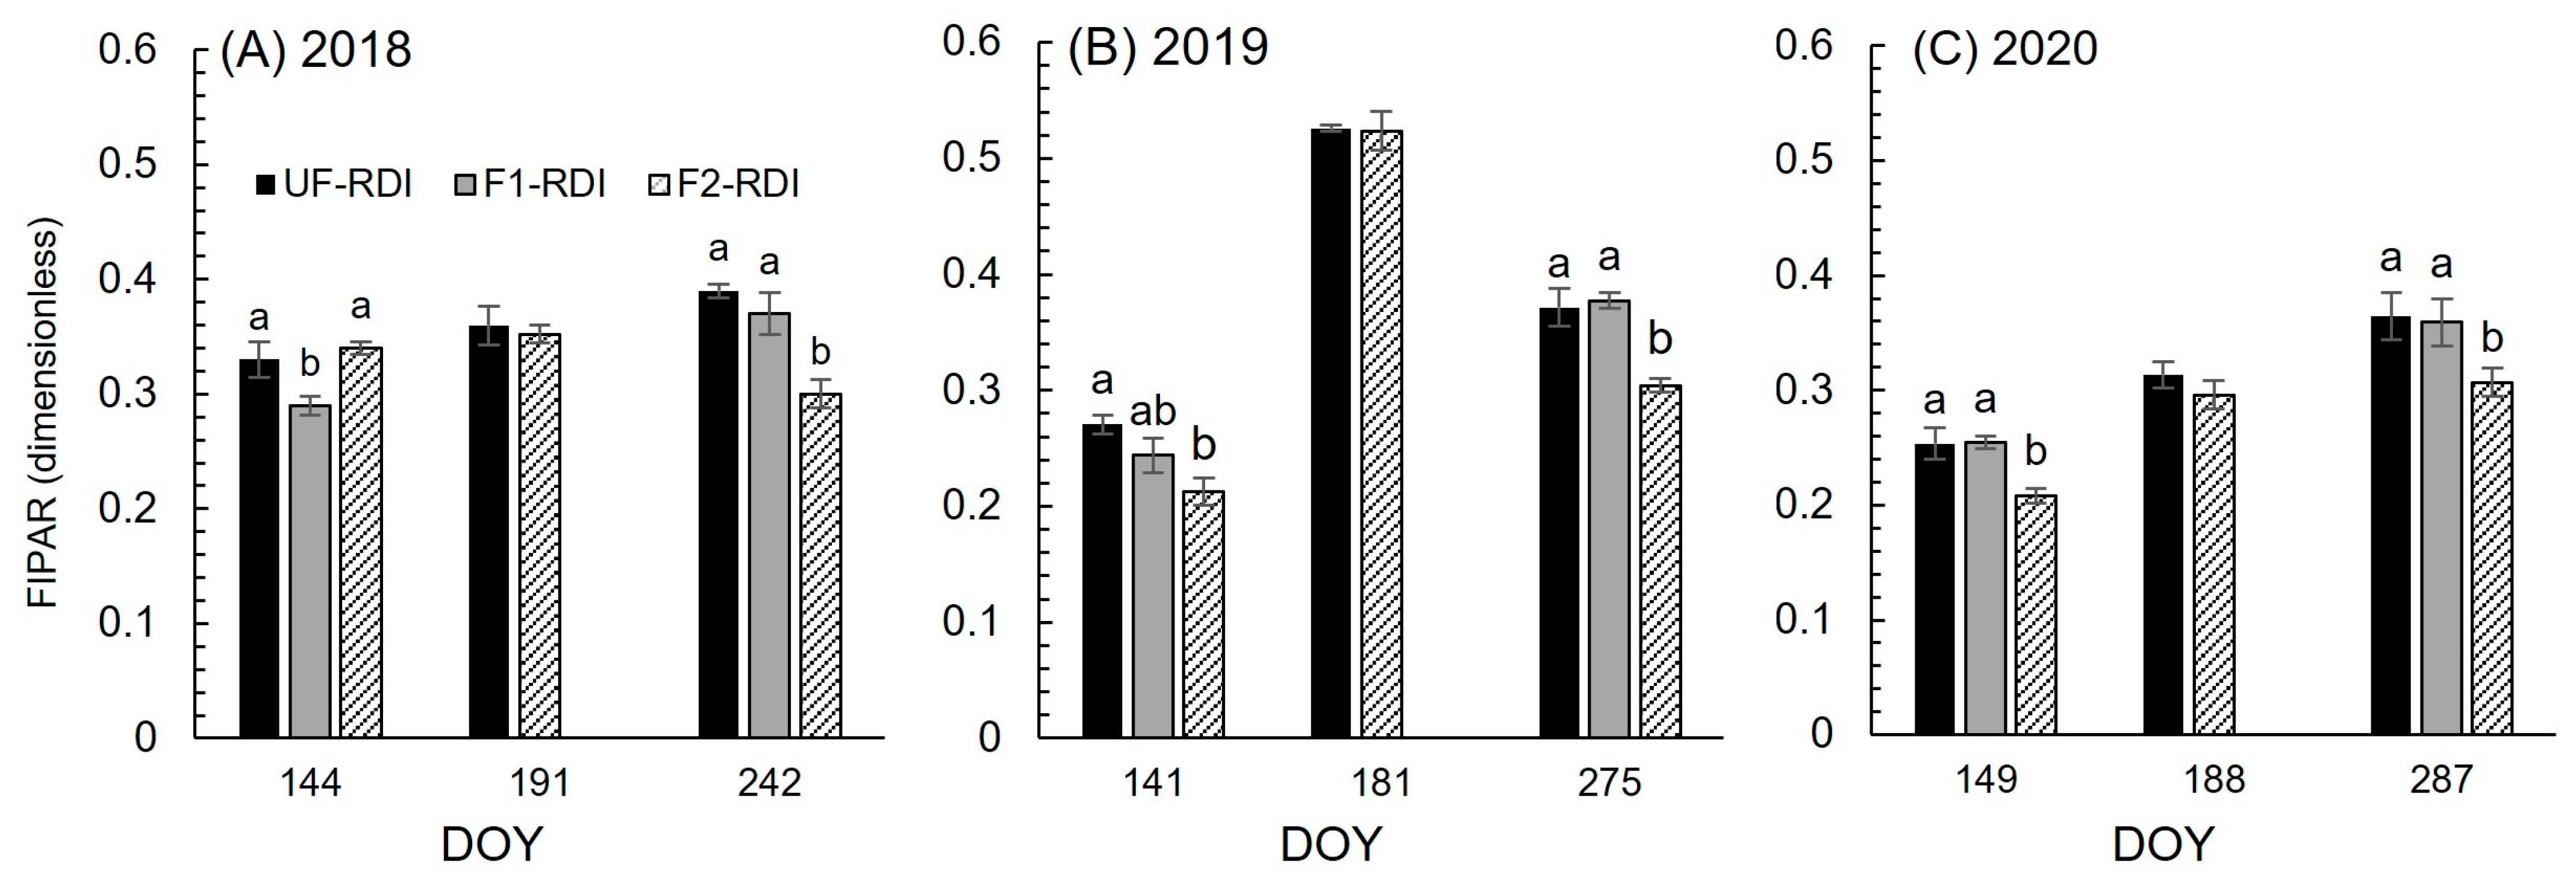
3.5. Experiment 2: FIPAR, Yield, Yield Components, Irrigation Use Efficiency and Must Quality

Neither FIPAR nor any yield or yield component was affected by the irrigation factor (Table 7). Except for the yield in 2019 (when no differences were observed due to forcing) and the number of berries per vine (which was higher in F2 than F1 in 2019 but lower in F2 than F1 in 2020), F2 treatments had a reduced yield and other yield parameters when compared to F1. IWUE was clearly enhanced in Pre compared to RDI treatments in 2019 but not in 2020, when only F2-Pre had an improved IWUE compared to F2-RDI but no improvement was observed in F1 treatments.
A tendency of increasing TA and malic acid concentration was observed in the Pre treatments (Table 8). All other must quality parameters were not affected by the irrigation strategy. However, as expected, the forcing pruning date affected the must quality parameters in the same way as Experiment 1.

4. Discussion

4.1. Weather Conditions and Phenology

After the 4-year trial, Experiment 1 confirmed the crop forcing technique as a successful technique to delay the berry ripening period to a cooler and less evaporative environment, improving the must acidity and malic acid concentration, as reported in previous studies [3,4,5,6]. The number of days required from forcing pruning to the time when forced buds unlock (forced budburst) ranged from 8 to 14 independently of the forcing date, which is slightly higher than the time required of 7–9 days reported in another study in the south of Spain [6] but close to the 7–12 days reported in a more recent study located near the experiment presented in this paper [7]. However, soon after forcing, the daily temperature is extremely high, which reduces the number of days required to reach fruit set by half when compared to a non-forced cycle, since plant development is dependent on temperature [18]. In addition, forced treatments required more GDD to reach fruit set than unforced treatments, which may be related to the competition of plant development with fast-growing organs for a reduced carbohydrate reserve availability [6]. The previously cited observation is consistent with the minimum of carbohydrate reserve availability observed at the forcing pruning date [13,19]. However, GDD from fruit set to veraison was reduced in forced treatments, which equalized for F1 or even reduced for F2 the total (from budburst) GDD required to reach veraison when compared to unforced vines. This last observation is rather controversial. Contrary to our observations, some studies have reported that forced vines require more GDD to reach veraison than unforced vines [6,10], whereas studies realized in the same region as the present studies are in accordance with our results [7,13]. These contradictory results suggest that GDD should be taken with caution when comparing data from different climatic regions and with different irrigation strategies and when comparing unforced with forced vines, since other parameters besides temperature (including photoperiod, carbohydrate availability and periods of extreme high temperatures) may alter phenology [20]. Therefore, because even mild water stress limits photosynthesis and hence, plant carbon availability [8], pre-veraison water stress may reduce carbon availability for vine developmental processes and vine growth, increasing the thermal time required to reach veraison.
On the other hand, although the temperature was reduced during the berry ripening phase (veraison to harvest), the time required from veraison to harvest was generally slightly reduced in both forced treatments when compared to the unforced treatment, which is consistent with other studies [7,10]. However, in other studies with cv. Cabernet Sauvignon, longer berry ripening periods were observed [3]. In addition, we observed that the berry ripening phase required lower GDD in forced than in non-forced vines, which agrees with observations previously reported [7,10]. However, it should be considered that the harvest date is a technical decision (note that F2 had not always completed the ripening phase, reaching the desired 23.5 °Brix) and other factors such as the source:sink ratio play a major role in sugar accumulation [21]. In addition, it has been suggested that 10 °C as a baseline to compute GDD loses reliability from veraison to harvest, since some physiological processes involved in berry ripening may still work at a lower temperature [20].

4.2. Water Consumption and Plant Water Status

The crop coefficients (Kc) used in this study, and therefore the estimated potential ETc, matched perfectly those reported using weighing lysimeters with cv. Tempranillo for a FIPAR of 30–40% [22]. In Experiment 1, it was evident that the crop forcing technique with a local commonly used post-veraison RDI strategy (no irrigation from veraison to harvest) was not effective in terms of saving water. Only the F1 treatment saved irrigation water in 2019 when compared to UF. The difficulty of forced vines to save water when compared to unforced vines using post-veraison RDI has been reported previously [7] and even when a strategy of pre-veraison RDI is used [10,23]. It has been suggested that the main reasons why it is difficult to save irrigation water in forced treatments with a post-veraison RDI strategy are: (i) the berry ripening period in which irrigation is suppressed is shortened; (ii) the environmental evaporative demand is high when the vines are growing and low after veraison when the vines are at their maximum size; and (iii) generally, differently to non-forced vines, the forced cycle starts with a drier soil and low rainfall events when vines are growing [7], which is completely in accordance with our observations. However, our results confirm that the crop forcing technique is a good tool to maintain a better vine status during the berry ripening period due to a less evaporatively demanding environment [6,7]. Although all treatments were fully irrigated, Ψs was more negative in F2 than the other treatments from budburst to fruit set and in both F treatments from fruit set to veraison than in UF. The reason may be related to the sensitivity of Ψs to the vapor-pressure deficit [24], which is higher during the first phenological stages after forcing of F treatments than in conventional UF vines.
In Experiment 2, in 2019, pre-forcing irrigation suppression treatments (Pre treatments) succeeded in saving irrigation water, reducing Ψs by as much as 30% (although never lower than −0.8 MPa) in both F1-Pre and F2-Pre when compared to their respective RDI treatments. However, in 2020, only F2-Pre had reduced water irrigation, with a small effect of 15% in Ψs (never below −0.6 MPa). In 2019, the winter–spring period was dry (only 98 mm from 1 January until F1 and 108 mm until F2 forcing pruning), whereas the winter–spring period in 2020 was unusually rainy for the region (324 mm until F1 and 350 mm until F2 forcing pruning), and therefore, almost no irrigation was required in F1-RDI before the forcing pruning and the F2-RDI treatment required irrigation only from the period between the F1 and F2 forcing dates. Therefore, the water-saving capacity before the forcing pruning is logically dependent on the soil water availability provided by rainfall before the forcing pruning [7] and the date of forcing pruning.

4.3. Vine Performance and Grape Quality Responses to Forcing Date and Irrigation Strategy

The results of Experiment 1 confirmed that the crop forcing technique increases the must acidity and malic acid concentration but reduces the bunch and berry weight, which generally results in a reduction in yield [5,6,7,23], although when using Cabernet Sauvignon, a reduction in yield was not always observed [3]. In our experimental conditions, the F2 treatments had a reduced bunch and berry weight and, therefore, yield when compared to F1, which may be caused by a slowdown of berry growth after veraison due to low temperatures [5]. This is consistent with the difficulty observed in F2 to accumulate sugars, which is also dependent on temperature [25]. We did not observe a reduction in the number of bunches per vine in F1 when compared to F2. This observation is contrary to other short-term (maximum 2-year trial) studies using similar forcing pruning dates, in which it was observed that the number of bunches per vine increased when forcing was carried out later [5,6,13]. No clear effects of the forcing date on the number of bunches per vine was observed in long-term studies [10]. In non-forced vines, the number of bunches per vine is dependent on the carbohydrate reserves at budburst [26]. Therefore, our hypothesis is that the number of forced bunches per vine may be linked to the state of the carbon reserves at non-forced budburst and therefore, to the carbon balance and competence for carbon between the refilling of the carbohydrate reserve and other sink organs of the previous year, as well as the carbon balance and sink activity during the pre-forcing period of the same year [13].
Apparently, F2 vines had difficulties reaching FIPAR values comparable to UF and F1 vines at the F1 forcing date. However, on F2 forcing pruning dates, F2 vines reached UF FIPAR values. This observation suggests some slight carry-over effects for the late forcing treatment at the beginning of vegetative growth. After budburst, vegetative growth is exclusively dependent on carbohydrate reserves from permanent structures [27]. Therefore, the slower growth of F2 may be related to the lower availability of carbohydrate reserves after winter dormancy. However, this slower growth was also observed in 2019 after an extremely low yield in 2018, which may have resulted in a better carbohydrate reserve status due to reduced competition between carbohydrate reserve accumulation and fruit production [13]. Therefore, based on our data and the fact that budburst uniformity depends on the duration of the chilling period [28], we cannot rule out that the slower initial vegetative growth in F2 may be related to a less-uniform budburst caused by the phenological shift in F2 the previous year. Further research is necessary to better determine what causes slower vegetative growth in late forcing treatments. After forcing pruning, F2 was unable to reach FIPAR values comparable to F1 and UF, therefore reducing the whole-canopy photosynthetic capacity [13]. The latter observation is consistent with other studies [10,13] and may be related to the high temperatures soon after forced budburst, which encourage organs to develop fast and, therefore, increase the competition between organs for carbohydrate reserves, which are minimum when forced buds unlock [13]. The latter argument would also explain the slight reduction in F2 in the number of berries per bunch when compared to F1, since the number of berries per bunch is negatively correlated with extreme temperatures during flowering [29].
When compared to UF-RDI and except when UF was affected by mildew (2020), F1-RDI and F2-RDI were not useful methods to increase IWUE, since the yield was reduced and water use was increased in both F treatments. This IWUE reduction was markedly more evident in the F2-RDI treatment. However, in Experiment 2, the suppression of irrigation prior to forcing pruning succeeded in increasing IWUE, especially in F2-Pre in 2019 when the spring was dry, with no negative effects on must quality and no reduction in yield or any yield component. These results do not concur with those observed in a 3-year study with a forcing pruning date 85 days after budburst (exactly between F1 and F2) [7], in which not only did IWUE not increase but the number of bunches per vine was reduced in those treatments with irrigation suppression before the forcing pruning. This discrepancy suggests that the date of forcing pruning may play a significant role in the sensitivity of forced vines to pre-forcing water deficit. Based on our results, since veraison seems to be quite predictable based on GDD with 10 °C as a baseline, we suggest suppressing irrigation at about 100 GDD prior to veraison (approximately 7 days for F1 and 10 days for F2), always avoiding exceeding the threshold of Ψs of −1.2 MPa, which we consider appropriate for post-veraison water stress to improve IWUE in forced vines.
Although the crop forcing technique is one of the most effective techniques in delaying the harvest date, resulting in modified berry properties, promising results were obtained with other techniques [2]. For example, using cv. Tempranillo in the north of Spain, severe shoot trimming soon after fruit set delayed the date of veraison by about 20 days, with a reduction in berry TSS (10–15%) and pH (0.1–0.3) and increase in acidity, but with a yield reduction of about 10% [30]. The late-winter pruning technique (vines pruned in spring) using cv. Sangiovese in Central Italy successfully slowed down TSS accumulation and increased acidity (28%) at harvest but decreased the yield (35%) compared to vines conventionality pruned and the results were obtained only after a three-year trial [31]. Promising results were obtained when Tempranillo vines were minimally pruned, resulting in a 17-day delay of the harvest date, increasing the yield (53%), although berries from minimally pruned vines did not always have increased acidity [32]. However, most of the techniques mentioned above do not have the capacity to delay the berry ripening phase as much as the crop forcing technique does. Recently, a variation of the crop forcing technique called double cropping, in which the primary crop and basal leaves are not removed at the crop forcing pruning date, showed similar results to the crop forcing technique using cv. Pinot Noir for sparkling wine in terms of berry quality but with no negative impact on the yield [33]. However, to our knowledge, no references are available when combining irrigation strategies and the double crop forcing technique. Therefore, the present paper may provide valuable information on managing irrigation not only when using the crop forcing technique but also when using other techniques in which the berry ripening phase is significantly delayed to a cool environment, such as in the case of the double cropping technique.

5. Conclusions

Controversies about the thermal time requirements and the duration of each phenological stage were found between this study and others using the crop forcing technique, suggesting the need to focus research on phenological models adapted to the crop forcing technique. Nevertheless, after a four-year trial, this study confirmed that the crop forcing technique is a useful tool to delay berry ripening to a cooler environment, enhancing the must acidity and reducing malic acid degradation. This effect is more noticeable the later the forcing pruning is carried out. However, the crop forcing technique reduces the yield, especially in terms of reduced bunch weight, and the later the forcing pruning date the higher the reduction in yield. With a post-veraison RDI strategy that is commonly used in the region of this study, the crop forcing technique was not useful in saving irrigation water or increasing IWUE. However, promising results were found when the pre-forcing pruning irrigation was suppressed, with no negative effects observed in either the yield or the must quality and an increased IWUE in dry spring years, which in a climate change scenario could become more frequent. However, discrepancies with other experiments suggest that caution should be applied with pre-forcing water deficit and that further research is required to increase IWUE in forced vines.

Supplementary Materials

The following supporting information can be downloaded at: https://www.mdpi.com/article/10.3390/agronomy14010130/s1, Figure S1: Map of the Experiment 1 (which included UF, F1-RDI and F2-RDI treatments) and the Experiment 2 (which included F1-RDI, F2-RDI, F1-Pre and F2-Pre treatments) with an Normalized Difference Vegetation Index (NDVI) map in the background performed in 2016 (one year before Experiment 1 started (2017)). Control vine corresponds to one vine in which measurements were taken. Other vines were used as borders between treatments. Rep means replicate.

Author Contributions

J.G. and O.G.-T. conceived, planned and supervised this study. J.O.-M. contributed to the planning of the experiment. J.O.-M. and M.M. performed most of the field measurements and tasks. J.O.-M. performed the processing and analysis of all the data and drafted and finalized the manuscript. J.G. and O.G.-T. reviewed the manuscript. All authors have read and agreed to the published version of the manuscript.

Funding

This study was supported by funds from the Instituto Nacional de Investigación y Tecnología Agraria y Alimentaria (INIA) research project RTA2015-00089-C02-02. The participation of Jordi Oliver-Manera was funded by the Ministerio de Ciencia e Innovación in an Instituto Nacional de Investigación fellowship BES-2017–0820.

Data Availability Statement

The data presented in this study are available on request from the corresponding author.

Acknowledgments

The authors would like to thank Jesús del Campo, Carles Paris and Aurica Biru for their hard work in the field. Special thanks to Raïmat Wineries for their support throughout the experiment.

Conflicts of Interest

The authors declare no conflicts of interest.

References

  1. Palliotti, A.; Tombesi, S.; Silvestroni, O.; Lanari, V.; Gatti, M.; Poni, S. Changes in Vineyard Establishment and Canopy Management Urged by Earlier Climate-Related Grape Ripening: A Review. Sci. Hortic. 2014, 178, 43–54. [Google Scholar] [CrossRef]
  2. Gutiérrez-Gamboa, G.; Zheng, W.; Martínez De Toda, F. Current Viticultural Techniques to Mitigate the Effects of Global Warming on Grape and Wine Quality: A Comprehensive Review. Food Res. Int. 2021, 139, 109946. [Google Scholar] [CrossRef] [PubMed]
  3. Gu, S.; Jacobs, S.D.; Mccarthy, B.S.; Gohil, H.L. Forcing Vine Regrowth and Shifting Fruit Ripening in a Warm Region to Enhance Fruit Quality in ‘Cabernet Sauvignon’ Grapevine (Vitis vinifera L.). J. Hortic. Sci. Biotechnol. 2012, 87, 287–292. [Google Scholar] [CrossRef]
  4. Lavado, N.; Uriarte, D.; Mancha, L.A.; Moreno, D.; Valdés, E.; Prieto, M.H. Effect of Forcing Vine Regrowth on “Tempranillo” (Vitis vinifera L.) Berry Development and Quality in Extremadura. VITIS—J. Grapevine Res. 2019, 58, 135–142. [Google Scholar] [CrossRef]
  5. Martinez De Toda, F.; García, J.; Balda, P. Preliminary Results on Forcing Vine Regrowth to Delay Ripening to a Cooler Period. VITIS—J. Grapevine Res. 2019, 58, 17–22. [Google Scholar] [CrossRef]
  6. Martínez-Moreno, A.; Sanz, F.; Yeves, A.; Gil-Muñoz, R.; Martínez, V.; Intrigliolo, D.S.; Buesa, I. Forcing Bud Growth by Double-Pruning as a Technique to Improve Grape Composition of Vitis vinifera L. Cv. Tempranillo in a Semi-Arid Mediterranean Climate. Sci. Hortic. 2019, 256, 108614. [Google Scholar] [CrossRef]
  7. Oliver-Manera, J.; García-Tejera, O.; Mata, M.; Girona, J. Cumulative Response of Tempranillo Vines to the Crop Forcing Technique and Pre-Forcing and Post-Veraison Water Stress in Terms of Yield and Grape and Wine Quality. Irrig. Sci. 2023, 41, 571–587. [Google Scholar] [CrossRef]
  8. Chaves, M.M.; Zarrouk, O.; Francisco, R.; Costa, J.M.; Santos, T.; Regalado, A.P.; Rodrigues, M.L.; Lopes, C.M. Grapevine under Deficit Irrigation: Hints from Physiological and Molecular Data. Ann. Bot. 2010, 105, 661–676. [Google Scholar] [CrossRef]
  9. Santesteban, L.G.; Miranda, C.; Royo, J.B. Regulated Deficit Irrigation Effects on Growth, Yield, Grape Quality and Individual Anthocyanin Composition in Vitis vinifera L. Cv. ‘Tempranillo’. Agric. Water Manag. 2011, 98, 1171–1179. [Google Scholar] [CrossRef]
  10. Lavado, N.; Prieto, M.H.; Mancha, L.A.; Moreno, D.; Valdés, M.E.; Uriarte, D. Combined Effect of Crop Forcing and Reduced Irrigation as Techniques to Delay the Ripening and Improve the Quality of Cv. Tempranillo (Vitis vinifera L.) Berries in Semi-Arid Climate Conditions. Agric. Water Manag. 2023, 288, 108469. [Google Scholar] [CrossRef]
  11. Flexas, J.; GalméS, J.; Gallé, A.; Gulías, J.; Pou, A.; Ribas-Carbó, M.; TomàS, M.; Medrano, H. Improving Water Use Efficiency in Grapevines: Potential Physiological Targets for Biotechnological Improvement. Aust. J. Grape Wine Res. 2010, 16, 106–121. [Google Scholar] [CrossRef]
  12. Winkler, A.J.; Cook, J.A.; Kliewer, W.M. General Viticulture, 2nd ed.; University of California: Berkeley, CA, USA, 1974; Volume 120, ISBN 978-0-520-02591-2. [Google Scholar]
  13. Oliver-Manera, J.; Anić, M.; García-Tejera, O.; Girona, J. Evaluation of Carbon Balance and Carbohydrate Reserves from Forced (Vitis vinifera L.) Cv. Tempranillo Vines. Front. Plant Sci. 2022, 13, 998910. [Google Scholar] [CrossRef]
  14. Coombe, B.G. Growth Stages of the Grapevine: Adoption of a System for Identifying Grapevine Growth Stages. Aust. J. Grape Wine Res. 1995, 1, 104–110. [Google Scholar] [CrossRef]
  15. Allen, R.G.; Pereira, L.S.; Raes, D.; Smith, M. FAO Irrigation and Drainage Paper No. 56—Crop Evapotranspiration; FAO: Rome, Italy, 1998; ISBN 978-92-5-304219-7. [Google Scholar]
  16. Williams, L.E.; Ayars, J.E. Grapevine Water Use and the Crop Coefficient Are Linear Functions of the Shaded Area Measured beneath the Canopy. Agric. For. Meteorol. 2005, 132, 201–211. [Google Scholar] [CrossRef]
  17. Shackel, K.A.; Ahmadi, H.; Biasi, W.; Buchner, R.; Goldhamer, D.; Gurusinghe, S.; Hasey, J.; Kester, D.; Krueger, B.; Lampinen, B.; et al. Plant Water Status as an Index of Irrigation Need in Deciduous Fruit Trees. HortTechnology 1997, 7, 23–29. [Google Scholar] [CrossRef]
  18. Jones, G.V.; White, M.A.; Cooper, O.R.; Storchmann, K. Climate Change and Global Wine Quality. Clim. Chang. 2005, 73, 319–343. [Google Scholar] [CrossRef]
  19. Lavado, N.; Uriarte, D.; Mancha, L.A.; Moreno, D.; Valdés, M.E.; Prieto, M.H. Evaluation of the Carry-Over Effect of the “Crop-Forcing” Technique and Water Deficit in Grapevine ‘Tempranillo’. Agronomy 2023, 13, 395. [Google Scholar] [CrossRef]
  20. Prats-Llinàs, M.T.; Nieto, H.; DeJong, T.M.; Girona, J.; Marsal, J. Using Forced Regrowth to Manipulate Chardonnay Grapevine (Vitis vinifera L.) Development to Evaluate Phenological Stage Responses to Temperature. Sci. Hortic. 2020, 262, 109065. [Google Scholar] [CrossRef]
  21. Parker, A.K.; Hofmann, R.W.; Van Leeuwen, C.; McLachlan, A.R.G.; Trought, M.C.T. Manipulating the Leaf Area to Fruit Mass Ratio Alters the Synchrony of Total Soluble Solids Accumulation and Titratable Acidity of Grape Berries: Leaf to Fruit Ratio Modifies Berry Soluble Solids. Aust. J. Grape Wine Res. 2015, 21, 266–276. [Google Scholar] [CrossRef]
  22. Picón-Toro, J.; González-Dugo, V.; Uriarte, D.; Mancha, L.A.; Testi, L. Effects of Canopy Size and Water Stress over the Crop Coefficient of a “Tempranillo” Vineyard in South-Western Spain. Irrig. Sci. 2012, 30, 419–432. [Google Scholar] [CrossRef]
  23. Lavado, N.; Uriarte, D.; Mancha, L.A.; Moreno, D.; Valdés, M.E.; Henar Prieto, M. Assessment of the Crop Forcing Technique and Irrigation Strategy on the Ripening of Tempranillo Grapes in a Semiarid Climate. Aust. J. Grape Wine Res. 2023, 2023, 6278665. [Google Scholar] [CrossRef]
  24. Williams, L.E.; Baeza, P. Relationships among Ambient Temperature and Vapor Pressure Deficit and Leaf and Stem Water Potentials of Fully Irrigated, Field-Grown Grapevines. Am. J. Enol. Vitic. 2007, 58, 173–181. [Google Scholar] [CrossRef]
  25. Sadras, V.O.; Petrie, P.R. Quantifying the Onset, Rate and Duration of Sugar Accumulation in Berries from Commercial Vineyards in Contrasting Climates of Australia: Quantifying Sugar Accumulation in Grapevine Berries. Aust. J. Grape Wine Res. 2011, 17, 190–198. [Google Scholar] [CrossRef]
  26. Bennett, J.; Jarvis, P.; Creasy, G.L.; Trought, M.C.T. Influence of Defoliation on Overwintering Carbohydrate Reserves, Return Bloom, and Yield of Mature Chardonnay Grapevines. Am. J. Enol. Vitic. 2005, 56, 386–393. [Google Scholar] [CrossRef]
  27. Holzapfel, B.P.; Smith, J.P.; Field, S.K.; Hardie, W.J. Dynamics of Carbohydrate Reserves in Cultivated Grapevines. In Horticultural Reviews; Janick, J., Ed.; Wiley: Hoboken, NJ, USA, 2010; Volume 37, pp. 143–211. ISBN 978-0-470-53716-9. [Google Scholar]
  28. Dokoozlian, N.K. Chilling Temperature and Duration Interact on the Budbreak of ‘Perlette’ Grapevine Cuttings. HortSci 1999, 34, 1–3. [Google Scholar] [CrossRef]
  29. Petrie, P.R.; Clingeleffer, P.R. Effects of Temperature and Light (before and after Budburst) on Inflorescence Morphology and Flower Number of Chardonnay Grapevines (Vitis vinifera L.). Aust. J. Grape Wine Res. 2005, 11, 59–65. [Google Scholar] [CrossRef]
  30. De Toda, F.M.; Sancha, J.C.; Balda, P. Reducing the Sugar and pH of the Grape (Vitis vinifera L. Cvs. ‘Grenache’ and ‘Tempranillo’) Through a Single Shoot Trimming. S. Afr. J. Enol. Vitic. 2016, 34, 246–251. [Google Scholar] [CrossRef]
  31. Gatti, M.; Pirez, F.J.; Frioni, T.; Squeri, C.; Poni, S. Calibrated, Delayed-Cane Winter Pruning Controls Yield and Significantly Postpones Berry Ripening Parameters in Vitis vinifera L. Cv. Pinot Noir: Late Winter Pruning in Cane Pruned Vines. Aust. J. Grape Wine Res. 2018, 24, 305–316. [Google Scholar] [CrossRef]
  32. Zheng, W.; Del Galdo, V.; García, J.; Balda, P.; Martínez De Toda, F. Use of Minimal Pruning to Delay Fruit Maturity and Improve Berry Composition under Climate Change. Am. J. Enol. Vitic. 2017, 68, 136–140. [Google Scholar] [CrossRef]
  33. Poni, S.; Del Zozzo, F.; Santelli, S.; Gatti, M.; Magnanini, E.; Sabbatini, P.; Frioni, T. Double Cropping in Vitis vinifera L. Cv. Pinot Noir: Agronomical and Physiological Validation. Aust. J. Grape Wine Res. 2021, 27, 508–518. [Google Scholar] [CrossRef]
Figure 1. Local daily evapotranspiration (ETo), rainfall and average temperatures (AvgT) for 2017 (A), 2018 (B), 2019 (C) and 2020 (D). DOY = day of year in Julian days.
Agronomy 14 00130 g001
Figure 2. Cumulative irrigation for 2018 (A), 2019 (B) and 2020 (C). Note that (A) only includes treatments involved in Experiment 1 and (B,C) include treatments involved in Experiment 1 and Experiment 2. F1 = forcing pruning for F1 treatments; F2 = forcing pruning for F2 treatments; V-UF = veraison for UF treatment; V-F1 = veraison for F1 treatment; V-F2 = veraison for F2 treatment. Note that treatments of Experiment 1 and Experiment 2 are included in plots (B,C). DOY = day of year in Julian days.
Agronomy 14 00130 g002
Figure 3. Fraction of intercepted photosynthetically active radiation (FIPAR) for the treatments of Experiment 1 for 2018 (A), 2019 (B) and 2020 (C). DOY = day of year in Julian days. Means followed by different letters are different at p < 0.05.
Agronomy 14 00130 g003
Figure 4. Measured Ψs (A) and relative Ψs (B) in 2019 and measured Ψs (C) and relative Ψs (D) in 2020 for Experiment 2. Reference line in panels (B,D) means the constant relative Ψs = 1. DOY = day of year in Julian days.
Agronomy 14 00130 g004
Table 1. Main phenological stages, forcing dates and harvest dates for each year of the experiment in Julian days and growing degree days (GDD) in brackets. For UF treatment, GDD are computed from budburst to each phenological stage. For F treatments, GDD are computed from the time when forced buds unlock to each phenological stage.
Treatment Year Forcing Budburst Full Bloom Fruit SetVeraison Harvest
UF2017- 88 142 (290) 148 (365)207 (1152) 262 (1828)
2018 - 94 152 (322) 157 (395)213 (1145) 264 (1850)
2019 - 85 149 (281) 158 (369)211 (1112) 259 (1725)
2020 - 93 142 (302) 150 (395)206 (1076) 244 (1651)
F12017156 (441)170 194 (332)200 (423)249 (1097)283 (1359)
2018165 (473)173 199 (386)204 (452)253 (1169)298 (1559)
2019154 (336)165 187 (420)192 (474)245 (1261)289 (1659)
2020160 (490)170 196 (364)201 (428)254 (1032)295 (1316)
F22017186 (847)196 216 (305)222 (379)278 (968)325 (1162)
2018194 (886)207 227 (328)237 (459)285 (975)326 (1105)
2019182 (676)192 214 (413)219 (413)275 (1068)315 (1247)
2020189 (957)198 223 (399)230 (500)279 (1007)326 (1157)
Table 2. Mean and coefficient of variation (CV) of the length in days and in growing degree days (GDD) for the four years of Experiment 1 for the most relevant phenological stages and for the period between forcing pruning and the time when buds unlock (forced buds budburst). F = forcing pruning; BB = budburst; FS = fruit set; V = veraison; H = harvest date. Note that phenological stages did not coincide with dates between treatments.
PhenologyLength (Days)Length (GDD)
UFF1F2UFF1F2
MeanF-BB-1111-117181
BB-FS633029381444438
FS-V565152741696567
V-H484144641333163
Total167122125176314731168
CV (%)F-BB-23.216.5-47.721.4
BB-FS11.06.49.64.35.312.1
FS-V4.44.58.35.711.012.2
V-H15.112.18.69.421.117.6
Total6.64.83.75.311.15.0
Table 3. Mean of maximum temperature registered (Tmax), average temperature (Tavg), evapotranspiration (ETo) and rainfall during the 4 years of Experiment 1 for the time between the most relevant phenological stages of UF, F1 and F2 treatments. CV = coefficient of variation. BB = budburst; FS = fruit set; V = veraison; H = harvest date. Note that phenological stages did not coincide with dates between treatments.
PhenologyTmax (°C)Tavg (°C)ETo (mm)Rainfall (mm)
UFF1F2UFF1F2UFF1F2UFF1F2
MeanBB-FS31.036.638.315.424.025.0241167153106.325.610.8
FS-V36.938.335.023.024.020.429925119950.324.729.9
V-H38.031.627.023.117.612.42251277725.434.484.2
CV (%)BB-FS6.17.72.65.22.51.212.94.811.842.248.089.8
FS-V7.02.65.43.91.73.43.76.413.126.219.015.1
V-H3.24.45.25.25.77.38.914.218.219.380.848.5
Table 4. Average Ψs (MPa) for each treatment and the period between the most relevant phenological stages. For forced treatments, only phenological stages after the forcing pruning are included. BB = budburst; FS = fruit set; V = veraison; H = harvest. Note that phenological stages did not coincide with dates between treatments.
YearTreatmentPhenology
BB-FSFS-VV-H
2017UF-−1.48 a−1.34 a
F1-−1.13 a−1.06 b
F2-−0.93 b−1.05 b
2018UF−0.40 b−0.57−0.88 a
F1−0.64 a−0.64−0.70 b
F2−0.64 a−0.53−0.55 b
2019UF−0.46 b−0.45 b−0.95
F1−0.47 b−0.66 a−0.81
F2−0.59 a−0.58 a−0.82
2020UF−0.47 b−0.44 b−0.86 a
F1−0.48 b−0.66 a−0.73 b
F2−0.64 a−0.64 a−0.68 b
Treatment effects were analyzed using ANOVA and the means were separated with the Tukey test. Means followed by different letters are different at p < 0.05. Values are the mean of 4 repetitions per treatment.
Table 5. Yield, yield components and irrigation water use efficiency (IWUE) for the treatments (T), years and the interaction of treatment and year (T × Year) in Experiment 1.
Parameter T20172018 2019 2020 Average T YearT × Year
Yield (Mg/ha)UF-RDI 23.2 a8.2 a17.5 a6.9 b14.0 a**** **
F1-RDI4.1 b10.3 a8.5 b12.7 a8.9 b
F2-RDI 6.8 b0.8 b7.3 b7.7 b5.7 c
Bunches/VineUF-RDI 35 a16 b21 b16 b22 b * ** **
F1-RDI14 b35 a23 b39 a28 a
F2-RDI 27 ab6 b40 a32 a26 ab
Bunch Weight (g)UF-RDI 260 a197 a334 a174 a241 a ** ** **
F1-RDI115 b118 b143 b129 b126 b
F2-RDI 98 b50 c75 c94 c79 c
BerryFW (g)UF-RDI 1.97 a2.15 a2.51 a2.70 a2.33 a****ns
F1-RDI1.45 b1.52 b1.94 b1.94 b1.71 b
F2-RDI 1.37 b1.27 b1.38 c1.68 b1.42 c
BerryDW (g)UF-RDI 0.51 a0.54 a0.62 a0.69 a0.59 a*****
F1-RDI0.37 b0.40 b0.53 a0.50 b0.45 b
F2-RDI 0.33 b0.30 b0.36 b0.37 b0.34 c
Berries/BunchUF-RDI 132 a92 a133 a64105 a******
F1-RDI79 b78 a74 b6674 b
F2-RDI 72 b39 b54 b5656 c
Berries/vine UF-RDI 4620 a1472 b2793 a1024 c2477 a******
F1-RDI1106 b2730 a1702 b2574 a2028 a
F2-RDI 1944 b234 c2160 ab1792 b1456 c
IWUE
(kg/(ha mm))
UF-RDI -58 a73 a42 ab58 a**ns**
F1-RDI-54 a43 b58 a51 a
F2-RDI -3 b32 b26 b20 b
Treatment effects were analyzed using ANOVA and the means were separated with the Tukey test. Means followed by different letters are different at p < 0.05. Values are the mean of 4 repetitions per treatment. Significance levels: ns = not significant; * = significant at p < 0.05; ** = significant at p < 0.01.
Table 6. Must quality parameters for the treatments (T), years, and interaction of treatment and year (T × Year) in Experiment 1.
ParameterYearTreatmentsSignificance
UF-RDIF1-RDIF2-RDITYearT × Year
TSS °Brix201724.8 a24.0 a22.5 b******
201825.1 a23.7 b21.6 c
201924.324.023.6
202025.1 a24.2 a20.2 b
Average24.8 a23.9 b22.0 c
TA (g/L) 20175.9 c12.2 b16.7 a******
20187.1 c10.6 b16.7 a
20194.0 c6.7 b10.7 a
20205.6 c9.5 b13.9 a
Average4.8 c7.6 b11.2 a
pH20183.6 a3.3 b3.1 c*****
20193.5 a3.3 b3.1 c
20203.6 a3.2 b3.0 b
Average 3.6 a3.2 b3.1 c
Ac Malic (g/L) 20191.6 c3.6 b6.7 a******
20202.1 c4.6 b7.2 a
Average 1.8 d4.1 c6.9 b
TSS:TA201742.6 a19.6 b13.5 b******
201835.5 a22.4 b13.0 c
2019 61.1 a36.0 b22.2 c
202045.4 a28.4 b17.2 c
Average46.1 a26.6 b16.5 c
Treatment effects were analyzed using ANOVA and the means were separated with the Tukey test. Means followed by different letters are different at p < 0.05. Values are the mean of 4 repetitions per treatment. Significance levels: ns = not significant; * = significant at p < 0.05; ** = significant at p < 0.01.
Table 7. Fraction of intercepted photosynthetically active radiation (FIPAR), yield, yield components and irrigation water use efficiency (IWUE) for the forcing (F) and irrigation (I) treatments in Experiment 2.
ParameterYearTreatmentsSignificance
F1-RDIF1-PreF2-RDIF2-PreFIF × I
Pre-forcing FIPAR
(dimensionless)
20190.34 b0.32 b0.52 a0.48 a**ns*
20200.25 b0.25 b0.30 a0.30 a**nsns
Average0.30 b0.29 b0.41 a0.39 a**nsns
Post-forcing FIPAR (dimensionless)20190.38 a0.39 a0.30 b0.33 ab**nsns
20200.37 a0.36 ab0.31 c0.32 bc**nsns
Average0.38 a0.38 a0.31 b0.32 b**nsns
Yield (Mg/ha)20198.59.37.37.5nsnsns
202012.7 a12.8 a7.7 b7.8 b*nsns
Average10.6 a11.0 a7.5 b7.7 b*nsns
Bunches/Vine201923 b27 b40 a42 a**ns ns
202039393234*nsns
Average3133 3638*nsns
Bunch Weight (g)2019143 a137 a75 b73 b**nsns
2020129 b127 b94 c89 c**nsns
Average 136 a132 a84 b81 b**nsns
BerryFW (g)20191.94 a2.00 a1.38 b1.43 b*nsns
20201.941.951.681.89nsnsns
Average 1.94 a1.98 a1.53 b1.66 ab*nsns
BerryDW (g) 2019 0.53 a0.54 a0.36 b0.34 b**nsns
20200.50 a0.51 a0.37 b0.40 ab*nsns
Average0.52 a0.53 a0.36 b0.37 b*nsns
Berries/Bunch2019 74 a68 a54 b51 b**nsns
202066655647*nsns
Average70 a67 ab55 bc49 c*nsns
Berries/Vine2019 170218362160 a2142 a*nsns
20202574253517921598*nsns
Average2138218619761870nsnsns
IWUE
(kg/(ha mm))
2019 42 ab55 a32 b51 ans**ns
202058 a59 a26 b36 ab**nsns
Average50 a57 a29 b44 a****ns
Treatment effects were analyzed using MANOVA and the means were separated with the Tukey test. Means followed by different letters are different at p < 0.05. Values are the mean of 4 repetitions per treatment. Significance levels: ns = not significant; * = significant at p < 0.05; ** = significant at p < 0.01.
Table 8. Must quality parameters for the forcing (F) and irrigation (I) treatments in Experiment 2.
ParameterYearTreatmentsSignificance
F1-RDIF1-PreF2-RDIF2-PreFIF × I
TSS °Brix201924.124.123.623.1nsnsns
202023.7 a24.2 a20.2 b19.8 b**nsns
Average24.0 a24.1 a21.9 b21.4 b**nsns
TA (g/L) 20196.7 b6.7 b10.7 a11.3 a**nsns
20208.5 d9.0 c11.7 b12.2 a**ns**
Average7.6 c7.8 c11.2 b11.7 a***ns
pH20193.3 a3.3 a3.1 b3.1 b*nsns
20203.13.13.03.0nsnsns
Average 3.2 a3.2 a3.1 b3.1 b*nsns
Ac Malic (g/L) 20193.6 c3.7 c6.7 b7.2 a***ns
20204.6 b5.1 b7.2 a7.9 a*ns*
Average 4.1 c4.4 c6.9 b7.5 a****ns
TSS:TA201936.0 a36.5 a22.2 b20.5 b**nsns
202026.2 a28.4 a17.2 b16.2 b*nsns
Average32.2 a31.4 a19.7 b18.4 b**nsns
Treatment effects were analyzed using MANOVA and the means were separated with the Tukey test. Means followed by different letters are different at p < 0.05. Values are the mean of 4 repetitions per treatment. Significance levels: ns = not significant; * = significant at p < 0.05; ** = significant at p < 0.01.
Disclaimer/Publisher’s Note: The statements, opinions and data contained in all publications are solely those of the individual author(s) and contributor(s) and not of MDPI and/or the editor(s). MDPI and/or the editor(s) disclaim responsibility for any injury to people or property resulting from any ideas, methods, instructions or products referred to in the content.

