Abstract
Understanding genetic architectures of yield and yield-related traits of wheat (Triticum aestivum L.) grown under dryland or irrigated conditions is pivotal for developing modern high-yielding germplasm and cultivars. The objectives of this study were to detect quantitative trait loci (QTL) linked to yield and yield components using a mapping population derived from ‘TAM 113’/‘Gallagher’, including 191 recombinant inbred lines (RILs). The population was grown in McGregor, College Station, and Bushland, Texas, for three consecutive years from 2019 to 2021. A high-density genetic map covering all 21 chromosomes was constructed using a set of 8,075 single nucleotide polymorphisms (SNPs) obtained using genotyping-by-sequencing (GBS). A total of 147 QTLs for 16 yield-related traits were identified, which included 16 QTLs consistently detected in multiple experiments and 8 QTLs that showed pleiotropic effects. Of them, five pleiotropic QTLs overlapped with the consistent QTL. They increased grain yield (YLD) up to 37.64 g m−2, thousand kernel weight (TKW) up to 1.33 g, harvest (HI) up to 0.97%, kernel length up to 0.08 mm, and kernel width up to 0.04 mm with Gallagher alleles and increased YLD up to 22.21 g m−2, kernels spike−1 up to 1.77, TKW up to 1.14 g, and HI up to 3.72% with TAM 113 alleles. One major and consistent QTL on chromosome 2D at 34.4 Mbp overlapped with the major photoperiod gene Ppd-D1 and was affected by multiple traits, including kernel diameter (DIAM), TKW, kernel hardness index (KHI), heading date (HD), and plant height (PH). Another QTL cluster region on 7D between 52 and 66 Mbp, encompassing one consistent and three pleiotropic QTLs. One of the pleiotropic QTLs at 52 Mbp increased YLD up to 24.16 g m−2, HI up to 1%, and DIAM up to 0.03 mm. This study dissected genetic loci associated with yield and yield-related traits, providing valuable information on wheat improvement using marker-assisted selection (MAS).
1. Introduction
Wheat (Triticum aestivum L.) grows globally on more than 220 million hectares of land and produces about 780 million metric tons of grain annually [1]. The current global population is over seven billion, and it is projected to reach nine billion within the next three decades [2]. Expanding production areas for agriculture is becoming increasingly challenging due to the limited availability of arable land. Therefore, increasing yield per unit area becomes a viable option to meet future demand using high-yielding varieties and applying optimal management practices [3].
Grain yield (YLD) can be dissected into three components, including spike m−2 (SPM), kernels spike−1 (KPS), and thousand kernel weight (TKW) [4,5]. Grain yield is a quantitative trait significantly influenced by environmental factors and genotype-by-environment interactions [6], but genetic factors remain the stable components controlling yield [7], indicating a greater potential for improving the trait genetically [8,9,10]. Under adverse environmental conditions, the heritability of overall yield may be low [11,12,13], but for traits of yield components such as TKW, SPM, KPS, kernel length (KLEN), kernel width (KWID), and kernel perimeter (KPERI), moderate to high heritability were reported [14,15]. Thousand-kernel weight contributes up to 20% of YLD improvement and is often considered one of the major factors in developing high-yielding wheat cultivars [16]. In addition, agronomic traits such as heading date (HD) and plant height (PH) also have significant impacts on wheat yield [17,18]. Vernalization response genes (Vrn-1, Vrn-2, Vrn-3, etc.) play a critical role in initiating the transition to reproductive growth in wheat [19,20], and photoperiod response genes (Ppd) control heading date by regulating plant physiology for daylight perception and response [21,22]. Both types of genes influence the HD and further affect yield [23].
Detecting and characterizing YLD genes in wheat is challenging due to their quantitative characteristics and the complexity of the wheat genome. Quantitative trait loci (QTL) analysis is a valuable tool to understand the genetic mechanism of complex traits [24]. Over the last decade, next-generation sequencing technology has been extensively utilized to identify single nucleotide polymorphisms (SNPs) for breeding and genetics studies [25], such as identifying QTL associated with yield and yield components in wheat [26,27,28]. For instance, Dhakal et al. [29] mapped 18 QTLs for YLD on eight chromosomes in a recombinant inbred line (RIL) population derived from ‘TAM 112’/‘TAM 111’. Yang et al. [30] mapped eight QTLs associated with TKW on chromosomes 1D, 2D, 4D, and 7D using the same RIL population.
In order to identify QTL conferring yield and its components in the two elite hard red winter wheat cultivars, ‘TAM 113’ and ‘Gallagher’, the current study used 191 RILs derived from TAM 113/Gallagher to investigate genomic regions associated with yield and its component under multiple years and locations, particularly focused on QTL consistently detected in multiple environments or QTL with pleiotropic effects on multiple traits.
2. Materials and Methods
2.1. Plant Materials, Field Trials, and Phenotypic Data Collection
A total of 191 F2:7 RILs derived from the cross between two winter wheat varieties, TAM 113 and Gallagher, were used. TAM 113 was released by Texas A&M AgriLife Research in 2010, with excellent yield potential and drought tolerance, a high level of resistance against leaf rust [Puccinia recondite f. sp. tritici (Prt)], stripe rust [Puccinia striiformis f. sp. tritici (Pst), and stem rust [Puccinia graminis f. sp. tritici (Pgt)] [31]. Wheat cultivar Gallagher is an early maturing variety released by the Oklahoma Agricultural Experiment Station (OAES) in 2012, and it also shows a good level of resistance to leaf rust [Puccinia recondite f. sp. tritici (Prt)], stripe rust, [Puccinia striiformis f. sp. tritici (Pst), Hessian fly [Mayetiola destructor (Say)], and soil-borne wheat mosaic virus (SBWMV) [32].
Field studies were conducted from 2019 to 2021 at the Texas A&M AgriLife Research stations in College Station (30°32′34.8″ N lat.; 96°25′47.3″ W long.) designated as 19 CS and 20 CS, Bushland (35°09′35.3″ N lat.; 102°05′02.9″ W long.) designated as 19 BSP, 21 BD and 20 EMN, and McGregor (31°22′24.8″ N lat.; 97°27′05.9″ W long.) designated as 19 MCG and 20 MCG across three years with data collected from a total of seven environments (Table S1). Only 19 BSPs were irrigated among the seven environments. A subset of 137 RIL lines were used for experiments in 2019, and the full population of 191 RILs was used in 2020 and 2021. A balanced alpha-lattice experimental design with two replications was used at each site. For planting, 50 g seeds from each line were sown in each plot (4.57 × 1.52 m for dryland and 3.05 × 1.52 m for irrigated land). Except for 19 BSP, all environments were under dryland conditions, and standard agronomical practices were applied to all field trials [30].
After the physiological maturity, whole plots were harvested using a combine harvester (Wintersteiger Inc., Salt Lake City, UT, USA), and YLD data were converted to grams per square meter (g m−2) from above seven environments except for the experiment of 19 MCG with no combine harvesting (Table S1).
Yield-related traits were collected following the procedure described by Yang et al. [30]. Briefly, samples from a half-meter-long inner row were cut from the ground in each plot after physiological maturity and dried in a drying room at 60 °C for three days. The dried samples were measured for biomass grain yield (BMYLD) and total biomass (BM) from three environments (19 BSP, 20 EMN, and 21 BD). Other yield-related traits, including thousand kernel weight (TKW), kernel per spike−1 (KPS), spikes m−2 (SPM), harvest index (HI), spike weight (SPW), single head grain weight (SHGW), single head dry weight (SHDW), and single stem weight (SSW) were calculated using biomass samples as previously described by Wang et al. [33] and Dhakal et al. [29]. SPM was calculated by counting spikes from biomass samples and converted to per square meter area. KPS was computed using BMYLD, TKW, and SPM. HI was calculated using BMYLD divided by BM. SHDW was calculated using SPW divided by BM. SHGW was calculated using BMYLD divided by SPM. SSW was calculated using BM divided by SPM.
For kernel-related traits, around 10 g of seeds from each biomass sample were scanned with 300 dots per inch (dpi) and default color settings using a scanner (HP 11956A, Hewlett-Packard, Palo Alto, CA, USA). Images were processed with Grain Scan software at 300 dots per inch (dpi) to determine kernel area (KAREA), kernel perimeter (KPERI), kernel length (KLEN,) kernel width (KWID), and kernel number (KN) [34]. TKW was calculated by dividing scanned seed weight by seed number and multiplying results by one thousand. In addition, Single Kernel Characterization System (SKCS) 4100 (SKCS 4100, Perten Instruments, Springfield, IL, USA) was used to obtain single kernel weight (SKW), kernel diameter (DIAM), and kernel hardness index (KHI) using one replication of biomass samples from 20 MCG. Since SKW and TKW were highly correlated, these two traits were considered the same trait for determining the pleiotropic effect in the QTL result part. Simultaneously, DIAM and KWID were also considered the same due to the high correlations.
Days to heading were recorded as the number of days according to the Julian calendar [35] from 1 January to the date of 50% of spikes out of the flag leaf from seven environments except 20 MCG. Plant height was calculated based on measurements from the ground to the top of the spike, excluding awns at random spots in each plot.
2.2. Statistical Analyses
The distribution frequency of all traits in the RIL population at each environment was tested using JMP Pro 16 [36] (Figure S1), and outliers were removed to improve data reliability. The analysis of variance (ANOVA) for each trait was performed using META-R 4.0 to assess variations due to genotype (G), environment®, and genotype-by-environment interaction (GbyE) (Table S2) [37]. The restricted maximum likelihood method (REML) was used to calculate the values of the best linear unbiased predictor (BLUP) and best linear unbiased estimate (BLUE) for each line using META-R 4.0 and the R package lme4 with the following formula;
where is the mean, is the effect of th, is the replication of the th, is the effect incomplete block of the in th iblock + is the genotypic effect th genotype, is the interaction of genotype and location, and is the effect of error. Fixed assumption for genotype allows the calculation of BLUE values; while calculating BLUP values, the genotype effect was accepted as a random effect [38].
Pearson’s correlation coefficiens® (r) were calculated among traits using BLUP values. Further, broad-sense heritability was estimated using the following formula:
where H = broad-sense heritability, = the genotypic variance, = the genotype-by-environment interaction variance, σ2Є = the error variance, nEnv = the number of environments, and nRep = the number of replications in analysis.
2.3. Genotyping, Linkage Mapping, and QTL Analysis
Genomic DNA was extracted from leaf samples of 191 RILs and parents during the 2–3 leaf stage using the Cetyltrimethyl Ammonium Bromide (CTAB) method [39] described by Yang et al. [30]. The DNA concentration was tested by a NanoDrop 1000 spectrophotometer (NanoDrop Technologies, Inc., Wilmington, DE, USA) and agarose gel; then, each DNA sample was diluted to the optimal concentration. Genotyping was performed by the Texas A&M AgriLife Genomics and Bioinformatics Service (http://www.txgen.tamu.edu/ (10 September 2021)) using the ddRADseq genotyping protocol on an Illumina Hiseq400 sequencing system. The SNP calling was conducted by aligning the Chinese Spring reference genome v1.0 [40] with the same procedure described by Dhakal et al. [41].
For linkage analysis, SNPs were filtered to remove redundancy using the BIN function of QTL IciMapping v4.0 [42]. Moreover, SNPs with high heterozygosity (>10%) or significantly deviated from the 1:1 segregation ratio and high missing rate (>20%) were removed. Double crossovers that happened within one kb were considered false and were manually removed for further analysis. The filtered SNP data were used to construct linkage maps using JoinMap v 4.0 [43] following procedures in Yang et al. [30] and Dhakal et al. [41]. Inclusive composite interval mapping of additive QTL (ICIM-ADD) method was performed to identify QTL from individual environments (IE) and across multiple environments (MET) using QTL IciMapping v4.0. LOD threshold was determined using 1000 times permutation with type I error at p < 0.05. Physical locations of identified QTL were calculated using the peak genetic positions and physical locations of flanking markers Peak Mb = (Right Mb − Left Mb)/(Right cM − Left cM) * (peak_cM − Left cM) + Left Mb. Consistent QTL was defined as the QTL significant in at least two individual environments. However, the pleiotropic QTL was defined as a genomic region that affects more than two different traits that were not highly correlated. The name of the detected QTL followed the customized nomenclature rule of McIntosh et al. [44] in the format of Qtrait.tamu.chrom.Mbp, where Q was the acronym of QTL, the trait was the corresponding trait abbreviation, Tamu was the abbreviation of Texas A&M University, Chrom indicated chromosome number, and Mbp was the peak physical position of QTL. Epistatic interactions were identified using inclusive composite interval mapping of epistatic (ICIM-EPI) with the same LOD threshold settings. The phenotypic variation explained (PVE), allele source, and additive effect of each QTL were extracted from QTL IciMapping v4.0 outputs.
3. Results
3.1. Phenotypic Evaluation
According to the ANOVA (Table S2), except for BM, SPW, and BMYLD, all traits exhibited significant genotypic effects (p < 0.01). Effects of genotype-by-environment interactions were significant (p < 0.05) for all traits except BM, HI, SPM, and SPW. Environment effects were significant (p < 0.05) for all traits except HI and kernel traits. Broad-sense heritability (H) for yield and yield components could be classified into three groups based on their magnitude: low (<0.3), including BM, SPW, and BMYLD; moderate (0.3 to 0.6), including SPM, HI, KPS, and SSW; and high (>0.6), including HD, PH, KAREA, PERI, KLEN, KWID, TKW, YLD, SHDW, and SHGW (Table S2).
Pearson’s correlation coefficients for yield and yield components were reported in Table S3 and categorized into three groups: low (<0.3), moderate (0.3–0.6), and high (>0.6). Grain yield had a high positive correlation with HI and SHGW (r = 0.61–0.63, p < 0.01), while correlations between YLD and TKW, KAREA, KWID, and SHDW were moderate (r = 0.43–0.56, p < 0.001) across all environments. The correlation between TKW and YLD (r = 0.40–0.56, p < 0.01) was higher than correlations between YLD and the other two yield components (KPS and SPM) (r = −0.18–0.2, p < 0.5–0.001) under across all environments and 19BSP. Meanwhile, KPS had higher significant positive correlations (r = 0.37–0.55, p < 0.01) with yield in 21 BD and 20 EMN.
The correlation between SPM and YLD was not significant in any environments except overall analyses. TKW had strong correlations with KWID (r = 0.82–0.92, p < 0.01), moderate correlations with KLEN (r = 0.54–0.65, p < 0.01), but low to moderate correlations with BMYLD (r = 0.15–0.38, p < 0.01) in both individual and across all environments. HD had significant negative correlations with YLD, TKW, and kernel traits (r = −0.25–−0.6, p < 0.01) in 19BSP but only significant for KWID, YLD, and HI in 21 BD. Moreover, PH had significant positive correlations with kernel traits, TKW, YLD, and HI in 21 BD and 20 EMN but not in 19 BSP.
3.2. Linkage Analysis and QTL Identification
A total of 8075 SNPs were retained after removing the SNPs with more than 20% missing data and 10% heterozygosity from the raw data of 177,385 SNPs. A set of 25 linkage groups covering all 21 chromosomes was created using 8075 SNPs and used for QTL identification (Table S4). The total length of the genetic map was 4844 cM, and the average length per linkage group was 193.8 cM. The physical distance of the linkage map was 14,753.1 Mb, and the average length per linkage group was 590.1 Mb. The average marker density was 0.7 SNP cM−1 or 2.6 SNPs Mbps−1. B genome had the highest SNPs number (3206, 39.7%), A genome had the second largest number of SNPs (3106, 38.4%), and D genome had the lowest number of SNPs (1763, 21.8%).
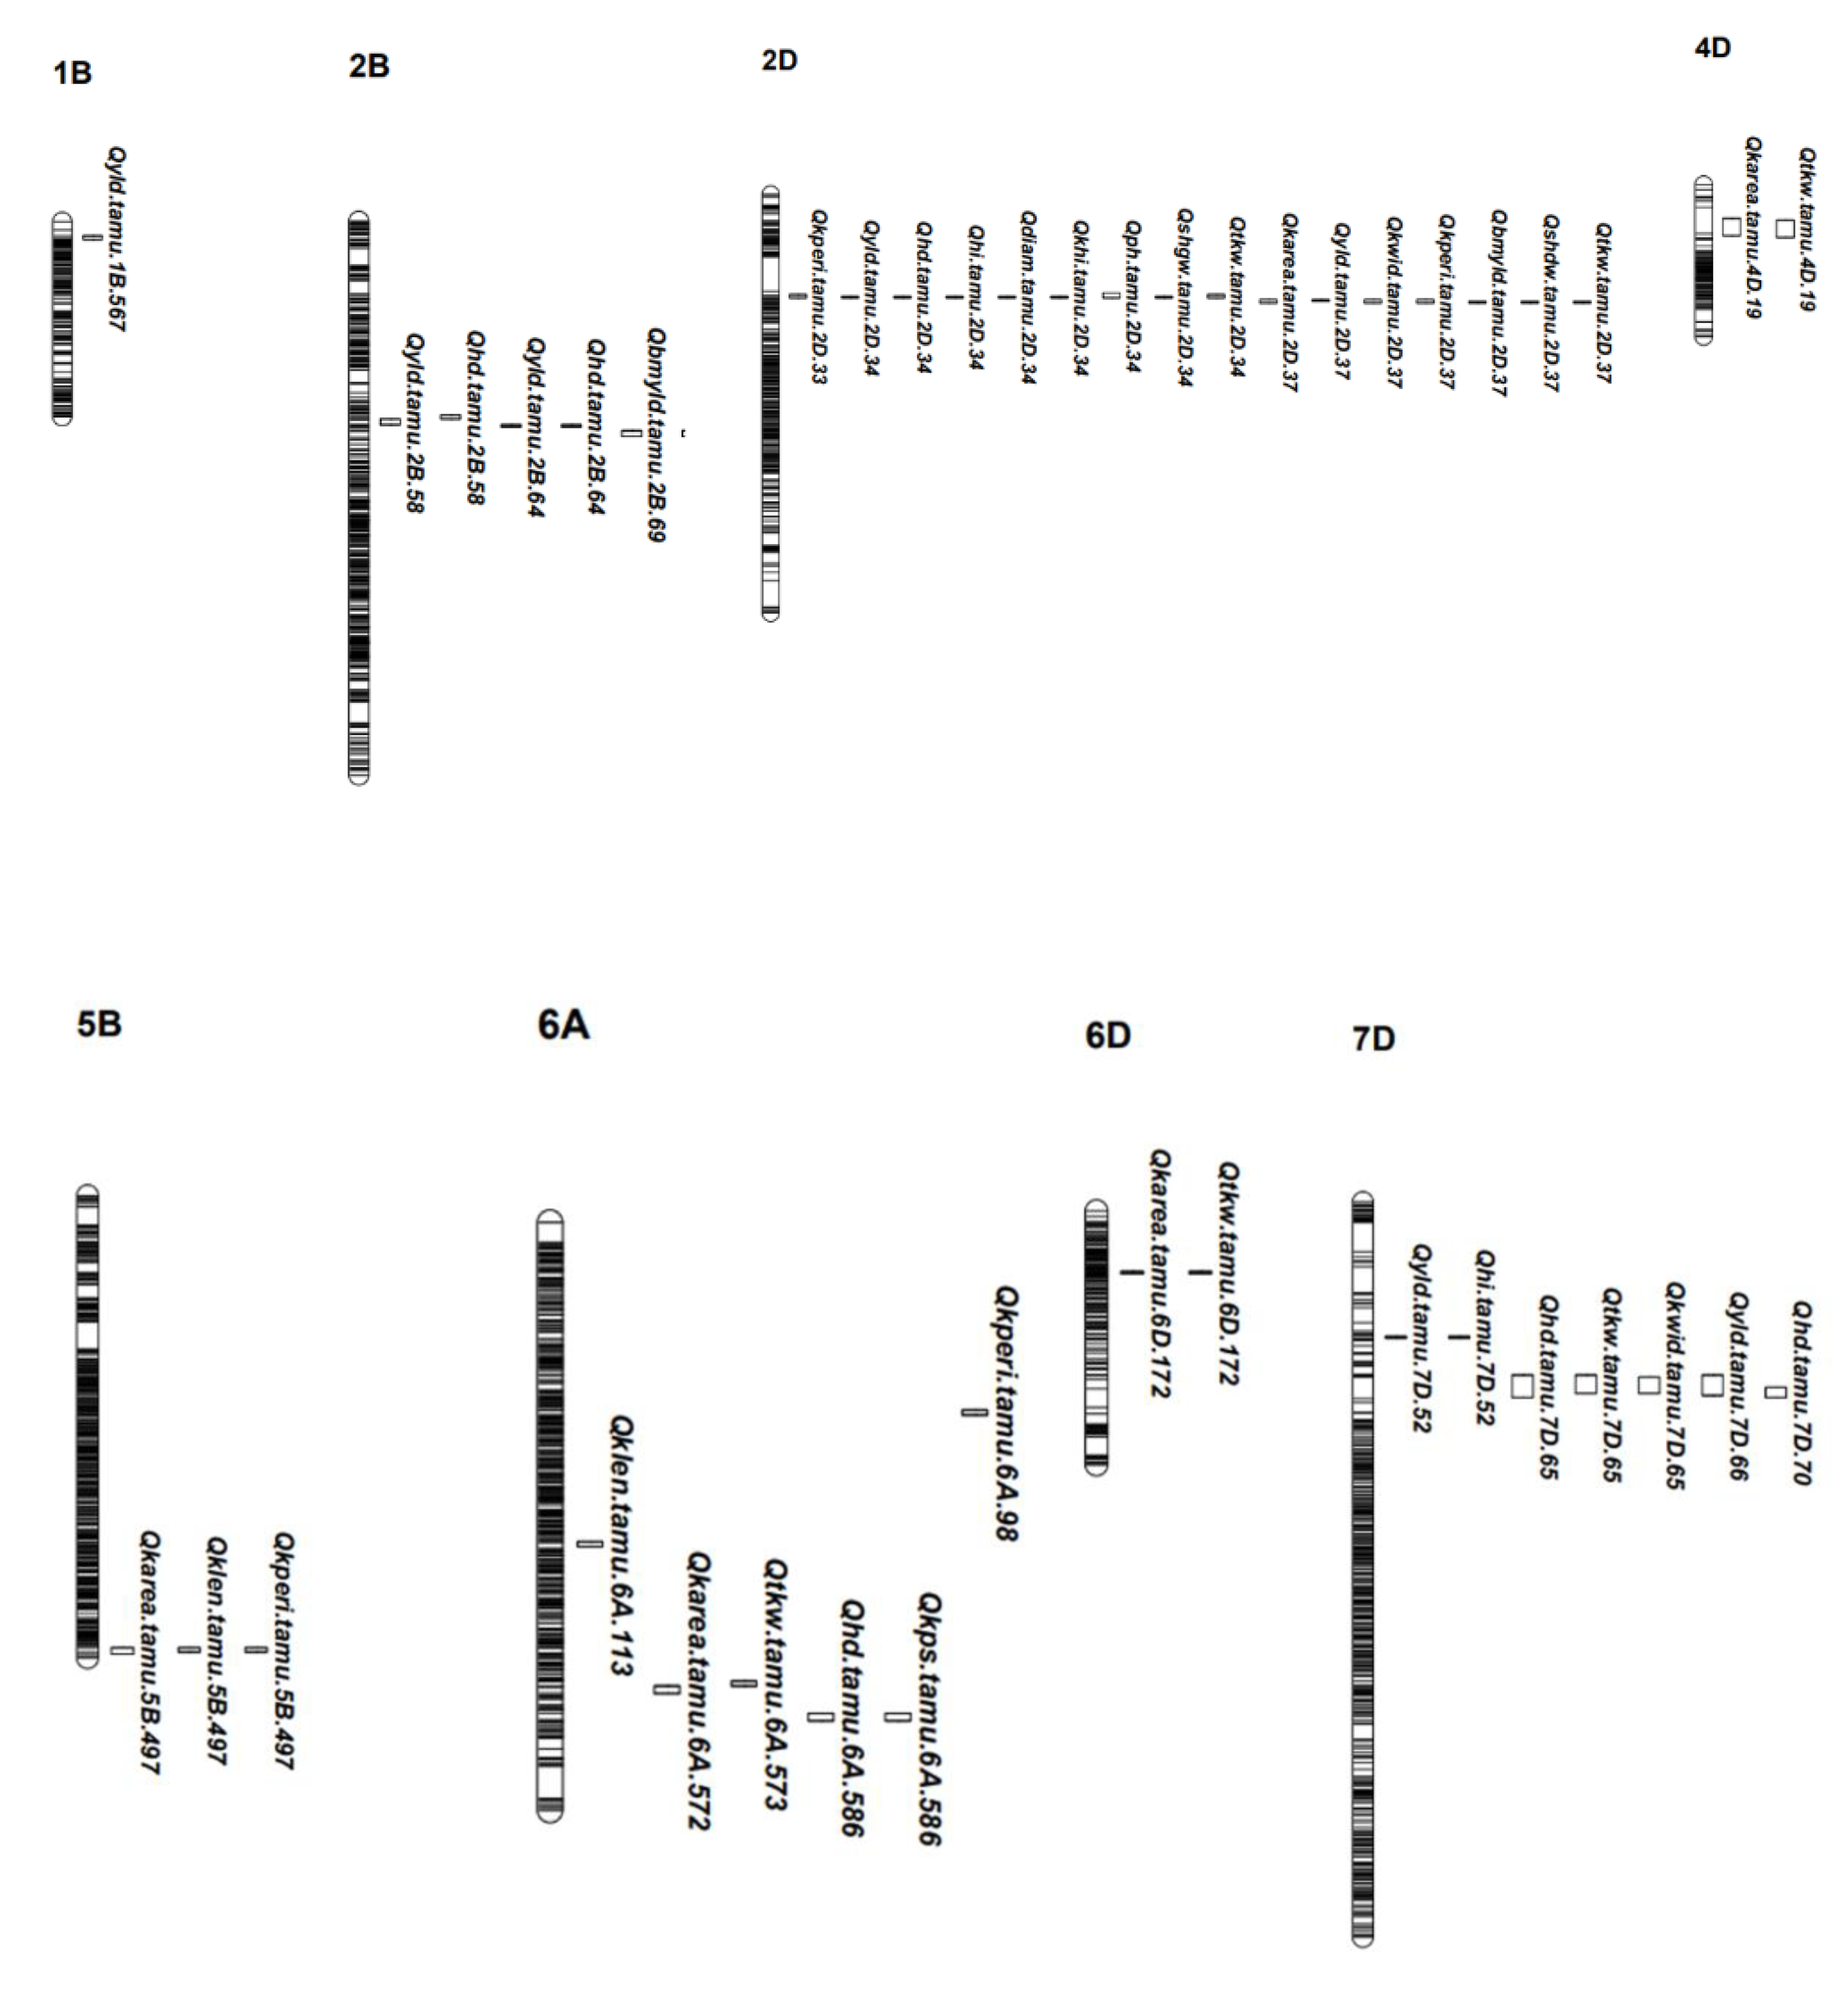
There were 107 unique genomic regions associated with yield, yield components, kernel, and agronomic traits on 19 chromosomes from within and across individual environment analyses (Table S5). A total of 18 chromosome regions harboring 16 consistent QTLs and eight pleiotropic QTL regions were identified, with five in common (Table 1 and Figure 1).

Table 1.
Consistent and pleiotropic QTL for yield, yield components, agronomic, and kernel traits identified from individual and multi-environment analyses.
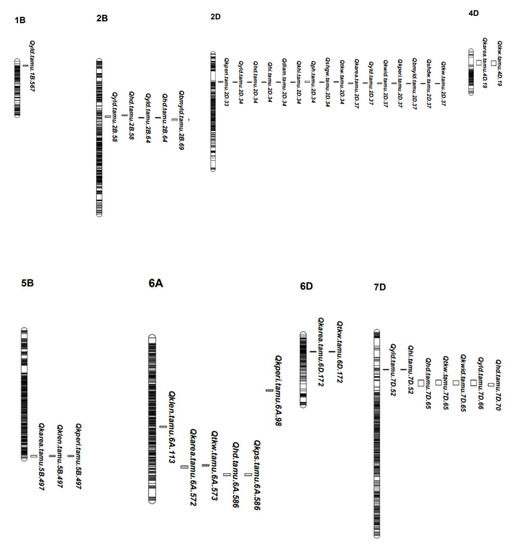
Figure 1.
The chromosomal distribution of pleiotropic and consistent QTL regions associated with yield, yield components, kernel traits, and agronomic traits from individual and combined environments. Traits: heading date (HD); plant height (PH); grain yield from combine harvester (YLD); single kernel weight (SKW); kernel diameter (DIAM); harvest index (HI); biomass (BM); spikes m−2 (SPM); biomass grain yield from 0.5 m inner row (BMYLD); kernel area (KAREA); thousand kernel weight (TKW); harvest index (HI); kernel perimeter (KPERI); kernel hardness index (KHI): kernel length (KLEN); kernel width (KWID); kernels spike−1 (KPS); single head dry weight (SHDW); single stem weight (SSW); single head grain weight (SHGW).
3.2.1. QTL for Yield
A total of 23 QTL regions were detected for YLD based on individual and across-environment analyses (Table S5). Three consistent and six pleiotropic QTLs were detected on chromosomes 1B, 2B, 2D, and 7D (Table 1 and Figure 1). The first consistent QTL on chromosome 1B at 566.9 Mbp explained up to 14.68% phenotypic variation (PVE) and increased YLD up to 23.75 g m−2 in 20 MCG. Its additive effects explained yield variations up to 7.36% with favorable alleles from Gallagher. The second consistent QTL was identified on 2B at 57.25 Mbp and explained 4.34% of phenotypic variation. TAM 113 allele increased YLD up to 16.56 g m−2 in 20 MCG. The third consistent QTL on 2D at 36.9 Mbp explained up to 26.15% of total PVE and increased YLD by 37.64 g m−2 with favorable alleles from Gallagher in 20 CS. The additive effect explained 8.5% of the total PVE. Seven additional yield QTL were identified from individual and across-environment analyses on chromosomes 1A, 2B, 2D, 4A, and 7D. Three QTLs, one on 1A at 11.28 Mbp, two on 2D at 34.42, and 483.8 Mbp with favorable alleles from Gallagher explained up to 20.23% total PVE and increased YLD up to 31.45 g m−2 in 19 CS. The rest four QTLs on 2B at 63.96 and 571.41 Mbp, on 4A at 75.9 Mbp, and on 7D at 52.31 Mbp with favorable alleles from TAM 113 explained up to 16.87% PVE and increased YLD up to 16.87 g m−2 in 19 BSP. Thirteen QTLs on chromosomes 1A, 1B, 4A, 4B, 6D, 7B, and 7D were only identified from individual or across environment analysis, which explained up to 13.24% PVE and increased YLD by 27.68 g m−2 under 20 MCG (Table S5).
3.2.2. QTL for Yield Components and Kernel Traits
Four QTLs associated with KPS were mapped on chromosomes 2B, 5A, and 6A from individual and across-environment analyses (Table S5). A QTL on chromosome 2B at 69.34 Mbp explained 22.32% of total phenotypic variations and showed the highest KPS increment of 1.76 kernels spike−1 with the allele from TAM 113 in 21 BD. One QTL on chromosome 6A at 586.24 Mbp was identified from one individual and across environment analysis, explaining up to 16.17% phenotypic variations and increasing KPS up to 0.94 kernels spike−1 with favorable alleles from TAM 113. Another two QTLs on 2B at 76.40 Mbp and on 5A at 12.83 Mbp increased KPS up to 0.88 kernels spike−1 hand had favorable alleles from TAM 113 and Gallagher, respectively. For SPM, only one QTL at 637.07 Mbp on 5A was identified from individuals and across three environments. It explained up to 10.67% total PVE and increased SPM up to 36.30 spikes m−2 with the favorable allele from Gallagher in 20 EMN. Its additive effect explained 5.94% out of 7.66% of total PVE (Table S5).
A total of 10 QTLs associated with TKW was detected on chromosomes 1B, 2D, 4D, 5A, 6A, 7A, and 7D (Table S5), including two consistent QTLs (Table 1 and Figure 1). The first consistent QTL on chromosome 2D at 37.25 Mbp explained that 12.55% of PVE and Gallagher alleles increased TKW up to 1.01 g in 20 MCG. The second consistent QTL on 6A at 573.37 Mbp explained that 12.92% of PVE and 1.03 g of TKW were increased by Gallagher alleles in 20 MCG. Three TKW QTLs on chromosomes 2D at 34.43 Mbp, 6A at 160.62 Mbp, and 7D at 64.42 Mbp were detected under both individual and across environments, explaining up to 19.13% PVE and increasing TKW up to 1.33 g in 19BSP with favorable alleles from Gallagher. Moreover, five TKW QTLs with favorable alleles from TAM 113 were identified from one individual environment or across environment analyses, explaining up to 13.14% total PVE with the effect that increased TKW up to 1.14 g in 19BSP (Table 1, Figure 1, Table S5). For HI, five QTLs were detected on chromosomes 2B, 2D, 4B, and 7D. Three were detected under one individual and across environments on chromosomes 2B at 69.34 Mbp, 2D at 34.42 Mbp, and 7D at 52.31 Mbp. They explained up to 27.35% phenotypic variation and increased HI up to 3.72% in 21 BD with TAM 113 allele. Another two QTLs on chromosome 4B at 441.13 Mbp and 603.4 Mbp were only identified from across-environment analyses.
Eight QTLs were mapped for KAREA from individuals and across three environment analyses (Table S5). One consistent QTL on chromosome 2D at 36.90 Mbp explained up to 18.15% total PVE and increased KAREA up to 0.29 mm2 in 20 EMN. Its additive effect explained 12.70% of PVE with favorable alleles from Gallagher (Table 1 and Figure 1). Two QTLs were detected from one individual environment and across three environment analyses on chromosome 2B at 120.96 Mbp and on 6A at 573.08 Mbp, explaining up to 10.77% total phenotypic variation and increasing KAREA up to 0.21 mm2 with favorable alleles from Gallagher in 19 BSP. Five other QTLs with minor effects were identified from only one individual or across environment analyses, explaining up to 8.23% and increasing KAREA up to 0.20 mm2 with favorable alleles from TAM 113 in 20 EMN.
For KLEN, seven QTLs were mapped, and two of them were consistent QTLs (Table 1 and Table S5, and Figure 1). The first consistent QTL was located on chromosome 5B at 496.62 Mbp and explained KLEN PVE up to 7.71%. The favorable alleles were from TAM 113 and increased KLEN up to 0.05 mm in 19 BSP. The additive effect is explained by 5.62% out of 6.68% of total PVE. The second consistent QTL was located on 6A at 113.23 Mbp, explained up to 11.48% PVE and increasing KLEN by 0.07 mm with Gallagher allele in 19 BSP. Its additive effect explained 7.06% out of 10.99% of total PVE when analyzed across three environments. Four additional QTLs were identified from one individual environment and across three environments with favorable alleles, all from Gallagher that increased KLEN up to 0.1 mm in 20 EMN.
Eight QTLs associated with KWID were mapped, and two were consistent QTLs (Table S5). The first consistent QTL was identified on 2D at 37.25 Mbp (Table 1 and Figure 1). It explained 17.48% of total phenotypic variation and increased KWID up to 0.04 mm with a favorable allele from Gallagher in 19 BSP. Its additive effect explained 14.79% out of 17.24% of the total PVE when analyzed across three environments. The second consistent QTL was detected on 7D at 66.02 Mbp. TAM 113 allele increased KWİD up to 0.037 mm in 19BSP. It explained 12.64% of the total PVE. One QTL was detected by a single environment and across three environmental analyses on chromosome 4D at 253.31 Mbp. A favorable allele from Gallagher increased KWID up to 0.04 mm in 19 BSP and explained 13.16% of total PVE in 21 BD. The rest of KWID QTLs only showed up in one single environment or across three environments. Favorable alleles from Gallagher increased KWID up to 0.07 mm in 20 MCG.
For KPERI, seven QTLs were identified on chromosomes 2B, 2D, 5B, and 6A (Table S5). The only consistent QTL on chromosome 6A at 98.34 Mbp had favorable alleles from Gallagher and increased KPERI up to 0.18 mm under 20 EMN. Its additive effect explained 9.34% out of 12.52% of total PVE when analyzed across three environments. Three QTLs were detected from one single environment and across the three environmental analyses. They explained up to 15.74% of total PVE and increased KPERI up to 0.25 mm in 21 BD. Another three QTLs were identified from one individual environment or across environments on chromosomes 2B, 2D, and 6A. They increased KPERI up to 0.17 mm with a total PVE value up to 11.55% in 19 BSP.
3.2.3. QTL for Agronomic Traits
A total of 14 QTL regions were detected for HD based on individual and across-environment analyses (Table S5). Four consistent QTLs and five pleiotropic QTLs with three in common were identified on chromosomes 2B, 2D, 6A, and 7D (Table 1 and Figure 1). The first consistent QTL on chromosome 2B at 57.6 Mbp had PVE up to 11.63% and increased HD by 1.07 days with favorable alleles from Gallagher in 20 CS. The second consistent QTL on 2B at 63.96 Mbp explained up to 8.12% of total PVE in 19BSP. Allele from Gallagher increased HD up to 1.22 days in 19 MCG. The third consistent QTL on 2D at 34.43 Mbp was detected in all six environments. It explained up to 57.45% PVE (Figure S2). TAM 113 allele increased HD by 4.86 days in 20 MCG. The fourth consistent HD QTL on chromosome 7D at 70.03 Mbp explained up to 5.10% of total PVE in 19 BSP and increased the HD by 0.96 days with the Gallagher allele in 20 CS. Four QTLs were detected from individual environments and across environments analyses. With favorable alleles from TAM 113, QTL on chromosomes 6B at 3.56 Mbp and 16.98 Mbp and 7D at 607.85 Mbp increased HD by 3.69 days and explained up to 25.54% of total phenotypic variation in 20 CS. Meanwhile, the Gallagher alleles increased HD up to 1.69 days for QTL on 2B at 46.85 Mbp, which contributed 8.12% total PVE in 19 CS. Six QTLs were detected in a single environment or multi-environment analysis with the favorable allele from TAM 113 except for QTL on 4B at 659.62 Mbp, increasing HD up to 1.4 days.
For PH, a total of 27 QTLs were identified from individual and across-environment analyses (Table S5). The only consistent QTL on 2D at 34.43 Mbp explained up to 28.78% of PVE with a favorable allele from TAM 113 that increased PH up to 3.48 cm in 20 MCG (Table 1). Sixteen QTLs were detected from one environment and across environments analysis, explaining up to 27.66% of total PVE and increasing PH up to 2.49 cm in 19 MCG with TAM 113 allele. The rest of QTL with alleles from Gallagher on chromosomes 1A, 4B, and 6A explained up to 22.35% of total PVE and increased PH by 3.22 cm in 19 MCG. Ten PH QTLs were only identified from one individual environment or across environments analyses, increasing PH up to 1.75 cm in 20 CS and explaining up to 27.66% of PVE.
3.3. Pleiotropic QTL
A set of 8 QTL regions on chromosomes 2B, 2D, 6A, and 7D were identified as pleiotropic QTL affecting more than one trait (Table 1 and Table S5 and Figure 1). A genomic region associated with HD and YLD was identified on 2B at 57.61 Mbp. With TAM 113 alleles, it increased YLD by 16.56 g m−2 in 20 MCG and increased HD by 1.07 days with the Gallagher alleles in 20 CS. Another genomic region on 2B at 63.96 Mbp increased HD by 0.72 days with the Gallagher allele and increased YLD by 14.46 g m−2 with the TAM 113 allele in 21 BD. The QTL on 2B at 69.34 Mb was associated with BMLYD, HI, KPS, and SHGW. This genomic region had a favorable allele from TAM 113, increased BMYLD by 37.04 g m−2, HI by 3.72%, KPS by 1.77 kernels, and SHGW by 0.02 mg. One major QTL cluster region on chromosome 2D at 34.43 Mbp was associated with DIAM, HD, HI, KHI, KPERI, PH, SHGW, TKW, and YLD. The favorable alleles from Gallagher increased YLD by 31.45 g m−2, HI by 0.94%, DIAM by 0.07 mm, SHGW by 0.03 mg head−1, KPERI by 0.03 mm, and TKW by 1.33 g. In contrast, the TAM 113 allele increased HD by 4.86 days, KHI by 5.71%, and PH by 3.48 cm. Another major QTL cluster region on chromosome 2D at 37.25 Mbp increased KAREA by 0.25 mm2, KWID by 0.04 mm, KPERI by 0.16 mm, TKW by 1.01 g, YLD by 37.64 g m−2, BMYLD by 20.03 g m−2, and SHDW by 0.08 mg head−1 with Gallagher allele. A genomic region on 6A at 586.23 Mbp was colocalized with HD and KPS QTL. This genomic region increased HD by 0.48 days and KPS up to 0.95 kernel spike−1 with favorable alleles from TAM 113. A genomic region on 7D at 52.32 Mbp increased HI by 0.7% and YLD by 13.16 g m−2 with the favorable allele from TAM 113. The QTL region on 7D at 65.22 Mbp was associated with HD, DIAM, KWID, and TKW, with the alleles from TAM 113 that decreased HD by 0.73 days and increased TKW by 1.14 g. Overall, the QTL at 34.43 Mbp on 2D had the largest effects on yield and its components.
3.4. Interactions of Epistasis and Epistasis-by-Environment
A total of 924 epistatic interactions with total LOD > 5 were summarized for yield, yield components, agronomic, and kernel traits from multiple locations (Table S6 and Supplemental Figure S3). Some QTLs are considered major QTLs, which is consistent or pleiotropic QTL. A total of 286 epistatic interactions were associated with HD with LOD > 5, and 60 epistatic interactions were detected with LOD > 10. One consistent HD QTL on 2D at 36.90 Mbp interacted with a QTL on 6D at 437.60 Mbp, increasing HD up to 3.19 days. Another consistent QTL, Qhd.tamu.7D.70, interacted with a QTL on 6B at 660.15 Mbp and increased HD up to 3.21 days in 20 CS. For PH, a total of 266 epistatic interactions were identified, and 19 of them had LOD > 10. Four major PH QTLs from individual or multi-environment analyses were involved in epistasis interactions. The interaction between QTL on 5B at 294.50 Mbp and 5B at 320.57 Mbp increased PH by 2.46 cm in 21 BD. For YLD, 109 epistatic (additive-by-additive), additive-by-environment (AbyE), and epistasis-by-environment interactions were identified. Five yield QTLs, Qyld.tamu.2B.64, Qyld.tamu.6D.10, Qyld.tamu.2D.34, Qyld.tamu.7D.66 and Qyld.tamu.7D.47, were involved in epistasis interactions. Epistasis interaction between YLD QTL on 4A at 703.95 and 708.17 Mbp showed the highest YLD increase of 38.28 g m−2 by epistasis-by-environment interaction in 20 MCG. One major YLD QTL Qyld.tamu.2D.34 interacted with a QTL on 3D at 577.85 Mbp, explaining 1.64% of total PVE and increasing YLD up to 9.60 g m−2 in 20 MCG. Qyld.tamu.2B.64 interacted with a QTL on chromosome 6D at 433.13 Mbp and increased YLD up to 9.97 g m−2 under 21 BD. The last QTL, Qyld.tamu.7D.66, interacted with a QTL on chromosome 7A at 643.96 Mbp, explaining 1.36% of PVE and increasing YLD up to 5.68 g m−2 in 20 CS. A total of 36 epistatic interactions were detected for KPS. Only three epistasis interactions increased KPS, and no major QTL was involved. Another yield component, SPM, had 32 epistatic interactions that increased SPM up to 25.26 spikes m−2, and no major QTL was associated with epistasis interactions. Nevertheless, the most significant epistasis interactions increased SPM over 25.17 spikes m−2 in 21 BD. Only 11 epistasis interactions were identified for TKW that increased up to 0.52 g of TKW. A total of 104 epistasis interactions for kernel traits were identified with LOD > 5, but only one with LOD > 10. Forty-six epistatic interactions with LOD > 5 were identified for KAREA, including two major QTLs. The first QTL Qkarea.tamu.4D.19 interacted with QTL on 4A at 680.55 Mbp, which increased KAREA by 0.07 mm2 in 19 BSP. The second QTL, Qkarea.tamu.5B.497, interacted with a QTL on 5B at 705.24 Mbp and increased KAREA by 0.1 mm2. For KLEN, 36 interactions were identified. However, none of the major QTLs was involved in these interactions.
4. Discussion
Improving yield is the primary objective for most wheat breeding programs. Understanding the genetic bases of yield and its components is critical in accelerating genetic gain in wheat improvement. Among the various approaches that have been used to dissect the genetic mechanisms of target traits. QTL mapping is one of the most efficient and commonly used methods [28,30,33,41,45], which provides useful information and facilitates marker-assisted selection (MAS) to accurately and effectively select lines carrying superior alleles.
The BLUP values derived by fitting the model that contains genotypic and environmental factors were often used to reflect the breeding values of individuals [46]. In the current study, analysis of variance showed that genotype variance was larger than environment and GbyE interactions for all traits except for BM, YLD, and SPW, which suggested that traits investigated in the RIL population have a strong genetic control (Table S2). Significant variations due to environment and GbyE interaction were also observed for most traits in this study. Environmental factors, such as biotic and abiotic stress, can strongly affect genotype performance, which may lead to a yield reduction [47]. Some environments may trigger the activation of environments-specific genes or mask the gene’s effects [48]. Heritability is another parameter that shows how genetic gain could be expected [49]. Except for BM, SPW, and BMYLD, moderate to high broad-sense heritability was found for yield and yield-related traits (Table S2), which is consistent with reports from previous studies by Garcia et al. [50] and Al-Tabbal and Al-Fraihat [51]. The low heritability of the three traits made phenotypic selection less effective [33]. Broad-sense heritabilities for agronomic and kernel-related traits in the current study were all over 0.8, consistent with the results previously reported by Xin et al. [14], indicating that genotypic factors played significant roles in the phenotypic variations of these traits.
Correlations among traits are essential for breeders to understand the relationship among different traits and use different selection strategies in improving grain yield potential [52]. Grain yield showed a positive significant correlation with many other traits. However, YLD had a significant negative correlation with HD in all environments, which is consistent with the result from Ali et al. [53]. Early development of wheat spikes is usually desired, which completes the reproductive stage earlier and facilitates the initiation of grain filling effectively before the start of the dry season [54]. Gonfa and Tesfaye [55] have reported positive significant correlations between BM, HI, and YLD under moderate drought conditions. Similarly, we observed a significant positive correlation between YLD and BM under non-irrigated conditions, but it was insignificant in an irrigated location 19BSP, which suggests BM and HI can be used as selection indicators to improve grain yield in dry environments. There were negative correlations between KPS and TKW in all environments except 20 EMN, suggesting that compensation effects existed between KPS and TKW. Likewise, SPM had a negative correlation with TKW and KPS in most cases, indicating that an increase in spike number per unit area will likely reduce the kernel weight and kernel number. There were positive and significant correlations between kernel traits and YLD, suggesting kernel traits could be used in the selection of high YLD genotypes. A high correlation among kernel-related traits showed a common genetic structure controlling phenotypic expression for these traits [56].
In this research, 118 QTLs were mapped on all chromosomes except for 1D and 3A (Table S5). Sixteen QTLs were identified in two or more individual environments, and eight genomic regions affected two or more traits (Table 1 and Table S5). Several QTLs detected for PH in this study were physically close to previously reported QTL [30,56,57,58]. Two PH QTLs, one was 3.8 Mbp away from a PH QTL located on 4B at 611.1 Mbp, and another one was 10 Mbp away from QTL on 4B at 474.9 Mbp identified by Semagn et al. [57]. One consistent YLD QTL identified at 58 Mbp on 2B was co-located with a YLD QTL reported by Semagn et al. [57]. Wang et al. [33] identified stable yield QTL on 2D at 37.1 Mbp that overlapped with Qyld.tamu.2D.37.
QTL controlling YLD located on 1B at 573 Mbp and 7D at 45.1 and 64.3 Mbp were reported at the close regions by Dhakal et al. [29] and Wang et al. [33], which were relatively close to Qyld.tamu.1B.567, Qyld.tamu.7D.47, and Qyld.tamu.7D.66 in our study. The similarity of findings between Dhakal et al. [29] and our study can be explained by closely related parents shared by both studies with similar genetic backgrounds. Moreover, two YLD QTLs with relatively small effects on chromosome 6D and 7B at 10.33 Mbp and 4.2 Mbp were reported by previous studies [30,56,57,58,59].
Several HD QTLs with both minor and major effects were identified on chromosomes 1A, 2B, 2D, 4A, 6A, 6B, 7A, and 7D. One QTL with a minor effect on 2B at 46.85 Mbp was previously mapped by Wang et al. [33]. The consistent HD QTL located on 2B at 57.61 Mbp may overlap with the significant photoperiod sensitivity gene, Ppd-B1, promoting early flowering and emergence of ears [60,61]. Gallagher was identified as the donor parent of Ppd-B1b alleles based on diagnostic maker analysis. We mapped a major HD QTL on 2D at 36.90 Mbp that shared genetic location with previous findings [31]. This region may overlap with another major photoperiod gene, Ppd-D1, which triggers early flowering. This gene is important for wheat planted in dry environments to avoid drought stress during the grain-filling stage [62,63]. In addition, one consistent HD QTL was mapped on 7D at 70.03 Mbp, co-locating with the HD QTL reported by Isham et al. [45] and Wang et al. [33], which is close to the major flowering time regulating gene FT-D1. It significantly affects inflorescence development at the beginning of the reproductive stage [20,22], and Gallagher was the carrier of dominant alleles of FT-D1.
Several TKW QTLs were reported by Liu et al. [64], and one of them (qTgw.nwipb-6AL) was mapped on 6A at 573.08 Mbp, which was also found in the present study. Moreover, another QTL mapped on 2D near 28 Mbp was around 7 Mbp, away from our findings on 2D at 34.43 Mbp. Another TKW QTL on 6D at 171.52 Mbp was previously mapped in several studies and colocalized with the TaGW2-6D gene that affected kernel width and kernel weight [65,66]. Dhakal et al. [29] reported a QTL associated with TKW on 7D at 65 Mbp, which was 2 Mbp away from our mapped QTL. In the same study, another TKW QTL region was 9–10 Mbp away from the QTL Qtkw.tamu.4D.19 identified in the current study. Further, a QTL linked to SKW on 5A at 606.28 Mbp was also identified by another study conducted by Yu et al. [67]. Some of the QTLs associated with seed-related traits match the previous reports. For instance, one KWID QTL mapped at 36.90 Mbp on 2D, close to a previously reported KWID QTL at 32 Mbp on 2D [33,59]. Ma et al. [59] also mapped a KLEN QTL at 48 Mbp on 2D, which is seven Mbp away from what we detected in this study. Dogan et al. [11] mapped KLEN QTL on 4A at 29.27 Mbp, which overlapped with Qklen.tamu.4A.29, identified in the present study. One KLEN QTL on 7A at 638.6 from this study was close to a previously reported QTL region on 7A between 624 and 639 Mbp [68]. A DIAM QTL identified on 7D at 66.02 Mbp was two Mbp away from a DIAM QTL on 7D at 64.3 Mbp, as reported by Dhakal et al. [41]. In addition, a KLEN QTL Qklen.tamu.5B.497 on 5B was consistent in all environments and had a pleiotropic effect on KAREA and KPERİ that has not been reported before. Similarly, a KPERİ QTL Qperi.tamu.6A.98 on 6A was consistent in all environments and controlling KLEN, which has not been reported in previous studies. Another consistent KLEN QTL Qklen.tamu.6A.113 on 6A might be novel QTL compared with previous studies.
Eight pleiotropic genomic regions containing QTL related to more than two traits were identified using individual and cross-environment analyses. There were two major QTL clusters on 2D. One was located at 34.4 Mbp, affecting YLD and kernel-related traits. This QTL region was colocalized with the photoperiod gene Ppd-D1, which has pleiotropic effects on HD, PH, YLD, TKW, KWID, and DIAM [33,69,70]. Another QTL cluster on 2D at 37 Mbp was associated with TKW, KWID, BMYLD, and YLD (Table S4). One QTL cluster region was identified on 7D at 51.2–70 Mbp, affecting multiple traits, including YLD, BMYLD, HI, SHGW, DIAM, HD, KWID, and TKW. Similarly, Yang et al. [30] also reported that the physical interval between 64 and 68 Mb was associated with YLD and kernel-related traits using the RIL population derived from TAM 112 and TAM 111. Wang et al. [33] reported identical genomic regions on 7D between 62.2–69.2 Mbp in a RIL population from TAM112/Duster for similar traits. These similarities between the three RIL populations were caused by the relativeness between TAM 113 and TAM112. These two varieties share a similar partial pedigree [71]. The QTL cluster can be used to design markers for marker-assistant selection (MAS) [72,73].
The ICIM-EPI approach was performed to reveal epistasis and epistasis-by-environment interactions among environments. However, some QTLs had higher epistatic interactions. For example, four yield QTLs (Qyld.tamu.2B.64, Qyld.tamu.2D.34, Qyld.tamu.6D.10 and Qyld.tamu.7D.66) involved in epistatic interactions in different chromosomes and additive-by-additive interactions increased grain yield by 3.79, 6.23, 5.1, and 6.36 g m−2. In some environments, epistasis-by-environment interactions had higher grain yield increments than epistasis per se. Those interactions might be a concern for breeding selection since breeders can only fix the additive effects by selection. Using these analyses, breeders can better understand which QTL is worthy of selection in breeding practice.
5. Conclusions
This research used a population of 191 RILs derived from the cross between two hard red winter wheat cultivars, TAM 113 and Gallagher. Yield, yield components, agronomic, and kernel traits were evaluated at three different locations across Texas. Additionally, a high-density genetic linkage map was constructed with a set of 8075 polymorphic SNPs covering all 21 chromosomes.
We found 147 QTLs within 107 genomic regions associated with 20 different traits, including 16 consistent QTLs and 8 pleiotropic QTLs. Five common pleiotropic and consistent QTL regions were on 2B at 57.25 Mbp and 63.96 Mbp, on 2D at 34.43 Mbp and 37.25 Mbp, and on 7D at 66.02 Mbp. One HD QTL on 2B at 57.61 Mbp was co-located with a major photoperiod gene Ppd-B1. Another HD QTL on 2D at 34.43 Mbp coincided with another important photoperiod gene, Ppd-D1. The third QTL on 7D at 70.03 Mbp was close to the flowering time regulating gene FT-D1. In addition, novel QTLs Qklen.tamu.5B.497 and Qklen.tamu.6A.113 were identified by this study with higher additive effects, which would be useful in future marker assistant selection of high-yielding varieties.
Supplementary Materials
The following supporting information can be downloaded at: https://www.mdpi.com/article/10.3390/agronomy13092402/s1, Table S1: Traits and individual environments evaluated; Table S2: Analysis of variance, broad sense heritability and mean performance of yield components; Table S3: Pearson correlation for all traits for predicted means (BLUPs) derived from individual and across environments; Table S4: mapped SNPs on 21 chromosomes, their genetic and physical length; Table S5: QTL for yield and yield-related traits detected once from individual and across environment analyses; Table S6: Epistasis and epistasis by environment interactional effects of yield and yield-related traits; Figure S1: Histogram and Phenotypic distributions of the predicted (BLUP) values for all traits of recombinant inbreed lines (RIL) at individual environments; Figure S2: Whole genome significance LOD(A) and LOD(AbyE) profiles of quantitative trait loci for for yield, yield-related traits, and kernel-related traits based on across all the environments for each trait; Figure S3: Whole genome significance profiles of epistasis at LOD > 5 for yield, yield-related traits, and kernel-related traits.
Author Contributions
Conceptualization, S.L.; Methodology, M.C., Z.W., M.D., S.Y., J.L.V.-A., C.C., S.W., Q.X., A.M.H.I., J.C.R., R.M., C.D.J. and S.L.; Software, M.C., Z.W., M.D., S.Y., J.L.V.-A., C.C. and S.L.; Validation, M.C. and S.L.; Formal analysis, M.C., Z.W., M.D., S.Y., J.L.V.-A., C.C., S.W., Q.X., A.M.H.I., J.C.R., R.M., C.D.J. and S.L.; Investigation, M.C., Z.W., M.D., S.Y., J.L.V.-A., C.C., S.W., Q.X., A.M.H.I., J.C.R., R.M., C.D.J. and S.L.; Resources, A.M.H.I., J.C.R. and S.L.; Data curation, M.C., Z.W. and M.D.; Writing—original draft, M.C.; Writing—review and editing, M.C., Z.W., M.D., S.Y., J.L.V.-A., C.C., S.W., Q.X., A.M.H.I., J.C.R., R.M., C.D.J. and S.L; Visualization, M.C.; Supervision, A.M.H.I. and S.L.; Project administration, S.L.; Funding acquisition, S.L. and M.C. All authors have read and agreed to the published version of the manuscript.
Funding
This research was supported by the Texas Wheat Producer Board, Texas A&M AgriLife Research, Ministry of National Education of the Republic of Türkiye, USDA National Institute of Food and Agriculture (2019-67013-29172, 2017-67007-25939, 2021-67013-33940, and 2022-68013-36439).
Data Availability Statement
Publicly available original contributions were presented in the study. This data can be found here: Texas Data Repository https://dataverse.tdl.org/dataset.xhtml?persistentId=doi:10.18738/T8/DWOQFM (accessed on 13 August 2023).
Acknowledgments
We are thankful to Geraldine Opena, Bryan Simoneaux, Kele Hui, Shannon Baker, Kirk Joseph, Jason Baker, and Xiaoxiao Liu from Texas A&M AgriLife Research for their support in obtaining data. We also acknowledge Brittany M. Ehrlich, Lyanna De Leon, and Maria L. Zavala for harvesting and collecting data. We are highly grateful to the Ministry of National Education of the Republic of Türkiye for providing a fellowship to Mustafa Ceric.
Conflicts of Interest
The authors declare no conflict of interest.
Abbreviations
| ANOVA | analysis of variance |
| BM | biomass |
| BMYLD | biomass grain yield |
| BLUE | best linear unbiased estimate |
| BLUP | best linear unbiased predictors |
| CTAB | cetyltrimethyl ammonium bromide |
| DIAM | kernel diameter |
| GbyE | genotype by environment interaction |
| PH | plant height |
| SPW | pike weight including glume |
| HI | harvest index; |
| ICIM-ADD | inclusive composite interval mapping of additive QTL |
| IWGSC | International Wheat Genome Sequencing Consortium |
| KAREA | kernel area |
| KHI | kernel hardness index |
| KLEN | kernel length |
| KPERI | kernel perimeter |
| KPS | kernels per spike |
| KWID | kernel width |
| LOD | logarithm of odds |
| MAS | marker-assistant selection |
| PH | plant height |
| PVE | phenotypic variation explained |
| QTL | quantitative trait loci |
| REML | restricted maximum likelihood method |
| RIL | recombinant inbred line |
| SHDW | single head dry weight |
| SHGW | single head dry grain weight |
| SKW | single kernel weight |
| SPM | spikes per meter |
| SSW | single stem weight |
| TKW | thousand kernel weight |
| YLD | grain yield |
References
- Food and Agriculture Organization of the United Nations (FAO). 2017. Available online: https://www.fao.org/faostat/en/#data/QCL (accessed on 20 June 2021).
- United Nations (UN). 2017 NATIONS. Available online: https://www.un.org/en/global-issues/population (accessed on 20 June 2021).
- Bailey-Serres, J.; Parker, J.E.; Ainsworth, E.A.; Oldroyd, G.E.D.; Schroeder, J.I. Genetic strategies for improving crop yields. Nature 2019, 575, 109–118. [Google Scholar] [CrossRef] [PubMed]
- Yang, X.; McMaster, G.S.; Yu, Q. Spatial patterns of relationship between wheat yield and yield components in China. Int. J. Plant Prod. 2018, 12, 61–71. [Google Scholar] [CrossRef]
- Liu, K.; Sun, X.; Ning, T.; Duan, X.; Wang, Q.; Liu, T.; An, Y.; Guan, X.; Tian, J.; Chen, J. Genetic dissection of wheat panicle traits using linkage analysis and a genome-wide association study. Theor. Appl. Genet. 2018, 131, 1073–1090. [Google Scholar] [CrossRef] [PubMed]
- Balcha, A. Genotype by environment interaction for grain yield and association among stability parameters in bread wheat (Triticum aestivum L.). Am. J. Plant. Sci. 2020, 11, 1–10. [Google Scholar] [CrossRef]
- Dagnaw, T.; Mulugeta, B.; Haileselassie, T.; Geleta, M.; Tesfaye, K. Phenotypic variability, heritability and associations of agronomic and quality traits in cultivated ethiopian durum wheat (Triticum turgidum L. ssp. Durum, Desf.). Agronomy 2022, 12, 1714. [Google Scholar] [CrossRef]
- Piepho, H.-P.; Möhring, J. Computing heritability and selection response from unbalanced plant breeding trials. Genetics 2007, 177, 1881–1888. [Google Scholar] [CrossRef]
- Nyquist, W.E.; Baker, R.J. Estimation of heritability and prediction of selection response in plant populations. Crit. Rev. Plant Sci. 1991, 10, 235–322. [Google Scholar] [CrossRef]
- Yazici, E.; Bilgin, O. Heritability estimates for milling quality associations of bread wheat in the Northwest Turkey. Int. J. Agron. 2019, 2, 17–22. [Google Scholar] [CrossRef]
- Dogan, M.; Wang, Z.; Cerit, M.; Valenzuela-Antelo, J.L.; Dhakal, S.; Chu, C.; Xue, Q.; Ibrahim, A.M.H.; Rudd, J.C.; Bernardo, A.; et al. QTL analysis of yield and end-use quality traits in Texas hard red winter wheat. Agronomy 2023, 13, 689. [Google Scholar] [CrossRef]
- Jafarzadeh, J.; Bonnett, D.; Jannink, J.L.; Akdemir, D.; Dreisigacker, S.; Sorrells, M.E. Breeding value of primary synthetic wheat genotypes for grain yield. PLoS ONE 2016, 11, e0162860. [Google Scholar] [CrossRef]
- Tura, H.; Edwards, J.; Gahlaut, V.; Garcia, M.; Sznajder, B.; Baumann, U.; Shahinnia, F.; Reynolds, M.; Langridge, P.; Balyan, H.S.; et al. QTL analysis and fine mapping of a QTL for yield-related traits in wheat grown in dry and hot environments. Theor. Appl. Genet. 2020, 133, 239–257. [Google Scholar] [CrossRef]
- Xin, F.; Zhu, T.; Wei, S.; Han, Y.; Zhao, Y.; Zhang, D.; Ma, L.; Ding, Q. QTL mapping of kernel traits and validation of a major QTL for kernel length-width ratio using snp and bulked segregant analysis in wheat. Sci. Rep. 2020, 10, 25. [Google Scholar] [CrossRef] [PubMed]
- Collaku, A.; Harrison, S. Heritability of waterlogging tolerance in wheat. Crop Sci.-CROP SCI 2005, 45, 722–727. [Google Scholar] [CrossRef]
- Ma, D.; Yan, J.; He, Z.; Wu, L.; Xia, X. Characterization of a cell wall invertase gene TaCwi-A1 on common wheat chromosome 2A and development of functional markers. Mol. Breed. 2012, 29, 43–52. [Google Scholar] [CrossRef]
- Liu, Y.; Zhang, J.; Hu, Y.-G.; Chen, J. Dwarfing genes Rht4 and Rht-B1b affect plant height and key agronomic traits in common wheat under two water regimes. Field Crops Res. 2017, 204, 242–248. [Google Scholar] [CrossRef]
- Gill, B.K.; Klindworth, D.L.; Rouse, M.N.; Zhang, J.; Zhang, Q.; Sharma, J.S.; Chu, C.; Long, Y.; Chao, S.; Olivera, P.D.; et al. Function and evolution of allelic variations of Sr13 conferring resistance to stem rust in tetraploid wheat (Triticum turgidum L.). Plant J. 2021, 106, 1674–1691. [Google Scholar] [CrossRef]
- Loukoianov, A.; Yan, L.; Blechl, A.; Sanchez, A.; Dubcovsky, J. Regulation of VRN-1 vernalization genes in normal and transgenic polyploid wheat. Plant Physiol. 2005, 138, 2364–2373. [Google Scholar] [CrossRef]
- Whittal, A.; Kaviani, M.; Graf, R.; Humphreys, G.; Navabi, A. Allelic variation of vernalization and photoperiod response genes in a diverse set of North American high latitude winter wheat genotypes. PLoS ONE 2018, 13, e0203068. [Google Scholar] [CrossRef] [PubMed]
- Royo, C.; Ammar, K.; Alfaro, C.; Dreisigacker, S.; del Moral, L.F.G.; Villegas, D. Effect of Ppd-1 photoperiod sensitivity genes on dry matter production and allocation in durum wheat. Field Crops Res. 2018, 221, 358–367. [Google Scholar] [CrossRef]
- Boden, S.A.; Cavanagh, C.; Cullis, B.R.; Ramm, K.; Greenwood, J.; Jean Finnegan, E.; Trevaskis, B.; Swain, S.M. Ppd-1 is a key regulator of inflorescence architecture and paired spikelet development in wheat. Nat. Plants 2015, 1, 14016. [Google Scholar] [CrossRef]
- Grogan, S.M.; Brown-Guedira, G.; Haley, S.D.; McMaster, G.S.; Reid, S.D.; Smith, J.; Byrne, P.F. Allelic variation in developmental genes and effects on winter wheat heading date in the U.S. great plains. PLoS ONE 2016, 11, e0152852. [Google Scholar] [CrossRef]
- Jaganathan, D.; Bohra, A.; Thudi, M.; Varshney, R.K. Fine mapping and gene cloning in the post-NGS era: Advances and prospects. Theor. Appl. Genet. 2020, 133, 1791–1810. [Google Scholar] [CrossRef] [PubMed]
- Smýkal, P.; Varshney, R.K.; Singh, V.K.; Coyne, C.J.; Domoney, C.; Kejnovský, E.; Warkentin, T. From Mendel’s discovery on pea to today’s plant genetics and breeding. Theor. Appl. Genet. 2016, 129, 2267–2280. [Google Scholar] [CrossRef]
- Gao, F.; Wen, W.; Liu, J.; Rasheed, A.; Yin, G.; Xia, X.; Wu, X.; He, Z. Genome-Wide Linkage Mapping of QTL for Yield Components, Plant Height and Yield-Related Physiological Traits in the Chinese Wheat Cross Zhou 8425B/Chinese Spring. Front. Plant Sci. 2015, 6, 1099. [Google Scholar] [CrossRef]
- Guan, P.; Lu, L.; Jia, L.; Kabir, M.R.; Zhang, J.; Lan, T.; Zhao, Y.; Xin, M.; Hu, Z.; Yao, Y.; et al. Global QTL analysis identifies genomic regions on chromosomes 4a and 4b harboring stable loci for yield-related traits across different environments in wheat (Triticum aestivum L.). Front. Plant Sci. 2018, 9, 529. [Google Scholar] [CrossRef]
- Wang, S.-X.; Zhu, Y.-L.; Zhang, D.-X.; Shao, H.; Liu, P.; Hu, J.-B.; Zhang, H.; Zhang, H.-P.; Chang, C.; Lu, J.; et al. Genome-wide association study for grain yield and related traits in elite wheat varieties and advanced lines using SNP markers. PLoS ONE 2017, 12, e0188662. [Google Scholar] [CrossRef] [PubMed]
- Dhakal, S.; Liu, X.; Chu, C.; Yang, Y.; Rudd, J.C.; Ibrahim, A.M.H.; Xue, Q.; Devkota, R.N.; Baker, J.A.; Baker, S.A.; et al. Genome-wide QTL mapping of yield and agronomic traits in two widely adapted winter wheat cultivars from multiple mega-environments. PeerJ 2021, 9, e12350. [Google Scholar] [CrossRef]
- Yang, Y.; Dhakal, S.; Chu, C.; Wang, S.; Xue, Q.; Rudd, J.C.; Ibrahim, A.M.H.; Jessup, K.; Baker, J.; Fuentealba, M.P.; et al. Genome wide identification of QTL associated with yield and yield components in two popular wheat cultivars TAM 111 and TAM 112. PLoS ONE 2020, 15, e0237293. [Google Scholar] [CrossRef] [PubMed]
- Rudd, J.C.; Devkota, R.N.; Baker, J.A.; Ibrahim, A.M.; Worrall, D.; Lazar, M.D.; Sutton, R.; Rooney, L.W.; Nelson, L.R.; Bean, B.; et al. Registration of ‘TAM 113’ Wheat. J. Plant Reg. 2013, 7, 63–68. [Google Scholar] [CrossRef]
- Marburger, D.A.; Silva, A.d.O.; Hunger, R.M.; Edwards, J.T.; Van der Laan, L.; Blakey, A.M.; Kan, C.C.; Garland-Campbell, K.A.; Bowden, R.L.; Yan, L.; et al. ‘Gallagher’ and ‘Iba’ hard red winter wheat: Half-sibs inseparable by yield gain, separable by producer preference. J. Plant Regist. 2021, 15, 177–195. [Google Scholar] [CrossRef]
- Wang, Z.; Dhakal, S.; Cerit, M.; Wang, S.; Rauf, Y.; Yu, S.; Maulana, F.; Huang, W.; Anderson, J.D.; Ma, X.F.; et al. QTL mapping of yield components and kernel traits in wheat cultivars TAM 112 and Duster. Front. Plant Sci. 2022, 13, 1057701. [Google Scholar] [CrossRef]
- Whan, A.P.; Smith, A.B.; Cavanagh, C.R.; Ral, J.-P.F.; Shaw, L.M.; Howitt, C.A.; Bischof, L. GrainScan: A low cost, fast method for grain size and colour measurements. Plant Methods 2014, 10, 23. [Google Scholar] [CrossRef] [PubMed]
- Shiff, S.; Lensky, I.M.; Bonfil, D.J. Using satellite data to optimize wheat yield and quality under climate change. Remote Sens. 2021, 13, 2049. [Google Scholar] [CrossRef]
- Sall, J.; Lehman, A. JMP Start Statistics: A Guide to Statistical and Data Analysis Using JMP and JMP in Software; Duxbury Press: London, UK, 1996. [Google Scholar]
- Alvarado, G.; Rodríguez, F.M.; Pacheco, A.; Burgueño, J.; Crossa, J.; Vargas, M.; Pérez-Rodríguez, P.; Lopez-Cruz, M.A. META-R: A software to analyze data from multi-environment plant breeding trials. Crop J. 2020, 8, 745–756. [Google Scholar] [CrossRef]
- Bates, D.; Mächler, M.; Bolker, B.; Walker, S. Fitting Linear Mixed-Effects Models Using lme4. J. Stat. Softw. 2015, 67, 1–48. [Google Scholar] [CrossRef]
- Doyle, J. DNA Protocols for Plants. In Molecular Techniques in Taxonomy; Hewitt, G.M., Johnston, A.W.B., Young, J.P.W., Eds.; Springer: Berlin/Heidelberg, Germany, 1991; pp. 283–293. [Google Scholar]
- IWGSC, I.W.G.S.C. A chromosome-based draft sequence of the hexaploid bread wheat (Triticum aestivum) genome. Science 2014, 345. [Google Scholar] [CrossRef]
- Dhakal, S.; Liu, X.; Girard, A.; Chu, C.; Yang, Y.; Wang, S.; Xue, Q.; Rudd, J.C.; Ibrahim, A.M.H.; Awika, J.M.; et al. Genetic dissection of end-use quality traits in two widely adapted wheat cultivars ‘TAM 111’ and ‘TAM 112’. Crop Sci. 2021, 61, 1944–1959. [Google Scholar] [CrossRef]
- Meng, L.; Li, H.; Zhang, L.; Wang, J. QTL IciMapping: Integrated software for genetic linkage map construction and quantitative trait locus mapping in biparental populations. Crop J. 2015, 3, 269–283. [Google Scholar] [CrossRef]
- Van Ooijen, J. JoinMap® 4, Software for the Calculation of Genetic Linkage Maps in Experimental Populations; Kyazma BV: Wageningen, The Netherlans, 2006; Volume 33. [Google Scholar]
- McIntosh, R.; Yamazaki, Y.; Dubcovsky, J.; Rogers, J.; Morris, C.; Appels, R. Catalogue of gene symbols for wheat. In Proceedings of the 12th International Wheat Genetics Symposium, Okohama, Japan, 7–14 September 2013; pp. 8–13. [Google Scholar]
- Isham, K.; Wang, R.; Zhao, W.; Wheeler, J.; Klassen, N.; Akhunov, E.; Chen, J. QTL mapping for grain yield and three yield components in a population derived from two high-yielding spring wheat cultivars. Theor. Appl. Genet. 2021, 134, 2079–2095. [Google Scholar] [CrossRef]
- Piepho, H.P.; Möhring, J.; Melchinger, A.E.; Büchse, A. BLUP for phenotypic selection in plant breeding and variety testing. Euphytica 2008, 161, 209–228. [Google Scholar] [CrossRef]
- Öztürk, İ. Genotypes by Environment Interaction of Bread Wheat (Triticum aestivum L.) Genotypes on Yield and Quality Parameters under Rainfed Conditions. Int. J. Appl. Agric. Res. 2022, 6, 27–40. [Google Scholar] [CrossRef]
- Huang, W.; Carbone, M.A.; Lyman, R.F.; Anholt, R.R.H.; Mackay, T.F.C. Genotype by environment interaction for gene expression in Drosophila melanogaster. Nat. Commun. 2020, 11, 5451. [Google Scholar] [CrossRef] [PubMed]
- Ferrari, E.D.; Ferreira, V.A.; Grassi, E.M.; Picca, A.M.T.; Paccapelo, H.A. Genetic parameters estimation in quantitative traits of a cross of triticale (x Triticosecale W.). Open Agric. 2018, 3, 25–31. [Google Scholar] [CrossRef]
- Garcia, M.; Eckermann, P.; Haefele, S.; Satija, S.; Sznajder, B.; Timmins, A.; Baumann, U.; Wolters, P.; Mather, D.E.; Fleury, D. Genome-wide association mapping of grain yield in a diverse collection of spring wheat (Triticum aestivum L.) evaluated in southern Australia. PLoS ONE 2019, 14, e0211730. [Google Scholar] [CrossRef] [PubMed]
- Al-Tabbal, J.A.; Al-Fraihat, A.H. Heritability studies of yield and yield associated traits in wheat genotypes. J. Agric. Sci. 2012, 4, 11. [Google Scholar] [CrossRef]
- Kutlu, I.; Balkan, A.; Korkut, K.; Bilgin, O.; Başer, İ. Evaluation of reciprocal cross populations for spike-related traits in early consecutive generations of bread wheat. Genetika 2017, 49, 511–528. [Google Scholar] [CrossRef]
- Ali, M.; Zhang, Y.; Rasheed, A.; Wang, J.; Zhang, L. Genomic prediction for grain yield and yield-related traits in chinese winter wheat. Int. J. Mol. Sci. 2020, 21, 1342. [Google Scholar] [CrossRef] [PubMed]
- Upadhyaya, N.; Bhandari, K. Assessment of different genotypes of wheat under late sowing condition. Heliyon 2022, 8, e08726. [Google Scholar] [CrossRef] [PubMed]
- Gonfa, A.; Tesfaye, K. Relationship between grain yield and yield components of the ethiopian durum wheat genotypes at various growth stages. Trop. Subtrop. Agroecosyst. 2016, 19, 81–91. [Google Scholar]
- Li, R.; Chen, Z.; Zheng, R.; Chen, Q.; Deng, J.; Li, H.; Huang, J.; Liang, C.; Shi, T. QTL mapping and candidate gene analysis for yield and grain weight/size in Tartary buckwheat. BMC Plant Biol. 2023, 23, 58. [Google Scholar] [CrossRef]
- Semagn, K.; Iqbal, M.; Chen, H.; Perez-Lara, E.; Bemister, D.H.; Xiang, R.; Zou, J.; Asif, M.; Kamran, A.; N’Diaye, A. Physical mapping of QTL associated with agronomic and end-use quality traits in spring wheat under conventional and organic management systems. Theor. Appl. Genet. 2021, 134, 3699–3719. [Google Scholar] [CrossRef]
- Cao, J.; Shang, Y.; Xu, D.; Xu, K.; Cheng, X.; Pan, X.; Liu, X.; Liu, M.; Gao, C.; Yan, S.; et al. Identification and validation of new stable QTLs for grain weight and size by multiple mapping models in common wheat. Front. Genet. 2020, 11, 584859. [Google Scholar] [CrossRef] [PubMed]
- Ma, J.; Zhang, H.; Li, S.; Zou, Y.; Li, T.; Liu, J.; Ding, P.; Mu, Y.; Tang, H.; Deng, M. Identification of quantitative trait loci for kernel traits in a wheat cultivar Chuannong16. BMC Genet. 2019, 20, 77. [Google Scholar] [CrossRef] [PubMed]
- Rasheed, A.; Wen, W.; Gao, F.; Zhai, S.; Jin, H.; Liu, J.; Guo, Q.; Zhang, Y.; Dreisigacker, S.; Xia, X.; et al. Development and validation of KASP assays for genes underpinning key economic traits in bread wheat. Theor. Appl. Genet. 2016, 129, 1843–1860. [Google Scholar] [CrossRef] [PubMed]
- Zhang, W.; Zhao, G.; Gao, L.; Kong, X.; Guo, Z.; Wu, B.; Jia, J. functional studies of heading date-related gene TaPRR73, a paralog of ppd1 in common wheat. Front. Plant Sci. 2016, 7, 772. [Google Scholar] [CrossRef]
- Kato, K.; Yokoyama, H. Geographical variation in heading characters among wheat landraces, Triticum aestivum L., and its implication for their adaptability. Theor. Appl. Genet. 1992, 84, 259–265. [Google Scholar] [CrossRef]
- Lu, F.; Chen, M.; Zhao, Y.; Wu, S.; Yasir, M.; Zhang, H.; Hu, X.; Rong, J. Genetic mapping and candidate gene prediction of a qtl related to early heading on wild emmer chromosome 7bs in the genetic background of common wheat. Agronomy 2022, 12, 1089. [Google Scholar] [CrossRef]
- Liu, T.; Wu, L.; Gan, X.; Chen, W.; Liu, B.; Fedak, G.; Cao, W.; Chi, D.; Liu, D.; Zhang, H.; et al. Mapping quantitative trait loci for 1000-grain weight in a double haploid population of common wheat. Int. J. Mol. Sci. 2020, 21, 3960. [Google Scholar] [CrossRef]
- Qin, L.; Hao, C.; Hou, J.; Wang, Y.; Li, T.; Wang, L.; Ma, Z.; Zhang, X. Homologous haplotypes, expression, genetic effects and geographic distribution of the wheat yield gene TaGW2. BMC Plant Biol. 2014, 14, 107. [Google Scholar] [CrossRef]
- Jaiswal, V.; Gahlaut, V.; Mathur, S.; Agarwal, P.; Khandelwal, M.K.; Khurana, J.P.; Tyagi, A.K.; Balyan, H.S.; Gupta, P.K. Identification of novel snp in promoter sequence of TaGW2-6A associated with grain weight and other agronomic traits in wheat (Triticum aestivum L.). PLoS ONE 2015, 10, e0129400. [Google Scholar] [CrossRef]
- Yu, S.; Assanga, S.O.; Awika, J.M.; Ibrahim, A.M.H.; Rudd, J.C.; Xue, Q.; Guttieri, M.J.; Zhang, G.; Baker, J.A.; Jessup, K.E.; et al. Genetic mapping of quantitative trait loci for end-use quality and grain minerals in hard red winter wheat. Agronomy 2021, 11, 2519. [Google Scholar] [CrossRef]
- Cao, S.; Xu, D.; Hanif, M.; Xia, X.; He, Z. Genetic architecture underpinning yield component traits in wheat. Theor. Appl. Genet. 2020, 133, 1811–1823. [Google Scholar] [CrossRef] [PubMed]
- Vitale, P.; Fania, F.; Esposito, S.; Pecorella, I.; Pecchioni, N.; Palombieri, S.; Sestili, F.; Lafiandra, D.; Taranto, F.; De Vita, P. QTL analysis of five morpho-physiological traits in bread wheat using two mapping populations derived from common parents. Genes 2021, 12, 604. [Google Scholar] [CrossRef] [PubMed]
- Basavaraddi, P.A.; Savin, R.; Wingen, L.U.; Bencivenga, S.; Przewieslik-Allen, A.M.; Griffiths, S.; Slafer, G.A. Interactions between two QTLs for time to anthesis on spike development and fertility in wheat. Sci. Rep. 2021, 11, 2451. [Google Scholar] [CrossRef]
- Rudd, J.C.; Devkota, R.N.; Baker, J.A.; Peterson, G.L.; Lazar, M.D.; Bean, B.; Worrall, D.; Baughman, T.; Marshall, D.; Sutton, R.; et al. ‘TAM 112’ wheat, resistant to greenbug and wheat curl mite and adapted to the dryland production system in the southern high plains. J. Plant Regist. 2014, 8, 291–297. [Google Scholar] [CrossRef]
- Lv, H.; Wang, Q.; Liu, X.; Han, F.; Fang, Z.; Yang, L.; Zhuang, M.; Liu, Y.; Li, Z.; Zhang, Y. Whole-genome mapping reveals novel qtl clusters associated with main agronomic traits of cabbage (Brassica oleracea var. capitata L.). Front. Plant Sci. 2016, 7, 989. [Google Scholar] [CrossRef] [PubMed]
- Hai, L.; Guo, H.; Wagner, C.; Xiao, S.; Friedt, W. Genomic regions for yield and yield parameters in Chinese winter wheat (Triticum aestivum L.) genotypes tested under varying environments correspond to QTL in widely different wheat materials. Plant. Sci. 2008, 175, 226–232. [Google Scholar] [CrossRef]
Disclaimer/Publisher’s Note: The statements, opinions and data contained in all publications are solely those of the individual author(s) and contributor(s) and not of MDPI and/or the editor(s). MDPI and/or the editor(s) disclaim responsibility for any injury to people or property resulting from any ideas, methods, instructions or products referred to in the content. |
© 2023 by the authors. Licensee MDPI, Basel, Switzerland. This article is an open access article distributed under the terms and conditions of the Creative Commons Attribution (CC BY) license (https://creativecommons.org/licenses/by/4.0/).