Article

The Interaction between Strigolactone and Auxin Results in the Negative Effect of Shading on Soybean Branching Development

1
College of Agronomy, Sichuan Agricultural University, Ya’an 625014, China
2
Sichuan Engineering Research Center for Crop Strip Intercropping System, Chengdu 611130, China
3
Key Laboratory of Crop Ecophysiology and Farming System in Southwest China, Ministry of Agriculture, Chengdu 611130, China
*
Author to whom correspondence should be addressed.
Agronomy 2023, 13(9), 2383; https://doi.org/10.3390/agronomy13092383
Submission received: 1 August 2023 / Revised: 8 September 2023 / Accepted: 11 September 2023 / Published: 14 September 2023
(This article belongs to the Section Plant-Crop Biology and Biochemistry)

Abstract

:
The plant architecture of higher plants is regulated through environmental and genetic factors, as well as phytohormones. Phytohormones play a critical role in regulating shoot branching. We determined the branching phenotype of D16 and N99-6, the content of strigolactones, the genetic expression level, and the interaction between auxin and strigolactones. We found that the branching development of the two soybean varieties under shading was significantly slower than that under normal light. The average branch length of N99-6 decreased by 40.9% after shading; however, the branch length of D16 was not significantly affected. Meanwhile, the branch formation rate in D16 was significantly higher than in N99-6. In addition, after shading treatment, the content of strigolactones in D16 and N99-6 axillary buds increased significantly, and the expression of phytochrome genes, PhyA and PhyB, showed opposite changes. However, strigolactone synthesis gene GmMAX4 and signal transduction gene GmMAX2 expression levels of D16 were lower than those of N99-6 after 24 h of shading. In addition, the application of strigolactone inhibitor TIS108 and auxin inhibitor NPA to soybean had no significant effect on the branch phenotype. The expression of the GmMAX2 gene was significantly up-regulated after the external application of the auxin analog, and the expression of auxin transporter gene GmPINI was significantly down-regulated after external application of the strigolactone analog under shade. In this study, we investigated the adverse effect of shade on soybean branching development, which may be due to the interaction of strigolactones with auxins.

1. Introduction

Soybean is one of the most essential grains and oil crop species in the world and is a major source of high-quality protein for humans [1]. Furthermore, soybean oil accounts for 50% of vegetable oil consumption in China [2]. The demand for food continues to increase with the increasing population. Consequently, in order to efficiently utilize our current resources and reduce the incidence of weeds, pests, and diseases [3,4], soybean plants are often intercropped with corn or sorghum in some areas of south-west and west China [5]. Whether this pattern can produce higher yields depends on the compatibility of the growth habits, life spans, and management practices of the various crop species [6,7]. Nonetheless, previous studies have indicated that in the maize–soybean relay intercropping system, soybeans, as lower-positioned plants in the system, are shaded by the taller maize plants [8]. This not only reduces the light intensity in the soybean’s environment compared to normal light conditions but also lowers the red to far-red light ratio (R:FR) that lower-positioned plants receive [9,10]. This change in the ratio is typically considered a shade signal that phytochromes in plant leaves can perceive [11]. Among these phytochromes, phytochrome A (PhyA) is believed to be associated with a plant’s shade tolerance response [12], while phytochrome B (PhyB) is the most important regulatory factor related to plant morphogenesis in weak light conditions [13]. Under shaded conditions, PhyB transforms into an inactive form that cannot interact with PIFs [14]. Consequently, PIFs accumulate in shaded environments and promote phenotypic changes by mediating the transcriptional expression of downstream regulators such as ATHB2 and ATHB4, which belong to the HD-Zip Class II transcription factor family [15,16]. However, this excessive adaptation by plants results in increased consumption of photosynthates [17,18,19]. This series of adaptive responses is collectively referred to as the Shade Avoidance Syndrome (SAS). If shading persists, SAS includes rapid stem elongation, accelerated leaf senescence, and reduced branching, ultimately resulting in decreased biomass and seed yield [20,21].
Branching is a major component of plant architecture and a critical determinant of crop productivity. Among the variable phenotypes occurring under shade stress, branching is one of the most important components of plant type and one of the key factors determining crop yield [22,23]. Therefore, the molecular mechanisms of branching regulation under shading conditions have attracted increasing attention. González et al. [24] found that under simulated shade conditions (low R/FR ratios), the expression of the transcription factor BRANCHED1 (BRC1) is elevated, leading to the suppression of branching activity. Kebrom et al. [25] examined the expression levels of branching and cell-cycle-related genes in axillary buds of PhyB-1 mutant and wild-type sorghum after low red light, far-red light, and defoliation treatments, and found that shading, PhyB, and defoliation signaling pathways inhibited axillary bud growth in sorghum. Sun et al. [26] found that GmmiR156b (MicroRNA156) is a key gene regulating the branch and ideotype of soybean. Overexpression of GmmiR156b can produce soybean plants that are tall, multi-branched, and high-yielding, producing one of the ideal plant types of soybeans. Studies have shown that GmMAX4 and GmMAX2, the critical genes for synthesizing strigolactones (SLs), are downstream of GmPhyB, which is related to the perception of the shade signal. Thus, when the shade signal appears, the expression of the phytochrome gene is first changed. Then, a series of downstream genes are up-regulated or down-regulated [27]. Ge et al. [28] proved that shoot PhyB triggers shoot-derived mobile elongated hypocotyl5 (HY5) protein accumulation in roots. And HY5 further positively regulates the transcription of SL synthetic genes, thus forming a shoot-PhyB-dependent systemic signaling pathway that regulates the synthesis and accumulation of SLs in roots. Therefore, the relationship between SL and plant branching or tillering is of great concern, especially under shade conditions.
SL is a generic term for natural strigolactone and its synthetic analogs, which is a sesquiterpene compound composed of a tetracyclic skeleton structure [29]. SL is a novel plant hormone, so the exact pathway through which SL is synthesized in plants is not clear [30]. However, genetic analyses of several plant species suggest that the production of retinoids are due to the cleavage of carotene products [31,32,33]. C40 carotenoids are synthesized by the methylerythritol phosphate pathway (MEP pathway) in plant cell plastids. After the action of carotenoid cleavage dioxygenase 7 (CCD7, MAX3/RMS5/HTD1/D17) [33,34,35], carotenoid cleavage dioxygenase 8 (CCD8, MAX4/RMS1/DAD1/D10) [36,37,38], cytochrome P450 monooxygenase (CytP450, MAX1) [39], and other enzymes, C40 carotenoids synthesize the first active product 5-deoxystrigol [40] and then synthesize other SL compounds via other pathways, such as sorgolactone, alectrol, and orobanchol [41] (Figure 1). Studies have shown that SL inhibits the growth of the branch and lateral buds in plants. Fan [42] applied the synthetic analog germination releaser 24 (GR24) solution of SL to the axils of tobacco plants and found that SL inhibits the germination, elongation, and fresh weight of tobacco axillary buds. Treatment of 6-phe-noxy-1-phenyl-2-(1H-1,2,4-triazol-1-yl) hexan-1-one (TIS108), a SL-biosynthesis inhibitor, increases the number of branches and represses root hair elongation. This phenotype is also observed in SL-deficient mutants and the co-application of GR24 recovers the TIS108-induced phenotype to Arabidopsis wild-type [43]. In addition, SL controls the number of branches in plants synergistically with auxin (IAA). In a previous study, Qin [44] found that shading at the seedling stage increased IAA content in the main stem, decreased IAA content in the branch tip, and increased the content of SL, suggesting that shading at the seedling stage aggravates apical dominance, promotes the main stem, and inhibits branch growth. Zhang et al. [45] showed in pea and Arabidopsis that SLs target processes dependent on the canalization of auxin flow, which involves auxin feedback on PIN subcellular distribution, and their results identify a non-transcriptional mechanism of SL action, uncoupling auxin feedback on PIN polarity and trafficking, thereby regulating vascular tissue formation and regeneration.
At present, the effects of SL on the branching growth and development of soybean have been reported, but there are few reports on the effects of SL on the branch growth and development of soybean under the maize–soybean relay intercropping mode [46,47]. In this study, soybean cultivars D16 and N99-6 were selected due to their large differences in branching traits. The branching traits, hormone content, and related gene differences of D16 and N99-6 sprayed with different plant hormones under normal light and shade conditions were compared to elucidate the physiological mechanisms of soybean branching mediated by SL under shade and to further provide a theoretical basis for the cultivation of soybean ideal plant type varieties under the maize–soybean belt compound planting mode.

2. Materials and Methods

2.1. Experimental Site and Planting Material

The experiment was carried out at the Sichuan Agricultural University in Chengdu, Sichuan Province of China. The two soybean cultivars selected for the experiment were ‘D16’ (the main cultivar in southwest China with strong shade tolerance and multi-branching type; Nanchong Academy of Agricultural Sciences, Nanchong, China) and ‘N99-6’ (the less-branching type cultivar; Nanjing Agricultural University, Nanjing, China).

2.2. Treatments and Experimental Details

The experiment was carried out in two stages. The first stage was conducted from June 2018 to November 2018 at Qingpuyuan Experimental Base (30°970′ N, 103°810′ E; 647 m elevation) of Sichuan Agricultural University in Wenjiang District, Chengdu. In the experiment, two light environments were set by using shading nets with different light transmission rates: normal light C0 (350 μmol m2/s, red light: far-red light = 1.2) and shady light C1 (simulated corn and soybean relay intercropping light environment, photosynthetic active radiation (PAR) was 40% of C0, R:FR = 0.6). The light duration varies with the sunshine duration, and the light intensity changes are shown in Figure 2. Potted plants were placed in the field with three replicates per treatment and 30 flowerpots for each replicate. The shading treatment started from seed germination and ended at the full flowering stage (R2 stage, Figure S1), and harvesting was carried out at maturity.
The second stage was conducted from June 2019 to November 2019 at the Modern Agriculture Research Base (30°330′ N, 103°390′ E) of Sichuan Agricultural University in Chongzhou city, Chengdu. The experiment set-up two light environments (see the first stage for specific methods), normal light and shade treatment, and set five plant hormone treatments—D0 (no plant hormone, the control with water), D1 (10 mmol/L of IAA), D2 (10 mmol/L of N-1-naphthylphthalamic acid, NPA), D3 (40 mmol/L of GR24), and D4 (40 mmol/L of TIS108). At the V3 stage, hormone solution was sprayed on the shoot tip growth points and leaf buds of soybean, and the spraying time was from 17:30 to 18:30 in the evening. The droplets were small and uniform during spraying, and the dosage was based on the lower drops of the liquid at the spraying site. A completely randomized block design was used, with 3 replicates for each treatment of 5 plants.

2.3. Morphological Measurements

Effective branches and branch pod numbers were determined at full maturity stage R8 (seed moisture content < 30%). The branch length and axillary bud number were determined from 28 to 68 days after sowing. The branching incidence rate was calculated as the amount of branches/number of axillary buds × 100% [48,49,50]. Each treatment was performed with ten replicates.

2.4. Measurement of Hormone Levels

High-performance liquid chromatography was used to quantify the contents of IAA and SLs in 0.50 g of fresh collected terminal buds and axillary buds growing to 1.00–2.00 cm, respectively. Samples consisted of three biological replicates each comprising three technical replicates.
SL content: The samples were ground with liquid nitrogen and placed in a 50 mL centrifuge tube; 10 mL of pure water was added and internal standard GR24 (100 μg/L) was added; and the samples were immersed for 15 min, during which they were shaken 1–2 times. After adding 25 mL of pure acetonitrile and vertexing for 30 s, the mixture was placed on a shaker for 1 h (4 °C, 200 rpm). An amount of 7.5 g of NaCl was added, and vortexed and shaken for 30 s, and the supernatant was removed through centrifugation (3000× g, 15 min) after soaking for ten minutes. The supernatant was passed through the MAX SPE column (pre-activated with 2 mL of acetonitrile), the loading effluent was collected, and the SLs adsorbed on the SPE column were eluted with 2 mL of acetonitrile desorption solution. The loading effluent was combined with the desorption solution, dried under nitrogen gas at 4 °C, and dissolved in 100 μL of methanol/water (3/7 v/v) solution before analysis. Chromatographic conditions: Waters BEH C18 column (100 × 2.0 mm, 1.7 μm); mobile phase A of 0.1% formic acid aqueous solution and mobile phase B of 0.1% formic acid methanol solution. The column temperature was 40 °C and the injection volume was 30 μL. MS conditions: electrospray ionization source (ESI) and positive ion multiple reaction monitoring (MRM) mode. The temperature of the desolvation tube was 250 °C, the temperature of the heating module was 400 °C, the flow rate of the atomization gas was 3 L/min, and the flow rate of the dryer was 15 L/min. The mobile phase and gradient elution conditions are shown in Supplementary Table S1, and the relevant MS parameters of SLs and synthetic analogs are shown in Supplementary Table S2.
IAA content: After grinding the sample with liquid nitrogen to powder, it was transferred into a 10 mL centrifuge tube and 6 mL of pre-cooled acetonitrile was added. It was left in the dark at 4 °C for 12 h and centrifuged at 10,000 rpm at 4 °C for 20 min, and the supernatant was collected. The residue was repeatedly extracted by adding 4 mL of acetonitrile, and the two extracts were combined. It was concentrated under reduced pressure at 40 °C until the solvent was completely dried; 2 mL of chloroform and 0.4 mol/L of phosphate buffer were added; it was shaken and mixed to remove the pigment; and this process was repeated three times. An amount of 0.1 g of polyethylene pirolidone was added and shaken at 28 °C for 30 min (200 rpm), and the resulting clear solution was concentrated at 40 °C under reduced pressure until the solvent was completely dried. It was dissolved in 1 mL of mobile phase and stored in the dark, and then passed through a 0.2 μm filter membrane before loading. The mobile phase was methanol: acetonitrile:0.6% acetic acid (50:45:5, v/v), the column was a Smmetry C18 (150 mm × 4.6 mm, 5 μm), the column temperature was 25 °C, the mobile phase flow rate was 0.6 mL·min−1, and the detection wavelength was 254 nm. The IAA components in the sample were determined based on the retention time of each component in the standard sample, and the IAA content was calculated based on the peak area.

2.5. Real-Time Quantitative PCR

The extraction of total RNAs and the synthesis of cDNAs were conducted according to the methodology described by Wen [51]. The quantitative real-time PCR (qPCR) was checked using gene-specific primers to examine transcript levels of shade-inducible gene GmPIL1 [52], phytochrome genes GmPhyA [53] and GmPhyB [53] in apical leaves and lateral leaves, SL biosynthesis genes GmMAX3 [27] and GmMAX4 [27], SL signal transduction gene GmMAX2 [27], and indole acetic acid transporter gene GmPIN1 [54] in the nodes and axillary buds. Primer sequences are presented in Supplementary Table S3. GmACTIN1 was used as an internal reference gene for qPCR that was run on a Quant Studio 6 Flex real-time PCR System (Thermo Fisher Scientific, Waltham, MA, USA). Real-time detection was performed using VazymeTM AceQ qPCR SYBR Green Master mix (Vazyme Biotech Co., Nanjing, China). The data were analyzed and calculated using the 2−ΔΔCt method [55].

2.6. Statistical Analysis

Microsoft Excel 2019 (Microsoft Corporation, Redmond, WA, USA) was used for data collection and SPSS version 20.0 (SPSS Inc., Chicago, IL, USA) was used for statistical analysis. The data are expressed as average values ± standard error (SE). Data were analyzed through Student’s t-test and analysis of variance (ANOVA).

3. Results

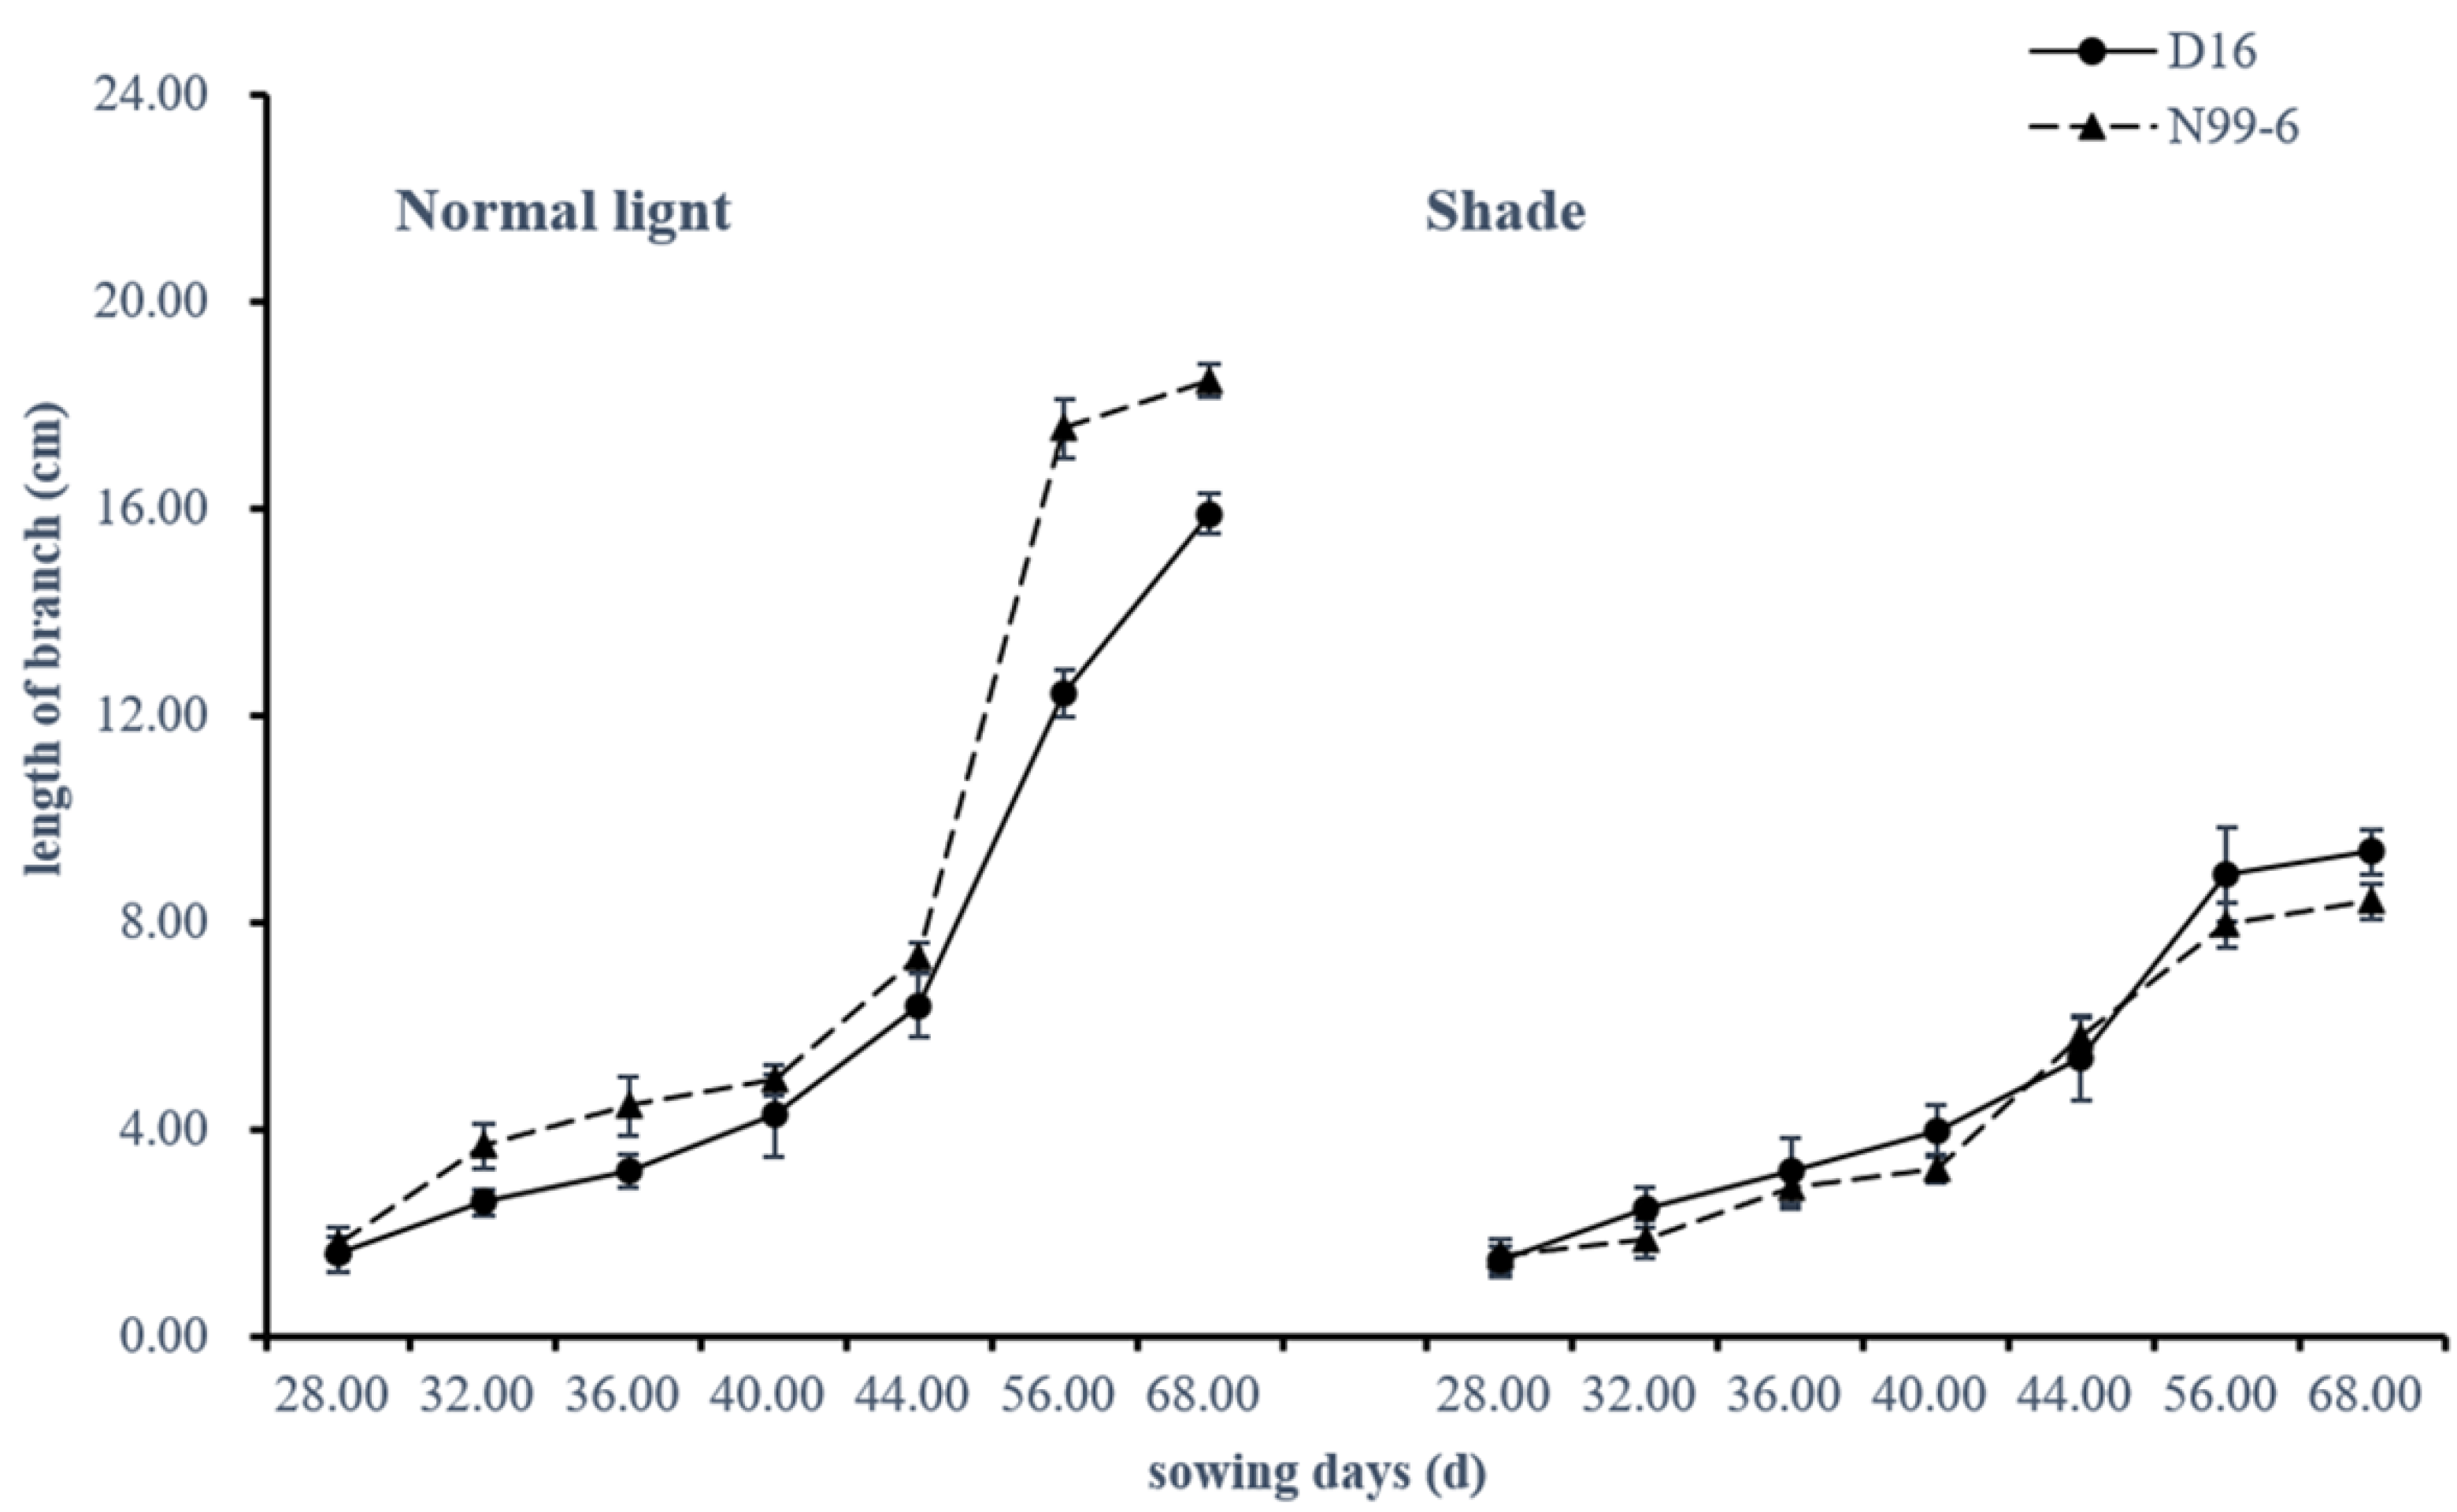
3.1. Shading Treatment Slowed the Branching Development of Soybean, but There Were Significant Differences among Varieties

The branch lengths of D16 and N99-6 varieties were continuously examined under normal light and shade from seeding 28 to 68 days (Figure 3). Compared with normal light treatment, the branch length of both soybean varieties was significantly reduced under the shade treatment and D16 was less affected by shading. This meant that the branch length of N99-6 was larger than that of D16 at all stages under normal light, but was opposite under shade during the experiment except at about the 44th day.
The axillary buds began to differentiate into branches between 28 and 36 days after sowing. The branching growth rate was about 0.30 cm/d between 28 and 44 days after sowing. Noticeably, during the 44–56 days, the daily branch length increment of both cultivars significantly increased under normal light, with N99-6 reaching 0.85 cm/d and D16 also reaching 0.5 cm/d. There was no significant change under shade. At 56–68 days after sowing, the daily branch growth of both cultivars under both light conditions began to slow down compared with the previous 12 days, but the growth rate of D16 was higher than that of N99-6.
The branch number, branch formation rate, branch length, and branch pod number were examined in both soybean cultivars in the R8 stage of soybean ripening (Table 1). Branching-related characteristics of multi-branching D16 were significantly higher than those of the low-branching N99-6 except for the branch length at normal light treatment. After shading treatment, four branch-related traits of D16 were higher than those of N99-63, two of which were significantly higher, including the branch length of D16 that was 44.43% higher than that of N99-63. Furthermore, the number of branch pods of the two cultivars was affected by shade to the same extent and was reduced by about twice. Following the shading treatment, these results suggested that the soybean plants significantly slowed their branch development and shortened the branch length. However, the varieties were differently affected by the shading.

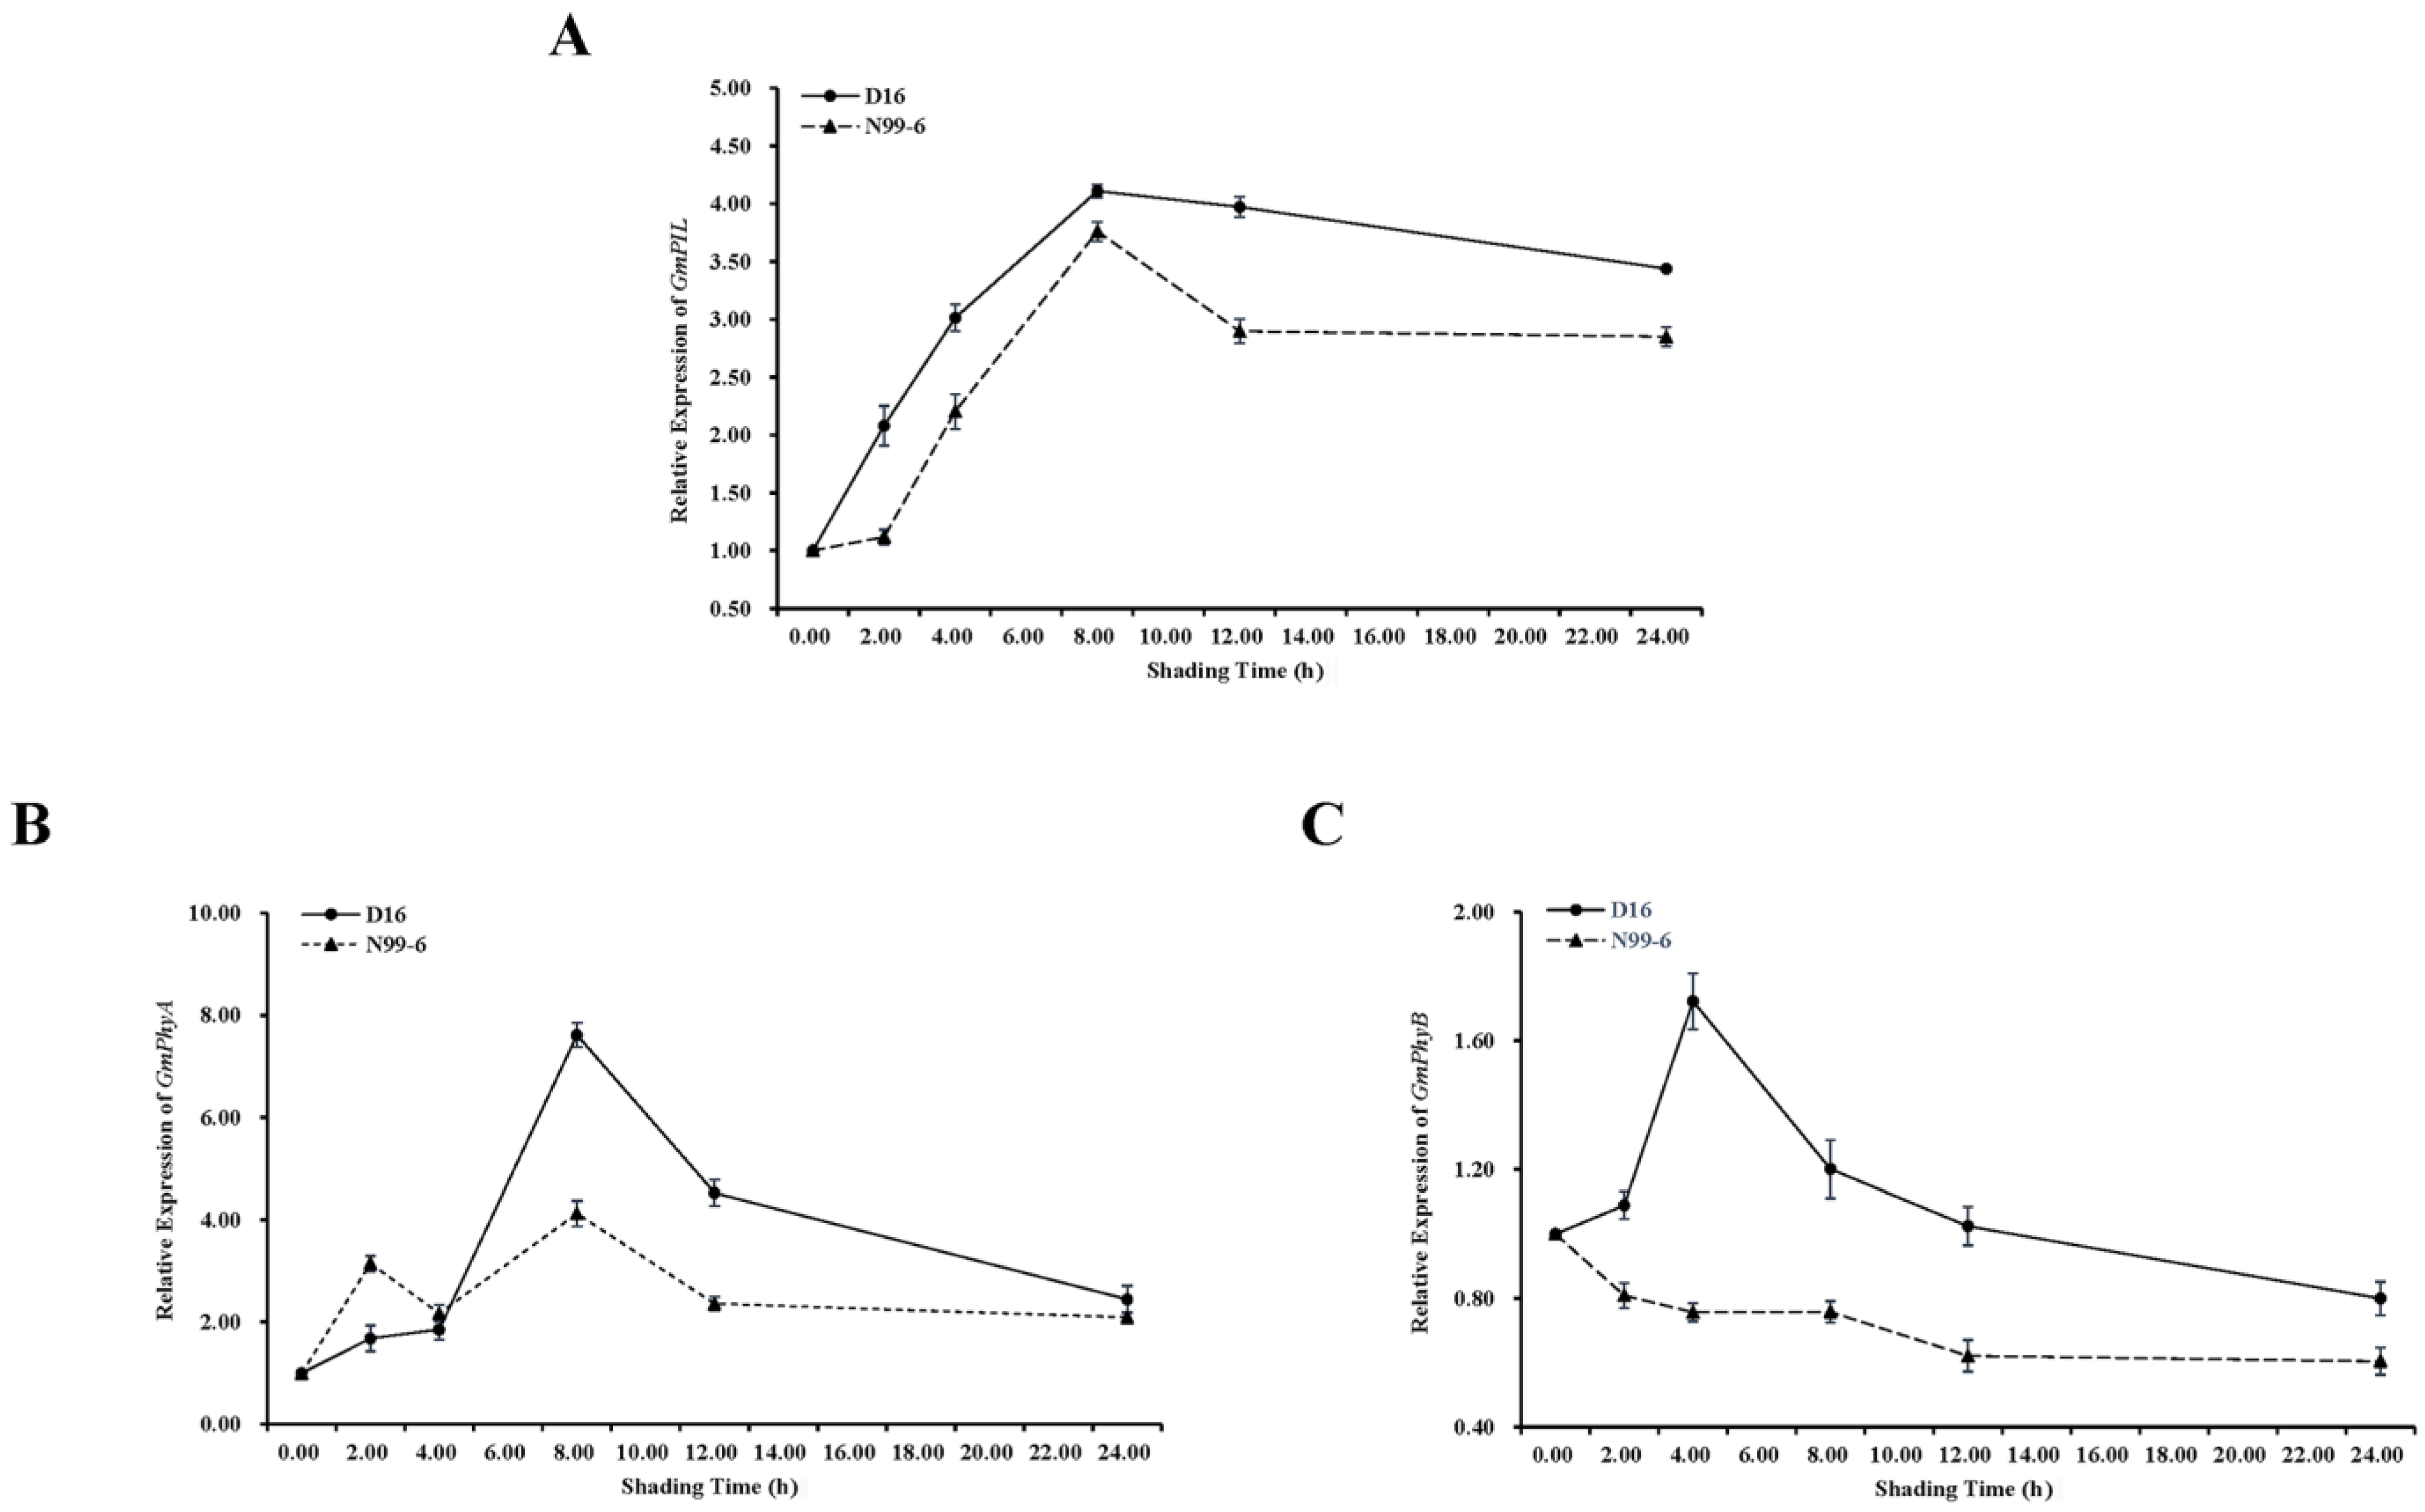
3.2. The Gene Expression Levels of GmPIL, GmPhyA, and GmPhyB Varied between Different Genotypes under Shading Treatment

To further confirm whether the genotype is the cause of the difference in branch development under shading treatment, the expression of shade-inducible gene GmPIL in D16 and N99-6 was measured within 24 h of the shade treatment (Figure 4A). Within 24 h of shading, the GmPIL gene expression trend of the two cultivars was almost the same, but the expression level of D16 was higher than that of N99-6. The expression level of the GmPIL gene in both cultivars was significantly up-regulated within 0–8 h, reaching a peak of about four times higher at eight hours. From the eighth hour of shading, the expression level of the GmPIL gene in both cultivars was down-regulated, but the down-regulation trend varied between the varieties. Specifically, D16 was slowly and steadily down-regulated by 0.68 times from the peak value in the following 16 h, while N99-6 was rapidly down-regulated by 0.87 times in 8–12 h, and there was no significant change in the gene expression level in the following 12 h.
GmPhyA gene expression of the two cultivars showed a similar trend within 24 h of shading, by first increasing, reaching the climax at eight hours, and then decreasing. However, N99-6 showed a minor peak at the second hour of shading (Figure 4B). In addition, GmPhyA gene expression in D16 was twice that of N99-6 at the peak and was slightly higher than in N99-6 after 24 h of shading. Moreover, the variation trend of GmPhyB gene expression in the two cultivars was completely different within 24 h of the shading treatment (Figure 4C). D16 showed an increase at first, peaked at four hours, and then decreased, while N99-6 showed an overall downward trend. Furthermore, D16 was distinctly higher (by about 20%) than N99-6 after 24 h of shade. These results indicated that the expression levels or variation trends of shading-perception-related genes in different genotypes were different after shading treatment, which may be a cause for the differences in shoot development under shading treatment.

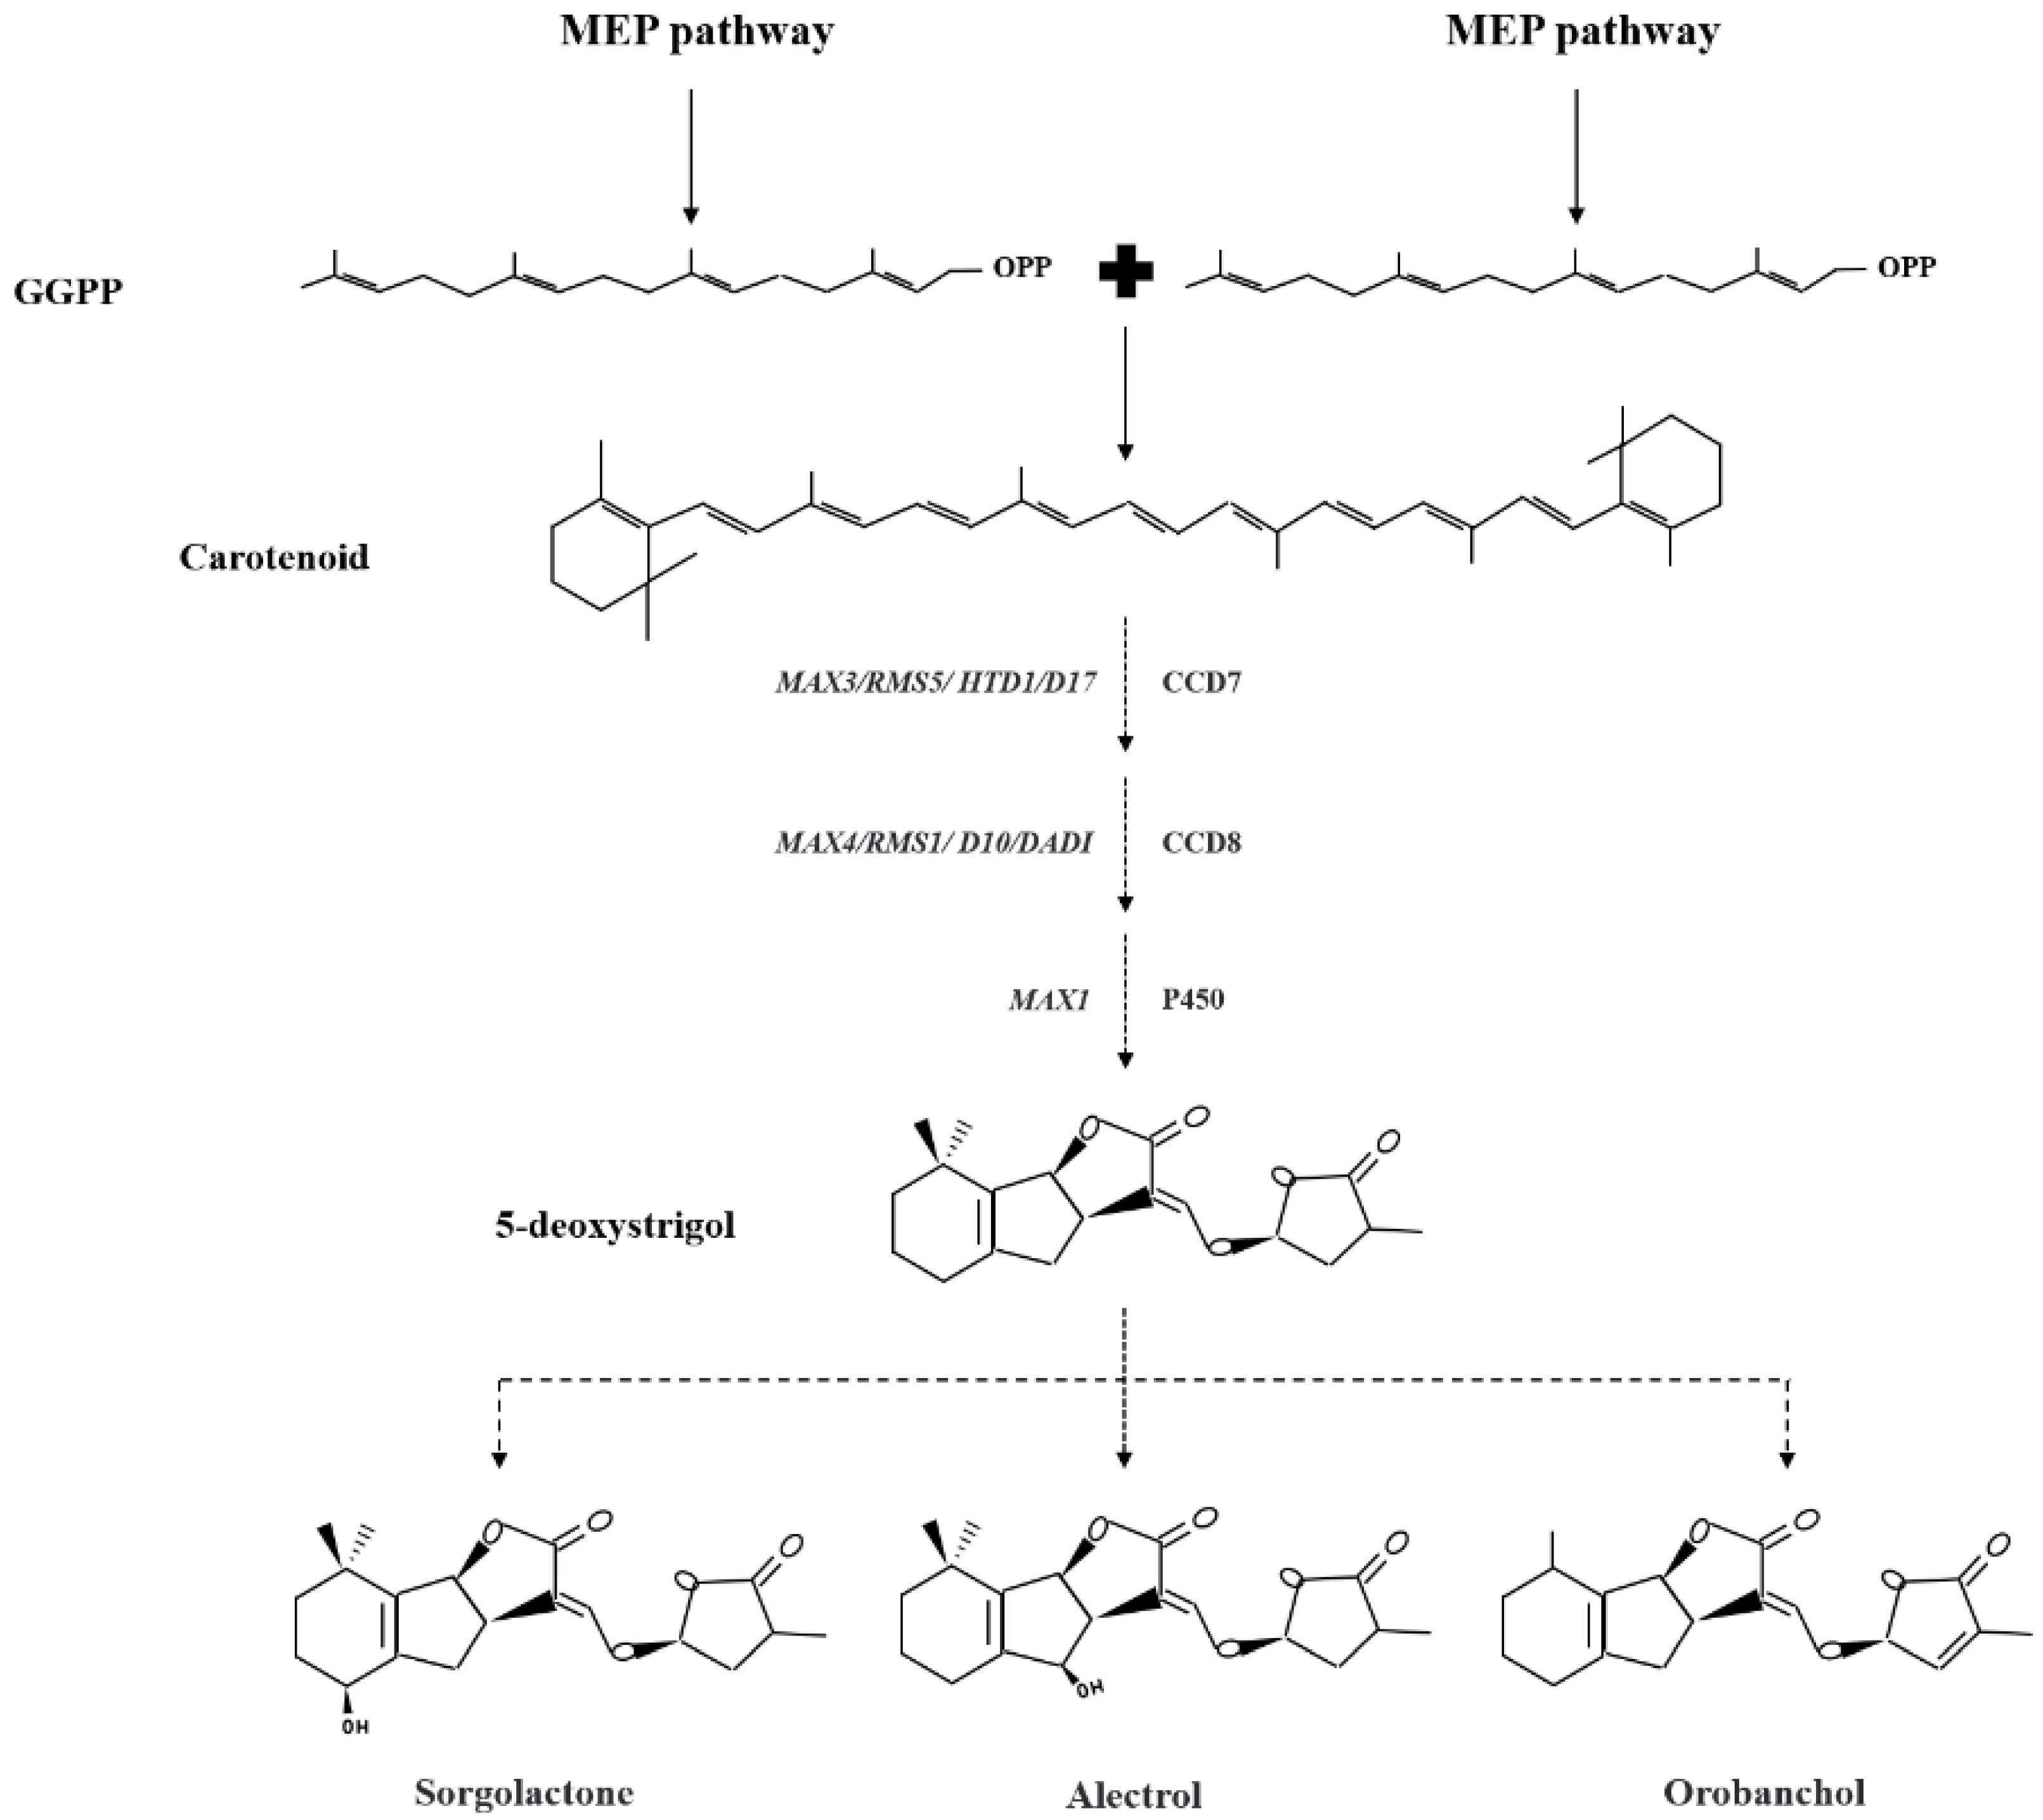
3.3. Shading Treatment Changed the Content and Related Gene Expression of SL in Soybean Axillary Buds

The SL content in the axillary buds of D16 and N99-6 was measured under normal light and shade treatment (Figure 5A). There were no significant differences between the two cultivars under normal light. After shading treatment, the SL content in the axillary buds of both cultivars significantly increased. The SL content was significantly higher in DL than in N99-6, which increased by 38.8 and 16.0%, respectively. This finding suggested that shading treatment could significantly increase the content of SL in soybean axillary buds, but the increase varied between the varieties.
The dynamic relative expression levels of SL-related genes (GmMAX2, GmMAX3, and GmMAX4) were detected in the axillary buds of two soybean varieties within 24 h of shading treatment (Figure 5B–D). The expression levels of the three genes were all up-regulated at 24 h compared with those before treatment, and GmMAX2 and GmMAX3 were significantly up-regulated. The expression level of GmMAX3 in D16 was distinctly higher (about 27.78%) than in N99-6 at 24 h under shade treatment. The expression levels of GmMAX2 and GmMAX4 in D16 were higher than in N99-6 within 0–10 h and 0–22 h, respectively, and then slightly lower than that of N99-6. The significantly increased SL content in soybean axillary buds after shading treatment was caused by the increased expression of SL-related synthesis genes. The change in GmMAX3 gene expression was the reason that the SL content was higher in soybean axillary buds after 24 h of shading treatment in D16.

3.4. IAA, SL, and Their Inhibitors Had Different Effects on the Branching Characteristics of Soybean under Different Light Conditions

Under normal light, the branch number and incidence of D16 were significantly increased when TIS108 was applied compared with the control, but IAA, NPA, and GR-24 had no significant changes (Table 2). In addition, after spraying GR24, the branch length of D16 was almost halved, while after spraying TIS108, the branch length increased significantly, by 39.6% compared with the control. Furthermore, the average branch pod number of D16 significantly decreased after the four plant hormones and inhibitors were applied under natural light. Under the shade treatment, the branch number, incidence, and pod number of D16 significantly increased by applying TIS108 compared with the control. Similarly, the branch number and pod number of D16 also significantly increased by spraying NPA. However, there was no significant change in the branch length of D16 under shade treatment after the four plant hormones and inhibitors were applied.
Under the shade treatment, TIS108 significantly increased the branch number, branch incidence, and branch pod number of N99-6 compared with the control. However, there was no significant change in branch length of N99-6 after spraying two plant hormones and two inhibitors (Table 3). In addition, spraying NPA or TIS108 under shade treatment significantly increased the branch number and branch pod number of N99-6, and TIS108 encouraged the increase in the branch number. At the same time, GR-24 inhibited the number and incidence of branching. This finding suggested that spraying IAA, NPA, GR-24, or TIS108 had different effects on the branching characteristics of soybean under different light conditions. Meanwhile, different genotypes of soybean had different stress responses to spraying the four hormones. However, regardless of the light condition or variety, strigolactone inhibitor TIS108 significantly increased the number and incidence of soybean branches.

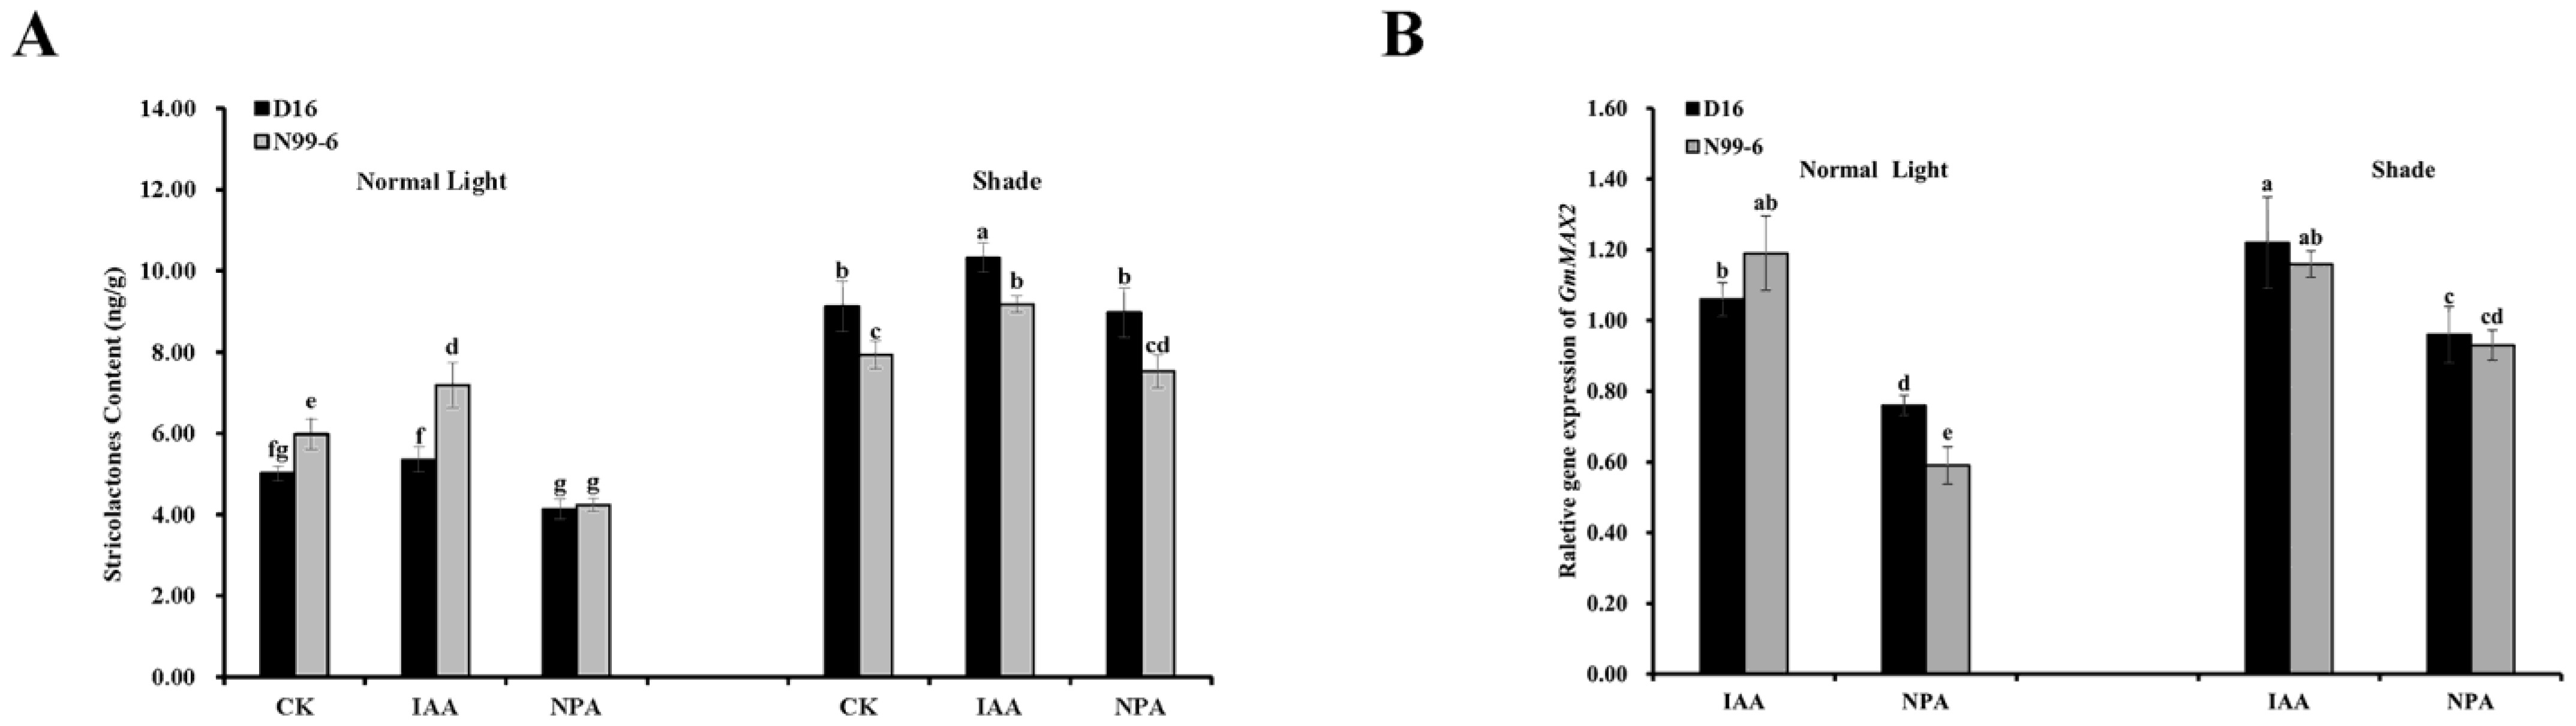
3.5. The Increase in IAA Content Promoted SL Biosynthesis

The SL content was then detected in two soybean varieties after external application of auxin and its inhibitor NPA under normal light and shade conditions (Figure 6A). Under normal light, the SL content in D16 treated with CK and IAA was significantly lower than in N99-6, and when treated with NPA, the SL content was slightly lower. This pattern was opposite under the shade treatment. Under normal light, the SL content in D16 sprayed with auxin and its inhibitor NPA was not significantly different from CK without spraying. However, the SL content in N99-6 sprayed with auxin and its inhibitor NPA was significantly higher and lower than CK without spraying, respectively. Under the shade treatment, the SL content in D16 and N99-6 after auxin spraying was significantly higher than CK without spraying.
The above results indicate that external application of IAA could increase the SL content in soybean axillary buds to a certain extent while NPA had the opposite effect. Shading treatment increased the SL content in soybean axillary buds. The expression of the SL biosynthesis gene in soybean axillary buds responded differently to adverse light conditions and auxin affected the biosynthesis pathway of SL. SL biosynthesis gene GmMAX2 expression levels were examined in the axillary buds of both soybean cultivars after the auxin or inhibitor was applied under shade and normal light (Figure 6B). The expression level of GmMAX2 after auxin spraying was significantly higher than that after NPA application. Under normal light, the expression level of GmMAX2 in D16 sprayed with auxin inhibitor NPA was significantly higher than that of N99-6. However, after shading treatment, there were no significant differences in the expression of GmMAX2 between the two cultivars under different treatments. These results further indicated that the increase in auxin content also promoted the synthesis of SL.

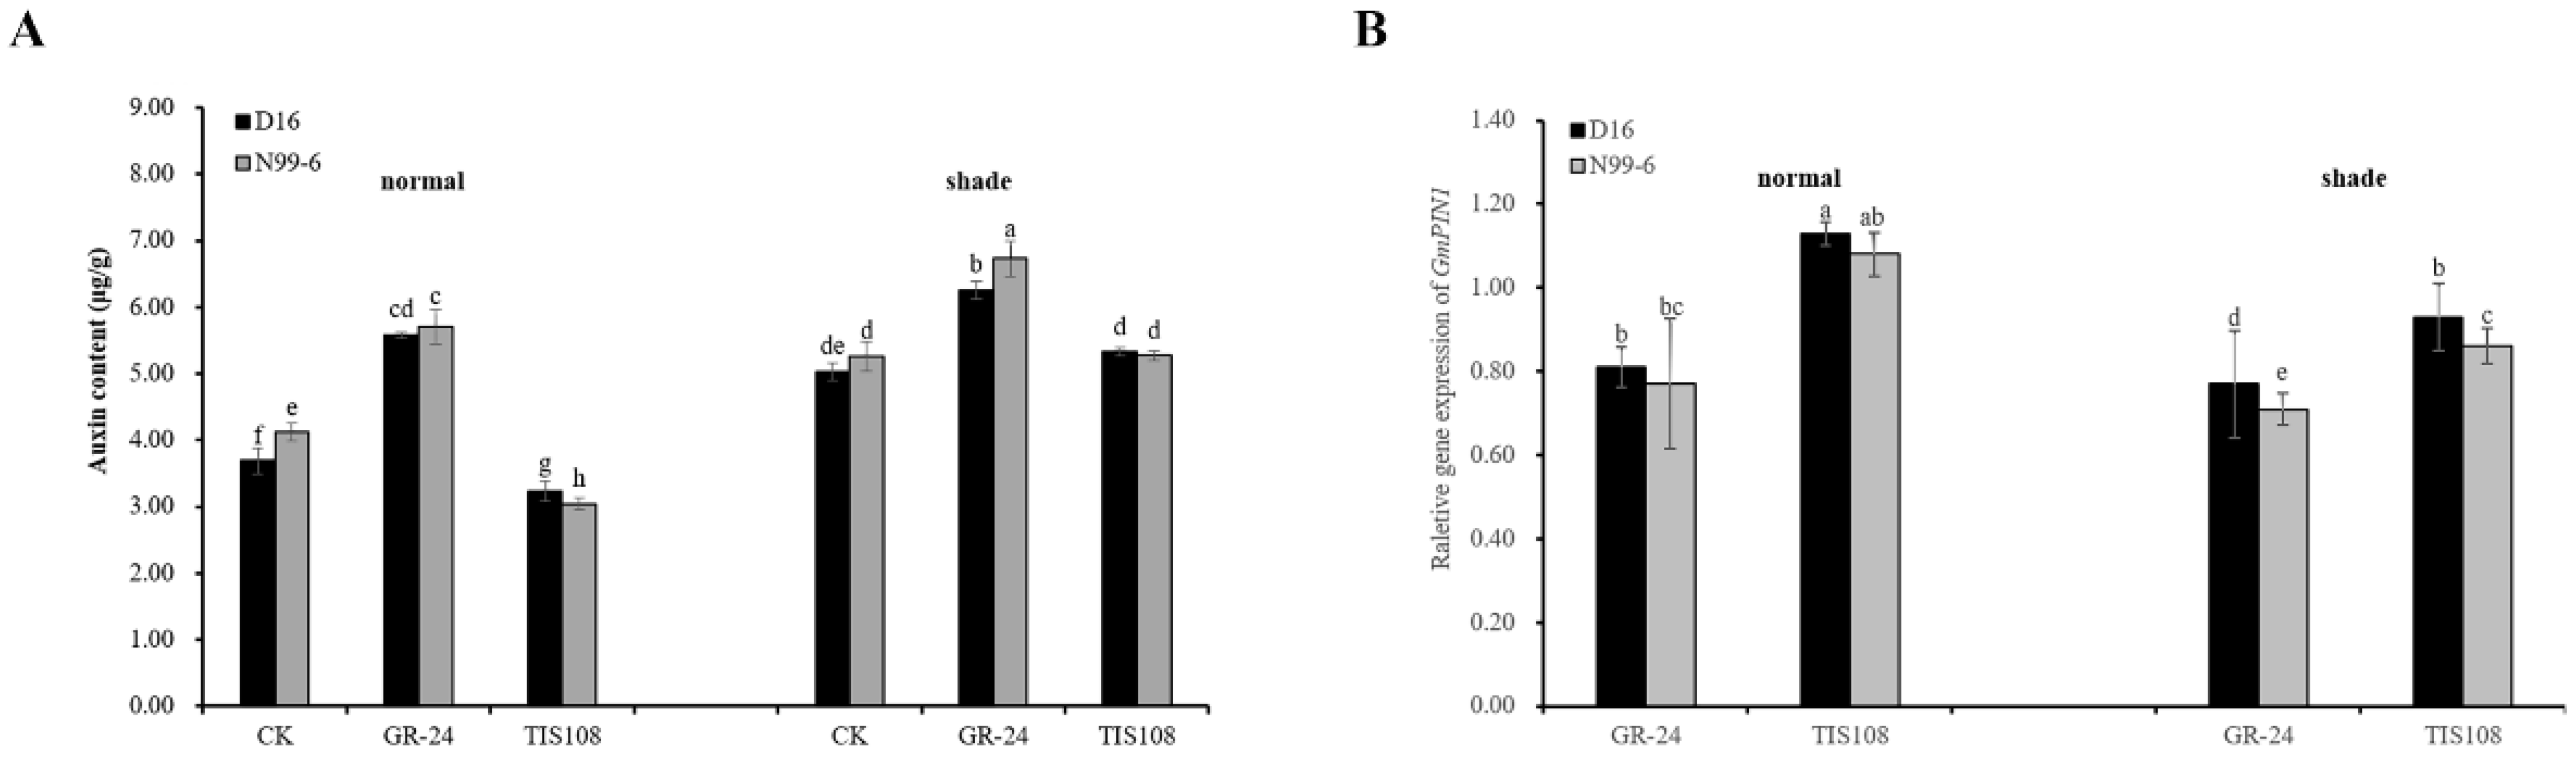
3.6. The Increase in SL Content Promoted IAA Biosynthesis
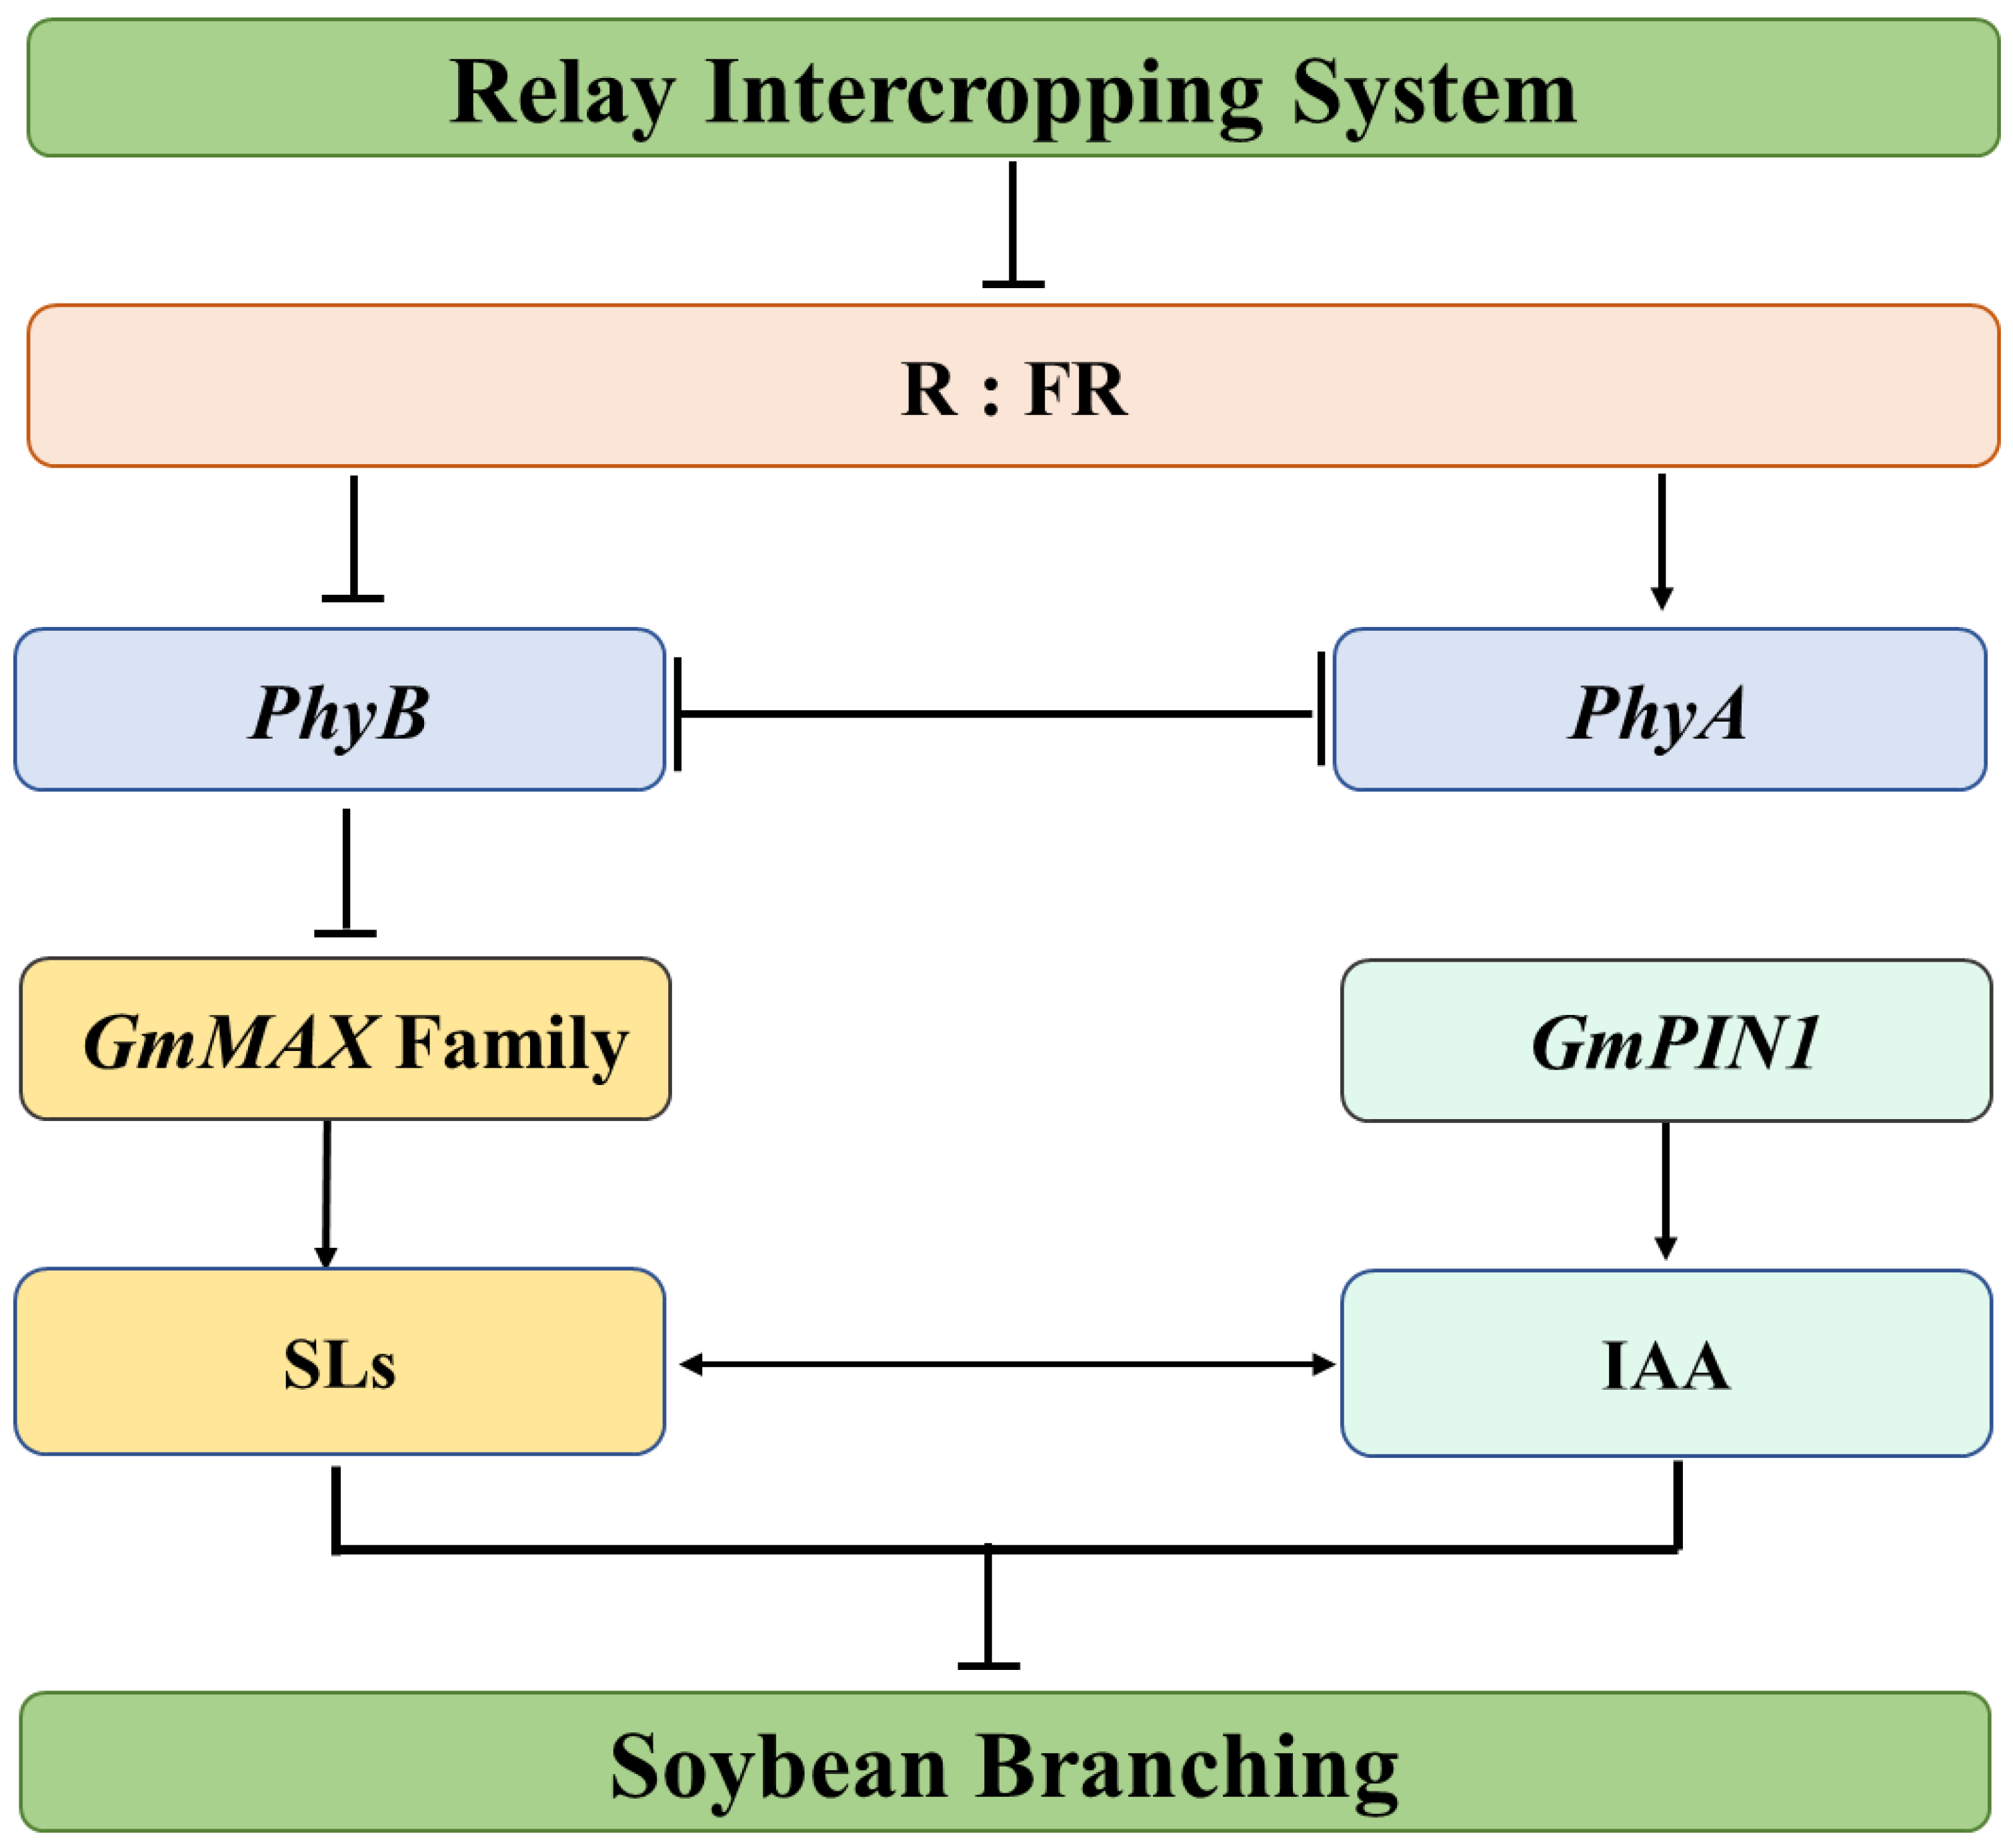
To further explore the relationship between IAA and SL, the SL analog GR-24 and its inhibitor TIS108 were applied to soybean under normal light and shade to detect auxin content in soybean axillary buds (Figure 7A). The auxin content in D16 treated with CK and GR-24 or with TIS108 was significantly lower or higher than in N99-6, respectively. Under normal light, the auxin content of soybean axillary buds sprayed with GR-24 or TIS108 was significantly higher or lower than CK treatment without a growth regulator, respectively. Under the shading treatment, the auxin content of soybean axillary buds sprayed with GR-24 was significantly higher than with CK, but when sprayed with TIS108, there was no significant difference from CK.
To characterize the effect of SL on IAA gene level, the expression of soybean axillary bud IAA transporter gene GmPIN1 sprayed with GR-24 or TIS108 was determined under normal light and shade treatment (Figure 7B). The expression of GmPIN1 after spraying GR-24 was lower than that after spraying TIS108. There was no significant effect on the expression of GmPIN1 between the two varieties after spraying different plant growth regulators under normal light. However, the expression of the GmPIN1 gene in D16 was significantly higher than that in N99-6 in a shaded environment. GmPIN1 gene expression was significantly different under the shading treatment.

4. Discussion

The process of branching development plays an essential role in the life cycle of higher plants. The branching development of plants is not only determined by genes but can also be influenced by biotic and abiotic factors [56]. In this study, shading had some effects on the branching development of soybean genotypes. The branching development of the two soybean varieties under shading was significantly reduced and the branching development period was shortened compared with the control group under normal light. The number and incidence of branching were also affected. Such phenotypic characteristics are caused due to the lack of photosynthetic products under shade conditions. However, plants can adjust their growth processes in the face of adversity to produce progeny more quickly, ensuring the continuation of the species, a strategy generated in the evolution of plants [57]. In addition, branching length can somewhat determine the branch yield, since branches that are too short will produce insufficient numbers of branching pod sites [58]. The branching length of D16 did not significantly change after shading, while it was significantly shortened in N99-6. Furthermore, the reduction in the branching pod number in D16 was lower than in N99-6. Considering the foregoing, such characteristics of pod setting and branching may be some of the reasons why D16 was widely used in relay intercropping production.
SL plays a critical role in the branching development of plants [59] and can inhibit the development of lateral branches [60]. Beveridge’s [61] results showed that SL is a signaling substance that inhibits the branching of plants and can move over a long distance. In addition, previous studies found that a shaded environment can promote SL synthesis in Arabidopsis thaliana [62]. In this study, GmPIL and GmPhyA genes related to shading signal perception were significantly up-regulated after shading treatment. Among these, the GmPIL gene in D16 was up-regulated more rapidly than in N99-6. However, the relative expression of PhyB genes in N99-6 increased first and then decreased, while this expression in D16 decreased. Furthermore, the expression of genes related to SL synthesis and signal transduction was up-regulated within 24 h of shading. Although the gene expression levels of the two soybean varieties showed different trends, GmMAX2 and GmMAX4 levels in D16 were significantly higher than in N99-6 in the first few hours. However, in the following period, these genes in D16 were down-regulated again and the expression levels of GmMAX2- and GMMAX4-related genes were almost lower than in N99-6 after 24 h of treatment. The reason for the above differences is that D16 responded quickly to the shading signal. Down-regulation of the PhyB gene led to the down-regulation of downstream GmMAX4 and GmMAX2, while N99-6 displayed the up-regulation of the PhyB gene first in a short period. However, after the transient up-regulation of GmMAX4 and GmMAX2 in D16, the expression levels were significantly down-regulated in a short period. Finally, the two genes in D16 were lower than in N99-6, but the expression level of GmMAX3 in D16 was significantly higher than that in N99-6. However, because D16 is a multi-branched variety, even with increased SL content under shade, the branch length and number were still more than N99-6. Moreover, the branching-related phenotypes of both soybean cultivars improved after TIS108 application, with little differences between the two cultivars, suggesting that SL inhibited the branching of soybean under the shade treatment.
Previous studies on Arabidopsis, cotton, and other plants have shown that the regulation of SL on branching development involves a very complex process [63]. SL may prevent auxin from transporting out of axillary buds, leading to a large accumulation of auxin in axillary buds [64] and indirectly inhibiting auxin in axillary buds [65]. At the same time, the increase in auxin content also promotes SL synthesis [66]. The application of SL inhibitor TIS108 and auxin inhibitor NPA improved the branching phenotype of soybean under the shade to some extent. However, after the application of the natural auxin IAA and the SL analog GR24, the branching and development of both cultivars were inhibited but not significantly. This is similar to the results published by Leyser and Day [67] that directly applying auxin to axillary buds did not effectively prevent bud growth. Furthermore, the effect of applying SL analog GR24 may be related to the method of application. SLs are mainly synthesized in the roots of plants [30]; therefore, in future experiments, SLs can be applied to the root to ensure its optimal effect. At the same time, this may be because auxin and SLs indirectly participate in the branching process via CK regulation, which acts directly on axillary buds [68]. In addition, the results of this study showed that auxin promoted GnMAX2 expression, a signal transduction gene of SLs, and promoted the increase in SL content. However, SLs inhibited the expression of soybean-auxin-polar-transporter-related gene GmPIN1; studies have shown that the accumulation of PIN vectors in Arabidopsis max multi-branch mutants was significantly higher than that of the wild type; and the auxin transport competition between axillary buds and terminal buds and between adjacent axillary buds was significantly reduced [69], resulting in auxin accumulation in axillary buds. In summary, the adverse effects of shading on soybean branching development may be as illustrated in Figure 8. On the one hand, in the relay intercropping mode, the reduction in the R:FR ratio resulted in decreased expression of the PhyB gene and increased expression of the PhyA gene. Simultaneously, the decrease in PhyB led to elevated expression of the GmMAX family genes, resulting in increased SL content in the shaded environment. On the other hand, SLs and IAA mutually promoted each other, leading to the inhibition of soybean shoot morphogenesis. The interaction between the two plant hormones determined the differentiation and development of branches.

5. Conclusions

The interaction between auxin and strigolactone under shade had a negative effect on the branch development of soybean. This study demonstrated the down-regulation of the phytochrome-related gene PhyB in soybean under shade environments, and at the same time, the shading stress promoted the up-regulation of GmMAX family genes, which resulted in the increase in SL content. Meanwhile, the up-regulation of phytochrome-related gene PhyA inhibited auxin synthesis and down-regulated GmPIH1 gene expression, affecting the auxin response (Figure S2) and thus affecting the development of soybean branching. Generally, studying the physiological and molecular mechanism of soybean under the shade provided a better understanding of the branching development characteristics of two soybean cultivars under shade conditions. This study lays a theoretical foundation for the breeding of cultivars with relay intercropping and dense planting modes.

Supplementary Materials

The following supporting information can be downloaded at https://www.mdpi.com/article/10.3390/agronomy13092383/s1, Table S1: Mobile phase and gradient elution conditions; Table S2: Relative mass spectrum parameters of SLs and synthetic analogs; Table S3: Genes and primers used for quantitative RT-PCR analysis in this study; Figure S1: D16 and N99-6 mature phenotypes under normal light and shade. The scale is 10 cm; Figure S2: Correlation analysis on PhyA, PhyB, GmPIL, Strigolactone, GmMAX2, GmMAX3, GmMAX4, Auxin, and GmPIN1.

Author Contributions

Conceptualization, W.L.; methodology, W.L.; software, M.X.; validation, W.W., C.L. and L.Y.; formal analysis, C.L.; investigation, M.X. and L.Y.; resources, M.X.; data curation, W.W.; writing—original draft preparation, L.H.; writing—review and editing, L.H.; visualization, L.Y.; supervision, W.Y.; project administration, M.X.; funding acquisition, W.L. All authors have read and agreed to the published version of the manuscript.

Funding

This work was supported by the National Natural Science Foundation of China (General Program) (31871570), and the Sichuan Innovation team Project of National Modern Agricultural Industrial Technology system (SC-CXTD-2020-20).

Data Availability Statement

The data presented in this study are available upon request from the corresponding author.

Conflicts of Interest

The authors declare no conflict of interest.

References

  1. Han, Y.M. The microworld behind high yield of soybean. Grain Sci. Technol. Econ. 2020, 45, 14–15. [Google Scholar]
  2. Bai, Y.; Zhai, Y.; Ji, C.; Zhang, T.; Chen, W.; Shen, X.; Hong, J. Environmental sustainability challenges of China’s edible vegetable oil industry: From farm to factory. Resour. Conserv. Recycl. 2021, 170, 105606. [Google Scholar] [CrossRef]
  3. Yang, H.; Zhang, W.; Long, L.I. Intercropping: Feed More People and Build More Sustainable Agroecosystems. Front. Agric. Sci. Eng. 2021, 8, 14. [Google Scholar]
  4. Stomph, T.J.; Dordas, C.; Baranger, A.; Rijk, J.D.; Dong, B.; Evers, J.B.; Gu, C.; Li, L.; Simón, J.C.; Jensen, E.S.; et al. Designing intercrops for high yield, yield stability and efficient use of resources: Are there principles? Adv. Agron. 2019, 160, 1–50. [Google Scholar]
  5. Wu, Y.S.; Gong, W.Z.; Liao, D.P.; Wu, X.L.; Yang, F.; Liu, W.G.; Yong, T.W.; Yang, W.Y. Effects of Shade and Light Recovery on Soybean Cultivars (Lines) and Its Relationship with Yield in Relay Strip Intercropping System. Acta Agron. Sin. 2015, 41, 1740–1747. [Google Scholar] [CrossRef]
  6. Awal, M.A.; Koshi, H.; Ikeda, T. Radiation interception and use by maize/peanut intercrop canopy. Agric. For. Meteorol. 2006, 139, 74–83. [Google Scholar] [CrossRef]
  7. Li, C.; Hoffland, E.; Kuijper, T.W.M.; Yu, Y.; Li, H.; Zhang, C.; Zhang, F.; van der Werf, W. Yield gain, complementary and competitive dominance in intercropping in China: A meta-analysis of drivers of yield gain using additive partitioning. Eur. J. Agron. 2020, 113, 125987. [Google Scholar] [CrossRef]
  8. Liu, W.G.; Hussain, S.; Liu, T.; Zou, J.L.; Ren, M.L.; Zhou, T.; Liu, J.; Yang, F.; Yang, W.Y. Shade stress decreases stem strength of soybean through restraining lignin biosynthesis. J. Integr. Agric. 2019, 18, 43–53. [Google Scholar] [CrossRef]
  9. Raza, M.A.; Feng, L.Y.; Iqbal, N.; Ahmed, M.; Chen, Y.K.; Khalid, M.H.B.; Mohi Ud Din, A.; Khan, A.; Ijaz, W.; Hussain, A.; et al. Growth and development of soybean under changing light environments in relay intercropping system. PeerJ 2019, 7, e7262. [Google Scholar] [CrossRef]
  10. Cheng, Y.J.; Chen, J.X.; Wang, Z.L.; Fan, Y.F.; Chen, S.Y.; Li, Z.L.; Liu, Q.L.; Li, Z.C.; Yang, F.; Yang, W.Y. Effects of light intensity and light quality on morphology and photosynthetic characteristics of soybean seedlings. Chin. J. Agric. Sci. 2018, 51, 2655–2663. [Google Scholar]
  11. Pierik, R.; Ballaré, C.L. Control of Plant Growth and Defense by Photoreceptors: From Mechanisms to Opportunities in Agriculture. Mol. Plant 2021, 14, 61–76. [Google Scholar] [CrossRef] [PubMed]
  12. Xu, H.; Chen, P.; Tao, Y. Understanding the Shade Tolerance Responses through Hints from Phytochrome A-Mediated Negative Feedback Regulation in Shade Avoiding Plants. Front. Plant Sci. 2021, 12, 813092. [Google Scholar] [CrossRef] [PubMed]
  13. Park, E.; Park, J.; Kim, J.; Nagatani, A.; Lagarias, J.C.; Choi, G. Phytochrome B inhibits binding of phytochrome-interacting factors to their target promoters. Plant J. Cell Mol. Biol. 2012, 72, 537–546. [Google Scholar] [CrossRef]
  14. Reed, J.W. Mutations in the gene for the red far-red light receptor phytochrome-B alter cell elongation and physiological-responses throughout Arabidopsis development. Plant Cell 1993, 5, 147–157. [Google Scholar] [PubMed]
  15. Yu, X.; Dong, J.; Deng, Z.; Jiang, Y.; Wu, C.; Qin, X.; Terzaghi, W.; Chen, H.; Dai, M.; Deng, X.W. Arabidopsis PP6 phosphatases dephosphorylate PIF proteins to repress photomorphogenesis. Proc. Natl. Acad. Sci. USA 2019, 116, 20218–20225. [Google Scholar] [CrossRef]
  16. Fankhauser, C.; Batschauer, A. Shadow on the Plant: A Strategy to Exit. Cell 2016, 164, 15. [Google Scholar] [CrossRef]
  17. Shafiq, I.; Hussain, S.; Raza, M.A.; Iqbal, N.; Asghar, M.A.; Raza, A.; Fan, Y.; Mumtaz, M.; Shoaib, M.H.; Ansar, M.; et al. Crop photosynthetic response to light quality and light intensity. J. Integr. Agric. 2021, 20, 4–23. [Google Scholar] [CrossRef]
  18. Feng, L.; Raza, M.A.; Li, Z.; Chen, Y.; Khalid, M.H.B.; Du, J.; Liu, W.; Wu, X.; Song, C.; Yu, L.; et al. The Influence of Light Intensity and Leaf Movement on Photosynthesis Characteristics and Carbon Balance of Soybean. Front. Plant Sci. 2019, 9, 1952. [Google Scholar] [CrossRef]
  19. Leeflang, L. Are stoloniferous plants able to avoid neighbours in response to low R: FR ratios in reflected light? Plant Ecol. 1999, 141, 59–65. [Google Scholar] [CrossRef]
  20. Wang, X.; Gao, X.; Liu, Y.; Fan, S.; Ma, Q. Progress of Research on the Regulatory Pathway of the Plant Shade-Avoidance Syndrome. Front. Plant Sci. 2020, 11, 439. [Google Scholar] [CrossRef]
  21. Liu, Y.; Jafari, F.; Wang, H. Integration of light and hormone signaling pathways in the regulation of plant shade avoidance syndrome. aBIOTECH 2021, 2, 131–145. [Google Scholar] [CrossRef] [PubMed]
  22. Xie, Y.; Liu, Y.; Ma, M.; Zhou, Q.; Zhao, Y.; Zhao, B.; Wang, B.; Wei, H.; Wang, H. Arabidopsis FHY3 and FAR1 integrate light and strigolactone signaling to regulate branching. Nat. Commun. 2020, 11, 1955. [Google Scholar] [CrossRef] [PubMed]
  23. Pedersen, P.; Lauer, J.G. Soybean growth and development in various management systems and planting dates. Crop. Sci. 2004, 44, 508–515. [Google Scholar] [CrossRef]
  24. González-Grandío, E.; Poza-Carrión, C.; Sorzano, C.O.; Cubas, P. BRANCHED1 promotes axillary bud dormancy in response to shade in Arabidopsis. Plant Cell 2013, 5, 834–850. [Google Scholar] [CrossRef]
  25. Kebrom, T.H.; Brutnell, T.P.; Finlayson, S.A. Suppression of sorghum axillary bud outgrowth by shade, PhyB and defoliation signalling pathways. Plant Cell Environ. 2010, 33, 48–58. [Google Scholar] [CrossRef]
  26. Sun, Z.; Su, C.; Yun, J.; Jiang, Q.; Wang, L.; Wang, Y.; Cao, D.; Zhao, F.; Zhao, Q.; Zhang, M.; et al. Genetic improvement of the shoot architecture and yield in soya bean plants via the manipulation of GmmiR156b. Plant Biotechnol. J. 2019, 17, 50–62. [Google Scholar] [CrossRef]
  27. Haq, B.U.; Ahmad, M.Z.; Rehman, N.U.; Wang, J.; Jian, Z. Functional characterization of soybean strigolactone biosynthesis and signaling genes in Arabidopsis MAX mutants and GmMAX3 in soybean nodulation. BMC Plant Biol. 2017, 17, 259. [Google Scholar] [CrossRef]
  28. Ge, S.; He, L.; Jin, L.; Xia, X.; Li, L.; Ahammed, G.J.; Qi, Z.; Yu, J.; Zhou, Y. Light-dependent activation of HY5 promotes mycorrhizal symbiosis in tomato by systemically regulating strigolactone biosynthesis. N. Phytol. 2022, 233, 1900–1914. [Google Scholar] [CrossRef]
  29. Ruyter-Spira, C.; Al-Babili, S.; van der Krol, S.; Bouwmeester, H. The biology of strigolactones. Trends Plant Sci. 2013, 18, 72–83. [Google Scholar] [CrossRef]
  30. Chen, C.Y.; Zou, J.H.; Zhang, S.Y.; Zhu, L.H. Strigolactone inhibits plant branching and mediates interactions between plants and abietic fungi and parasitic plants. Sci. China Ser. C Life Sci. 2009, 39, 525–533. [Google Scholar]
  31. Harrison, E.H. Carotenoids, β-Apocarotenoids, and Retinoids: The Long and the Short of It. Nutrients 2022, 14, 1411. [Google Scholar] [CrossRef] [PubMed]
  32. Umehara, M.; Hanada, A.; Yoshida, S.; Akiyama, K.; Arite, T.; Takeda-Kamiya, N.; Magome, H.; Kamiya, Y.; Shirasu, K.; Yoneyama, K.; et al. Inhibition of shoot branching by new terpenoid plant hormones. Nature 2008, 455, 195–200. [Google Scholar] [CrossRef]
  33. López-Ráez, J.A.; Charnikhova, T.; Gómez-Roldán, V.; Matusova, R.; Kohlen, W.; De Vos, R.; Verstappen, F.; Puech-Pages, V.; Bécard, G.; Mulder, P.; et al. Tomato strigolactones are derived from carotenoids and their biosynthesis is promoted by phosphate starvation. New Phytol. 2008, 178, 863–874. [Google Scholar] [CrossRef] [PubMed]
  34. Booker, J.; Auldridge, M.; Wills, S.; McCarty, D.; Klee, H.; Leyser, O. MAX3/CCD7 is a carotenoid cleavage dioxygenase required for the synthesis of a novel plant signaling molecule. Curr. Biol. 2004, 14, 1232–1238. [Google Scholar] [CrossRef] [PubMed]
  35. Johnson, X.; Brcich, T.; Dun, E.A.; Goussot, M.; Haurogné, K.; Beveridge, C.A.; Rameau, C. Branching genes are conserved across species. Genes controlling a novel signal in pea are coregulated by other long-distance signals. Plant Physiol. 2006, 142, 1014–1026. [Google Scholar] [CrossRef]
  36. Arite, T.; Iwata, H.; Ohshima, K.; Maekawa, M.; Nakajima, M.; Kojima, M.; Sakakibara, H.; Kyozuka, J. DWARF10, an RMS1/MAX4/DAD1 ortholog, controls lateral bud outgrowth in rice. Plant J. Cell Mol. Biol. 2007, 51, 1019–1029. [Google Scholar] [CrossRef]
  37. Snowden, K.C.; Simkin, A.J.; Janssen, B.J.; Templeton, K.R.; Loucas, H.M.; Simons, J.L.; Karunairetnam, S.; Gleave, A.P.; Clark, D.G.; Klee, H.J. The Decreased apical dominance1/Petunia hybrida Carotenoid Cleavage Dioxygenase8 gene affects branch production and plays a role in leaf senescence, root growth, and flower development. Plant Cell 2005, 17, 746–759. [Google Scholar] [CrossRef]
  38. Sorefan, K.; Booker, J.; Haurogné, K.; Goussot, M.; Bainbridge, K.; Foo, E.; Chatfield, S.; Ward, S.; Beveridge, C.; Rameau, C.; et al. MAX4 and RMS1 are orthologous dioxygenase-like genes that regulate shoot branching in Arabidopsis and pea. Genes Dev. 2003, 17, 1469–1474. [Google Scholar] [CrossRef]
  39. Booker, J.; Sieberer, T.; Wright, W.; Williamson, L.; Willett, B.; Stirnberg, P.; Turnbull, C.; Srinivasan, M.; Goddard, P.; Leyser, O. MAX1 encodes a cytochrome P450 family member that acts downstream of MAX3/4 to produce a carotenoid-derived branch-inhibiting hormone. Dev. Cell 2003, 8, 443–449. [Google Scholar] [CrossRef]
  40. Matusova, R.; Rani, K.; Verstappen, F.W.; Franssen, M.C.; Beale, M.H.; Bouwmeester, H.J. The strigolactone germination stimulants of the plant-parasitic Striga and Orobanche spp. are derived from the carotenoid pathway. Plant Physiol. 2005, 139, 920–934. [Google Scholar] [CrossRef]
  41. Beveridge, C.A.; Weller, J.L.; Singer, S.R.; Hofer, J.M. Axillary meristem development. Budding relationships between networks controlling flowering, branching, and photoperiod responsiveness. Plant Physiol. 2003, 131, 927–934. [Google Scholar] [CrossRef] [PubMed]
  42. Fan, W.W. Effects of Strigolactone on Axillary Bud Dormance and Lateral Branch Growth and Transcriptomic Study of Tobacco. Master’s Thesis, Guizhou University, Guiyang, China, 2021. [Google Scholar]
  43. Ito, S.; Umehara, M.; Hanada, A.; Yamaguchi, S.; Asami, T. Effects of strigolactone-biosynthesis inhibitor TIS108 on Arabidopsis. Plant Signal. Behav. 2013, 8, e24193. [Google Scholar] [CrossRef] [PubMed]
  44. Qin, S.S. Effects of Corn-Soybean Intercropping on Occurrence and Yield of Main Stem and Branch of Soybean. Master’s Thesis, Sichuan Agricultural University, Chengdu, China, 2020. [Google Scholar]
  45. Zhang, J.; Mazur, E.; Balla, J.; Gallei, M.; Kalousek, P.; Medveďová, Z.; Li, Y.; Wang, Y.; Prát, T.; Vasileva, M.; et al. Strigolactones inhibit auxin feedback on PIN-dependent auxin transport canalization. Nat. Commun. 2020, 11, 3508. [Google Scholar] [CrossRef]
  46. Xu, E.; Chai, L.; Zhang, S.; Yu, R.; Zhang, X.; Xu, C.; Hu, Y. Catabolism of strigolactones by a carboxylesterase. Nat. Plants 2021, 7, 1495–1504. [Google Scholar] [CrossRef] [PubMed]
  47. Yao, R.; Ming, Z.; Yan, L.; Li, S.; Wang, F.; Ma, S.; Yu, C.; Yang, M.; Chen, L.; Chen, L.; et al. DWARF14 is a non-canonical hormone receptor for strigolactone. Nature 2006, 536, 469–473. [Google Scholar] [CrossRef] [PubMed]
  48. Zhang, J.; Smith, D.; Liu, W.G.; Chen, X.F.; Yang, W.Y. Effects of shade and drought stress on soybean hormones and yield of main-stem and branch. Afr. J. Biotechnol. 2011, 10, 14392–14398. [Google Scholar]
  49. Yoshihira, T.; Liang, S.; Suzuki, H.; Kitabatake, T.; Shiraiwa, T. Effects of maturity group and stem growth habit on the branching plasticity of soybean cultivars grown at various planting densities. Plant Prod. Sci. 2020, 23, 385–396. [Google Scholar] [CrossRef]
  50. Sayama, T.; Hwang, T.Y.; Yamazaki, H.; Yamaguchi, N.; Komatsu, K.; Takahashi, M.; Suzuki, C.; Miyoshi, T.; Tanaka, Y.; Xia, Z. Mapping and comparison of quantitative trait loci for soybean branching phenotype in two locations. Breed. Sci. 2010, 60, 380–389. [Google Scholar] [CrossRef]
  51. Wen, B.; Zhang, Y.; Hussain, S.; Wang, S.; Liu, W. Slight shading stress at seedling stage does not reduce lignin biosynthesis or affect lodging resistance of soybean stems. Agronomy 2020, 10, 544. [Google Scholar] [CrossRef]
  52. Jiang, H.; Shui, Z.; Xu, L.; Yang, Y.; Li, Y.; Yuan, X.; Shang, J.; Asghar, M.A.; Wu, X.; Yu, L.; et al. Gibberellins modulate shade-induced soybean hypocotyl elongation downstream of the mutual promotion of auxin and brassinosteroids. Plant Physiol. Biochem. 2020, 150, 209–221. [Google Scholar] [CrossRef]
  53. Zhao, F.; Lu, X.G.; Ji, R.H.; Liu, J.; Zhao, T.; Li, H.Y.; Liu, B.; Pei, Y.X. CRISPR/Cas9-engineered mutation to identify the roles of phytochromes in regulating photomorphogenesis and flowering time in soybean. Crop. J. 2022, 10, 1654–1664. [Google Scholar] [CrossRef]
  54. Gao, Z.; Chen, Z.; Cui, Y.; Ke, M.; Xu, H.; Xu, Q.; Chen, J.; Li, Y.; Huang, L.; Zhaoet, H. GmPIN-dependent polar auxin transport is involved in soybean nodule development. Plant Cell 2021, 33, 2981–3003. [Google Scholar] [CrossRef]
  55. Schmittgen, T.; Livak, K. Analyzing real-time PCR data by the comparative C(T) method. Nat. Protoc. 2008, 3, 1101–1108. [Google Scholar] [CrossRef]
  56. Carruthers, K.; Prithiviraj, B.; Fe, Q.; Cloutier, D.; Martin, R.C.; Smith, D.L. Intercropping of corn with soybean, lupin and forages: Silage yield and quality. J. Agron. 2010, 185, 177–185. [Google Scholar] [CrossRef]
  57. Brookes, P.S. Calcium, ATP and ROS: A mitochondrial love-hate triangle. Am. J. Physiol. Cell Physiol. 2004, 287, 817–833. [Google Scholar] [CrossRef] [PubMed]
  58. Gibson, L.R.; Paulsen, G.M. Yield Components of Wheat Grown under High Temperature Stress during Reproductive Growth. Crop. Sci. 1999, 39, 1841–1846. [Google Scholar] [CrossRef]
  59. Yoram, K.; Natalie, R.; Einav, M.G.; Yulia, K.; Smadar, W.; Joseph, H.; Hinanit, K. Strigolactones interact with ethylene and auxin in regulating root-hair elongation in Arabidopsis. J. Exp. Bot. 2011, 62, 2915–2924. [Google Scholar]
  60. Hu, Z.; Yan, H.; Yang, J.; Shinjiro, Y.; Masahiko, M.; Itsuro, T.; Nobuhiro, T.; Junko, K.; Mikio, N. Strigolactones Negatively Regulate Mesocotyl Elongation in Rice during Germination and Growth in Darkness. Plant Cell Physiol. 2010, 51, 1136–1142. [Google Scholar] [CrossRef] [PubMed]
  61. Beveridge, C.A. Long-distance signalling and a mutational analysis of branching in pea. Plant Growth Regul. 2000, 32, 193–203. [Google Scholar] [CrossRef]
  62. Thimann, K.V.; Skoog, F. Studies on the Growth Hormone of Plants: III. The Inhibiting Action of the Growth Substance on Bud Development. Proc. Natl. Acad. Sci. USA 1933, 19, 714–716. [Google Scholar] [CrossRef]
  63. Foo, E.; Reid, J.B. Strigolactones: New Physiological Roles for an Ancient Signal. J. Plant Growth Regul. 2013, 32, 429–442. [Google Scholar] [CrossRef]
  64. Dun, E.A.; Brewer, P.B.; Beveridge, C.A. Strigolactones: Discovery of the elusive shoot branching hormone. Trends Plant Sci. 2009, 14, 364–372. [Google Scholar] [CrossRef]
  65. Hoffmann, B.; Proust, H.; Belcram, K.; Labrune, C.; Boyer, F.D.; Rameau, C.; Bonhomme, S. Strigolactones Inhibit Caulonema Elongation and Cell Division in the Moss Physcomitrella patens. PLoS ONE 2014, 9, e99206. [Google Scholar] [CrossRef]
  66. Crawford, S.; Shinohara, N.; Sieberer, T.; Williamson, L.; George, G.; Hepworth, J.; Muller, D.; Domagalska, M.A.; Leyser, O. Strigolactones enhance competition between shoot branches by dampening auxin transport. Development 2011, 137, 2905–2913. [Google Scholar] [CrossRef] [PubMed]
  67. Leyser, O.; Day, S. Shoot branching. In Mechanisms in Plant Development; Leyser, O., Day, S., Eds.; Blackwell Science: Oxford, UK, 2003. [Google Scholar]
  68. Bangerth, F. Response of cytokinin concentration in the xylem exudate of bean (Phaseolus vulgaris L.) plants to decapitation and auxin treatment, and relationship to apical dominance. Planta 1994, 194, 439–442. [Google Scholar] [CrossRef]
  69. Prusinkiewicz, P.; Crawford, S.; Smith, R.S.; Ljung, K.; Bennett, T.; Ongaro, V.; Leyser, O. Control of bud activation by an auxin transport switch. Proc. Natl. Acad. Sci. USA 2009, 106, 17431–17436. [Google Scholar] [CrossRef]
Figure 1. A simplified schematic diagram depicting strigolactone synthesis pathway. Geranylgeranyl diphosphate (GGPP) is synthesized through methyl erythritol phosphate pathway (MEP pathway) and then C40 carotenoids are synthesized in the cytoplasm. CCD7 (MAX3/RMS5/HTD1/D17), CCD8 (MAX4/RMS1/DAD1/D10), CytP450 (MAX1), and other enzymes promote the 5-deoxystrigol synthesis and then synthesize other strigolactone compounds via other pathways, such as sorgolactone, alectrol, and orobanchol. Arrow depicts activation.
Agronomy 13 02383 g001
Figure 2. Variation in light intensity under natural light and simulated relay intercropping light environment in 2018. Solid and dashed lines indicate normal light C0 and simulated relay intercropping light environment C1, respectively.
Agronomy 13 02383 g002
Figure 3. Branch development dynamics of two soybean cultivars from 28 to 68 d under different light environments. Solid and dashed lines indicate D16 and N99-6, respectively. Values are mean ± SE.
Agronomy 13 02383 g003
Figure 4. Transcription of photosynthesis-related genes, including GmPIL (A), GmPhyA (B), and GmPhyB (C), was analyzed through qPCR from 0 to 24 h of shading in D16 and N99-6 cultivars. D16 and N99-6 were measured within 24 h of shade treatment and leaf samples were collected for RNA extraction, cDNA synthesis, and qPCR analysis. Data presented as means ± SE of three independent experiments. Statistical analysis was performed through ANOVA test (p < 0.05) and the significant differences are indicated by different letters.
Agronomy 13 02383 g004
Figure 5. The changes of strigolactone content in samples collected throughout a 24 h shading experiment in plants of D16 and ND99-6, compared with normal light (A). Relative expression of genes related to synthesis and transport of strigolactone, including GmMAX3 (B), GmMAX2 (C), and GmMAX2 (D), in D16 and ND99-6 continuously at two-hour intervals over a 24 h period. Data are presented as means ± SE of three independent experiments. Statistical analysis was performed through ANOVA test (p < 0.05) and the significant differences are indicated by different letters.
Agronomy 13 02383 g005
Figure 6. Changes in SL content (A) and synthetic gene GmMAX2 (B) in auxin- and inhibitor-treated soybean axillary buds under normal light and shade. Data are presented as means ± SE of three independent experiments. Statistical analysis was performed through ANOVA test (p < 0.05) and the significant differences are indicated by different letters.
Agronomy 13 02383 g006
Figure 7. Changes in IAA content (A) and synthetic gene GmPIN1 (B) in SL- and inhibitor-treated soybean axillary buds under normal light and shade. Data are presented as means ± SE of three independent experiments. Statistical analysis was performed through ANOVA test (p < 0.05) and the significant differences are indicated by different letters.
Agronomy 13 02383 g007
Figure 8. Model of the role of SL in soybean branch formation under shade treatment. Arrows indicate activation and bars indicate repression.
Agronomy 13 02383 g008
Table 1. Branching phenotypes of two soybean cultivars associated with shade and normal light.
CultivarTreatmentBranch NumberBranch Formation RateBranch Length (cm)Branch Pod Number
D16normal light7.50 ± 0.490.58 ± 0.0418.04 ± 1.90217.2 ± 2.857
shade1.40 ± 0.490.26 ± 0.0417.65 ± 1.6718.2 ± 1.990
N99-6normal light2.40 ± 1.020.18 ± 0.0616.63 ± 1.36311.7 ± 1.552
shade1.20 ± 0.750.12 ± 0.049.82 ± 1.3915.2 ± 1.249
Each value represents the mean ± SE. Means for each treatment that does not have a common letter are significantly different, as determined by Duncan’s multiple range tests at p < 0.05.
Table 2. Effects of auxin/strigolactones and inhibitors on the phenotype of branch in D16.
EnvironmentTreatmentBranch NumberBranch Formation RateBranch Length (cm)Branch Pod Number
normal lightCK6.20 ± 0.360.583 ± 0.05628.08 ± 1.3518.22 ± 1.83
IAA4.12 ± 0.650.338 ± 0.03431.67 ± 2.5112.83 ± 1.13
NPA7.23 ± 1.880.620 ± 0.07626.02 ± 1.4617.73 ± 1.30
GR-243.56 ± 0.720.323 ± 0.01315.82 ± 1.0714.92 ± 1.34
TIS10810.83 ± 0.380.792 ± 0.08639.23 ± 2.3415.86 ± 1.36
shadeCK3.78 ± 0.720.352 ± 0.03623.94 ± 1.317.76 ± 1.02
IAA2.64 ± 0.120.228 ± 0.02322.83 ± 1.577.18 ± 1.40
NPA5.80 ± 0.480.442 ± 0.08424.06 ± 1.3911.96 ± 1.84
GR-242.06 ± 0.490.214 ± 0.06322.85 ± 1.936.63 ± 1.32
TIS1087.18 ± 1.490.601 ± 0.08223.68 ± 2.3113.82 ± 1.79
Each value represents the mean ± SE. Means for each treatment that does not have a common letter are significantly different, as determined by Duncan’s multiple range tests at p < 0.05.
Table 3. Effects of auxin/strigolactones and inhibitors on the phenotype of branch in N99-6.
EnvironmentTreatmentBranch NumberBranch Formation RateBranch Length (cm)Branch Pod Number
normal lightCK3.16 ± 0.490.314 ± 0.02216.03 ± 1.8810.63 ± 2.12
IAA2.33 ± 0.200.202 ± 0.01915.39 ± 1.2314.68 ± 1.89
NPA5.62 ± 1.720.496 ± 0.03615.68 ± 1.7215.13 ± 1.07
GR-243.77 ± 1.490.338 ± 0.01715.92 ± 1.838.23 ± 1.39
TIS1087.84 ± 1.200.660 ± 0.08219.36 ± 1.8816.38 ± 2.12
shadeCK3.02 ± 0.490.297 ± 0.03225.18 ± 2.225.63 ± 0.83
IAA2.16 ± 0.650.213 ± 0.01923.94 ± 2.028.66 ± 1.22
NPA4.33 ± 0.100.415 ± 0.03224.28 ± 1.9111.39 ± 1.92
GR-241.37 ± 0.570.154 ± 0.01918.63 ± 1.926.39 ± 1.11
TIS1086.64 ± 0.930.576 ± 0.08224.88 ± 2.7110.83 ± 1.79
Each value represents the mean ± SE. Means for each treatment that does not have a common letter are significantly different, as determined by Duncan’s multiple range tests at p < 0.05.
Disclaimer/Publisher’s Note: The statements, opinions and data contained in all publications are solely those of the individual author(s) and contributor(s) and not of MDPI and/or the editor(s). MDPI and/or the editor(s) disclaim responsibility for any injury to people or property resulting from any ideas, methods, instructions or products referred to in the content.

