Abstract
Organic wheat production systems have lower yields compared with intensive conventional production and often do not achieve the grain protein content and quality thresholds set by millers and bakers. In contrast, organic production methods were reported to result in higher concentrations of nutritionally desirable micronutrients and lower concentrations of the toxic metal Cd in wheat grain and wholegrain flour. However, although N-availability and variety characteristics are known to affect both gain yields and bread-making quality, the exact reasons for the yield gap and differences in grain processing and nutritional quality between organic and conventional spring wheat production in the UK are poorly understood. The overall aim of this study was therefore to determine to what extent changes in variety choice and fertilization regimes may reduce the yield gap and improve processing quality without affecting nutritional quality in organic spring wheat production. To achieve this aim, we compared crop health, yield, grain processing, and nutritional quality parameters in spring wheat produced using (i) six contrasting spring wheat varieties grown with a standard fertilization regime and (ii) one variety widely used by organic farmers (Paragon) with nine different fertilization regimes in (iii) three UK sites/farms with contrasting pedoclimatic conditions. Significant differences in foliar disease severity, grain yield, and quality parameters were detected between six contrasting spring wheat varieties when grown under organic management regimes. Specifically, the varieties Paragon and Tybalt were identified as the best-performing varieties with respect to foliar disease resistance and grain yield under organic farming conditions and also produced high processing and nutritional quality across the three UK sites. However, the highest grain yields were obtained by Paragon at the Gilchester site and Tybalt at the Sheepdrove and Courtyard sites, while the highest protein contents were produced by Tybalt at the Gilchester site and Paragon at the Sheepdrove and Courtyard sites, which suggests that there is a need for site-specific wheat variety selection in the UK organic sector. Although organic fertilizer input type and level also affected wheat performance, differences between fertilization regimes were smaller than those observed between the five contrasting varieties, which suggests that improvements in spring wheat breeding/selection have a greater potential for increasing crop yield and quality in the organic sector compared with changes to fertilization practices. Overall, results suggest it is feasible to breed/select spring wheat varieties that combine high protein, vitamin E, and micronutrients with low toxic metal (Cd, Pb) concentrations when produced under organic farming conditions. These findings also support the hypothesis that differences in variety choice by organic and conventional farmers have contributed to the differences in nutritional quality between organic and conventional wheat products reported in previous studies.
Keywords:
organic spring wheat; disease severity; bread-making quality; nutritional quality; vitamin E; Fe; Zn; Cd; Pb 1. Introduction
There is increasing evidence that modern bread wheat varieties developed for high-input conventional production systems may lack many of the traits desired by organic farmers, including competitiveness against weeds, disease resistance, and nutrient uptake efficiency from organic fertilizer inputs [1,2,3]. Also, it has become clear that variety comparisons/trials carried out in the background of conventional high-input agronomic practices do not accurately predict the performance and ranking of varieties (in terms of crop health, grain yield, and quality parameters) in organic production, even when carried out in similar pedoclimatic environments [3,4,5,6,7,8,9].
Studies comparing modern, short-straw winter wheat varieties developed for conventional farming with longer-straw traditional varieties or new varieties developed for organic farming systems indicate that grain from modern varieties has lower concentrations of phenolics/antioxidants and/or mineral micronutrients (e.g., Cu, Fe, Se, and Zn) [3,5,7,8,9]. Also, recent retail surveys in Germany and the UK demonstrated that (1) conventional wheat flour has significantly lower antioxidant activity and concentrations of phenolics and mineral micronutrients compared with organic wheat flour, and (2) composition differences are greater in whole grain compared with refined flour products [3,10]. However, there is limited information on the differences in nutritional quality between spring wheat varieties. Also, it remains unclear to what extent contrasting (i) varieties and/or (ii) agronomic practices used in organic and conventional wheat production systems contribute to the differences in flour quality observed [3,5,10].
Factorial field experiments with winter wheat showed that the contrasting fertilization regimes used in organic and conventional farming systems also have significant effects on grain concentrations of phytochemicals, mineral micronutrients, and toxic metals (in particular Cd) [3,7,11,12]. For example, recent studies have reported that the use of mineral P-fertilizers (which contain Cd) in conventional farming systems results in higher Cd concentrations in wheat grain and vegetable crops compared with organic farming systems, which use manure as the only P-input [11,12,13]. Also, the use of mineral fertilizers (N or NPK) was shown to result in lower grain Se concentrations compared with composted cattle manure applied at the same total N-input level [8]. This is thought to be due to (i) manure containing significant amounts of Se and other micronutrients (especially on farms that use mineral feed supplements), while mineral N, P, and K fertilizers contain no or very low levels of micronutrients, and/or (ii) the higher grain yields obtained with mineral NPK fertilizers compared with FYM applied at the same total N-input level [8]. However, studies into the effects of different fertilizer types on grain micronutrient concentrations in spring wheat are, to our knowledge, not currently available.
It is important to note that micronutrient concentrations in organic wheat grain were also reported to be affected by the use of Cu-fungicides, which can be used for (i) treatments for wheat seed and/or (ii) late blight control in potato crops in the rotation. The increase in Cu-availability in soil resulting from the use of Cu-fungicides may not only increase Cu-uptake and incorporation into the grain but may also indirectly affect the uptake of other micronutrients (e.g., Zn) that may compete with Cu for uptake or grain incorporation [11,12].
Results from recent factorial field experiments with winter wheat also demonstrated highly significant interactions between climatic conditions and agronomic factors (e.g., rotation, irrigation, fertilizer type, crop protection regimes) for a wide range of grain yield, processing, and nutritional quality parameters [3,4,5,7,8,11,12]. Furthermore, redundancy analyses demonstrated that climatic variation between growing seasons accounted for a larger proportion of that total variation in grain yield and quality when compared with agronomic drivers such as fertilizer type, crop protection, irrigation, or variety [3,4,5,7,8,11,12].
In this context, it is important to note that interactions between contrasting soil types and (i) climatic and (ii) agronomic factors have, to our knowledge, not been studied on organic farms, although it is well documented that changing to organic farming protocols can have a significant effect on soil biological, chemical, and physical parameters [12,14,15,16,17,18,19,20].
The overall aim of the series of two-year variety and fertilization trials at three sites with contrasting pedoclimatic background conditions was therefore to address the knowledge gaps described above. Specifically, the main objective of the variety trials was to study interactions between pedoclimatic background conditions and crop genetics on spring wheat performance, while the main objective of the fertilizer trials was to study interactions between pedoclimatic background conditions and contrasting organic fertilizers used in organic farming systems on spring wheat performance. Assessments focused on (1) grain yield, (2) disease resistance, (3) grain processing/bread-making quality (grain protein content), and (4) nutritional quality (the secondary plant metabolite phytic acid, the mineral micronutrients Cu and Zn, and the toxic metals Cd, Ni, and Zn) parameters. In the variety trials at Gilchester, grain concentrations of vitamin E were also assessed.
2. Materials and Methods
2.1. Trial Sites
Field experiments were established at three sites (fields on farms that had been managed to organic farming standards for more than six years) with contrasting pedoclimatic conditions. The sites included were:
- Gilchester farm is in Stamfordham, Northumberland, northeastern England (55°2′15.162″ N–1°54′7.0488″ W), which has clay loam soils of the Brickfield and Dunkeswick series [21]. These tend to be heavy, moisture-retentive clay loams with the risk of damaging soil structure when the soil is wet, which limits the opportunities to establish and cultivate cereal crops on these soils. Sowing in the spring can be delayed, leading to a late harvest that may compromise grain quality as weather conditions deteriorate. Temperatures are significantly lower than in the wheat production areas in southern England, but water stress is rare, leading to an overall higher yield potential [7]. Mean monthly temperatures, rainfall, and solar radiation in the 2006 and 2007 spring wheat growing seasons are shown in Supplementary Table S1.
- Courtyard Farm is near Hunstanton, Norfolk, Eastern England (62°35′45.9″ S–59°54′06.0″ W), which has coarse calcareous loam soils formed over chalk that belong to the Newmarket 2 series [21]. These soils are light, very well drained, and can be cultivated soon after rainfall. Early sowing of cereals is possible in the spring, and harvest is early. Shallow rooting and low rainfall/drought frequently restrict wheat growth and grain yields.
- Sheepdrove Farm is near Lambourn, Berkshire, southern England (51°32′2.04″ N–1°29′1.32″ W), which has silty clay loam soils formed over chalk that belong to the Andover 1 series [21]. These soils are well-drained and dry rapidly after rain, facilitating early cultivation and sowing in the spring. In drought conditions, the effects of water stress on crop growth and yield may be alleviated by the available water held in the chalk.
UK Meteorological Office data collected at weather stations near the trial sites confirmed that the sites differed considerably in mean monthly temperature, rainfall, and solar radiation in both growing seasons (Supplementary Table S1).
Soil samples were taken from the top soil (0–30 cm) in each trial at all three sites prior to sowing in both 2006 and 2007. Soil analyses for mineral nutrient and toxic metal concentrations were carried out by Sabanci University (Istanbul, Turkey) using standard analytical protocols [13] and confirmed that sites differed considerably in total soil carbon, macronutrient, micronutrient, and toxic metal concentrations (Supplementary Table S2).
2.2. Experimental Design—Variety Trials
A randomized block design with four replicate blocks and six spring wheat varieties was used at each site. Each replicate block had six variety plots (8 m × 30 m), and the size of the plots allowed commercial drilling, mechanical weed control, and harvest machinery to be used. The location of varieties in each block was randomized. All plots were fertilized with farmyard manure at a rate/level equivalent to 170 kg N/ha.
2.3. Experimental Design—Fertilization Trials
At each site, a randomized block design with four replicate blocks and four fertilizer input types was used: (1) cattle farm yard manure (FYM), (2) chicken manure pellets (CMP), (3) FYM + CMP with 50% of N from FYM and 50% from CMP (FYM-CMP), and (4) communal green waste compost (GWC). Organic fertilizers were applied at two input levels equivalent to 125 and 250 kg N/ha, and a control treatment (CON) without the use of fertilizer was also included in the design. Each replicate block (48 m × 120 m) had four fertilizer type main plots (16 m × 30 m), and each fertilizer input type main plot had two fertilizer input level sub-plots (8 m × 30 m), which allowed commercial drilling, mechanical weed control, and harvest machinery to be used.
2.4. Rotational Position and Fertilizers Used in Spring Wheat Trials
The rotational positions typically used for bread-making wheat on each farm were used for experimental plots. On all farms, spring wheat was grown after clover leys, although there were differences in (i) the type of clover used (Gilchester farm used pure red clover leys established from Rhizobium inoculated seed, while Courtyard and Sheepdrove farms used rye grass/white clover leys established from non-inoculated clover seed), (ii) the length of the ley period (two years at Gilchester and Courtyard farms, three years at Sheepdrove farm), and (iii) clover management practices (leys were cut and mulched at Gilchester but grazed at Courtyard and Sheepdrove farm). The crops grown before clover leys also differed (Table 1).

Table 1.
Crops grown in the four growing seasons before spring wheat trials were established at the three sites/farms.
Experiments were established after two or three years of a clover ley as the preceding crop. There were a total of 108 plots each year. In both years, each of the organic fertilizer types was obtained from a single, homogenous batch and, as such, was identical in composition in all three suites. FYM and GWC were supplied by Sheepdrove Organic Farm (Hungerford, UK; https://sheepdrove.com/, accessed on 1 August 2023). The chicken manure pellets (CP) were a commercial product supplied by Greenvale Products Ltd. (Burnley, Lancashire, UK; www.greenvaleproductsltd.com, accessed on 1 August 2023); they were made from composted chicken manure formed into small, 3 mm diameter pellets and approved for restricted use by organic farming standards.
The mineral composition and pH of the three organic fertilizers/manures were determined by Natural Resource Management Ltd., Bracknell, Berkshire, UK (https://cawood.co.uk/nrm/, accessed on 1 August 2023) and the results were used to adjust manure applications to the desired N-input level. The composition and quantities of FYM, GWC, and CP applied are shown in Table 2. FYM and GWC were applied in the spring, shortly before the leys were plowed out in February or March for the following wheat crop.
Table 2.
Dry matter content, mineral composition, and pH of organic fertilizers used and the amount of the three organic fertilizers (farm yard manure, FYM; green waste compost, GWC; chicken manure pellets, CP) applied to achieve N-input levels of 125, 175, and 250 kg N/ha.
A Millcreek model 57 type spreader (Millcreek Ltd., North Lelsey, Lincolnshire, UK; www.millcreek.co.uk, accessed on 1 August 2023) was used with a tractor forward speed of 8 km per hr (5 mph) to achieve the correct application rate and an even distribution of FYM and GHC across the trial sites. CP was applied by hand in early to mid-May during early vegetative growth.
In each growing season, mechanical weeding was carried out twice, 14 days apart, with an Einböck comb-harrow (Einböck GmbH, Dorf an der Pram, Austria; www.einboeck.at, accessed on 1 August 2023). Trials were harvested using a plot combine harvester (Claas Dominator 38; Claas U.K. Ltd., Bury St. Edmunds, UK; www.claas.co.uk, accessed on 1 August 2023).
The dates for incorporation of clover, planting of wheat crops, soil analysis, mechanical weed control, chlorophyll assessments, and harvest are listed in Supplementary Table S3.
2.5. Spring Wheat Varieties
All spring varieties selected for the experiments had a track record for high milling/bread making quality in conventional and/or organic production systems in Europe. Specifically, the following varieties were included in the trials:
- Paragon (developed by RAGT Seeds Ltd., Cambridge, UK) is a National Association of British and Irish Millers (NABIM) Group 1 variety described as having lower yields, very good bread-making characteristics, relatively long and stiff straw (resistance to lodging score = 6), and good all-round disease resistance (powdery mildew = 7 or moderately resistant; yellow rust = 9 or resistant; brown rust = 7 or moderately resistant; Septoria tritici = 6 or moderately resistant) [22].
- Tybalt (supplied by Limagrain UK Ltd., Rothwell, UK), a variety developed in the Netherlands, is a NABIM Group 2 variety described as having high yield potential but lower grain protein contents and specific weights, relatively weak straw with a tendency to lodge, but good foliar disease resistance to mildew and brown rust, and also some resistance to yellow rust [22].
- Fasan (supplied by Lochow Petkus, Bergen, Germany) is an older variety developed for conventional high baking/bread-making quality wheat production in Germany and is described as long-straw, competitive against weeds, and relatively tolerant to infection by Fusarium and Septoria.
- Monsun (supplied by Lochow Petkus, Bergen, Germany) is a short-straw variety with a relatively high yield developed for conventional, intensive farming systems in Germany.
- Amaretto: (supplied by Saatzucht Streng–Engelen GmbH & Co. KG, Uffenheim, Germany) is a German variety that was described as having similar quality and yield characteristics to Paragon and good disease resistance. Some UK millers/processors imported organic Amaretto grain for its high baking/bread-making quality.
- Zebra (developed by Svalöf Weibull AB, now part of Lantmännen Seed, Malmö, Sweden) has been described as a long-straw variety developed for high baking/bread-making quality wheat production that was popular with organic farmers in Scandinavia and in high demand by Scandinavian grain millers and bakers.
2.6. Disease Severity and Leaf Chlorophyll Assessment
Disease assessments for powdery mildew (Blumeria (Erysiphe) graminis), Septoria (Septoria nodorum, Septoria triticii), and wheat yellow rust (Puccinia striiformis) were made using standard assessment methods developed by the UK Agricultural Development and Advisory Service (ADAS) [23]. Disease severity was assessed at two wheat growth stages (GS), GS37 and GS65, using the growth stage (GS) classification system developed by Zadoks et al., 1974 [24]. At GS37, foliar disease severity was very low in all varieties. At GS65 (mid-flowering), assessments were made on the three youngest leaves, L1 (flag leaf), L2 (second leaf), and L3 (third leaf), with 20 randomly selected tillers being assessed in each plot.
Leaf greenness was assessed to estimate leaf chlorophyll levels by single-photon avalanche diode detection (SPAD) using a Minolta chlorophyll meter model SPAD 502 (Spectrum Technologies Inc., Plainfield, IL, USA). Ten measurements per plot were made on randomly selected flag leaves at GS65.
2.7. Grain Yield and Quality Assessment
Crop yields were assessed using a plot-combine harvester (CLAAS Dominator 38, Ellerdorf, Germany) with a 2.4 m wide cutter bar. Grain moisture content was determined by drying grain at 80 °C for two days using a forced-draught drying oven (Genlab Ltd., Widnes, UK), with yield data presented at 15% moisture content. From each plot, 60 kg of grain was retained for the various quality and baking tests by Campden BRI (Chipping Campden, UK) using standard protocols (www.campdenbri.co.uk/services/cereals-testing.php, accessed on 1 August 2023). Only grain protein data are presented in this article as a marker for baking quality.
Grain samples from all plots were also freeze-dried immediately after harvest and then transported to specialist laboratories for nutritional quality analyses. Tocopherol concentrations (α-tocopherol, α-tocotrienol, β-tocopherol, and β-tocotrienol) were measured in samples from the variety trials at Gilchester only and analyzed by the Food Analysis Department of the Central Food Research Institute using standard protocols (CFRI, Herman Otto Vt 15, Budapest, Hungary; http://www.gfar.net/content/central-food-research-institute, accessed on 1 August 2023). Grain mineral nutrients, toxic metals, and phytate analyses were carried out by Sabanci University (Istanbul, Turkey; www.sabanciuniv.edu/en, accessed on 1 August 2023) using standard protocols.
2.8. Statistical Analysis
All analyses of variance (ANOVA) were carried out in the R statistical environment [25,26]. The effects of harvest year, site, fertilizer type, fertilizer input level, and/or variety on measured parameters were assessed using an ANOVA derived from a linear mixed-effects model [27]. The hierarchical nature of the experimental design was reflected in the random error structures that were specified as block (replicate)/harvest year. The normality of the residuals of all models was tested using QQ-plots. Differences between main effect means for varieties and fertilizer input types and interaction means were tested using Tukey contrasts in the general linear hypothesis testing (glht) function of the “multcomp” package [28]. A linear mixed effects model was used for the Tukey contrasts, containing a treatment main effect and the random error term specified as described above. Real means and standard errors of means were generated by using the “tapply” function in R.
The relationships between climate, soil chemical content, fertilizer mineral input, and wheat variety explanatory variables/drivers, and (i) plant health, (ii) crop performance, and (iii) grain composition parameters as response variables were investigated using partial redundancy analysis (pRDA), which summarizes the part of functional trait composition’s variation that is explained by selected environmental variables after removing the effects of other variables (block = replicate) and by using the CANOCO 5 software [29]. Automatic forward selection of the agronomic/climatic drivers within the RDAs was used, and their significance in explaining additional variance was calculated using Monte Carlo permutation tests.
3. Results
3.1. Effect of Year, Site, and Variety on Disease Severity
The two main foliar diseases identified were Septoria leaf blotch and yellow rust (Puccinia striiformes) (Table 3), while levels of powdery mildew (Blumeria (Erysiphe) graminis) were generally very low. Lodging was not observed in any of the varieties in both years.
Table 3.
Main effect means ± SE and p-values for the effects of year, site, and variety on spring wheat disease severity (% of leaf area infected) at GS 65.
Just prior to full flag leaf emergence (GS 37), disease severity was low in all varieties at all three sites. Yellow rust, but not Septoria severity, at GS 65 was significantly lower in 2006 when compared with the 2007 growing season (Table 3), which had (i) lower average temperatures and radiation in all three sites and (ii) lower rainfall at Gilchester but higher rainfall at Sheepdrove and Courtyard (Supplementary Table S1).
Septoria severity on the flag leaf was significantly higher at Gilchester than at Courtyard and Sheepdrove, while Septoria severity on leaf 2 (the leaf below the flag leaf) was significantly higher at Sheepdrove than at Courtyard and Gilchester (Table 3). In contrast, yellow rust severity on both the flag leaf and leaf 2 was significantly higher at Gilchester and Sheepdrove than at Courtyard (Table 3).
Septoria severity on flag leaves of the variety Monsun was higher compared with the other five varieties, although the difference between Monsun and Fasan was not significant (Table 3). Septoria severity on leaf 2 was significantly higher in Monsun, Fasan, and Zebra compared with the other three varieties, with the lowest Septoria disease severity recoded in Tybalt (Table 3). Yellow rust severity recorded for Zebra was more than five times higher than that detected in the other five varieties, while no symptoms of yellow rust were detected in Paragon or Tybalt (Table 3).
ANOVA also detected significant two- and three-way interactions between year, site, and/or variety for both Septoria and yellow rust severity at GS65 (Table 3).
When the interaction between variety and site for Septoria on the flag leaf was further investigated, Septoria severity was very low (≤0.5% of leaf area covered) for all varieties except Monsun, which had significantly higher disease severity (2.1% of leaf area covered) at Gilchester but not at the other two sites (Supplementary Table S4). When Septoria severity on leaf 2 was compared, significant differences between varieties were detected in all three sites, but the ranking of varieties for Septoria severity differed significantly between sites (Table 4). Specifically, the ranking was found to be:
Table 4.
Interaction means ±SE for effects of site and variety on Septoria and yellow rust severity (% leaf area infected) on leaf 2 at GS65.
- Monsun ≥ Fasan ≥ Zebra ≥ Amaretto ≥ Tybalt ≥ Paragon at Gilchester,
- Fasan ≥ Zebra ≥ Monsun ≥ Paragon ≥ Amaretto ≥ Tybalt at Sheepdrove and
- Zebra ≥ Fasan ≥ Paragon ≥ Monsun ≥ Amaretto ≥ Tybalt at Courtyard (Table 4).
When the interaction between variety and site for yellow rust severity was further investigated, high levels of yellow rust (>40% of leaf area covered on both the flag leaf and leaf 2) were only detected in the variety Zebra at Gilchester and Sheepdrove, while yellow rust severity on Zebra grown at Courtyard was significantly lower (7.4% and 1.0% on the flag leaf and leaf 2, respectively) (Supplementary Tables S4 and S5). Yellow rust severity on the variety Fasan was also significantly higher at Gilchester and Sheepdrove compared with Courtyard. No symptoms of yellow rust were detected in the varieties Paragon and Tybalt at all three sites (Supplementary Tables S4 and S5).
Significant interactions involving the growing season were also identified (Table 3), but they were not further investigated. Instead, redundancy analyses (RDA) were used to investigate the relative importance of climatic, soil, and variety parameters as explanatory variables/drivers for foliar disease severity (see Section 3.7 below).
3.2. Effect of Year, Site, and Fertilization on Disease Severity in Spring Wheat cv Paragon
Results from the unfertilized control plots could not be included in the factorial ANOVA of data from the fertilization trials described in this section. We, therefore, used redundancy analyses (RDA) to investigate associations between all fertilization treatments (including no fertilizer input controls) and crop health parameters (see Section 3.7.2).
When the effect of fertilizer type and input level on disease severity in the variety Paragon was assessed at the three sites, only Septoria leaf blotch and powdery mildew (Blumeria (Erysiphe) graminis) symptoms were detected. Lodging was not observed.
As in the variety trials (see Section 3.1 above), Septoria severity in Paragon was low at GS65 (<7.5% of leaf area infected) in the fertilization trials but significantly higher at Courtyard and Sheepdrove compared with Gilchester (Supplementary Table S5). Powdery mildew severity was very low (<2.5% of leaf area infected), but also significantly higher at Courtyard and Sheepdrove compared with Gilchester (Supplementary Table S5).
Fertilizer type, but not input level, was found to have a significant main effect on Septoria and powdery mildew severity, with the highest disease severity being recorded in crops fertilized with chicken manure pellets (CP) (Supplementary Table S5), the fertilizer with the highest water-soluble, readily-plant-available nitrogen content (Table 2).
ANOVA also detected significant interactions between site and fertilizer type (Supplementary Table S5). When these interactions were further investigated, significant differences between fertilizer types were detected in trials carried out at Sheepdrove and Courtyard but not at Gilchester, the site with the lowest overall level of foliar disease.
Significant interactions involving the growing season were also detected but not further investigated. Instead, redundancy analyses (RDA) were used to investigate the relative importance of climate, soil, and nutrient inputs from fertilizers as explanatory variables/drivers for foliar disease severity (see Section 3.7 below).
3.3. Effects of Year, Site, and Variety on Crop Performance Parameters
The main crop performance parameters assessed were grain yield, thousand grain weight (TGW, an important yield component), plant height (as a marker of straw yield and lodging risk), leaf chlorophyll level (SPAD, as a marker for nitrogen availability and/or uptake), and crude protein concentration (as a marker for bread-making quality).
The growing season had a significant main effect on all five crop performance parameters, which were all significantly higher in 2006 when compared with 2007 (Table 5). The growing season had (i) lower temperatures and solar radiation at all three sites and (ii) lower rainfall at Gilchester but higher rainfall at Courtyard and Sheepdrove (Supplementary Table S1).
Table 5.
Main effect means ± SE and p-values for the effects of year and variety on grain yield, straw length, leaf chlorophyll levels (SPAD) at GS65, and grain protein content in spring wheat.
Significant main effects of the site were detected for grain yield and protein content, straw length, and leaf chlorophyll (SPAD). Grain yields and straw length at Courtyard and Gilchester were similar but higher than those recorded at Sheepdrove, although the difference in straw length between Sheepdrove and Courtyard was not significant (Table 5). In contrast, the grain protein content was highest at Gilchester and lowest at Courtyard (Table 5). Also, leaf chlorophyll levels (SPAD) were significantly lower at Courtyard and Sheepdrove (the two farms where white clover/grass leys that are used for grazing livestock were grown before spring wheat) compared with Gilchester (the farm where pure red clover leys that were cut and mulched were grown before spring wheat) (Table 5).
Very highly significant (p < 0.0001) main effects of variety were detected for all five performance parameters. Overall (across all three sites), the variety Zebra produced significantly lower yields but significantly higher grain protein content compared with the other five varieties (Table 5). Also, overall, the varieties Fasan, Paragon, and Tybalt produced both high grain yields (>4 t/ha) and high protein contents (≥13%). However, when these three varieties were compared, Tybalt produced significantly higher grain yields and Paragon produced significantly higher protein than the other two varieties (Table 5).
Very highly significant (p < 0.0001) interactions between variety and site were detected for grain yield, straw length, leaf chlorophyll, and grain protein content Table 5 and Table 6. When these interactions were further investigated, the ranking of varieties differed significantly between sites for all four performance parameters (Table 6).
Table 6.
Interaction means ±SE for effects of site and variety on grain yield, straw length, thousand-grain weight (TGW), leaf chlorophyll levels (SPAD), and grain protein content in spring wheat.
Specifically, at Gilchester, Paragon produced (i) significantly higher grain yields than the other five varieties and (ii) protein contents that were not significantly different from those recorded for Zebra, Tybalt, and Fasan (Table 6).
At Sheepdrove, Tybalt produced the highest grain yields, although they were not significantly different from those recorded for Paragon and Amaretto, while Zebra produced significantly higher protein contents than the other five varieties, and only Paragon and Monsun also had protein contents ≥14% (Table 6). At Courtyard, Tybalt produced significantly higher grain yields than the other five varieties, while Zebra and Paragon produced significantly higher grain protein contents (12.3%) than the other four varieties, whose protein content varied between 10.6 and 11.5% (Table 6).
Differences in chlorophyll (SPAD) levels between varieties were greatest at Gilchester and lowest at Courtyard (Table 6). At Gilchester and Sheepdrove, the highest leaf chlorophyll levels were recorded in Paragon and the lowest in Zebra (Table 6), which also had very high levels of yellow rust in these two sites (Supplementary Tables S4 and S5). In contrast, at Courtyard, where yellow rust severity was very low in all six varieties, chlorophyll levels in Zebra were not significantly different from those recorded in the other five varieties (Table 6).
Significant differences in straw length between sites were only detected for the varieties Fasan and Zebra, with Fasan producing significantly longer straw at Courtyard compared with Sheepdrove and Zebra producing longer straw at Gilchester compared with Sheepdrove (Table 6).
Significant interactions involving the growing season were also identified but not further investigated. Instead, redundancy analyses (RDA) were used to investigate the relative importance of climate, soil, and variety as explanatory variables/drivers for crop performance (see Section 3.7 below).
3.4. Effects of Year, Site, and Fertilization on Performance Parameters in Spring Wheat cv Paragon
Results from the unfertilized control plots could not be included in the factorial ANOVA of data from the fertilization trials described in this section. We, therefore, used redundancy analyses (RDA) to investigate associations between all fertilization treatments (including no fertilizer input controls) and crop performance parameters (see Section 3.7.2).
A four-factor ANOVA identified significant main effects of the growing season for all four crop performance parameters (Supplementary Table S6). Grain yields, leaf chlorophyll (SPAD) levels, and straw length were significantly higher in 2006 when compared with 2007 (Supplementary Table S6), the growing season that had (i) lower temperatures and solar radiation at all three sites and (ii) lower rainfall at Gilchester but higher rainfall at Courtyard and Sheepdrove (Supplementary Table S1).
Significant main effects of the site were detected for grain yield, protein content, and leaf chlorophyll (SPAD), which were all highest at Gilchester and lowest at Courtyard, although the difference in chlorophyll levels between Sheepdrove and Courtyard was not significant (Supplementary Table S6).
Significant main effects of fertilizer type, but not fertilizer input level, were detected for grain yield and protein content (Supplementary Table S6). Specifically, overall (across all three sites), grain yields were lowest (3.5 t/ha) when CP was used and highest (3.8 t/ha) when green waste compost (GWC) was used as fertilizer (Supplementary Table S6). In contrast, overall grain protein content was highest (15.6%) when CP and lowest (13.8%) when farm yard manure (FYM) or GWC were used as fertilizer (Supplementary Table S6).
Significant main effects of both fertilizer type and input level were detected for leaf chlorophyll levels. The higher fertilizer input level and the use of CP or a mixture of CP and FYM (CP + FYM) resulted in significantly higher chlorophyll levels (Supplementary Table S6).
A four-factor ANOVA detected a wide range of interactions between year, site, fertilizer type, and/or fertilizer input level for grain yield, grain protein content, and leaf chlorophyll (Supplementary Table S6). These interactions were further investigated by carrying out separate three-factor ANOVAs for data from each site (Table 7).
Table 7.
Main effect means ± SE and p-values for the effects of year, fertilizer type, and input level on grain yield in spring wheat cv. Paragon at the Gilchester (GIL), Sheepdrove (SHE), and Courtyard (COU) trial sites.
For grain yield, a three-factor ANOVA detected significant main effects of (i) year at all three sites and (ii) fertilizer input type at Gilchester and Sheepdrove (Table 8). Grain yields were higher in 2006 compared with 2007 at all three sites. At Gilchester, the use of CP, FYM, and GWC as fertilizers resulted in similar grain yields, while the FYM + CP fertilizer treatment resulted in significantly lower yields compared with FYM or CP alone (Table 8). In contrast, at Sheepdrove, the use of CP resulted in significantly lower yields compared with the other three fertilizer types (Table 8).
Table 8.
Main effect means ± SE and p-values for the effects of year, fertilizer type, and input level on leaf chlorophyll and grain protein content in spring wheat cv Paragon at the Gilchester (GIL), Sheepdrove (SHE), and Courtyard (COU) trial sites.
For leaf chlorophyll (SPAD) levels, a three-factor ANOVA detected significant main effects of (i) year at all three sites and (ii) fertilizer type at Gilchester and Courtyard (Table 8).
As with grain yield, leaf chlorophyll levels were higher in 2006 compared with 2007 at all three sites. The use of CP and FYM + CP resulted in higher chlorophyll levels compared with FYM and GWC at all three sites, although the differences between fertilizer types were not significant at Gilchester (Table 8). For leaf chlorophyll, a three-factor ANOVA also detected a significant interaction between fertilizer type and input level (Table 8). When this interaction was further investigated, significantly higher chlorophyll levels with a high fertilizer input level were only detected when CP was used as the fertilizer type (Table 9).
Table 9.
Interaction means for effects of fertilizer type and input level on the leaf chlorophyll content in spring wheat cv Paragon at Sheepdrove Farm.
For protein content, a three-factor ANOVA detected significant main effects of (i) year at Sheepdrove and Courtyard, (ii) fertilizer type at all three sites, and (iii) fertilizer input level at Courtyard only (Table 8). Different from grain yield and chlorophyll levels, protein contents were lower in 2006 compared with 2007, although the difference between years was not significant at Gilchester (Table 8). However, as with grain yield and chlorophyll levels, protein contents were higher with CP and FYM + CP compared with FYM and GWC in all three sites, although the difference between FYM + CP and GWC was not significant at Gilchester (Table 8). At Courtyard, protein contents were significantly higher when the higher fertilizer input level was used (Table 8).
At Courtyard, a three-factor ANOVA also detected a significant interaction between fertilizer type and input level (Table 8). When this interaction was further investigated, the higher fertilizer input level resulted in significantly higher grain protein contents only when CP, FM + CP, and GWC were used as fertilizers, and a protein content >14% was only achieved at Courtyard when CP at the higher fertilizer input level was used (Table 10).
Table 10.
Interaction means for effects of fertilizer type and input level on the protein content of spring wheat cv Paragon at Courtyard Farm.
Significant interactions involving the growing season were also detected (Supplementary Table S6 and Table 7 and Table 8), but they were not further investigated. Instead, redundancy analyses (RDA) were used to investigate the relative importance of climatic soil and nutrient inputs from fertilizers as explanatory variables/drivers for crop performance (see Section 3.7 below).
3.5. Effects of Year, Site, and Variety on Grain Nutritional Quality Parameters
The nutritional quality parameters assessed in spring wheat grain were (i) phytic acid (an anti-nutrient that reduces the absorption/bioavailability of mineral micronutrients such as Fe and Zn), (ii) the mineral micronutrients Fe and Zn, and (iii) the toxic metals Cd, Ni, and Pb (Table 11).
Table 11.
Main effect means ± SE and p-values for the effects of year, site, and variety on phytic acid selected grain mineral micronutrient (Fe, Zn) and toxic metal (Cd, Ni, Pb) concentrations in spring wheat.
The growing season had a significant main effect on grain Fe, Zn, Cd, and Pb concentrations but not phytic acid and Ni concentrations (Table 11). Fe concentrations were higher and Zn, Cd, and Pb concentrations lower in 2006 when compared with 2007 (Table 11), the growing season that had (i) lower temperatures and solar radiation at all three sites and (ii) lower rainfall at Gilchester but higher rainfall at Courtyard and Sheepdrove (Supplementary Table S1).
Significant main effects of the site were detected for grain Fe, Zn, Cd, and Ni concentrations but not phytic acid and Pb concentrations (Table 11). The highest Zn concentrations were found in grain from Sheepdrove, while the highest Fe, Cd, and Ni concentrations were found in grain from Gilchester, and the lowest grain Fe, Cd, Ni, and Zn concentrations were detected in grain from Courtyard (Table 11).
Significant main effects of variety were detected for all nutritional quality parameters except Pb. Overall (across all three sites) analysis found the highest and lowest concentrations of (i) phytic acid in Fasan and Tybalt, respectively, (ii) Fe in Tybalt and Fasan, respectively, (iii) Zn in Zebra and Amaretto, respectively, (iv) Cd in Zebra and Amaretto/Paragon, respectively and (v) Ni in Zebra and Monsun, respectively (Table 11).
ANOVA also detected significant two-way interactions between site and variety for phytic acid, Fe, Zn, and Cd (Table 11 and Table 12). When these interactions were further investigated, significant differences between sites were detected for grain concentrations of (i) phytic acid in the varieties Fasan and Monsun (both higher at Courtyard than the other two sites) only, (ii) Fe in all varieties (highest at Gilchester and lowest at Courtyard, although differences between Gilchester and Sheepdrove were not significant for the varieties Monsun and Zebra), (iii) Zn in all varieties (highest at Sheepdrove and lowest at Courtyard, although the ranking of varieties for grain Zn was different at each site), and (iv) Cd in the variety Tybalt only (highest at Gilchester and lowest at Courtyard) (Table 12).
Table 12.
Interaction means ±SE for effects of site and variety on phytic acid, Fe, Zn and Cd concentrations in spring wheat.
Significant interactions involving the growing season were also identified but not further investigated. Instead, redundancy analyses (RDA) were used to investigate the relative importance of climatic soil and variety as explanatory variables/drivers for grain quality (see Section 3.7 below).
3.6. Effects of Year, Site, and Fertililization on Grain Nutritional Quality Parameters in Spring Wheat cv Paragon
Results from the unfertilized control plots could not be included in the factorial ANOVA of data from the fertilization trials described in this section. We, therefore, used redundancy analyses (RDA) to investigate associations between all fertilization treatments (including no fertilizer input controls) and grain nutritional quality parameters (see Section 3.7.2).
A four-factor ANOVA identified significant main effects of the growing season for Fe, Zn, Cd, Ni, and Pb, but not phytic acid concentrations in wheat grain (Supplementary Table S7). Grain Fe concentrations were significantly higher and grain Zn, Cd, Ni, and Pb concentrations were lower in 2006 when compared with 2007 (Supplementary Table S7), the growing season that had (i) lower temperatures and solar radiation in all three sites and (ii) lower rainfall at Gilchester but higher rainfall at Courtyard and Sheepdrove (Supplementary Table S1).
A four-factor ANOVA detected significant main effects of the site for Fe, Zn, Cd, and Ni, but not phytic acid and Pb concentrations in wheat grain (Supplementary Table S7). Fe, Cd, and Ni concentrations were highest at Gilchester, while Zn concentrations were highest at Sheepdrove. Fe and Zn concentrations were lowest at Courtyard, and Cd and Ni concentrations were lowest at Sheepdrove, although the differences in Cd and Ni concentrations between Sheepdrove and Courtyard were not significant (Supplementary Table S7).
A four-factor ANOVA detected significant main effects of fertilizer type for grain Fe, Zn, and Cd concentrations but not phytic acid, Ni, or Pb concentrations, and there were no significant main effects of fertilizer input level (Supplementary Table S7). Fe, Zn, and Cd concentrations were significantly higher in grain produced with CMP or FYM + CMP as fertilizer compared with grain produced with FYM and GWC, although the difference in Cd concentration between grain produced with FYM + CMP, FYM, and GWC was not significantly different.
A four-factor ANOVA detected a wide range of interactions between year, site, fertilizer type, and/or fertilizer input level for Fe, Zn, Cd, and Pb, but not Ni concentrations in wheat grain (Supplementary Table S7). These interactions were further investigated by carrying out separate three-factor ANOVAs for data from each site (Table 13 and Table 14).
Table 13.
Main effect means ± SE and p-values for the effects of year, fertilizer type, and input level on iron (Fe) and zinc (Zn) concentrations in spring wheat cv Paragon at the Courtyard (COU), Gilchester (GIL), and Sheepdrove (SHE) trial sites.
Table 14.
Interaction means for effects of fertilizer type and input level on grain iron (Fe) concentration in spring wheat cv Paragon at Courtyard and Gilchester farms.
For grain Fe concentrations, a three-factor ANOVA detected significant main effects of (i) year at Sheepdrove only, (ii) fertilizer type at all three sites, and fertilizer input level at Courtyard only (Table 13).
As with grain yield and leaf chlorophyll levels, grain Fe concentrations were higher in 2006 compared with 2007 at all three sites, but the difference between years was only significant at Sheepdrove (Table 13).
Fe concentrations were highest when CP was used as fertilizer, and both CP and FYM + CP resulted in significantly higher grain Fe concentrations compared with FYM and GWC at Courtyard and Sheepdrove (Table 13). In contrast, at Gilchester, the use of FYM + CP resulted in higher grain Fe compared with the other three fertilizer types, although the difference between FYM + CP and GWC was not significant (Table 13).
At Courtyard and Gilchester, a three-factor ANOVA also detected a significant interaction between fertilizer type and input level for grain Fe concentration (Table 13 and Table 14). When this interaction was further investigated, significantly higher grain Fe concentrations were detected with the high fertilizer input level when CP was used as the fertilizer type at Courtyard (Table 14). In contrast, at Gilchester, no significant difference between fertilizer input levels was detected for all four fertilizer types, although it should be noted that the greatest difference between fertilizer input levels was detected when GWC was used as the fertilizer input (Table 14).
For grain Zn concentrations, a three-factor ANOVA detected significant main effects of year and fertilizer type at Courtyard and Sheepdrove only, and there were no significant main effects of fertilizer input level or significant interactions between fertilizer type and input level (Table 13). Grain Zn concentrations were lower in 2006 compared with 2007 at all three sites, but the difference between years was only significant at Courtyard and Sheepdrove. At both Courtyard and Sheepdrove, grain Zn concentrations were highest when CM was used as fertilizer and lowest when GWC was used as fertilizer. However, at Courtyard, the differences between CP, FYM, and FYM + CP were not significant, while at Sheepdrove, the use of CP as fertilizer resulted in significantly higher grain Zn concentrations when compared with the other fertilizer types (Table 13).
For grain Cd and Pb concentrations, a three-factor ANOVA detected significant main effects of the year at all three sites (Table 15). As with grain yield and leaf chlorophyll levels, grain Cd and Pb concentrations were higher in 2006 compared with 2007 in all three sites (Table 15). For grain Cd concentrations, a three-factor ANOVA also detected significant main effects of fertilizer type, but only at Courtyard and Gilchester (Table 15). At Courtyard, Cd concentrations were highest when CP, and lowest when GWC was used as fertilizer (Table 15). In contrast, at Gilchester, Cd concentrations were highest when GWC was used as fertilizer and lowest when FYM was used as fertilizer (Table 15). For Pb, a three-factor ANOVA also detected a significant main effect of fertilizer input type, but only at Courtyard, with the higher fertilizer input level resulting in higher grain Pb concentrations (Table 15).
Table 15.
Main effect means ± SE and p-values for the effects of year, fertilizer type, and input level on grain cadmium (Cd) and lead (Pb) concentrations in spring wheat cv Paragon at the Courtyard (COU), Gilchester (GIL), and Sheepdrove (SHE) trial sites.
A significant interaction between fertilizer type and input level was detected for grain Pb concentrations at Gilchester only (Table 15). When this interaction was further investigated, a significant difference between the two fertilizer input levels was only detected when GWC was used as fertilizer, with the higher fertilizer input level resulting in higher grain Pb concentrations (Table 16).
Table 16.
Interaction means for effects of fertilizer type and input level on grain lead (Pb) concentration in spring wheat cv Paragon at Gilchester farm.
Significant interactions involving the growing season were also detected but not further investigated. Instead, redundancy analyses (RDA) were used to investigate the relative importance of climatic soil and nutrient inputs from fertilizers as explanatory variables/drivers for grain quality (see Section 3.7 below).
3.7. Redundancy Analyses
Associations between climate, soil mineral content, variety, and/or fertilizer mineral input explanatory variables/drivers and (i) foliar disease severity, (ii) crop performance parameters, and (iii) grain phytic acid, mineral nutrient, and toxic metal concentrations were investigated using redundancy analyses (RDA). Although the growing periods and fields used for the variety and fertilizer trials were the same at all three farms (to generate the same soil and climatic background conditions at each site), the data from the variety and fertilizer trials were analyzed separately (Table 17). This allowed the relative strength (based on the % variation explained and F-value) of climate and soil mineral content drivers to be compared in the context of two contrasting agronomic innovation strategies (variety choice and fertilization regime) available to organic farmers (Table 17).
Table 17.
Proportion of variation explained and pseudo-F-values and p-values for the climatic, soil mineral content, and variety or fertilizer mineral input explanatory variables included in the redundancy analyses of the variety and fertilizer trial data.
Different from the factorial ANOVA, data from all fertilizer input levels (including the non-fertilized control treatment) could be included in the main RDA (Table 17, Figure 1 and Figure 2). In addition, a supplementary RDA was carried out in which the seven different fertilizer treatments were included as fixed explanatory variables/drivers to investigate associations between all fertilization treatments (including no fertilizer input controls) and crop health and performance and grain nutritional quality parameters (Supplementary Table S10 and Figure S1).
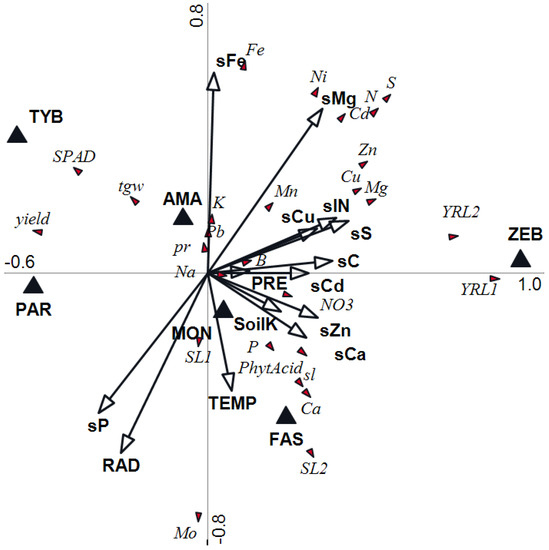
Figure 1.
Biplot derived from redundancy analysis shows the relationship between climate, soil chemical content, and wheat variety explanatory variables/drivers, and plant health, crop performance, and grain composition parameters as response variables. F- and p-values and the proportions of variation explained by different explanatory variables/drivers and F are shown in Table 17. Continuous explanatory variables/drivers are shown as arrows and include the (i) climatic parameters total radiation (RAD), total precipitation (PRE), and average daily temperature (TEMP) during the growing period, and (ii) total topsoil concentrations of C (sC), N (sIN), P (sP), K (sK), S (sS), Ca (sCa), Mg (sMg), Cu (sCu), Fe (sFe), Zn (sZn), and Cd (sCd). Fixed explanatory variables/drivers are shown as black triangles (▲) and include the five contrasting spring wheat varieties: Amaretto (AMA), Fasan (FAS), Paragon (PAR), Tybalt (TYB), and Zebra (ZEB). Response variables are shown as red arrow tips and include the (i) crop health parameters Septoria disease severity on the flag leaf (SL1) and the 2nd leaf (SL2), yellow rust on the flag leaf (YRL1) and 2nd leaf (YRL2), (ii) crop performance parameters grain yield (yield) (ii) grain protein content (pr), straw length (sl), thousand grain weight (tgw), (iii) grain concentrations of phytic acid (PhytAcid), the minerals N (N), P (P), K (K), S (S), Ca (Ca), Mg (Mg), Fe (Fe), Cu (Cu), Mn (Mn), Zn (Zn), B (B), and Mo (Mo), and the toxic metals Cd (Cd), Ni (Ni) and Pb (Pb).
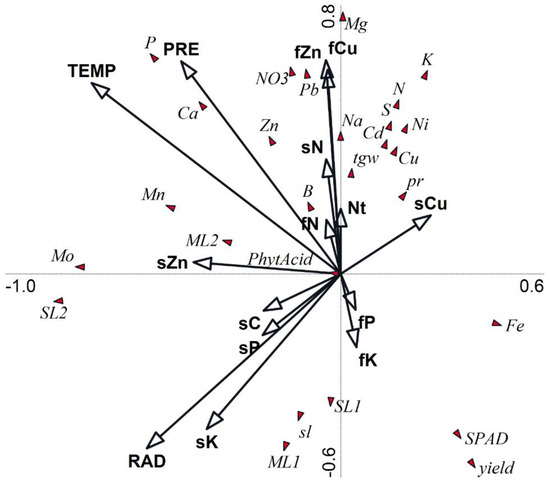
Figure 2.
Biplot derived from redundancy analysis shows the relationship between climate, soil chemical content, and fertilizer mineral input explanatory variables/drivers, and plant health, crop performance, and grain composition parameters as response variables. F- and p-values and the proportions of variation explained by different explanatory variables/drivers and F are shown in Table 17. Continuous explanatory variables/drivers are shown as arrows and include the (i) climatic parameters total radiation (RAD), total precipitation (PRE), and average daily temperature (TEMP) during the growing period (ii) total topsoil concentrations of C (sC), N (sN), P (sP), K (sK), S (sS), Ca (sCa), Mg (sMg), Cu (sCu), Fe (sFe), Zn (sZn), Cd (sCd); and (iii) fertilizer inputs of total N (Nt), available NO3/NH4-N (fN), P (fP), K (fK), Cu (fCu), and Zn (fZn). Response variables are shown as red arrow tips and include the (i) crop health parameters. Septoria disease severity on the flag leaf (SL1) and the 2nd leaf (SL2), yellow rust on the flag leaf (YRL1) and 2nd leaf (YRL2), (ii) crop performance parameters grain yield, (yield) (ii) grain protein content (pr), straw length (sl), thousand grain weight (tgw), (iii) grain concentrations of phytic acid (PhytAcid), the minerals N (N), P (P), K (K), S (S), Ca (Ca), Mg (Mg), Fe (Fe), Cu (Cu), Mn (Mn), Zn (Zn), B (B), and Mo (Mo), and the toxic metal Cd (Cd), Ni (Ni), and Pb (Pb).
3.7.1. Variety Trials
Climate, soil mineral content, and a variety of explanatory variables/drivers accounted for 58.3% of the variation (Table 17). The contrasting varieties explained 29% of the variation (F-value = 43.6) and soil mineral contents explained 21.5% of the variation (F-value = 49.5) and were stronger explanatory variables/drivers than climate, which only accounted for 10.8% of the variation (F-value: 25.2) (Table 17). RDA identified all three climate parameters (radiation, precipitation, and temperature) as highly significant explanatory variables/drivers (p = 0.002) in the variety trials (Table 17).
When the strength of individual climatic drivers was compared, radiation was the strongest (F-value = 12.6) and temperature was the weakest (F-value = 5.3) driver. RDA identified four of the soil minerals (Fe, Mg, P, and S) as significant (p < 0.05) explanatory variables/drivers, but the list of significant drivers and their relative strength differed between the variety and fertilization trials (Table 17). Specifically, in the variety trial, soil S (F-value = 16.6) was identified as the strongest driver, followed by soil Mg (F-value = 12.2), soil Fe (F-value = 8.8), and soil P (F-value = 5.0) concentrations (Table 17).
In the biplot resulting from the RDA of variety trial data, the horizontal axis 1 account for 36.0% of the variation and the vertical axis 2 for a further 9.8% (Figure 1). Specifically, the biplot shows that grain yield, leaf chlorophyll, and thousand grain weight (tgw) were most closely positively associated with the varieties Tybalt and Paragon and soil P concentrations and irradiation, but negatively associated with the varieties Zebra and Fasan, soil C, N, K, S, Ca, Mg, Cu, Zn, and Cd content, and to a lesser extent precipitation and temperature along axis 1 (Figure 1). In contrast, stem length and grain phytic acid, N, NO3, Mg, Cu, Mn, Zn, Cd, and Ni concentrations were all positively associated with the varieties Zebra and Fasan, soil C, N, K, S, Ca, Mg, Cu, Zn, and Cd content, and to a lesser extent precipitation and temperature along the positive axis 1 (Figure 1).
Yellow rust was most closely associated with the variety Amaretto along the positive axis 1, while Septoria severity, stem length, and grain P and Ca concentrations were positively associated with temperature, radiation, soil P and Ca content, and the varieties Monsun and Fasan along the negative axis 2 (Figure 1). Also, grain N, S, Fe, Cd, and Ni concentrations were positively associated with soil Fe and Mg concentrations along the positive axis 1 (Figure 1).
3.7.2. Fertilizer Trials
In the fertilizer trials, climate, soil mineral content, and fertilizer mineral input explanatory variables/drivers accounted for 62.7% of the variation. In contrast to the variety trials, climate accounted for 35.4% of variation (F-value = 94.4) and was a stronger driver than soil mineral content, which accounted for 16.8% of variation (F-value = 59.2), and fertilizer mineral input, which accounted for only 6.2% of variation (F-value = 21.6) (Table 17).
Similar to the variety trials, RDA identified all three climate parameters (radiation, precipitation, and temperature) as highly significant explanatory variables/drivers (p = 0.002) (Table 17). However, in the fertilizer trials, the relative strength of climatic drivers was different when compared to the variety trials, which were carried out in the same climatic background conditions (Table 14). Specifically, temperature was the strongest (F-value = 48.5), and precipitation the weakest (F-value = 6.5) driver (Table 17).
In the fertilizer trial, RDA identified four of the soil minerals (C, Cu, P, and Zn) as significant (p < 0.05) explanatory variables/drivers, but the list of significant soil mineral drivers differed from those identified in the variety trial (Table 17). Specifically, in the fertilizer trials, soil Zn (F-value = 23.8) was identified as the strongest driver, followed by soil P (F-value = 20.3), soil C (F-value = 9.2), and soil Cu (F-value = 3.0) (Table 17).
In the biplot derived from the RDA of fertilizer trial data, the horizontal axis 1 accounts for 24.5% of the variation and the vertical axis 2 for a further 17.1% (Figure 2). Specifically, the biplot shows that (i) grain yield and chlorophyll content were closely positively associated with fertilizer P and K inputs along both the positive axis 1 and negative axis 2, but negatively associated with temperature, precipitation, soil N content, and both total and available (NO3/NH4) N-inputs from fertilizer along the negative axis 1 and positive axis 2 (Figure 2). Also, grain yield, leaf chlorophyll content, and both powdery mildew and Septoria severity on the flag leaf were positively associated with radiation and soil C, P, and K content (Figure 2). However, mildew and Septoria severity were positively associated with radiation, precipitation, and temperature along axis 1.
It is also interesting to note that grain P-concentrations were more closely positively associated with precipitation and temperature (along both the negative axis 1 and positive axis 2) than (i) soil P-concentration and P-inputs from fertilizer. In contrast, for grain K-concentrations, a weak positive association was detected with K-inputs from fertilizer (along the positive axis 1) and a negative association with soil K content (along the negative axes 1 and 2). The TGW and grain protein, N, K, S, Mg, Na, and Cd concentrations were all positively associated with soil N content and both total and available (NO3/NH4) N-inputs from fertilizer (along the positive axis 1) but negatively associated with radiation and soil C, P, and K concentrations (along the negative axes 1 and 2) (Figure 2).
Grain Cu concentrations were positively associated with both soil Cu content and fertilizer Cu inputs along the positive axes 1 and/or 2, while grain Zn concentrations were positively associated with both soil Zn content and fertilizer Zn inputs along the negative axis 1 and positive axis 2 (Figure 2).
When the soil mineral inputs from fertilizers were replaced with the different fertilizer treatments as explanatory variables/drivers in the RDA, climate accounted for 35.4% of the variation (F-value = 94.6) and was a stronger driver than soil mineral content, which accounted for 16.8% of the variation (F-value = 59.2), and fertilizer input treatment, which accounted for 8.6% of the variation (F-value = 34.9) (Supplementary Table S10).
In the biplot derived from the RDA, which used fertilizer treatments as fixed response variables (Supplementary Figure S1), the horizontal axis 1 explained 24.5% of the variation and the vertical axis 2 explained a further 17.5%, and associations with (i) climate and (ii) soil mineral content were similar to those observed when mineral inputs from fertilizers were used as variable response variables (Supplementary Figure S1).
When fertilizer treatments were used as fixed response variables, Septoria and powdery mildew severity, stem length, and grain NO3, P, Mn, Zn, B, Mo, and Pb were positively associated with the higher fertilizer input level (250 kg N/ha) of FYM, CP, and FYM + CP along the negative axis 1 (Supplementary Figure S1).
In contrast, grain yields and Fe concentrations were positively associated with the use of GWC and to a lesser extent FYM at the lower (125 kg N/ha) input level along both the positive axes 1 and 2, while the thousand grain weight and grain protein, N, K, S, Ca, Mg, Cu, and S concentrations were positively associated with the use of GWC at the higher input level and CP or FYM + CP at the lower input level (Supplementary Figure S1). It is also important to note that the higher input levels of CP, FYM, and CP + FYM treatments were negatively associated with grain yield along both the negative axes 1 and 2 (Supplementary Figure S1).
4. Discussion
Since the introduction of legally binding EU standards in the early 2000s, organic wheat cultivation in the UK and other countries in northern Europe has expanded rapidly [3,6,7,12], and in 2022, a total of 15,000 ha in the UK and 165,000 ha in Germany were used for organic wheat production [30,31]. Although spring wheat is estimated to only account for 10–20% of total organic wheat production in the UK and Germany, the area of spring wheat production has increased in both countries in recent years [31,32]. In contrast, in Sweden and the Netherlands (NL), a larger proportion (~40% and ~65% in Sweden and the NL, respectively, in 2009) of the total organic wheat production area (~25,000 and ~2000 ha in Sweden and the NL, respectively, in 2009) is used for spring-sown crops [33].
Overall, spring wheat is thought to be of greater importance in organic farming systems (especially in regions with light, sandy soils) because it can utilize a larger proportion of N applied with green and animal manures prior to planting (by avoiding large N losses due to run-off and leaching from manure inputs in autumn over the winter period that often limit yields and protein content in winter wheat) and thereby more reliably achieve high protein contents and bread-making quality [3,6,7,12]. Also, different from winter wheat, spring cereals can be (i) established after late-harvested field vegetable crops (e.g., potatoes, brassicas), which are more frequently grown in organic compared with conventional arable rotations, and (ii) undersown with grass-clover in order to minimize nutrient losses and optimize N-fixation by grass-legume leys, which are an essential component in organic crop rotations [3,6,7,12].
Yields in organic cereal production were reported to be ~25% lower than those achieved in conventional production [34], and the organic farmers participating in this study also estimated that their spring wheat yields were around ~25% lower than those of neighboring conventional farms (Melchett, P. (Courtyard farm, Hunstanton, Norfolk, UK), Kindersley, P. (Sheepdrove farm, Lambourn, Berkshire, UK) and Wilkinson, A. (Gilchester farm, Stamfordham, Northumberland, UK), personal communication 2006).
Results from recently published factorial field experiments with winter wheat varieties of both common (T. aestivum) and spelt (T. spelta) wheat showed that both crop breeding/selection and fertilization innovations may increase grain yields, processing, and nutritional quality in organic bread-making wheat production systems [3,4,5,7,8,9,12,35,36,37]. These studies also suggested that (i) the use of longer-straw varieties can improve crop yield and quality in organic production systems compared with modern short-straw varieties [3,4,5,7,8,9,35,36,37], (ii) the use of organic fertilizers results in higher mineral micronutrient concentrations but lower Cd concentrations in wheat grain compared with crops grown with mineral NPK fertilizers [3,5,7,9,11,12], and (iii) there are highly significant interactions between pedo-climatic, variety and fertilization regimes (organic fertilizer input types and levels) factors for grain yield, quality, and safety parameters in organic production systems [3,11,12,35,36,37,38,39,40]. However, there is limited information on the effects of pedo-climatic, crop genetics, and fertilization regimes on the performance of spring wheat in organic production systems, although spring wheat is thought to be more suitable for obtaining bread-making quality in many northern European regions and especially areas with light sandy soils [3,6,12,37].
While winter wheat is typically sown in October and harvested in August, spring wheat is typically sown in March/April and harvested in September in the UK [37,41,42]. Nutrient (especially N) losses from fertilizers applied before sowing are known to be substantially higher in winter compared with spring crops, and this makes it difficult to obtain grain protein contents required for bread-making quality in organic winter wheat production, where spring applications of mineral N-fertilizers (which are widely used in conventional wheat production) are not permitted [3,7,37]. As a result, winter and spring wheat crops have contrasting (i) climatic background conditions, (ii) nutrient availability, and (iii) shoot and root growth patterns during the growing season, especially between crop emergence and tillering [37,41,42,43]. This also partially explains differences in (i) disease and pest pressure/incidence and (ii) crop responses to agronomic parameters (e.g., tillage and fertilization) between winter and spring wheat crops [37,41,42,43].
This study, uniquely, compared the effects of (i) different spring wheat varieties (Amaretto, Fasan, Monsun, Paragon, Tybalt, and Zebra) and (ii) contrasting organic fertilizer types and input levels used by organic farmers on the performance of spring wheat in three pedoclimatic environments/sites in the UK. Variety and fertilization trials were carried out in the same two growing seasons, thus providing the same climatic background conditions at each site. This allowed the relative importance of climatic, soil, variety, and fertilization explanatory variables/drivers to be compared by RDA across the variety and fertilization trials.
Overall, both ANOVA and RDA results indicate that improvements in spring wheat breeding/selection have a greater potential for increasing crop yield and quality parameters in the organic sector compared with optimization of fertilization practices.
RDA also showed that climatic explanatory variables/drivers (radiation, precipitation, and temperature during the growing season) explained a substantially larger proportion of the variation in fertilization (35.4%) compared with the variety (10.8%) trials. This suggests that climatic conditions during the growing season may augment crop yield and quality improvements resulting from changes in fertilization methods to a greater extent than yield and quality gains resulting from innovative breeding/selection programs for the organic spring wheat sector. It may also indicate that increases in crop yield and quality parameters resulting from genetic improvements may be affected to a lesser extent by climate change compared with improvements resulting from the optimization of fertilization regimes.
In contrast, RDA showed that soil explanatory variables/drivers (soil C, N, P, K, S, Ca, Mg, Cu, Fe, Zn, and Cd concentrations) explained a similar proportion of the variation in the variety (21.5%) and fertilization (16.8%) trials.
Overall, results from the ANOVA and RDA provide further evidence for the hypothesis that there is a greater need to focus on site-specific optimization of variety breeding/selection and agronomic practices in organic production systems compared with conventional wheat production systems [1,2,3,12,30,31].
Results obtained in the variety and fertilization trials are discussed in detail in separate sections below.
4.1. Effects of Variety in Contrasting Pedoclimatic Environments
Similar to results obtained in organic winter-wheat variety trials [3,4,5,7,8,9,12,35,36,37], significant variation in foliar disease severity, grain yield, and quality parameters was detected when the performance of six contrasting spring-wheat varieties (developed for the bread-making sector in different northern European countries) was compared at three UK sites with contrasting pedo-climatic conditions.
Results from winter wheat variety trials indicated that there may be positive associations between straw length and (i) disease resistance, (ii) grain protein content, and/or (iii) mineral micronutrient concentrations [3,4,5,9,35,36,37]. This hypothesis is not supported by the results obtained with the six spring wheat varieties compared in this study. Specifically, across all three sites, the shorter-straw varieties Paragon and Tybalt produced the highest yields and protein contents and had higher Fe and Zn concentrations compared with the variety Fasan, which produced the longest straw. However, similar results to those reported in this study were obtained in previous field experiments that compared the performance of spring wheat varieties in organic production backgrounds in both Canada and the UK [6,37]. This supports the hypothesis that the traits and trait combinations prioritized in breeding/selection programs for the organic spring wheat sector may be different from those targeted for organic winter wheat [3]. It has been suggested that the introduction of semi-dwarfing genes into modern wheat varieties has not only affected straw length but also root system parameters such as (i) rooting depth and root distribution patterns in soil, (ii) mycorrhizal colonization and function, (iii) root exudates and organic matter mineralization in the rhizosphere, and (iv) nutrient uptake capacity/efficiency from organic fertilizers [3,7,12,35,36,37,38,39,40]. Since the ability to take up nitrogen that has leached down the soil profile as nitrate over the winter period is more important for winter wheat (where fertilizer is applied in autumn) compared with spring wheat (where fertilizer is applied in late winter), this may, for example, explain correlations between straw length and grain yield and/or protein content in winter but not in spring wheat varieties. This should be investigated in future studies.
Results from the variety trials also support the conclusion of recent reviews on wheat breeding for the organic sector [2,3] that it is important to carry out final stage selection and variety adaptation (i) on organic farms and (ii) in a wide range of pedo-climatic environmental backgrounds representative of the main wheat growing areas in the UK [3]. For example, the need for region/site specific variety selection is supported by the finding that the highest grain yields were obtained by Paragon at the Gilchester site but by Tybald at the Sheepdrove and Courtyard sites, while the highest protein contents were produced by Tybalt at Gilchester and Paragon at the Sheepdrove and Courtyard sites. Also, Paragon produced higher grain Fe and similar Zn concentrations at Courtyard, while Tybalt produced higher Fe concentrations at Gilchester and Sheepdrove and higher Zn concentrations at Gilchester.
Overall, results suggest that it is possible to select spring wheat varieties that deliver both (i) high grain yields and foliar disease resistance (an important trait associated with yield stability in the UK) and (ii) the high processing and nutritional quality traits demanded by organic farmers and consumers [3]. Specifically, the two varieties with the highest grain yields in both growing seasons (Paragon and Tybalt) showed good levels of resistance against powdery mildew, yellow rust, and Septoria leaf blotch, which are the main yield-affecting foliar diseases in northern Britain [7,10,19]. It is important to note that lodging (which is a major yield-limiting factor in autumn-sown conventional cereal production in northern Britain) was not detected in any of the varieties in both seasons. This may have been due to (i) a lower lodging risk in spring compared with autumn-sown cereals and/or (ii) the organic crop management protocols used, since previous studies with winter wheat showed that lodging severity is significantly lower in organic compared with conventional crops (especially linked to reduced amounts of readily available N) [3,7,39,40]. In conventional production systems with high inputs of mineral N fertilizers, farmers use both fungicides and plant growth regulators (e.g., chlormequat) to reduce the risk of lodging [3,7,39,40,41,42,43].
This study also, for the first time, assessed the effect of variety on concentrations of the toxic metals Cd and Pb in organically produced spring wheat grain. Results show that there are significant differences in Cd but not Pb concentrations between varieties. Also, there appears to be no correlation between concentrations of the toxic metal Cd and the nutritionally desirable minerals Zn and Fe. For example, Paragon grain had relatively high Zn and Fe concentrations but the lowest Cd concentrations when compared to the other five varieties. In contrast, Monsun grain had the highest Cd but relatively low Zn and Fe concentrations. In this context, it is important to note that Zn and Fe are known to be mainly located in the bran and germ, while Cd (and also Se) were reported to be more evenly distributed throughout the cereal grain [3,9,10,11]. These results suggest that it is possible to breed/select wheat varieties for higher mineral nutrients and low Cd uptake capacity, which may be particularly important in regions with high soil cadmium levels due to pollution and/or (over-)use of phosphorus fertilizers with a high Cd content [44,45].
It is important to note that differences in climatic conditions between the two growing seasons had a greater relative impact on grain yield and most processing and nutritional quality parameters than variety choice. These findings should be considered in the context of the more extreme weather events predicted for the UK as a result of global climate change. For example, if extremely high or low rainfall events in June/July become more frequent (as predicted by many climate change models), this could have significant negative impacts on both spring wheat yields and quality in Northern Britain and will have to be considered when designing future wheat breeding programs [3,46].
In the variety trials at Gilchester, grain concentrations of vitamin E-isomers were also analyzed [47], because whole-grain cereal products are an important source of vitamin E, especially for individuals with a vegan diet [48]. Vit E is a fat-soluble antioxidant that is mainly present in the germ fraction of cereal grains, and refining of cereal grains removes most of the grain Vit E [47,48,49]. Results suggest that there is significant variation in Vit E content and that it may also be possible to breed or select varieties with higher Vit E content [47].
4.2. Effects of Fertilization Regimes in Contrasting Pedo-Climatic Environments
Several factorial field experiments [3,4,5,7,9,11,12,35,36,37,38,39,40] have demonstrated that both differences in variety choice and agronomic practices (e.g., contrasting rotation, fertilization, and crop protection regimes) contribute to the (i) lower grain yields reported for organic compared with conventional cereal production systems [34] and (ii) lower protein and Cd concentrations but higher phenolic/antioxidant and mineral micronutrient (e.g., Cu, Fe, Se, Zn) concentrations found in inorganic compared with conventional wheat grain/products [9,10,50,51].
Previous studies also suggest that the main challenge for producing bread-making quality wheat in organic farming systems is the provision of a high enough N-supply (especially during the later stages of crop development, e.g., grain filling) [3,12,35,36,37,47,52]. This is mainly because (i) permitted organic N-inputs (green and animal manures, waste-based composts, dried legume biomass pellets) are applied before sowing, and (ii) water-soluble, immediately plant-available, mineral N inputs (which can be applied to conventional spring wheat crops later in the growing season to increase protein content/bread making quality) are not permitted in organic farming systems [3,12,52]. Also, EU environmental legislation limits annual manure input to 170 kg N/ha, which is significantly lower than the N required by modern spring wheat varieties for high yield and protein contents, especially when considering that only ~50% of the N from manure inputs becomes plant available in the first growing season after application [3,12]. However, the limit of 170 kg N/ha operates as an average at the farm level, and organic farmers are permitted and often do use higher manure input levels for crops with a high N-demand, such as wheat and potatoes, and balance this by using lower or no manure inputs in crops such as forage and grain legumes [3,12].
Strategies available to increase N-availability in organic spring wheat crops include (i) growing wheat crops after legume leys, (ii) using organic fertilizers with a higher available N-content, such as chicken manure pellets (CMP), or (iii) applying half the total manure-based N-input to the growing crop later in the growing season. However, there is limited information on the effect of implementing these strategies (especially strategies ii and iii) on organic spring wheat performance [3,12,37].
The fertilizer trials reported here were all carried out with (i) the variety Paragon (which was one of the two best-performing varieties in the variety trials) and (ii) grass/clover or clover leys as the preceding crop to provide optimum residual soil N levels. Results from the fertilizer trials confirmed that compared with farm yard manure (FYM) or greenhouse waste compost (GWC), the use of CMP or a combination of FYM and CMP (CMP + FYM) will increase the N-supply (estimated from chlorophyll concentration/SPAD) and grain protein content of spring wheat. However, it is important to consider that (i) SPAD assessments are not a very accurate indirect marker/indicator for N-supply and should be supplemented with plant tissue analyses in future studies as previously recommended [53] and (ii) the effect of different fertilizer types on grain yields differed significantly between sites. Also, the finding that the CMP and CMP + FYM treatments also resulted in the lowest yields at Sheepdrove and Gilchester, respectively, may suggest that in these sites, the effect of these treatments on grain protein concentrations was at least partially due to a concentration effect resulting from the lower grain yields.
Overall, results suggest that similar to variety selection, there is a need for site-specific optimization of fertilization regimes for bread-making spring wheat production. For example, the highest yields were obtained with FYM at Gilchester but GWC at Courtyard and Sheepdrove. Also, although the RDA results suggest that the lower (125 kg N/ha) fertilizer input level (especially GWC and FYM) resulted in an increase in grain yield compared to unfertilized controls, ANOVA detected no effect of increasing fertilizer input levels from 125 kg to 250 kg N/ha on crop yields, while RDA identified a negative association between grain yield and CP, FYM, and CP + FYM applied at the higher input levels (250 kg/ha). The fact that optimum yields were achieved with the lower fertilizer input level was not unexpected because wheat was grown after N-fixing in grass-clover leys in all three sites; this will have increased the amount of available N in soils, which is recognized as the main growth/yield limiting factor in organic wheat production systems [52].
In contrast, increasing the fertilizer input level significantly increased protein contents in all three sites, and at Sheepdrove, only the higher fertilizer input level achieved the minimum protein contents (≥12.5%) demanded by UK millers/processors for bread-making quality organic wheat [3].
Previous factorial field experiments with winter wheat reported that fertilizer type and input level also affect concentrations of nutritionally relevant mineral micronutrients and/or toxic metals in wheat grain and other crops [5,9,11,12,13]. Most importantly, the use of mineral NPK fertilizers resulted in lower concentrations of micronutrients (Cu, Fe, Se, and/or Zn) but higher concentrations of the toxic metal Cd in wheat grain in several studies [5,9,11,12,13,51].
In the study reported here, only organic fertilizers widely used by organic farmers were compared, but uniquely, comparisons were made in three different soil types and six different climatic background conditions. Across all three sites, the use of the CMP resulted in higher Fe, Zn, Cd, Ni, and Pb concentrations, but both ANOVA and RDA results suggest that there are significant interactions between site-specific pedo-climatic conditions and fertilizer type for both the concentrations of mineral micronutrients and toxic metals. Also, the RDA showed that climatic variables explained a substantially larger proportion of the total variation (35.4%) than both the soil (16.8%) and fertilizer mineral (6.2%) concentrations. This suggests that climate change is likely to have a greater impact on concentrations of micronutrients and toxic metals in spring wheat grain than site-specific soil conditions and the organic fertilizer type used by organic farmers.
Compared with the sandy loam/clay loam soils at Gilchester Farm, the content and/or bioavailability of micronutrients are known to be lower in light and calcareous soils such as those found at Courtyard and Sheepdrove Farm, respectively [54,55]. In some light and calcareous UK soils, certain micronutrients (e.g., Cu, Mn, and Zn) may become growth/yield limiting in wheat crops, and this may be addressed by the use of micronutrient fertilizer inputs and/or the build-up of soil organic matter [54,55]. This may therefore also, at least partially, explain the differences in grain yield and micronutrient concentrations between the three sites.
One strategy to further improve yields and quality in organic spring wheat production may be the use of bioinoculants or biostimulant products [56,57,58,59,60]. These products may contain a wide range of different materials, including plant growth-promoting microbes, humic acids, fulvic acid extracts, plant hormones, vitamins, enzymes, sea kelp, and fish emulsion, and some (e.g., fulvic acid-based products) were reported to increase wheat yields, N-use efficiency, and/or grain quality parameters [59]. However, since these products are currently not widely used in UK organic production, they were not included in the crop management protocols used in the trials reported here.
5. Conclusions
Overall, this study indicates that the development of organic farming spring wheat breeding/selection programs has a greater potential to improve organic spring wheat grain yields, processing, and nutritional quality compared with efforts to further optimize fertilization regimes.
Results from the variety trials also suggest it is feasible to breed/select spring wheat varieties that combine high protein, vitamin E, and mineral micronutrients with low toxic metal (Cd, Pb) concentrations when produced under organic farming conditions. However, results also indicate that the traits targeted in spring wheat breeding/selection programs may have to be different from those targeted for winter wheat.
The strategic use of CMP (an organic fertilizer with a high water-soluble N content) was also confirmed as a suitable method to increase the protein content and also increase grain Fe and Zn concentrations. However, the use of CMP also increased grain concentrations of the toxic metal Cd. The study also suggests that only moderate (equivalent to 125 kg N/ha) organic fertilizer inputs are required to obtain optimum grain yields in organic spring wheat grown after grass/clover or clover leys, even on sandy and calcareous soils.
The study provided further evidence that both variety choice and fertilization regimes used in organic farming contribute to the lower yields and higher nutritional quality of organic compared with conventional spring wheat grain.
Results provided further evidence that the impacts of climate change should be taken into consideration when designing crop breeding/selection and agronomic innovation-focused R&D programs.
Supplementary Materials
The following supporting information can be downloaded at: https://www.mdpi.com/article/10.3390/agronomy13092349/s1, Supplementary Table S1. Mean daily temperature, monthly rainfall, and solar radiation 1 at Gilchester (GIL), Sheepdrove (SHE), and Courtyard (COU) farm during the spring wheat growing seasons in 2006 and 2007; Supplementary Table S2. Carbon and macronutrient concentrations in soils at Gilchester (GIL), Sheepdrove (SHE), and Courtyard (COU) farm prior to the drilling of spring wheat in the 2006 and 2007 growing seasons; Supplementary Table S3. Dates of incorporation of clover, planting of wheat crops, mechanical weed control, and harvest of winter and spring wheat varieties in the three field trial sites; Supplementary Table S4. Interaction means ± SE for effects of site and wheat variety on yellow rust severity (% leaf area infected) at GS65; Supplementary Table S5. Main effect means ± SE and p-values for the effects of year, site, and fertilizer type and the input level on spring wheat cv Paragon disease severity (% of leaf area infected) at GS 65; Supplementary Table S6. Main effect means ± SE and p-values for the effects of year, site, fertilizer type, and input level on grain yield and protein content, leaf chlorophyll levels (SPAD), and straw length, in spring wheat; Supplementary Table S7. Main effect means ± SE and p-values for the effects of year, site, fertilizer type, and input level on phytic acid selected grain mineral micronutrient (Fe, Zn) and toxic metal (Cd, Ni, Pb) concentrations in spring wheat; Table S8. Proportion of variation explained and pseudo-F-values and p-values for the climatic, soil mineral content, and fertilizer treatment (RDA 1) or fertilizer mineral input (RDA 2) explanatory variables included in the redundancy analyses of the fertilizer trial data. Supplementary Table S9. Interaction means for effects of year and variety on α- and β-tocopherol concentrations in spring wheat grain. Supplementary Table S10. Proportion of variation explained and pseudo F-values and p-values for the climatic, soil mineral content, and fertilizer treatment (RDA 1) or fertilizer mineral input (RDA 2) explanatory variables included in the redundancy analyses of the fertilizer trial data. Supplementary Figure S1. A biplot derived from redundancy analysis shows the relationship between climate, soil chemical content, and fertilizer mineral input for wheat variety explanatory variables/drivers, and plant health, crop performance, and grain composition parameters as response variables.
Author Contributions
Conceptualization, A.W., P.S., S.W., L.R. and C.L.; methodology, A.W., J.N.W., P.S., I.C., L.O., L.R. and C.L.; software, J.N.W. and L.R.; validation, J.N.W., G.H., P.B., P.O.I., S.W., L.R. and C.L.; formal analysis, A.W., J.N.W., P.S., L.R. and C.L.; investigation, A.W., P.S., E.K.S., G.H., N.V., I.C., L.O. and L.R.; resources, A.W., P.B. and C.L.; data curation, A.W., J.N.W., P.S. and L.R.; writing—original draft A.W. and C.L.; writing—review and editing, A.W., J.N.W., P.S., E.K.S., G.H., N.V., I.C., L.O., P.B., P.O.I., S.W., L.R. and C.L.; visualization, A.W., L.R. and C.L.; supervision, P.S., P.B., S.W. and C.L.; project administration, A.W., P.B., S.W. and C.L.; funding acquisition, A.W., S.W. and C.L. All authors have read and agreed to the published version of the manuscript.
Funding
This research was funded by the European Union Integrated Project Quality Low Input Food (Grant number 506358), the DEFRA LINK project Better Organic Bread (BOB), and Gilchester Organics Ltd.
Data Availability Statement
Data will be made available upon reasonable request by authors Andrew Wilkinson and Leonidas Rempelos.
Acknowledgments
The authors gratefully acknowledge the administrative support from Sybille Wilkinson, Lois Bell, Jenny Gilroy, and Dave Whittock.
Conflicts of Interest
Andrew Wilkinson and Carlo Leifert own and manage organic farms. The authors declare no other potential conflict of interest.
References
- Lammerts van Bueren, E.T.; Jones, S.S.; Tamm, L.; Murphy, K.M.; Myers, J.R.; Leifert, C.; Messmer, M.M. The need to breed crop varieties suitable for organic farming, using wheat, tomato and broccoli as examples: A review. NJAS-Wagen. J. Life Sc. 2010, 58, 193–205. [Google Scholar] [CrossRef]
- Lammerts van Bueren, E.T.; Struik, P.C.; van Eekeren, N.; Nuijten, E. Towards resilience through systems-based plant breeding. A review. Agron. Sustain. Dev. 2018, 38, 42. [Google Scholar] [CrossRef] [PubMed]
- Rempelos, L.; Wang, J.; Sufar, E.K.; Almuayrifi, M.S.B.; Knutt, D.; Leifert, H.; Leifert, A.; Wilkinson, A.; Shotton, P.; Hasanaliyeva, G.; et al. Breeding Bread-Making Wheat Varieties for Organic Farming Systems: The Need to Target Productivity, Robustness, Resource Use Efficiency and Grain Quality Traits. Foods 2023, 12, 1209. [Google Scholar] [CrossRef]
- Wang, J.; Baranski, M.; Korkut, R.; Kalee, H.A.; Wood, L.; Bilsborrow, P.; Janovska, D.; Leifert, A.; Winter, S.; Willson, A.; et al. Performance of Modern and Traditional Spelt Wheat (Triticum spelta) Varieties in Rain-Fed and Irrigated, Organic and Conventional Production Systems in a Semi-Arid Environment; Results from Exploratory Field Experiments in Crete, Greece. Agronomy 2021, 11, 890. [Google Scholar] [CrossRef]
- Wang, J.; Baranski, M.; Korkut, R.; Kalee, H.A.; Wood, L.; Willson, A.; Barkla, B.; Iversen, P.O.; Bilsborrow, P.; Rempelos, L.; et al. Effect of irrigation, fertiliser type and variety choice on grain yield and nutritional quality parameters in spelt wheat (Triticum spelta) grown under semi-arid conditions. Food Chem. 2021, 358, 129826. [Google Scholar] [CrossRef] [PubMed]
- Kirk, A.P.; Fox, S.L.; Entz, M.H. Comparison of organic and conventional selection environments for spring wheat. Plant Breed. 2012, 131, 687–694. [Google Scholar] [CrossRef]
- Rempelos, L.; Almuayrifi, M.S.B.; Barański, M.; Tetard-Jones, C.; Barkla, B.; Cakmak, I.; Ozturk, L.; Cooper, J.; Volakakis, N.; Hall, G.; et al. The effect of agronomic factors on crop health and performance of winter wheat varieties bred for the conventional and the low input farming sector. Field Crops Res. 2020, 254, 107822. [Google Scholar] [CrossRef]
- Murphy, K.M.; Campbell, K.G.; Lyon, S.R.; Jones, S.S. Evidence of varietal adaptation to organic farming systems. Field Crops Res. 2007, 102, 172–177. [Google Scholar] [CrossRef]
- Bin Daud, M.F.; Rempelos, L.; Cakmak, I.; Leifert, C.; Bilsborrow, P. Increasing grain selenium concentration via genetic and agronomic innovations. Plant Soil 2023, accepted for publication, in press. [Google Scholar]
- Wang, J.; Chatzidimitriou, E.; Wood, L.; Hasanalieva, G.; Markellou, E.; Iversen, P.O.; Seal, C.; Baranski, M.; Vigar, V.; Ernst, L.; et al. Effect of wheat species (Triticum aestivum vs T. spelta), farming system (organic vs conventional) and flour type (wholegrain vs white) on composition of wheat flour—Results of a retail survey in the UK and Germany-2. Antioxidant activity, and phenolic and mineral content. Food Chem. X 2020, 6, 100091. [Google Scholar] [CrossRef]
- Cooper, J.; Sanderson, R.; Cakmak, I.; Ozturk, L.; Shotton, P.; Carmichael, A.; Haghighi, R.S.; Tetard-Jones, C.; Volakakis, N.; Eyre, M.; et al. Effect of organic and conventional crop rotation, fertilization and crop protection practices on metal contents in wheat (Triticum aestivum). J. Agric. Food Chem. 2011, 59, 4715–4724. [Google Scholar] [CrossRef]
- Rempelos, L.; Baranski, M.; Wang, J.; Adams, T.N.; Adebusuyi, K.; Beckman, J.J.; Brockbank, C.J.; Douglas, B.S.; Feng, T.; Greenway, J.D.; et al. Integrated Soil and Crop Management in Organic Agriculture: A Logical Framework to Ensure Food Quality and Human Health? Agronomy 2021, 11, 2494. [Google Scholar] [CrossRef]
- Rempelos, L.; Baránski, M.; Sufar, E.K.; Gilroy, J.; Shotton, P.; Leifert, H.; Srednicka-Tober, D.; Hasanaliyeva, G.; Rosa, E.A.S.; Hajslova, J.; et al. Effect of climatic conditions, and agronomic practices used in organic and conventional crop production on yield and nutritional composition parameters in potato, cabbage, lettuce and onion; results from the long-term NFSC-trials. Agronomy 2023, 13, 1225. [Google Scholar] [CrossRef]
- Tamm, L.; Thürig, B.; Bruns, C.; Fuchs, J.G.; Köpke, U.; Leifert, C.; Mahlberg, N.; Nietlispach, B.; Laustela, M.; Schmidt, C.; et al. Soil type, management history, and soil amendments influence the development of soilborne (Rhizoctonia solani, Pythium ultimum) and airborne (Phytophthora infestans, Hyaloperonospora parasitica) diseases. Eur. J. Plant Pathol. 2010, 127, 465–481. [Google Scholar] [CrossRef]
- Lori, M.; Symanczik, S.; Mäder, P.; de Deyn, G.; Gattinger, A. Organic farming enhances soil microbial abundance and activity—A meta-analysis and meta-regression. PLoS ONE 2017, 12, e0180442. [Google Scholar] [CrossRef] [PubMed]
- Bai, Z.; Caspari, T.; Ruiperez Gonzalez, M.; Batjes, N.H.; Mäder, P.; Bünemann, E.K.; de Goede, R.; Brussaard, L.; Xu, M.; Santos Ferreira, C.S. Effects of agricultural management practices on soil quality: A review of long-term experiments for Europe and China. Agric. Ecosyst. Environ. 2018, 264, 1–7. [Google Scholar] [CrossRef]
- Krauss, M.; Berner, A.; Perrochet, F.; Frei, R.; Niggli, U.; Mäder, P. Enhanced soil quality with reduced tillage and solid manures in organic farming—A synthesis of 15 years. Sci. Rep. 2020, 10, 4430. [Google Scholar] [CrossRef] [PubMed]
- Rotchés-Ribalta, R.; Sans, F.X.; Mayer, J.; Mäder, P. Long-term farming systems and last crop sown shape the species and functional composition of the arable weed seed bank. Appl. Veg. Sci. 2020, 23, 428–440. [Google Scholar] [CrossRef]
- Gross, A.; Glaser, B. Meta-analysis on how manure application changes soil organic carbon storage. Sci. Rep. 2021, 11, 5516. [Google Scholar] [CrossRef]
- Krause, H.-M.; Stehle, B.; Mayer, J.; Mayer, M.; Steffens, M.; Mäder, P.; Fliessbach, A. Biological soil quality and soil organic carbon change in biodynamic, organic, and conventional farming systems after 42 years. Agron. Sustain. Dev. 2022, 42, 117. [Google Scholar] [CrossRef]
- Hodge, C.A.H.; Burton, R.G.O.; Corbett, W.M.; Evans, R.; Searle, R.S. Soils and Their Use in Eastern England; Soil Survey of England and Wales: Harpenden, UK, 1984. [Google Scholar]
- AHDB. HGCA Recommended Lists 2011/12 for Cereals and Oilseeds; Agricultural & Horticultural Development Board (AHDB): Stoneleigh, UK, 2010. [Google Scholar]
- Polley, R.W.; Thomas, M.R. Surveys of diseases of winter wheat in England and Wales, 1976–1988. Ann. Appl. Biol. 1991, 119, 1–20. [Google Scholar] [CrossRef]
- Zadoks, J.C.; Chang, T.T.; Konzak, C.F. A decimal code for the growth stages of cereals. Weed Res. 1974, 14, 415–421. [Google Scholar] [CrossRef]
- Crawley, M.J. The R Book; John Wiley & Sons Ltd.: Chichester, UK, 2007. [Google Scholar]
- R Development Core Team. R: A Language and Environment for Statistical Computing; R Foundation for Statistical Computing: Vienna, Austria, 2012; Available online: http://www.R-project.org/ (accessed on 17 February 2022).
- Pinheiro, J.C.; Bates, D.M. Mixed-Effects Models in S and S-Plus; Springer: New York, NY, USA, 2000. [Google Scholar]
- Hothorn, T.; Bretz, F.; Westfall, P. Simultaneous inference in general parametric models. Biom. J. 2008, 50, 346–363. [Google Scholar] [CrossRef]
- Ter Braak, C.; Šmilauer, P. Canoco Reference Manual and User’s Guide: Software for Ordination, Version 5.0; Microcomputer Power: New York, NY, USA, 2012; p. 496. [Google Scholar]
- DEFRA. Organic Farming Statistics. 2022. Available online: https://www.gov.uk/government/statistics/organic-farming-statistics-2022/organic-farming-statistics-2022 (accessed on 1 August 2023).
- Statistisches Bundesamt. Area under Winter Wheat in 2022 at Previous Year’s Level. Available online: https://www.destatis.de/EN/Press/2022/05/PE22_209_412.html (accessed on 1 August 2023).
- KWS. Why Increasing Numbers of UK Growers Are Turning to Spring Wheat. Available online: https://www.kws.com/gb/en/products/cereals/news/why-increasing-numbers-of-uk-growers-are-turning-to-spring-wheat/ (accessed on 1 August 2023).
- Hussain, A. Quality of Organically Produced Wheat from Diverse Origin. Ph.D. Thesis, Swedish University of Agricultural Sciences, Uppsala, Sweden, 2012. Available online: http://www.bicga.org.uk/docs/Quality%20of%20Organically%20Produced%20Wheat.pdf (accessed on 1 August 2023).
- Seufert, V.; Ramankutty, N.; Foley, J.A. Comparing the yields in organic and conventional agriculture. Nature 2012, 485, 229–234. [Google Scholar] [CrossRef]
- Magistrali, A. Evaluating Alternative Fertilisers and Their Impact on Yield and Quality of Spelt and Rye under Different Management Systems. Ph.D. Thesis, Newcastle University, Newcastle upon Tyne, UK, 2020. [Google Scholar]
- Magistrali, A.; Vavera, R.; Janovska, D.; Rempelos, L.; Cakmak, I.; Leifert, C.; Grausgruber, H.; Butler, G.; Wilkinson, A.; Bilsborrow, P. Evaluating the effect of agronomic management practices on the performance of differing spelt (Triticum spelta) cultivars in contrasting environments. Field Crops Res. 2020, 255, 107869. [Google Scholar] [CrossRef]
- Wilkinson, A.; Wilkinson, J.N.; Shotton, P.; Eyre, M.; Hasanaliyeva, G.; Bilsborrow, P.; Leifert, C.; Rempelos, L. Effect of Clover Sward Management on Nitrogen Fixation and Performance of Following Spring- and Winter Wheat Crops; Results of a 3-Year Pilot Study. Agronomy 2022, 12, 2085. [Google Scholar] [CrossRef]
- Bernhoft, A.; Wang, J.; Leifert, C. Effect of Organic and Conventional Cereal Production Methods on Fusarium Head Blight and Mycotoxin Contamination Levels. Agronomy 2022, 12, 797. [Google Scholar] [CrossRef]
- Bilsborrow, P.; Cooper, J.; Tétard-Jones, C.; Średnicka-Tober, D.; Barański, M.; Eyre, M.; Shotton, P.; Volakakis, N.; Cakmak, I.; Ozturk, L.; et al. The effect of organic and conventional crop production systems on the yield and quality of wheat (Triticum aestivum) grown in a long-term field trial. Eur. J. Agron. 2013, 51, 71–80. [Google Scholar] [CrossRef]
- Rempelos, L.; Almuayrifi, A.M.; Baranski, M.; Tetard-Jones, C.; Eyre, M.; Shotton, P.; Cakmak, I.; Ozturk, L.; Cooper, J.; Volakakis, N.; et al. Effects of agronomic management and climate on leaf phenolic profiles, disease severity and grain yield in organic and conventional wheat production systems. J. Agric. Food Chem. 2018, 66, 10369–10379. [Google Scholar] [CrossRef]
- AHDB. Wheat Growth Guide. Available online: https://ahdb.org.uk/knowledge-library/wheat-growth-guide (accessed on 25 June 2013).
- ADHB. Crop Development. Available online: https://ahdb.org.uk/cereals-oilseeds/crop-development-report (accessed on 25 June 2013).
- Janusauskaite, D.; Feiziene, D.; Feiza, V. The effect of tillage, fertilization and residue management on winter wheat and spring wheat physiological performance. Acta Physiol. Plant. 2022, 44, 75. [Google Scholar] [CrossRef]
- Kubier, A.; Wilkin, R.T.; Pichler, T. Cadmium in soils and groundwater: A review. Appl. Geochem. 2019, 108, 1–16. [Google Scholar] [CrossRef]
- Roberts, T.J. Cadmium and Phosphorous Fertilizers: The Issues and the Science. Procedia Eng. 2014, 83, 52–59. [Google Scholar] [CrossRef]
- Harkness, C.; Semenov, M.A.; Areal, F.; Senapati, N.; Trnka, M.; Balek, J.; Bishop, J. Adverse weather conditions for UK wheat production under climate change. Agric. For. Meteorol. 2020, 282–283, 107862. [Google Scholar] [CrossRef] [PubMed]
- Wilkinson, A. Improving the Agronomic Management and Utilisation of Organic Bread Making Wheat. Ph.D. Thesis, Newcastle University, Newcastle upon Tyne, UK, 2018. [Google Scholar]
- Bakaloudi, D.R.; Halloran, A.; Rippin, H.L.; Oikonomidou, A.C.; Dardavesis, T.I.; Williams, J.; Wickramasinghe, K.; Breda, J.; Chourdakis, M. Intake and adequacy of the vegan diet. A systematic review of the evidence. Clin. Nutr. 2021, 40, 3503–3521. [Google Scholar] [CrossRef] [PubMed]
- Brigelius-Flohé, R.; Kelly, F.J.; Salonen, J.T.; Neuzil, J.; Zingg, J.-M.; Azzi, A. The European perspective on vitamin E: Current knowledge and future research. Am. J. Clin. Nutr. 2002, 76, 703–716. [Google Scholar] [CrossRef]
- Barański, M.; Średnicka-Tober, D.; Volakakis, N.; Seal, C.; Sanderson, R.; Stewart, G.B.; Benbrook, C.; Biavati, B.; Markellou, E.; Giotis, H.; et al. Higher antioxidant and lower cadmium concentrations and lower incidence of pesticide residues in organically grown crops: A systematic literature review and meta-analysis. Br. J. Nutr. 2014, 112, 794–811. [Google Scholar] [CrossRef]
- Hasanaliyeva, G.; Sufar, E.K.; Wang, J.; Rempelos, L.; Volakakis, N.; Iversen, P.O.; Leifert, C. Effects of agricultural intensification on Mediterranean Diets; a critical review. Foods 2023. submitted. [Google Scholar]
- Berry, P.M.; Sylvester-Bradley, R.; Philipps, L.; Hatch, D.J.; Cuttle, S.P.; Rayns, F.W.; Gosling, P. Is the productivity of organic farms restricted by the supply of available nitrogen? Soil Use Manag. 2002, 18, 248–255. [Google Scholar] [CrossRef]
- Yue, X.; Hu, Y.; Zhang, H.; Schmidhalter, U. Evaluation of Both SPAD Reading and SPAD Index on Estimating the Plant Nitrogen Status of Winter Wheat. Int. J. Plant Prod. 2020, 14, 67–75. [Google Scholar] [CrossRef]
- Dhaliwal, S.S.; Naresh, R.K.; Mandal, A.; Singh, R.; Dhaliwal, M.K. Dynamics and transformations of micronutrients in agricultural soils as influenced by organic matter build-up: A review. Environ. Sustain. Indic. 2019, 1–2, 100007. [Google Scholar] [CrossRef]
- McGrath, S.P.; Stobart, R.; Blake-Kalff, M.M.; Zhao, F.J.; HGCA Project Report No. 518 Current Status of Soils and Responsiveness of Wheat to Micronutrient Applications. 2013. Available online: https://projectblue.blob.core.windows.net/media/Default/Research%20Papers/Cereals%20and%20Oilseed/pr518-final-project-report.pdf (accessed on 1 August 2023).
- Calvo, P.; Nelson, L.; Kloepper, J.W. Agricultural uses of plant biostimulants. Plant Soil 2014, 383, 3–41. [Google Scholar] [CrossRef]
- Van Oosten, M.J.; Pepe, O.; De Pascale, S.; Silletti, S.; Maggio, A. The role of biostimulants and bioeffectors as alleviators of abiotic stress in crop plants. Chem. Biol. Technol. Agric. 2017, 4, 5. [Google Scholar] [CrossRef]
- Peter, A.J.; Amalraj, E.L.D.; Talluri, V.R. Commercial Aspects of Biofertilizers and Biostimulants Development Utilizing Rhizosphere Microbes: Global and Indian Scenario. In Rhizosphere Microbes. Microorganisms for Sustainability; Sharma, S.K., Singh, U.B., Sahu, P.K., Singh, H.V., Sharma, P.K., Eds.; Springer: Singapore, 2020; Volume 23. [Google Scholar]
- Maignan, V.; Géliot, P.; Avice, J.C. Glutacetine® Biostimulant Applied on Wheat under Contrasting Field Conditions Improves Grain Number Leading to Better Yield, Upgrades N-Related Traits and Changes Grain Ionome. Plants 2021, 10, 456. [Google Scholar] [CrossRef] [PubMed]
- Drobek, M.; Frąc, M.; Cybulska, J. Plant Biostimulants: Importance of the Quality and Yield of Horticultural Crops and the Improvement of Plant Tolerance to Abiotic Stress—A Review. Agronomy 2019, 9, 335. [Google Scholar] [CrossRef]
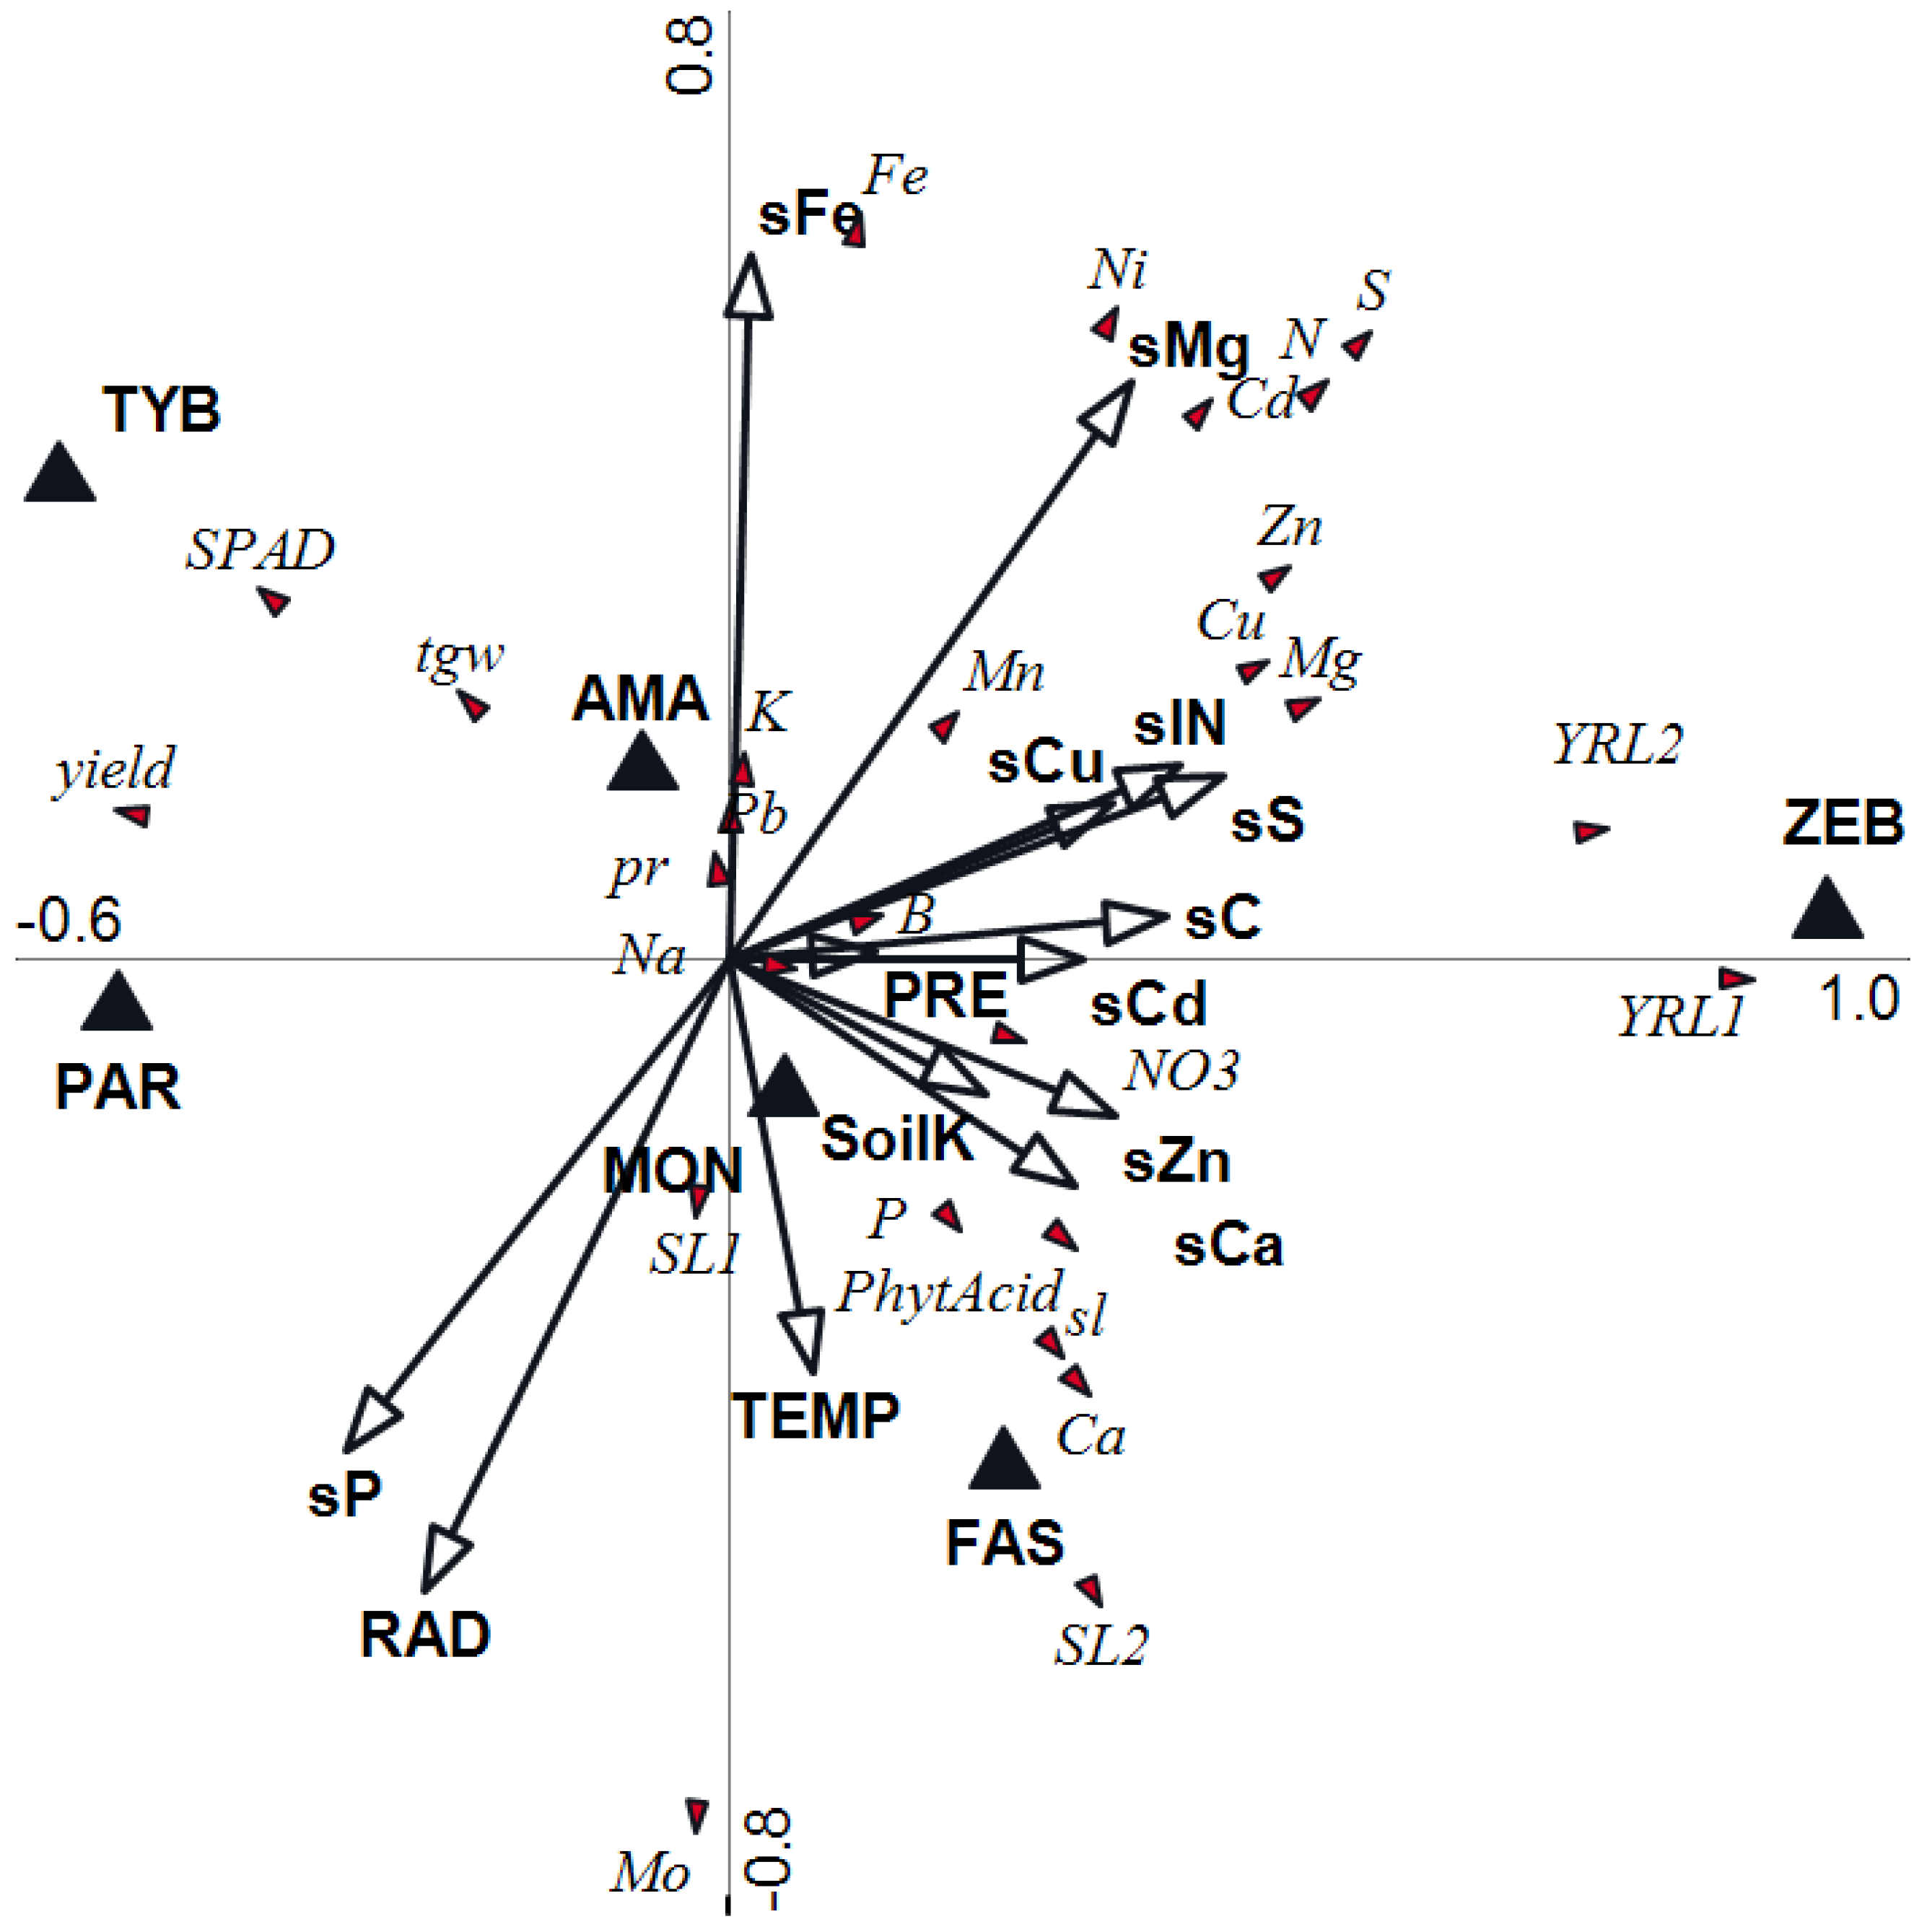
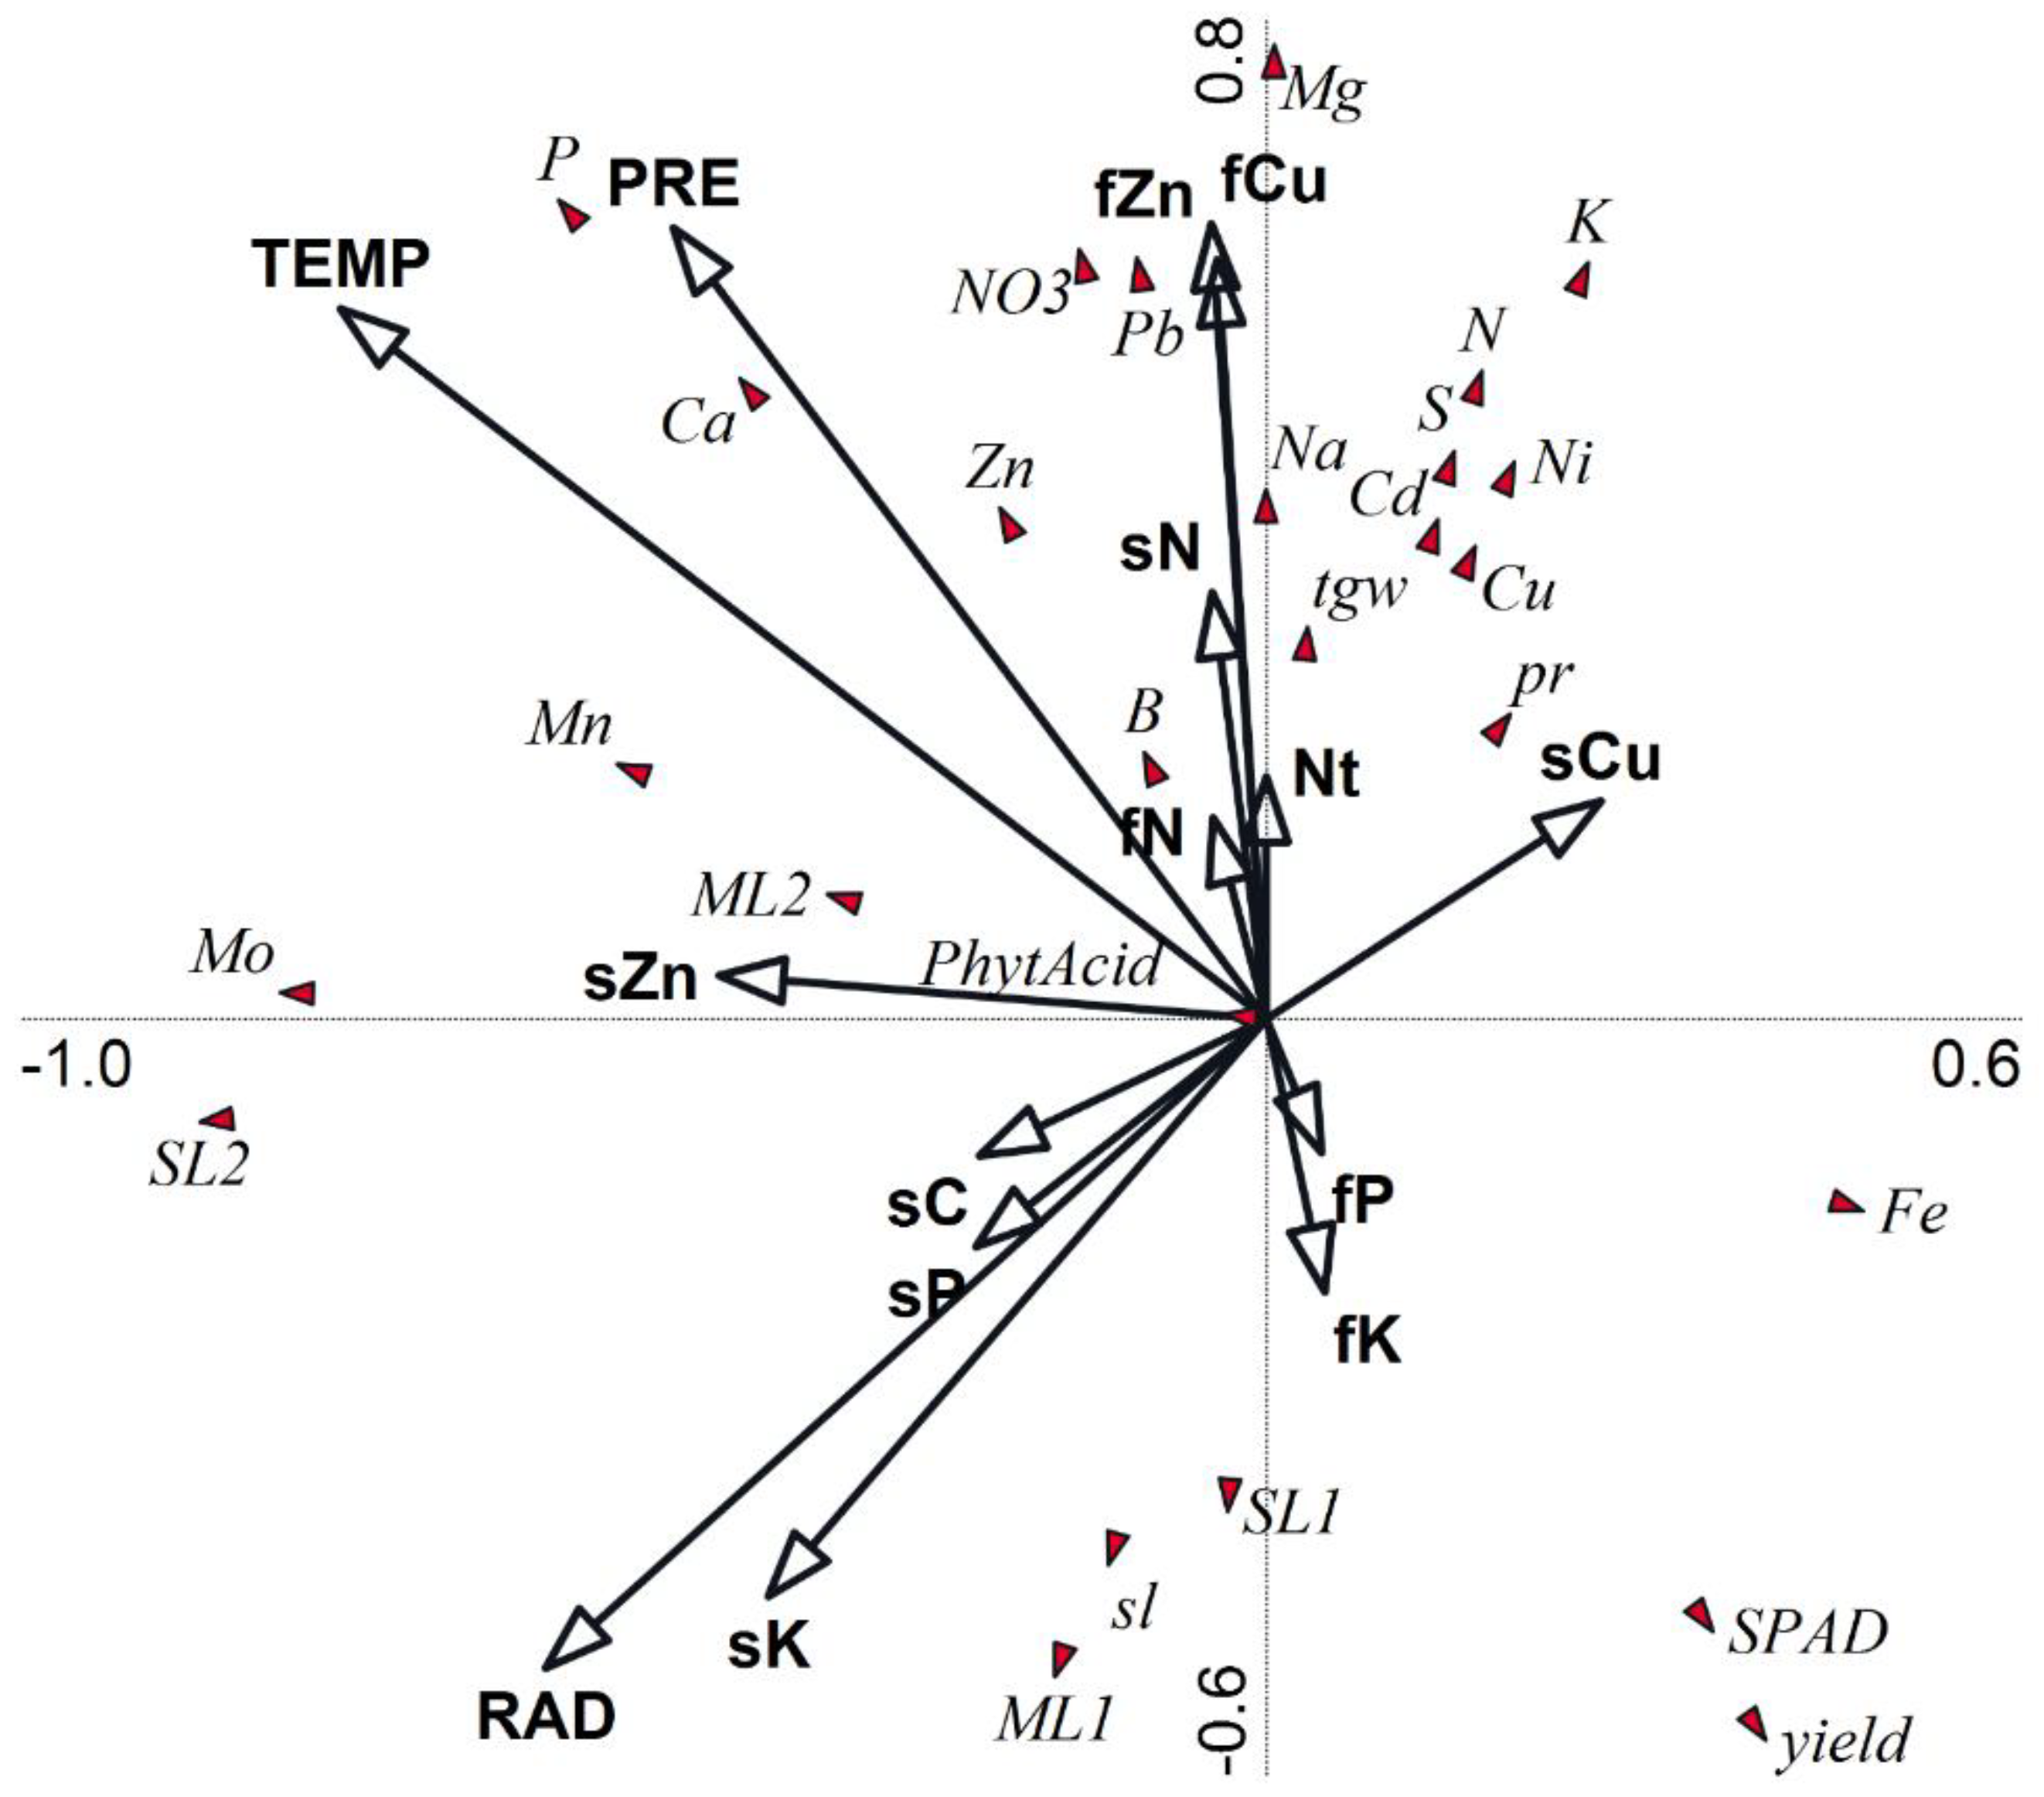
Disclaimer/Publisher’s Note: The statements, opinions and data contained in all publications are solely those of the individual author(s) and contributor(s) and not of MDPI and/or the editor(s). MDPI and/or the editor(s) disclaim responsibility for any injury to people or property resulting from any ideas, methods, instructions or products referred to in the content. |
© 2023 by the authors. Licensee MDPI, Basel, Switzerland. This article is an open access article distributed under the terms and conditions of the Creative Commons Attribution (CC BY) license (https://creativecommons.org/licenses/by/4.0/).