Article

Enhancing Maize Yield and Resource Efficiency through Controlled-Release Nitrogen Fertilization on the Semiarid Loess Plateau

1
Dryland Farming Institute, Gansu Academy of Agricultural Science, Lanzhou 730070, China
2
Key Laboratory of High Water Utilization on Dryland of Gansu Province, Lanzhou 730070, China
3
Gansu Provincial Key Laboratory of Aridland Crop Science, Gansu Agricultural University, Lanzhou 730070, China
4
College of Agronomy, Gansu Agricultural University, Lanzhou 730070, China
5
The UWA Institute of Agriculture, School of Agriculture and Environment, The University of Western Australia, Perth, WA 6001, Australia
6
CSIRO Agriculture & Food, Private Bag No. 5, Perth, WA 6913, Australia
*
Author to whom correspondence should be addressed.
Agronomy 2023, 13(9), 2320; https://doi.org/10.3390/agronomy13092320
Submission received: 20 July 2023 / Revised: 29 August 2023 / Accepted: 1 September 2023 / Published: 4 September 2023
(This article belongs to the Special Issue Improving Fertilizer Use Efficiency)

Abstract

:
Drought stress is one of the premier limitations to global agricultural production. Increasing water and nitrogen (N) use efficiencies in dryland agroecosystems to maintain high agricultural output are key responsibilities to assure food security, especially on the semiarid Loess Plateau region of China, as it is one of the important grain production areas in China. The impact of controlled-release urea (CRU) on the soil water content, soil enzyme activities, soil N content, biomass accumulation, grain yield, water use efficiency (WUE), and agronomic use efficiency of N fertilizer (AEN) were examined on the maize production of the rainfed Loess Plateau during 2020–2021. Two-growing-season field treatments at the Zhengyuan Agri-ecological Station, Qingyang, Gansu, including six N treatments, were investigated for maize: a control without N fertilization (CK) and five application proportions of CRU (i.e., 0, 30, 50, 70, and 100%CRU) under a N rate of 225 kg ha−1. Results showed that compared with common urea (0%CRU), on average, CRU applications significantly increased soil enzyme activity related to N conversion and improved biomass accumulation by 4–11% at the silking stage and by 2–12% at the maturity stage, respectively. As the proportion of CRU increased, the grain no. per ear, 100-grain weight, and harvest index first increased and then decreased. Grain yield was increased by 5.3, 11.4, 20.1, and 5.7% under 30, 50, 70 and 100%CRU, respectively, compared to common urea. Compared to common urea, 70%CRU combined with 30% common urea achieved the highest yield. These results indicate that optimal controlled-release N fertilization increases the yield and water and nitrogen use efficiencies of maize, and 70%CRU combined with 30% common urea under a single application of nitrogen fertilizer at sowing was the optimal application proportion of controlled-release urea for increasing water and nitrogen use efficiencies in dryland agroecosystems. The results of this study can provide a theoretical basis for the efficient fertilization of maize on the semiarid Loess Plateau of China.

1. Introduction

Water and nitrogen (N) availability limit crop productivity globally more than most other environmental factors. Enhancing crop productivity and optimizing water and nutrient utilization are crucial worldwide to guarantee food security and enhance ecological conditions, particularly in arid regions [1,2,3,4]. Nevertheless, China possesses a substantial expanse of arid land in its northern territories, constituting nearly 56 percent of the country’s entire land mass in the region [1,5,6], and dry farming in this region accounts for about 50% of the total agricultural production area. Therefore, dryland agriculture is an important mode of agricultural production in China [1], and the grain-yield-increasing potential of China will be in the dryland regions in the future. The Loess Plateau, spread over approximately 64 million hectares, supports about 100 million people and is the major dryland farming area of China [7]. Limited rainfall, high evaporation, severe soil loss, and low soil fertility constrain agricultural development in this region. Efficiently achieving high yields in dryland agriculture holds great significance for securing food supplies and the ecological stability of the Loess Plateau. Numerous agricultural management techniques aimed at improving maize production in dryland regions have been extensively explored in recent decades, among which terrace construction, fertilizer application, and the use of plastic film mulch have emerged as the most successful approaches. Maize has become a dominant crop after the application of plastic film covering technology on the semiarid Loess Plateau because the projected yield potential of maize is much higher than other crops, such as wheat (Triticum aestivum L.) and potato (Solanum tuberosum L.) [8].
The utilization of nitrogen (N) fertilization is a significant approach to enhance crop production [4]. It has been demonstrated to increase crop yields by 30–50%, and more than half of the global population relies on such fertilizers to sustain food production [9,10]. However, since the availability of N to crops is influenced by soil moisture, drought conditions can lead to simultaneous limitations in both water and nitrogen for crops. Consequently, in China, where achieving high grain yields is a priority, excessive N fertilizer application has become prevalent, particularly in dryland areas. Unfortunately, this disproportionate use of N fertilizers diminishes resource utilization efficiency and has adverse effects on the environment. For example, crop N recovery efficiency in China averages 32% compared to the world average of 55% while resulting in a negative effect on the environment, such as greenhouse gas emissions [11,12], ammonia volatilization [13,14], and water pollution [15]. Therefore, there is an urgent need for improved nitrogen management practices that optimize crop yield, decrease environmental influence, and ensure soil productivity to address food security concerns [11].
Common urea (solid granular urea) has been the most heavily applied N fertilizer in the maize production in China [16,17,18,19]. However, since the multiple topdressing of fertilizers consumes additional investments of labor, time, and equipment [16], it also promotes greenhouse gas emissions, especially ammonia volatilization (NH3) and nitrous oxide emissions [17]. The utilization of enhanced-efficiency fertilizers, such as urease inhibitors, nitrification inhibitors, and slow/controlled-release urea, has been suggested as a central strategy for reducing nitrogen (N) losses [20]. Controlled-release urea (CRU) fertilizer application offers a result to enhance N utilization, decrease economic expenses, and boost crop yields. CRU is specifically designed to discharge N at a controlled pace that aligns with crop demand, thereby mitigating the contamination of the environment while sustaining crop productivity [16,21]. Mixed controlled-release and common urea may be synchronized with the N requirements of high-yielding maize [22]. Several studies have indicated that CRU significantly enhances maize yield and N utilization efficiency when compared to customary urea [23,24,25,26]. Guo et al. (2017) demonstrated that a mixture of CRU and urea at 1:2 and 240 kg N ha−1 achieved the highest economic return [27]. Bai et al. (2021) found that the one-time application of a mixture of controlled-release and solid granular urea (1:2) reduced the carbon footprint and increased grain yield [16].
However, in maize production in the arid and semiarid areas of northwestern China, information related to one-time fertilization with combined common urea and CRU is still very limited. Contrasting outcomes have also been reported by other studies [28,29,30]. These conflicting results could potentially be attributed to variations in experimental locations, N fertilizer application rates, and/or the proportion of CRU application. However, the majority of researchers have primarily focused on examining the impact of N fertilizer on crop yield [24,31], with only a small number of authors giving attention to determining the optimal application rate of CRU for maximizing farm profitability. The varying responses of maize yield to CRU highlight the need for further investigation into the specific conditions and methods for applying CRU. It is crucial to study the effects of combining the application of CRU and conventional urea on soil N management and the maize production system. To address this, a field study was conducted from 2020 to 2021 on the semiarid Loess Plateau to compare the continuous application of CRU with conventional urea. It was hypothesized that (i) CRU application to maize increases soil enzyme activities, increasing maize N uptake and biomass accumulation, and (ii) the optimal CRU application increases the yield and water and nitrogen use efficiencies of maize without increasing ET on the semiarid Loess Plateau. The main objectives of this study were to determine the effects of different combinations of CRU and urea on maize grain yield, water utilization, and water and N use efficiency in the natural field.

2. Materials and Methods

2.1. Site Description

The experiment in the field was carried out at the Northwest Dry Farming Nutrition and Fertilization Scientific Observation and Experiment Station of the Ministry of Agriculture and Rural Affairs (35°29′ N, 107°29′ E and elevation 1279 m) in Zhenyuan County, Qingyang City, Gansu Province, China, from April 2020 to October 2021. The site soil is classified as Cumuli-Ustic Isohumosols, according to Chinese soil taxonomy [32], which is a Calcaric Cambisol. The experimental site experiences an average annual precipitation of 540 mm, with more than half of it occurring between July and September. Rainfall in this region fluctuates greatly, and the probability of rainfall greater than 500 mm is only 57.1%. The annual water-surface evaporation is 1532 mm. The average annual temperature is 8.3 °C, and the average frost-free period is 170 d. The precipitation throughout the growing season is illustrated in Figure 1. Soil samples collected from the 0–20 cm depth at the experimental site in April 2020 exhibited a bulk density of 1.30 g cm−3, a field capacity of 0.289 cm3 cm−3, and a wilting point of 0.098 cm3 cm−3. The pH of the soil, measured in a suspension of soil in 0.01 M CaCl2, was found to be 8.4 in the 0–20 cm soil layer. Furthermore, the soil analysis revealed the following nutrient values: total N content of 0.95 g kg−1, soil organic matter of 12.1 g kg−1, available phosphorus content of 15.1 mg kg−1, and available potassium content of 145.7 mg kg−1.

2.2. Experimental Design

The experiment followed a randomized complete block design with three replications and focused on six treatments for maize. These treatments included a control group without N fertilization (CK) and five different ratios of controlled-release urea (CRU) application (0%, 30%, 50%, 70%, and 100%) at a fixed N rate of 225 kg ha−1. The remaining N required for each treatment was supplemented with regular urea, as indicated in Table 1. The plot size was 22 m2 (4.4 × 5 m), and the fertilization method and planting density adhered to the local practices for maize production in the region. All N fertilizers were applied at once as base fertilizers and were manually distributed over the soil surface prior to sowing and then plowed into the soil [17], and the N treatments remained consistent in the same plots each year. Polyethylene was used as a coating material for the production of CRU. Additionally, each year, all treatments received a basal application of 120 kg ha−1 P2O5 in the form of triple superphosphate (16% P2O5). As per standard farming practices in the region, we did not apply sulfur fertilizer in our experiment, and no potassium fertilizer was used in this experiment due to the apparently abundant potassium levels in the soils of the area [17,18,19]. In late April, all fertilizers were incorporated into the soil at a depth of 10 cm using a rotary tiller. Simultaneously, soil ridging and the placement of a transparent polyethylene film, measuring 120 cm in width and 0.01 mm in thickness, were carried out. The purpose of the ridges was to redirect raindrops toward the furrows where the maize crop was sown. Maize seeds of the Funong 821 variety were manually drilled into the furrows in late April, with a line spacing of 55 cm. The plant spacing within each row was 22.5 cm, resulting in a density of 75,000 plants per hectare. The maize crop was harvested in early October, and all maize residues were removed from the plots during harvest. The plastic film used for covering the soil was also removed using a residual film recycling machine. Subsequently, in late October, all plots underwent moldboard ploughing to a depth of 25 cm.

2.3. Sampling and Measurements

Daily rainfall data were collected from an automated weather station situated at the experimental site. Rainfall measurements were recorded and categorized as annual, fallow, and growing season rainfall, aligning with the different stages of maize growth in the specific region (as outlined in Table 2). To evaluate the fluctuations and conditions of annual rainfall, fallow period rainfall, and seasonal rainfall between the two growing seasons, a drought index (DI) based on rainfall was utilized. The calculation of the DI followed data collected in previous studies [4,18].
Each year, soil samples were collected from the surface down to a depth of 200 cm, with intervals of 20 cm per soil layer, at different stages: before sowing, during jointing, silking, and after the final harvest (GS92). These samples were taken to measure the soil water content. The fresh weight of the samples was promptly measured, and then the samples were dried in a forced-air oven at 105 °C until a constant weight was reached to determine the dry weight. The soil moisture was calculated based on the dry weight and the initial fresh weight of the samples. The soil water storage (SWS) was determined according to the following equations [4,18]:
WS = ( SD × R × Wm ) × 100
where SWS, SD, R, and Wm are soil water storage (mm), soil depth (m), soil bulk density (g cm−3), and soil moisture at different depths (%), respectively.
Evapotranspiration (ET) is calculated by the soil water balance equation [4,7,18]:
ET = SWCs + Rg SWCh
where SWCs is the soil water content at maize planting (mm), Rg is the seasonal rainfall (mm), and SWCh is the soil water content at harvest (mm).
During the 2020–2021 growing seasons, at the silking stage, three random soil cores (with a diameter of 4.5 cm and height of 20 cm) were extracted from each plot within the 0–20 cm soil layer. These soil cores were collected for the purpose of measuring soil nutrient contents. The soil samples were air-dried, ground, and sieved through a 2.0 mm mesh. For analysis, 5 g of the dried samples was mixed with 50 mL of 2 M KCl solution, shaken for 60 min, and then assessed using an AA3 Automatic Continuous Flow Analyzer (Skalar, Breda, the Netherlands) to determine the levels of nitrate nitrogen (NO3-N) and ammonium nitrogen (NH4+-N). To release and convert alkali-hydrolyzable N to NH3, 1.07 M NaOH and FeSO4 powder was employed at a temperature of 40 °C for 24 h. The released NH3 was subsequently absorbed using 2% (w/v) H3BO3 solution and titrated with 0.005 M H2SO4.
Soil urease, nitrate reductase, nitrite reductase, sucrose, and catalase are crucial factors in the transformation and availability of nitrogen and phosphorus in the soil for crop uptake. Hence, these five enzymes were specifically chosen for this study to assess the impact of different N treatments on soil fertility. During the silking stage, three fresh soil samples were collected from each plot within the 0–20 cm soil layers to determine the activity of soil enzymes. The activity of soil urease was measured using the indophenol blue method, with the urease activity expressed as the amount of NH4+-N released per gram of fresh soil over a 24 h period at 37 °C, as outlined in the study by Ge et al. (2010). The catalase activity (0.1 mol L−1 KMnO4 g−1 soil d−1) was measured by back-titrating residual H2O2 with KMnO4 [33]. Soil sucrase activity was measured by the 3,5-dinitrosalicylic acid methods [34]. Soil nitrate reductase and nitrite reductase activities, expressed as µg NO2-N released g−1 fresh soil d−1 at 37 °C, were measured according to previous studies [35,36]. All determinations of enzymatic activities were performed in triplicates, and all values reported are their averages.
Plant dry mass (DM) was determined by randomly selecting one plant for each plot at different growth stages, including the seedling stage, jointing stage, tasseling stage, and milk ripening stage, respectively. Sample plants were removed directly above the nodal roots, and samples were oven-dried at 80 °C to a constant weight. At the time of physiological maturity, all maize plants within each plot were manually harvested from a designated area of 10 m2 (2 m × 5 m). After the harvest, the aboveground dry mass was estimated, and the weight of air-dried grain was recorded for each plot to calculate the grain yield. Measurements of kernels per ear and 100-kernel weight were conducted during both the 2020 and 2021 growing seasons. The following parameters, related to dry matter accumulation and remobilization, were calculated following previous studies [37,38]. Harvest index (HI) and WUE were calculated as follows:
HI = GY BY
WUEb = BY ET
WUEg = GY ET
where GY is the grain yield (kg ha−1), BY is the biomass yield (kg ha−1), WUEb is the water use efficiency for biomass (kg mm−1 ha−1), and WUEg is the water use efficiency for grain yield (kg mm−1 ha−1).
The agronomic use efficiency of N fertilizer (AEN) refers to the augmentation in maize grain yield per unit of fertilizer nitrogen utilized which was calculated using the following formula:
AE = Yn Y 0 Nx
where Yn and Y0 are the grain yields in the fertilized plot and in the non-N-applicated plot (kg ha−1), respectively, and Nx is the amount of N fertilizer applied (kg N ha−1).
The apparent nitrogen recovery (%) can be calculated as follows:
ANR = TNn TN 0 Nx × 100 %
where TNn and TN0 are the total N uptake by plants in the fertilized plot and in the non-N-applicated plot (kg ha−1), respectively, and Nx is the amount of N fertilizer applied (kg N ha−1).
The physiological use efficiency of nitrogen (PhEN) can be calculated as follows:
PhEN = Yn Y 0 TNn TN 0
where Yn and Y0 are the grain yields in the fertilized plot and in the non-N-applicated plot (kg ha−1), respectively, and TNn and TN0 are the total N uptake by plants in the fertilized plot and in the non-N-applicated plot (kg ha−1), respectively.

2.4. Data Analysis

The statistical analysis was performed utilizing SAS software (SAS Institute, Cary, NC, USA, 2010) for conducting standard ANOVA and Duncan’s tests (p ≤ 0.05). An analysis of variance was carried out for all variables with dependence in the study. The treatment effects were treated as fixed factors, while the growing season, replication, and all interactions with replicates were measured as random factors.

3. Results

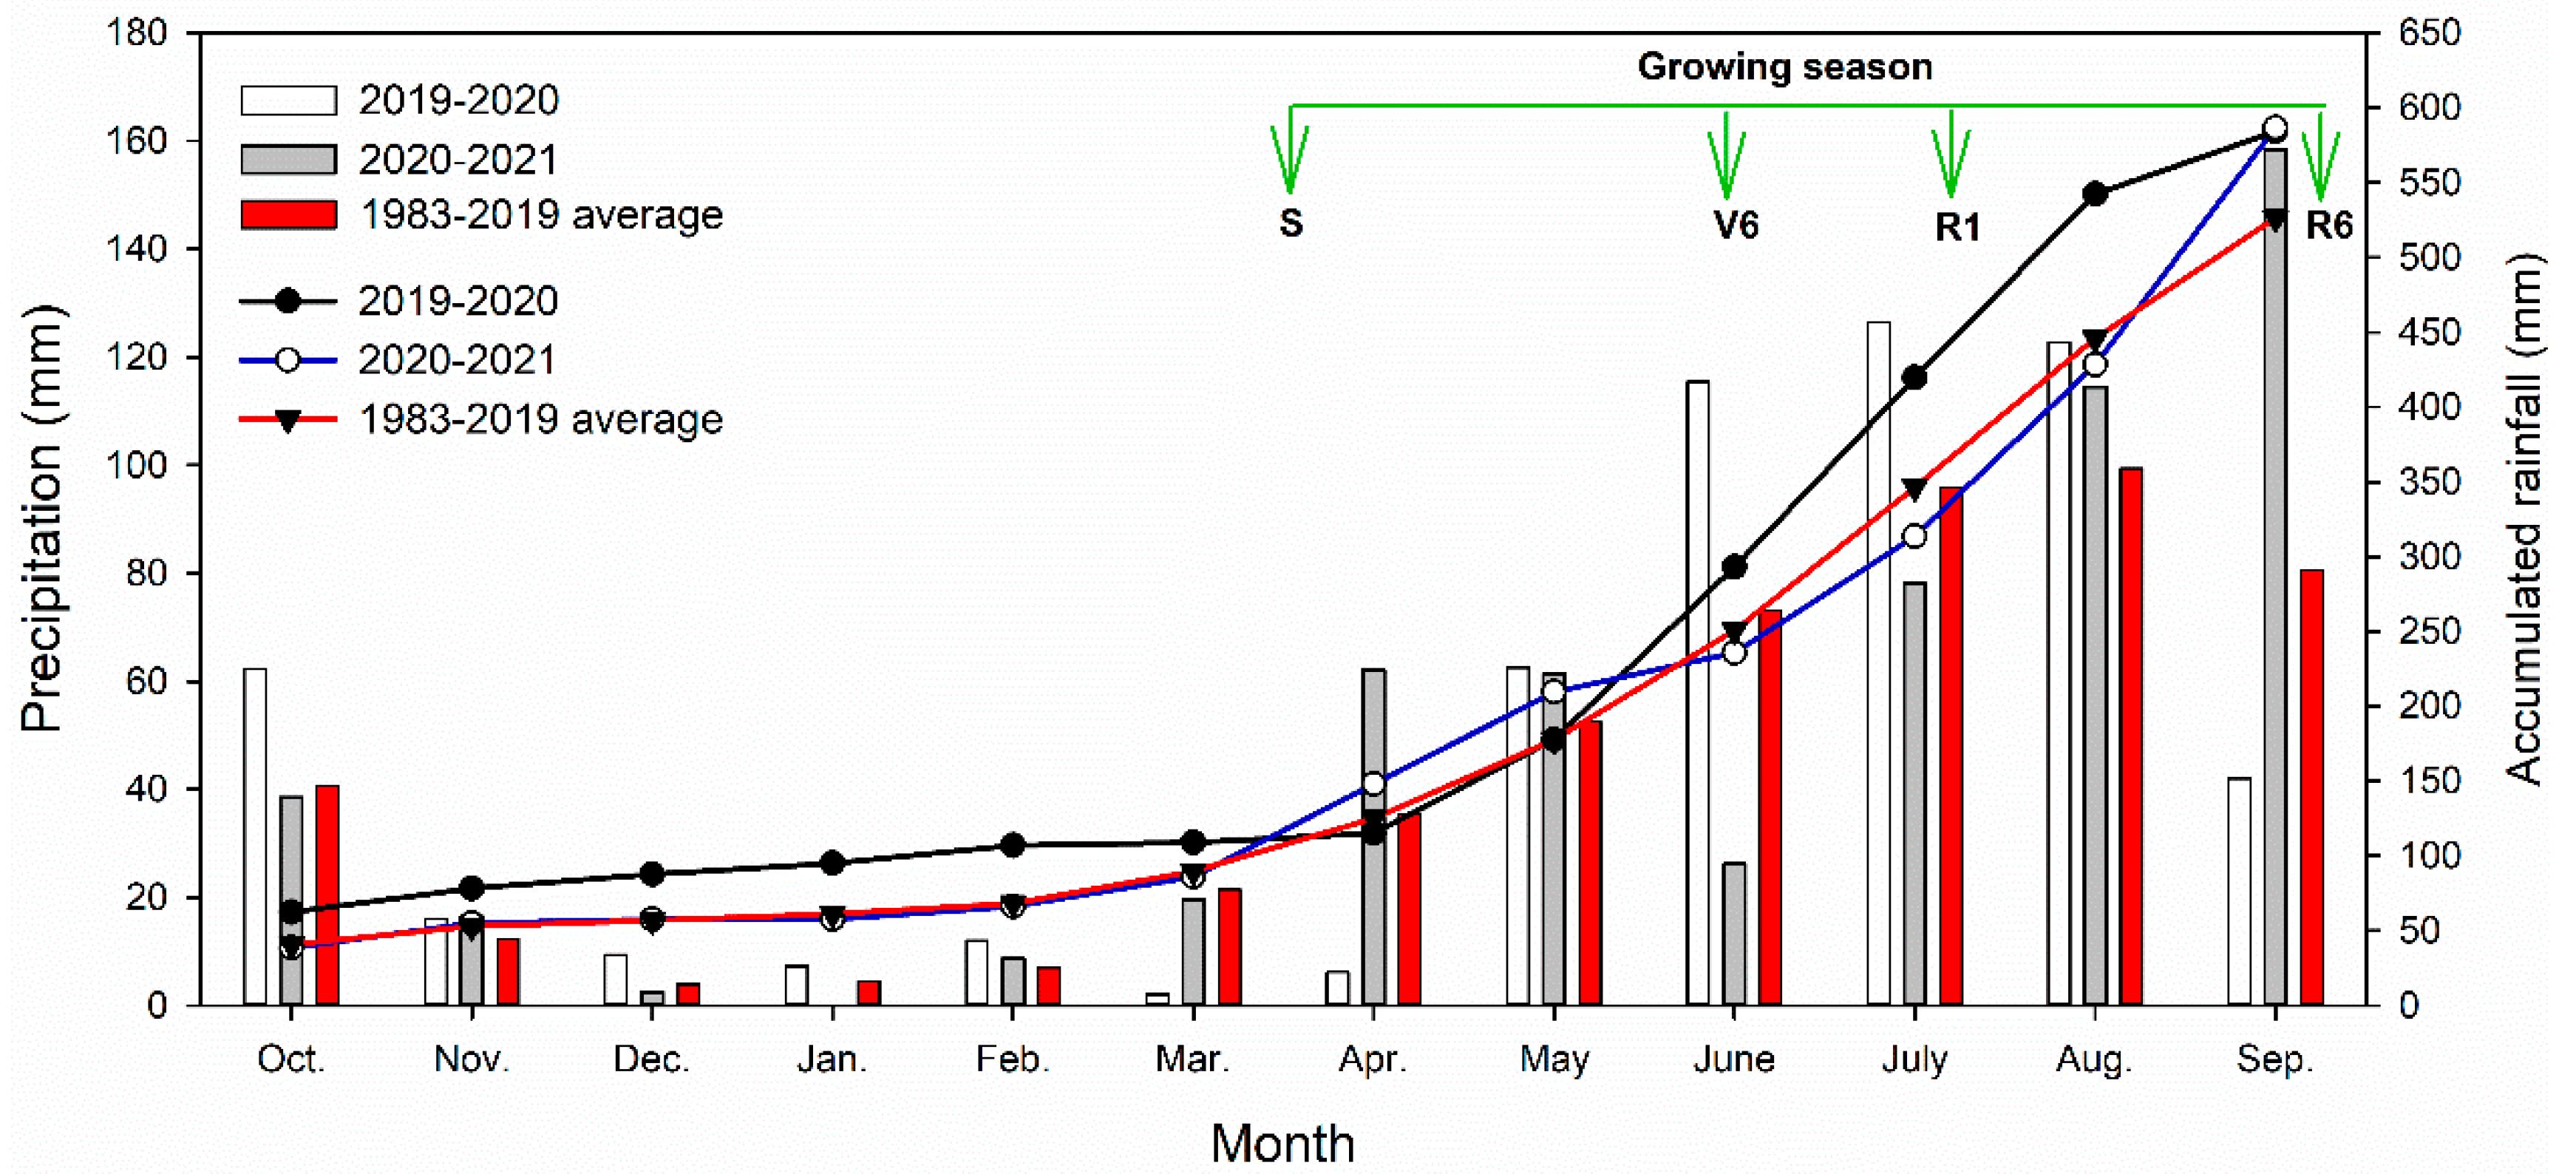
3.1. Weather Condition

Between the two years (Table 2), there was limited fluctuation in the amount of annual precipitation, with the majority occurring from July to September (Figure 1). The distribution of rainfall during the fallow period and cropping season differed across the two years. The fallow period experienced rainfall that closely resembled the long-term average of 125 mm, but it was higher in 2021 compared to the average. The seasonal rainfall did not align with the annual precipitation pattern. Although the growing season rainfall in 2021 was similar to the average of 405.5 mm, it exceeded the long-term average by 44.7 mm in 2020, indicating a wetter condition.

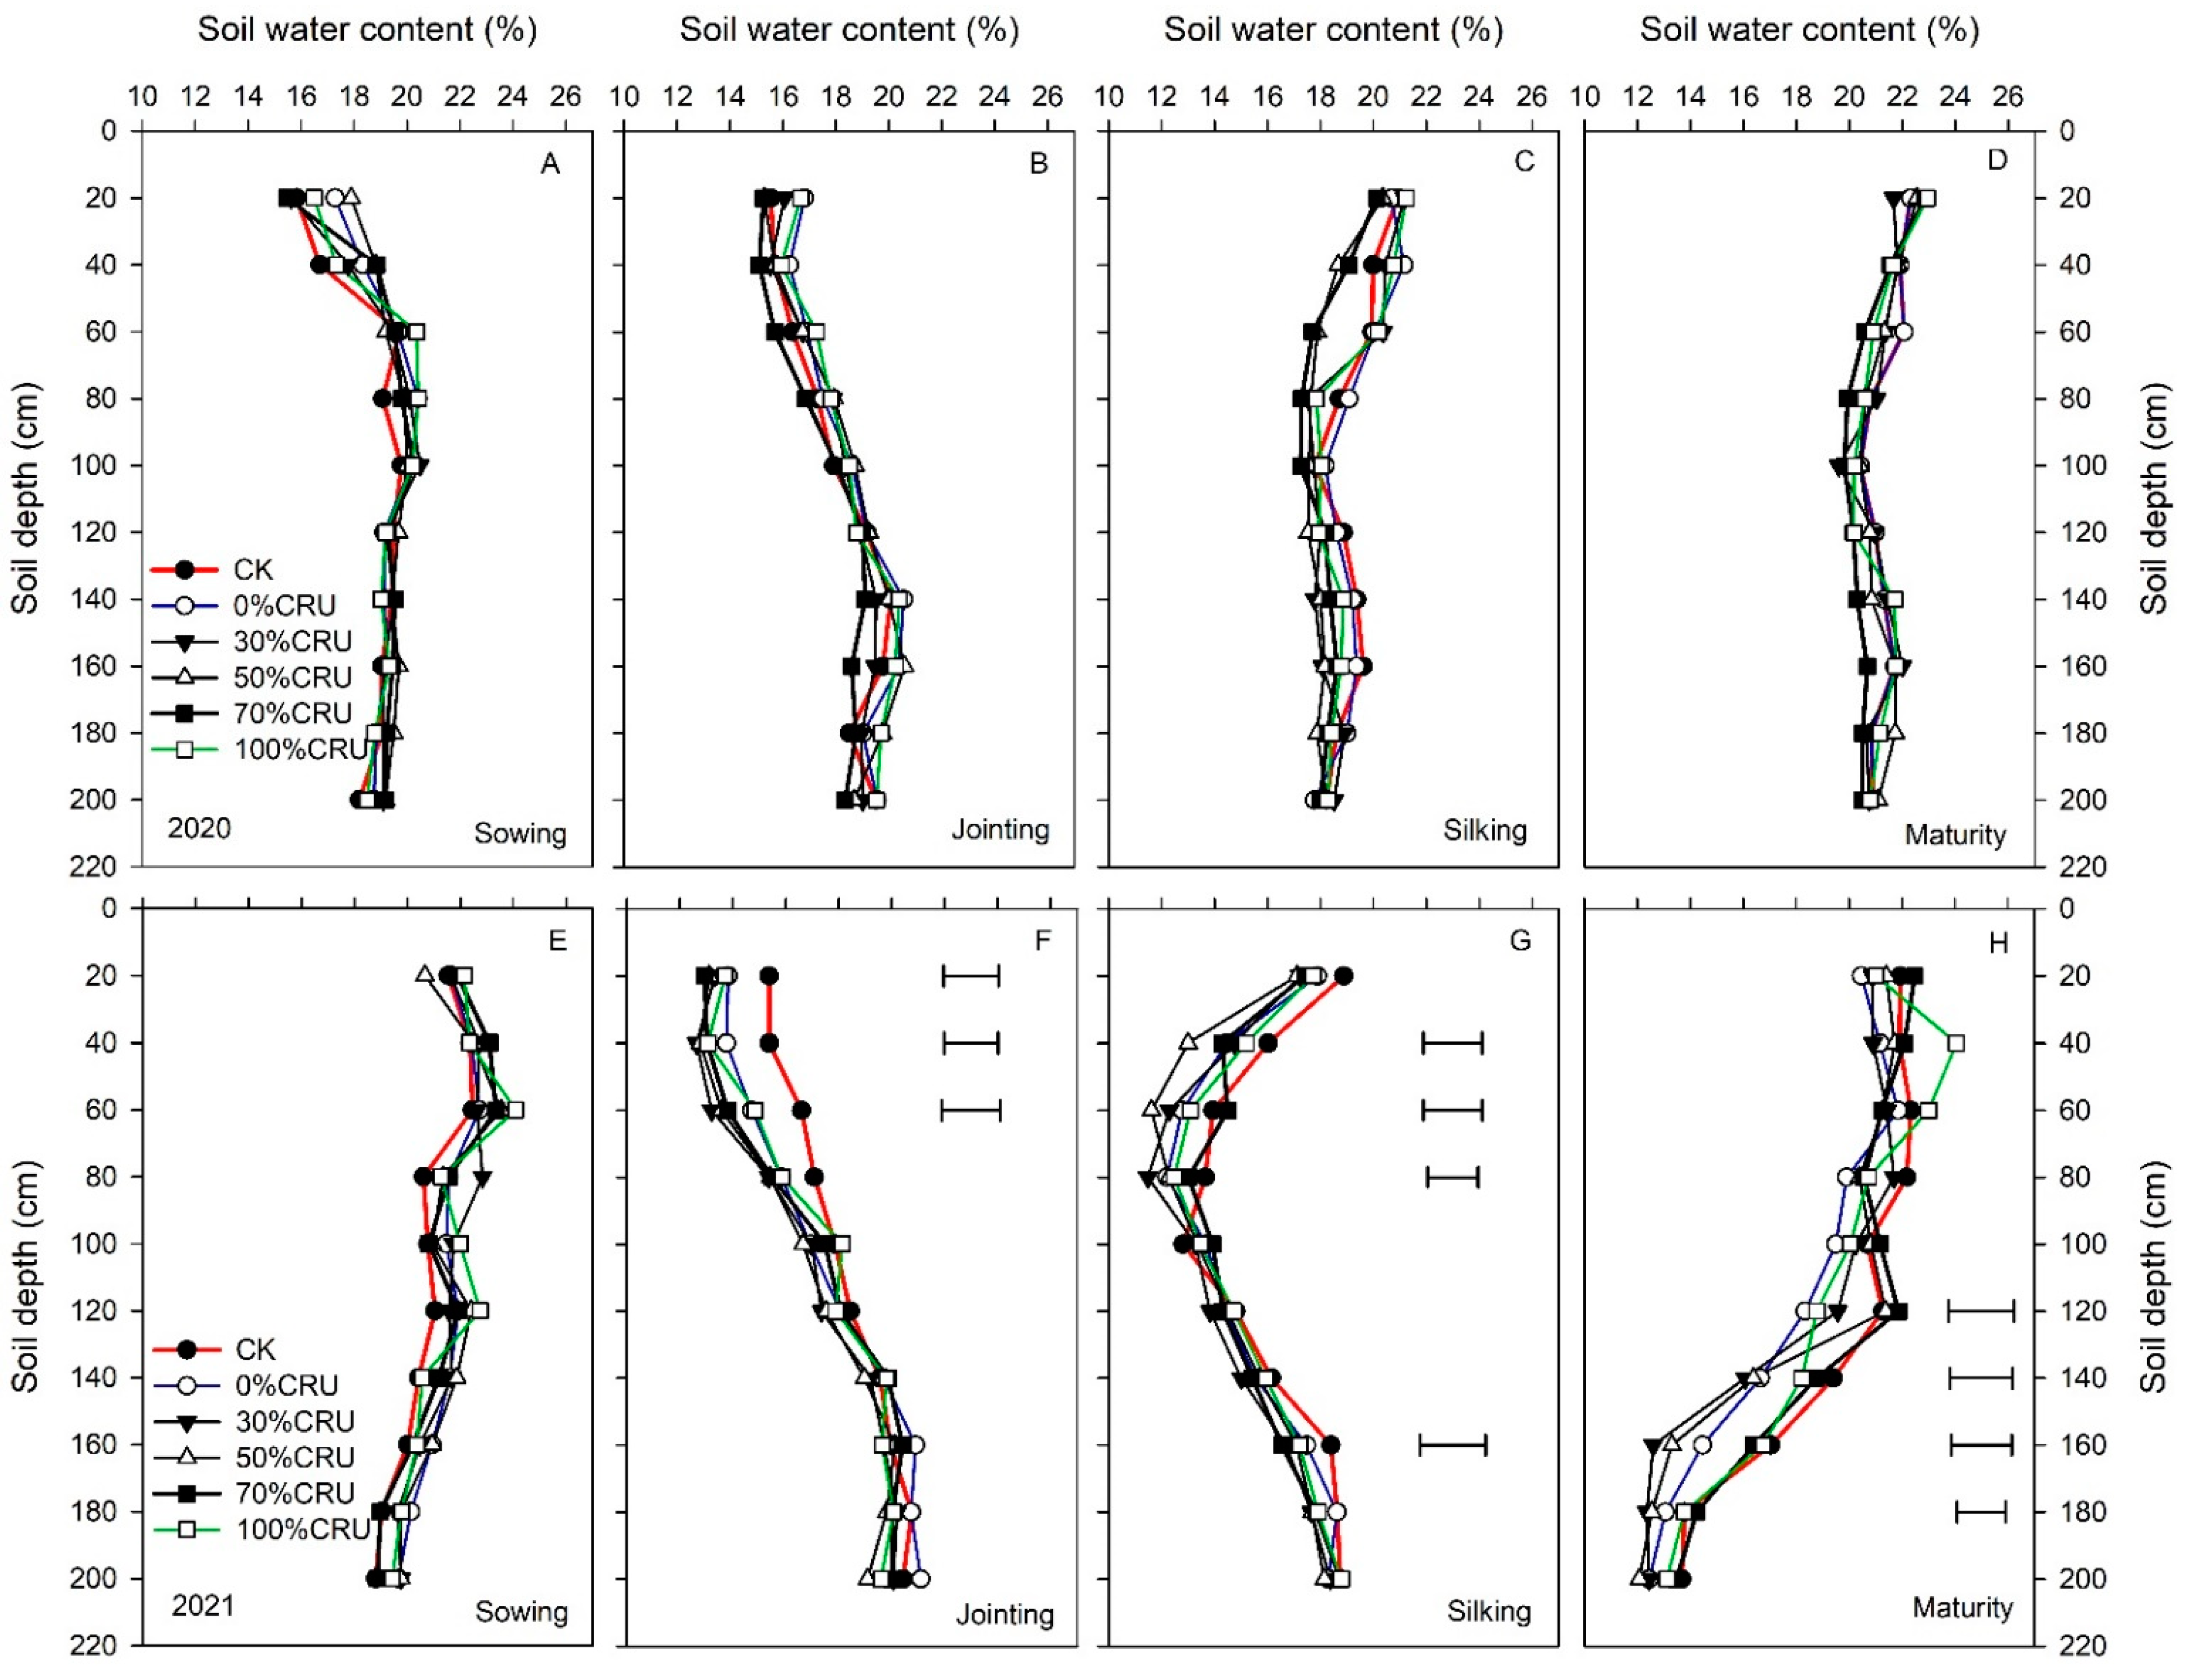
3.2. Effect of Controlled-Release N Fertilization on Soil Water Content and Evapotranspiration

In the 2020 growing season, soil water content was not significantly different at all growth stages among the N treatments (Figure 2A–D). In the 2021 growing season, soil water content under the treatment without N (CK) was greater in the 0–60 cm soil layers at the jointing stage, in the 40–80 cm and 140–160 cm soil layers at the silking stage, and in the 100–180 cm soil layers at physiological maturity than that under the treatments of N fertilization, respectively (Figure 2E–H). Interestingly, with the extension of the growth period, the change in soil moisture among N treatments had an obvious trend to extend to the deep soil.
The evapotranspiration varied with seasonal rainfall (Table 3). Evapotranspiration during the whole growth period of maize was greater by 52.6 mm in the 2020 growing season (wet) than that in the 2021 growing season (normal). In general, evapotranspiration was affected by different growth stages and N treatments (Table 3). On average, compared to CK, evapotranspiration with N fertilization treatments increased from sowing to jointing and from silking to maturity, but it was not significantly different from jointing to silking among different N managements. Under the same N fertilizer application rate, controlled-release N fertilization increased evapotranspiration from sowing to jointing in different degrees, but evapotranspiration from silking to maturity tended to decrease under controlled-release N fertilization. Compared to common urea application (0%CRU), on average, 30, 50, and 70% controlled-release N fertilization (i.e., 30%CRU, 50%CRU, and 70%CRU) significantly increased evapotranspiration from sowing to jointing by 22 mm under the same N fertilizer application rate. Compared to 0%CRU, 100% controlled-release N fertilization (100%CRU) significantly reduced evapotranspiration from silking to maturity by 19.5 mm (Table 3).

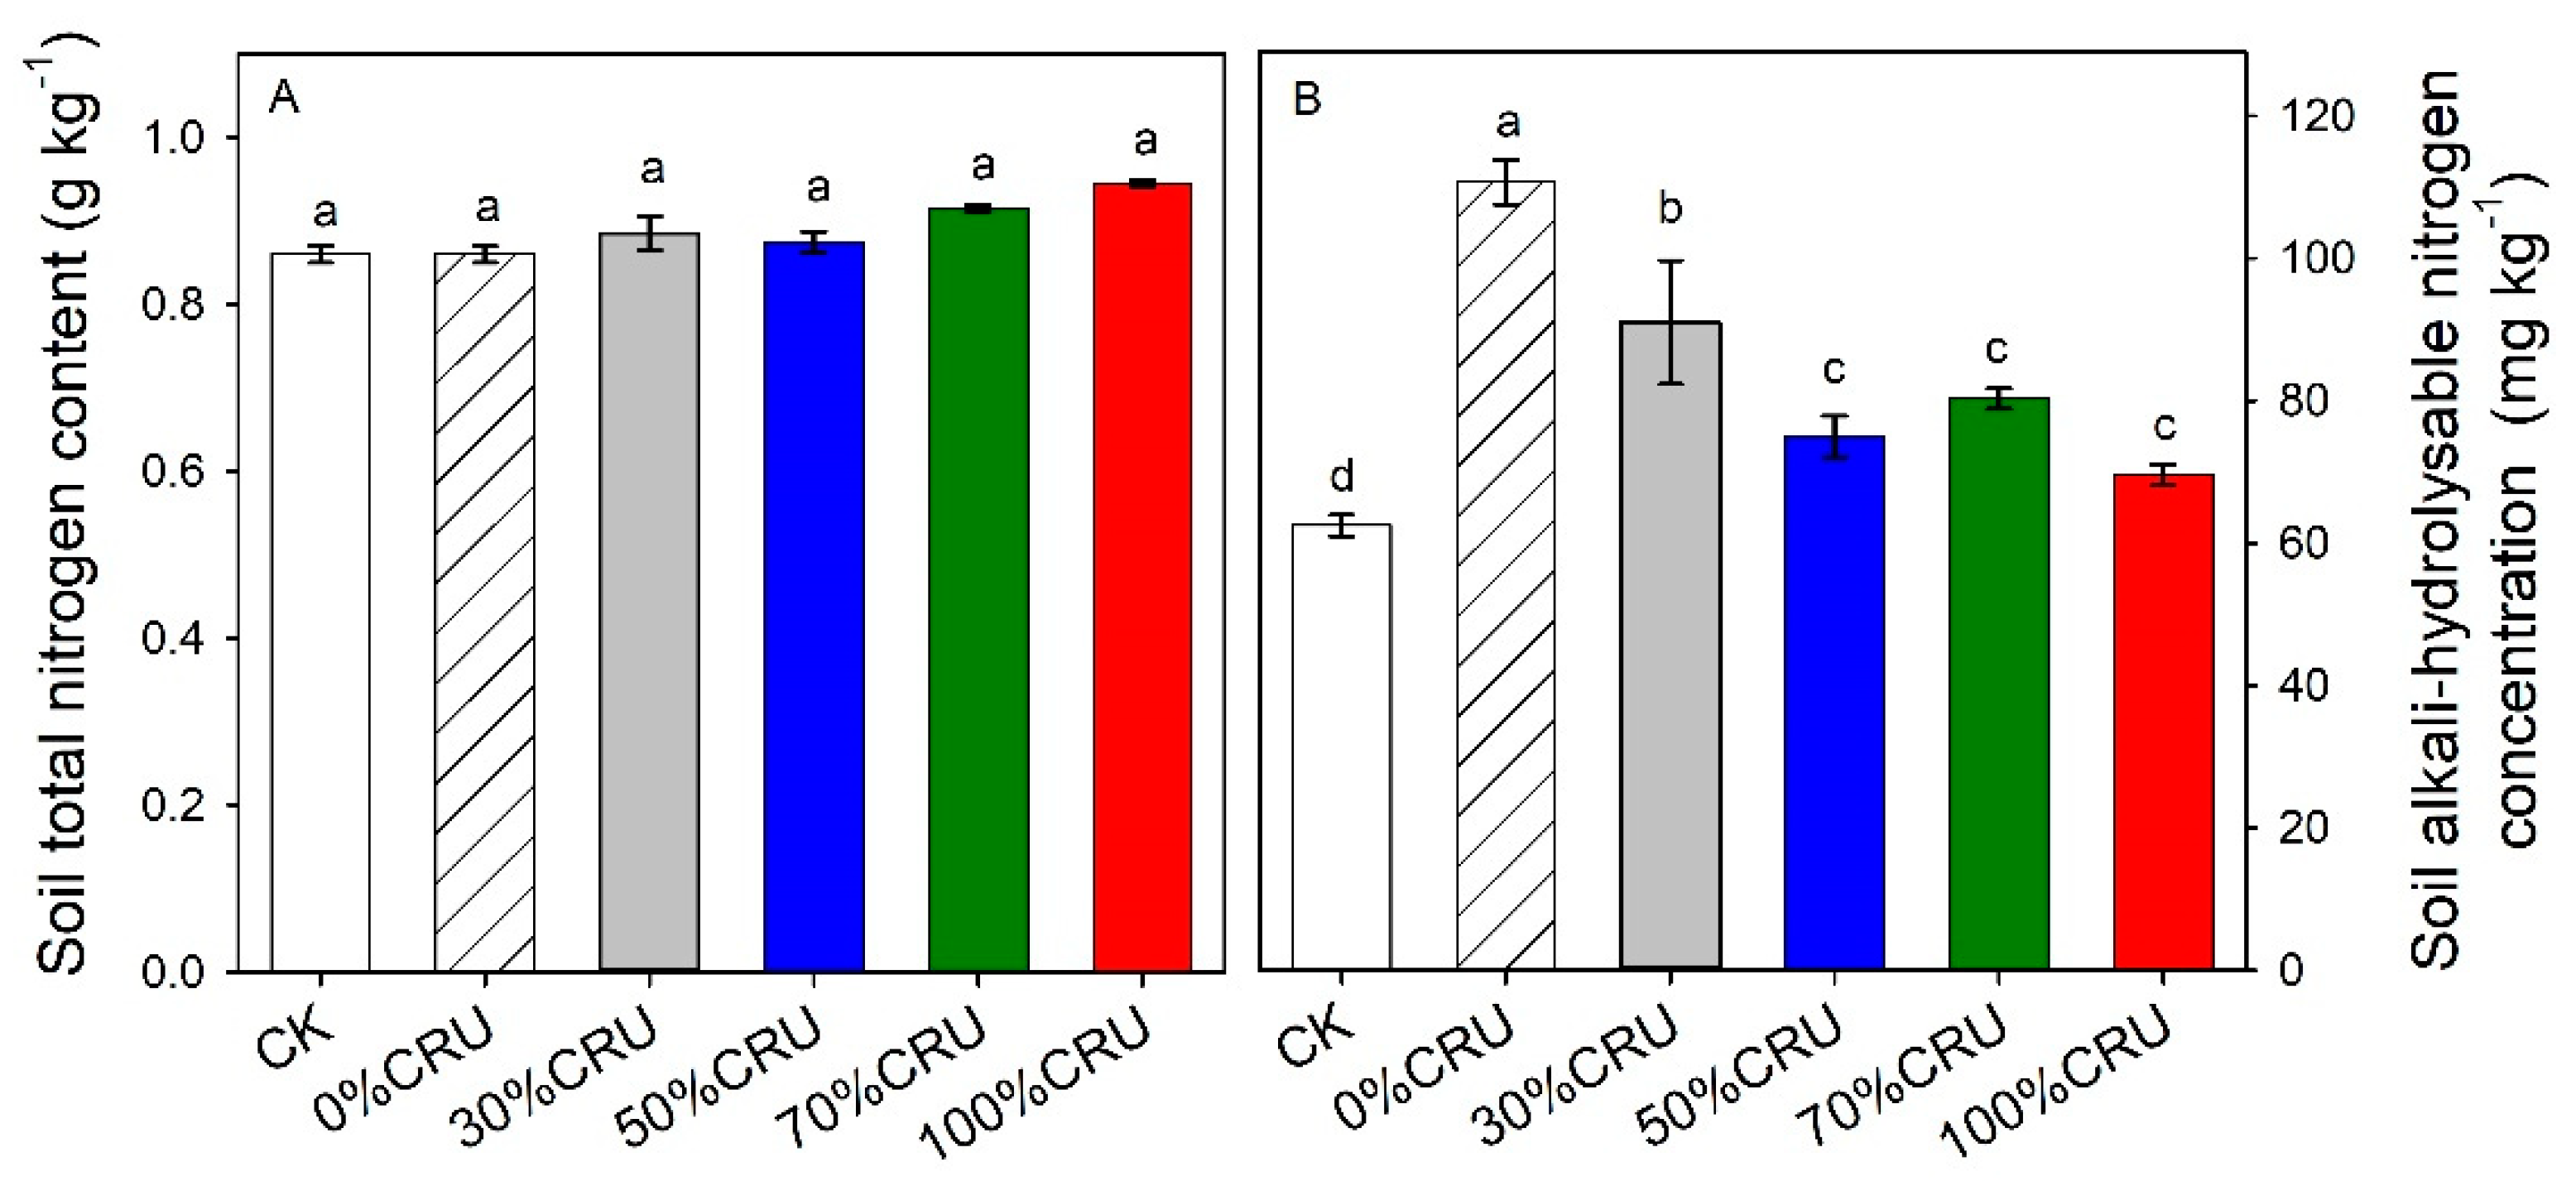
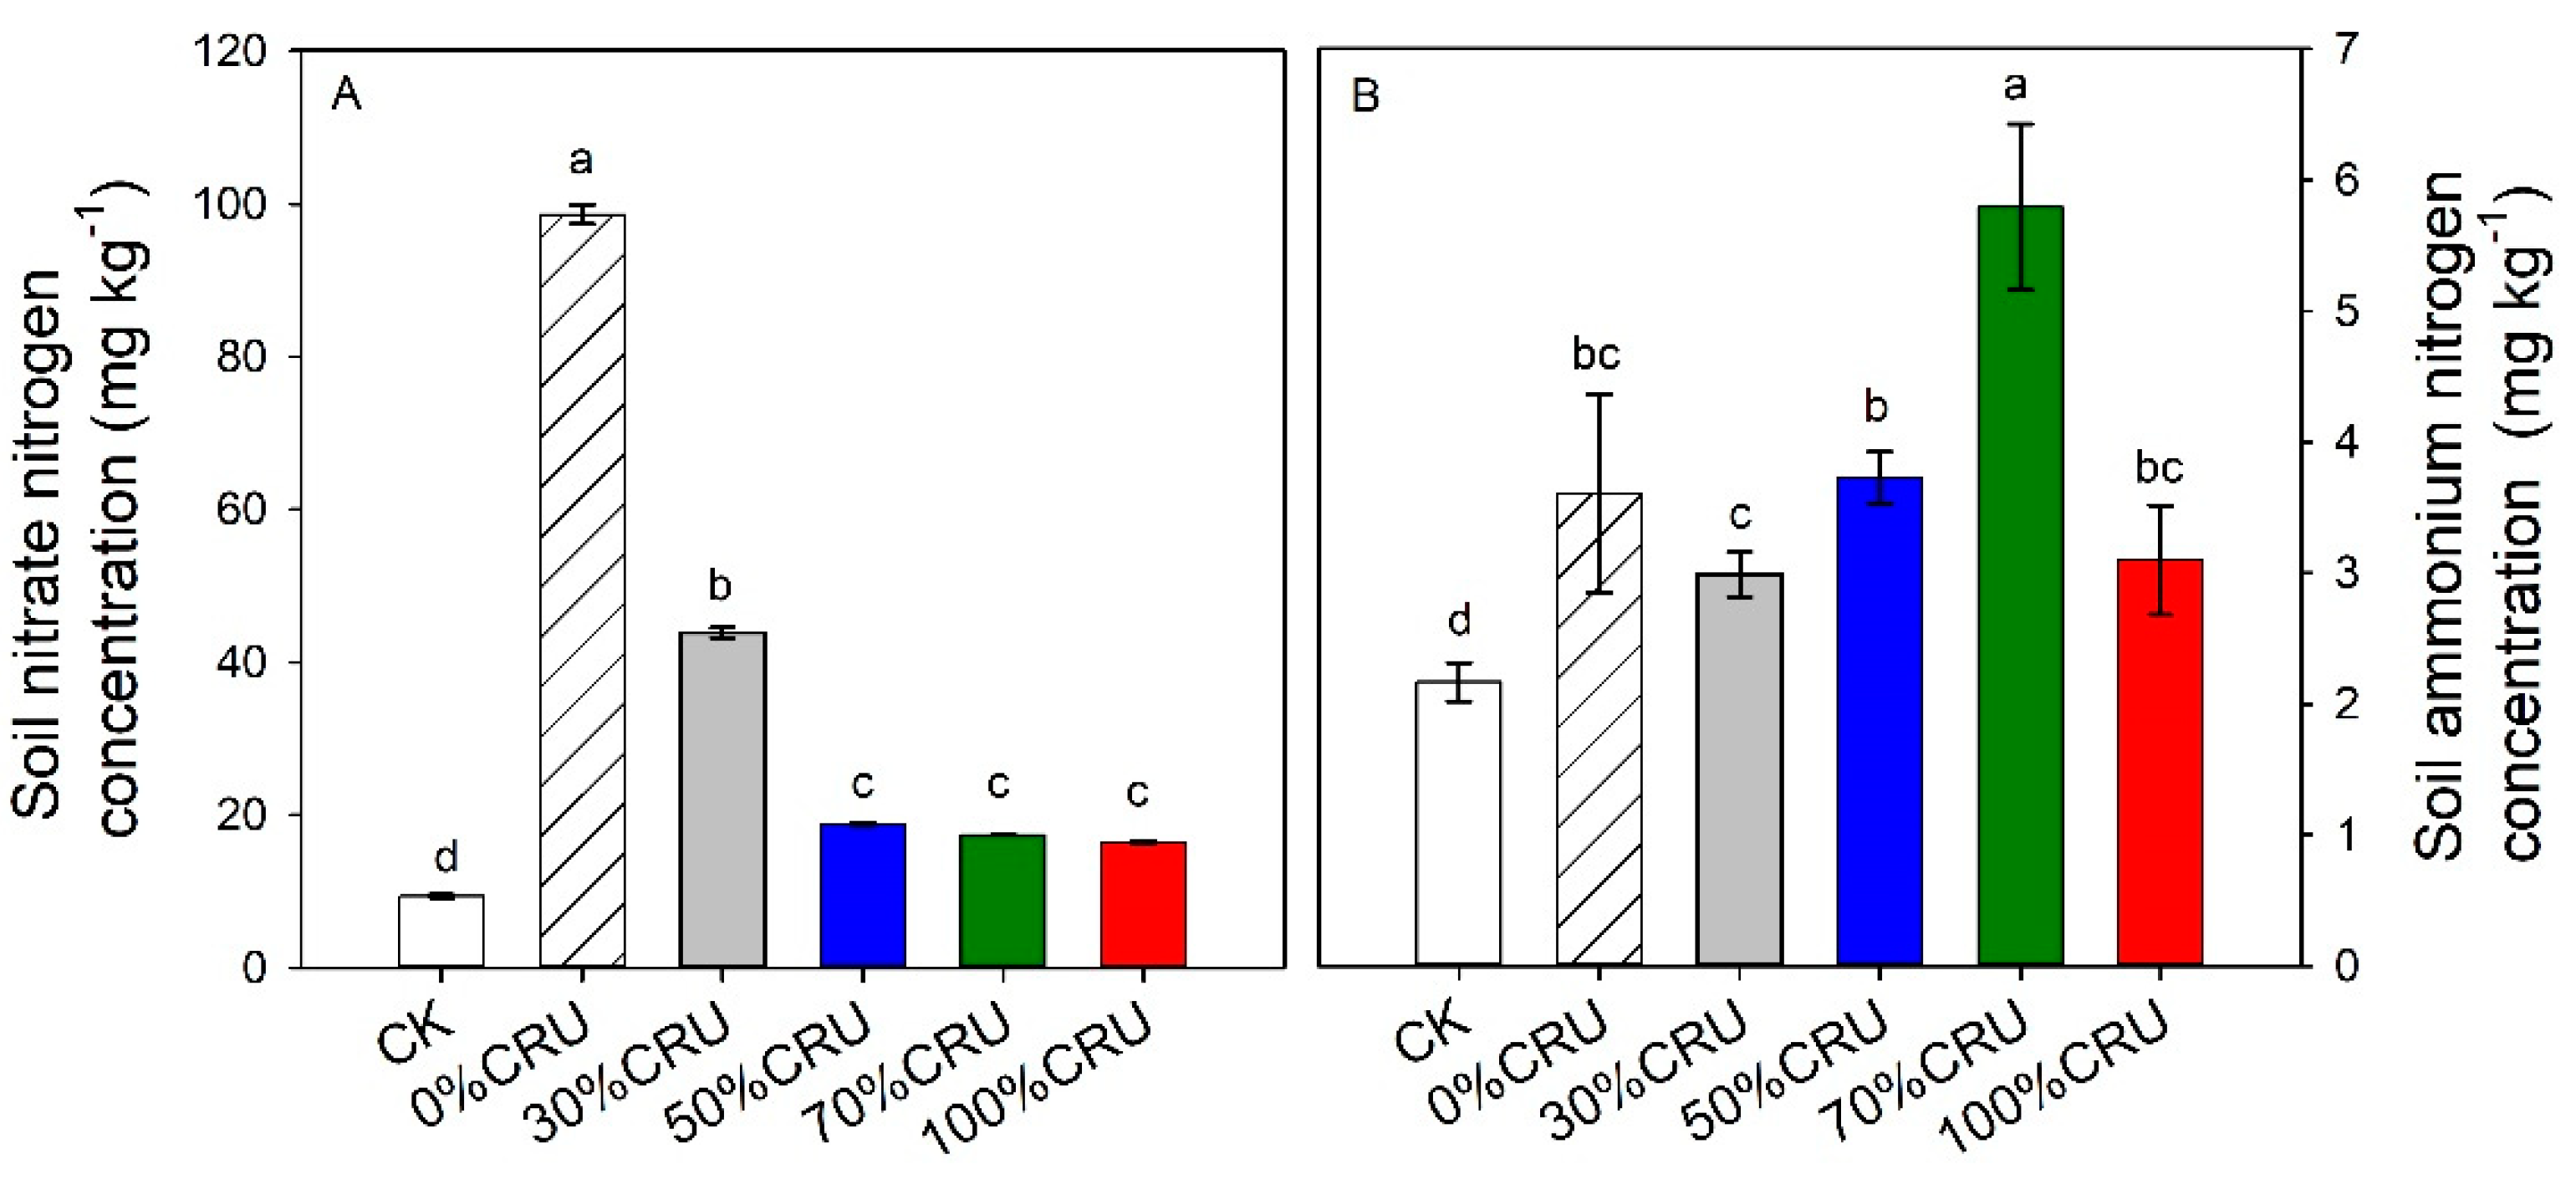
3.3. Effect of Controlled-Release N Fertilization on Soil Enzyme Activity and Soil Nitrogen Content

Soil nitrate nitrogen (NO3-N), ammonium nitrogen (NH4+-N), and alkali-hydrolyzable nitrogen concentration and enzyme activities were profoundly affected by different nitrogen treatments (Figure 3 and Figure 4, Table 4), but different nitrogen treatments did not affect soil total nitrogen content (Figure 3 and Figure 4 and Table 4). At the silking stage, compared to the treatment without N (CK), N fertilization significantly increased alkali-hydrolyzable nitrogen (Figure 3B) and NO3-N and NH4+-N concentration (Figure 4A,B) in the 0–20 cm soil depth. However, under the same N fertilizer application rate, the greatest soil alkali-hydrolyzable nitrogen concentration and NO3-N were found under common N fertilization (i.e., 0%CRU), followed by 30%CRU, and were lowest under 50%CRU, 70%CRU, and 100%CRU; 70%CRU significantly increased NH4+-N concentration in the 0–20 cm soil layer (Figure 3B and Figure 4A).
Soil urease activity was greatest under 100%CRU, followed by 30%CRU, 50%CRU, and 70%CRU, and was lowest among the treatment deprived of nitrogen (N) (Table 4). The greatest soil nitrate reductase activity was found under 100%CRU, followed by 0%CRU, 70%CRU, 50%CRU, and 30%CRU, and was lowest under the treatment deprived of N. Under the same nitrogen fertilizer application rate, soil nitrite reductase activity was higher under 100%CRU, followed by 30%CRU, 50%CRU, and 70%CRU, and was lower under 0%CRU. The 0%CRU and 30%CRU had the greatest soil sucrose activity, followed by 100%CRU, CK, 50%CRU, and 70%CRU. Nevertheless, there were no statistically significant distinctions observed in the soil catalase activity across the various nitrogen (N) treatments.

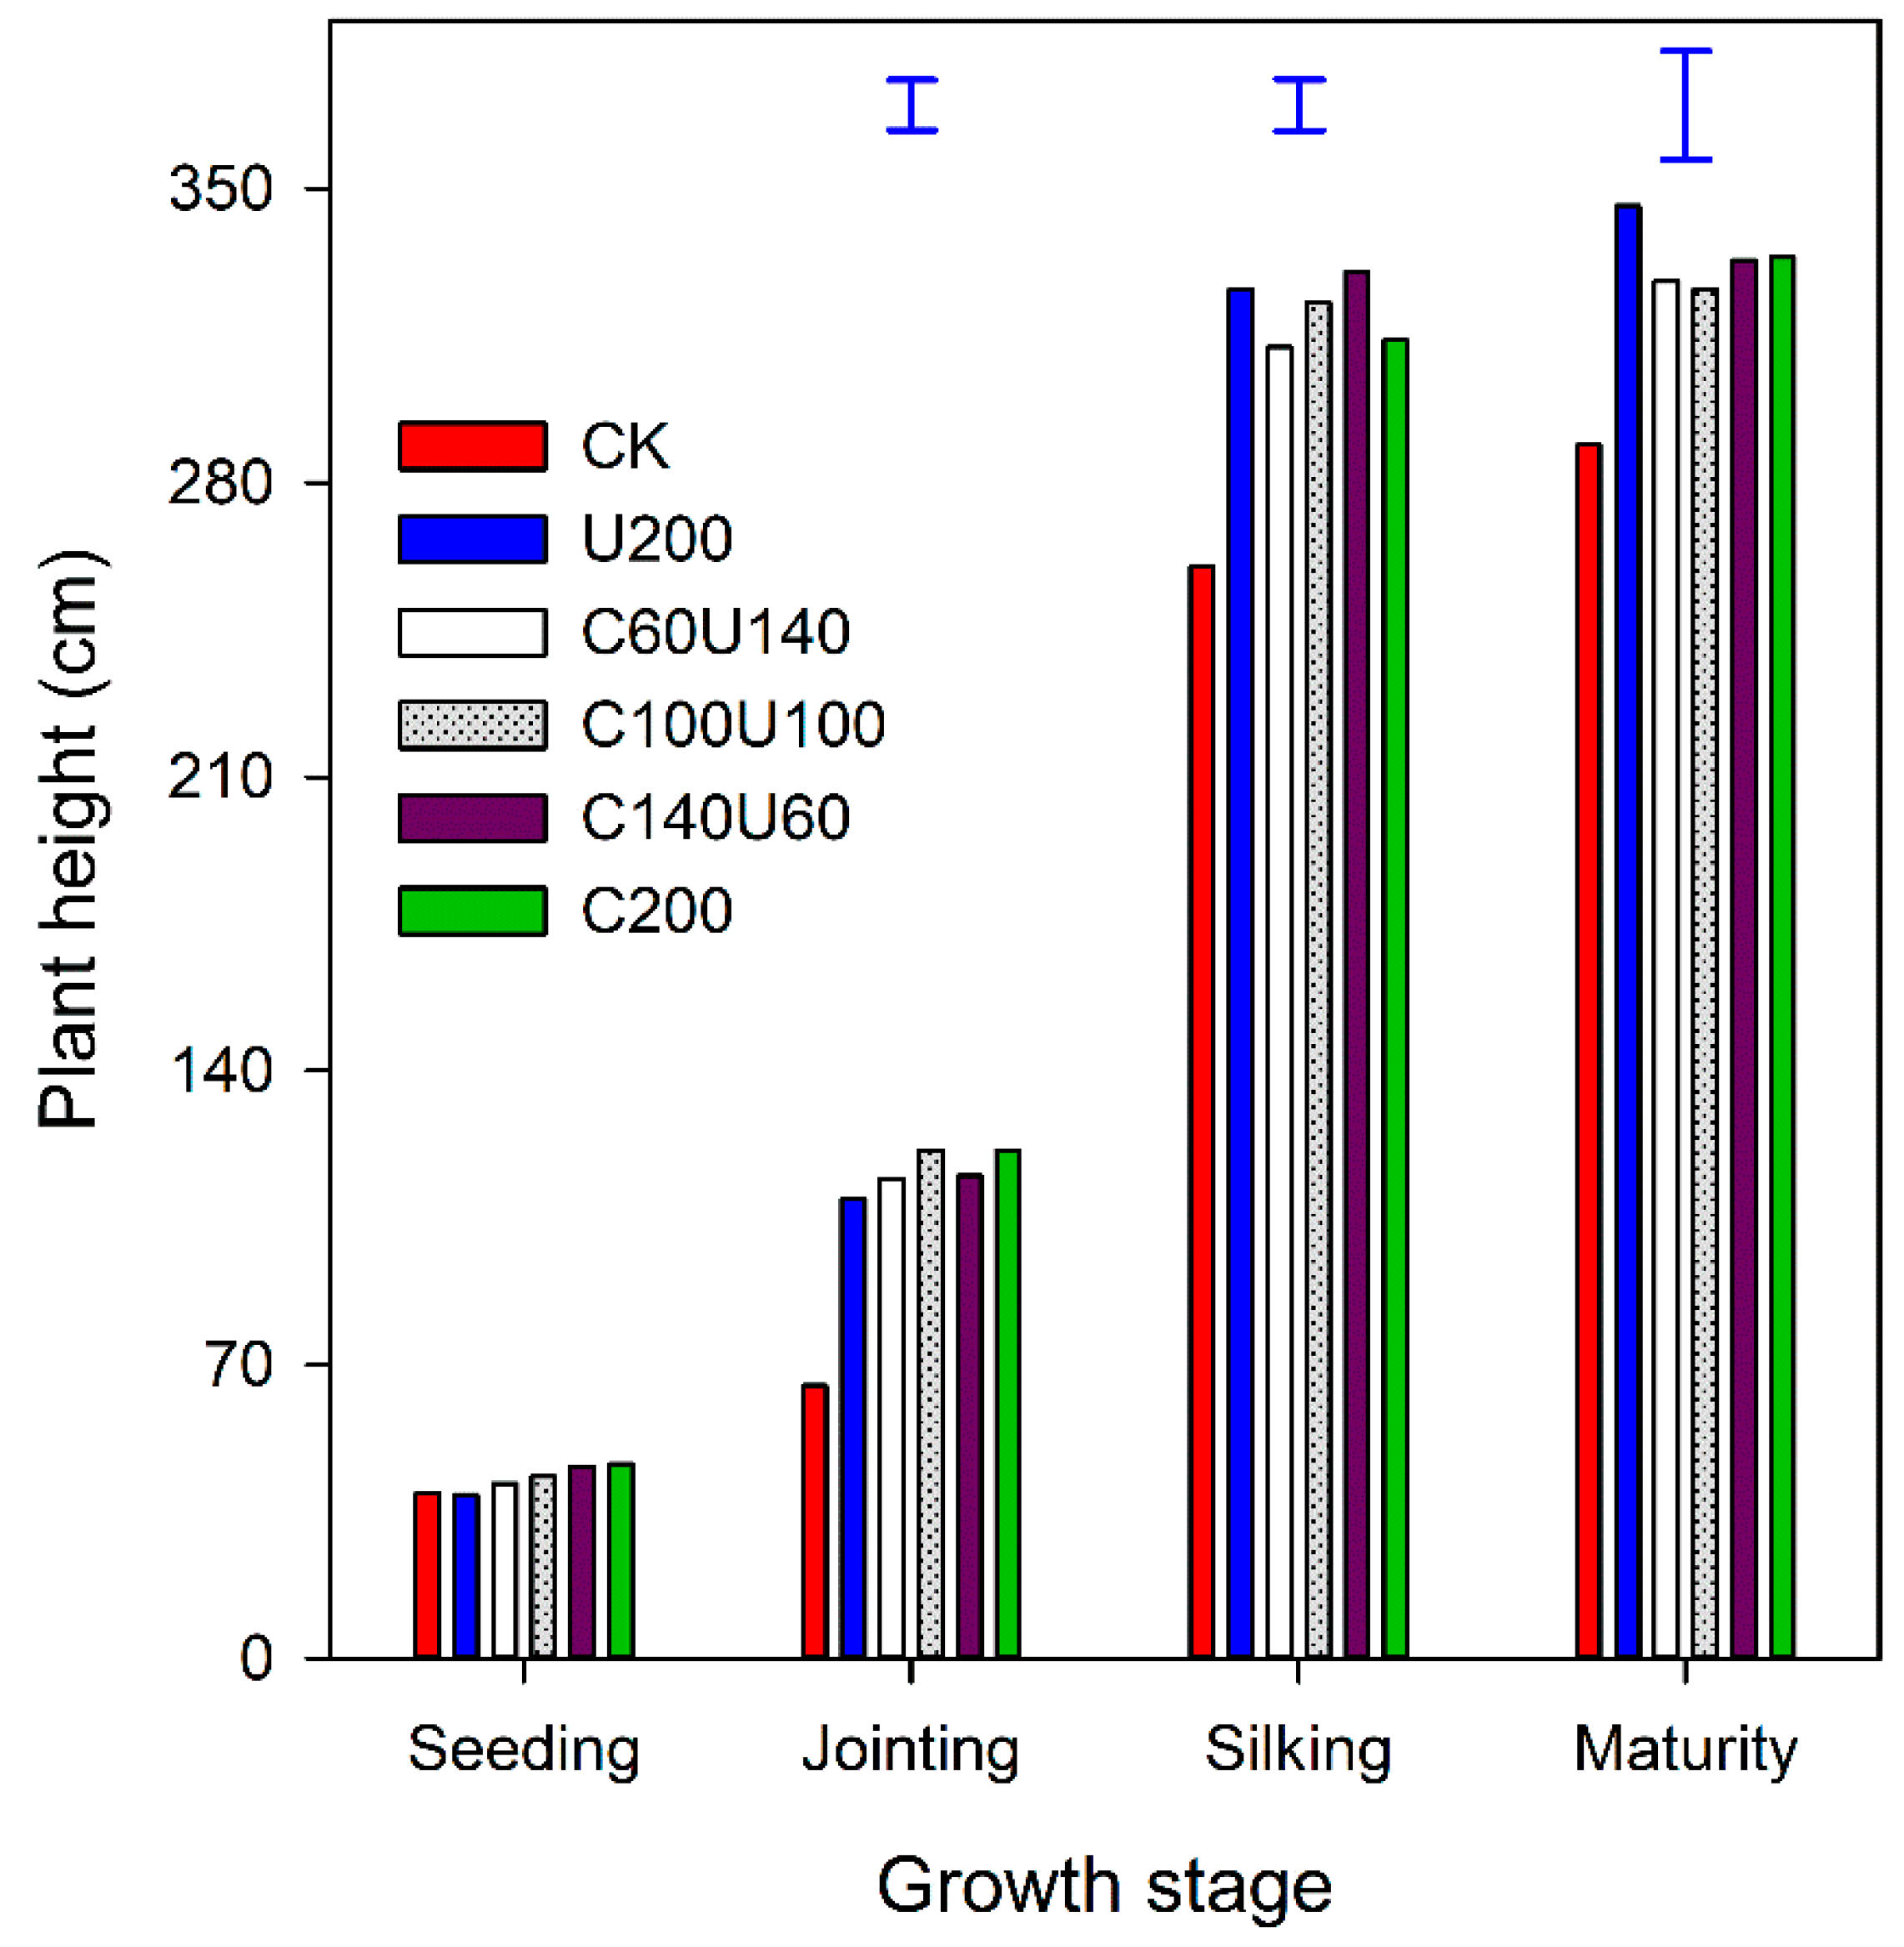
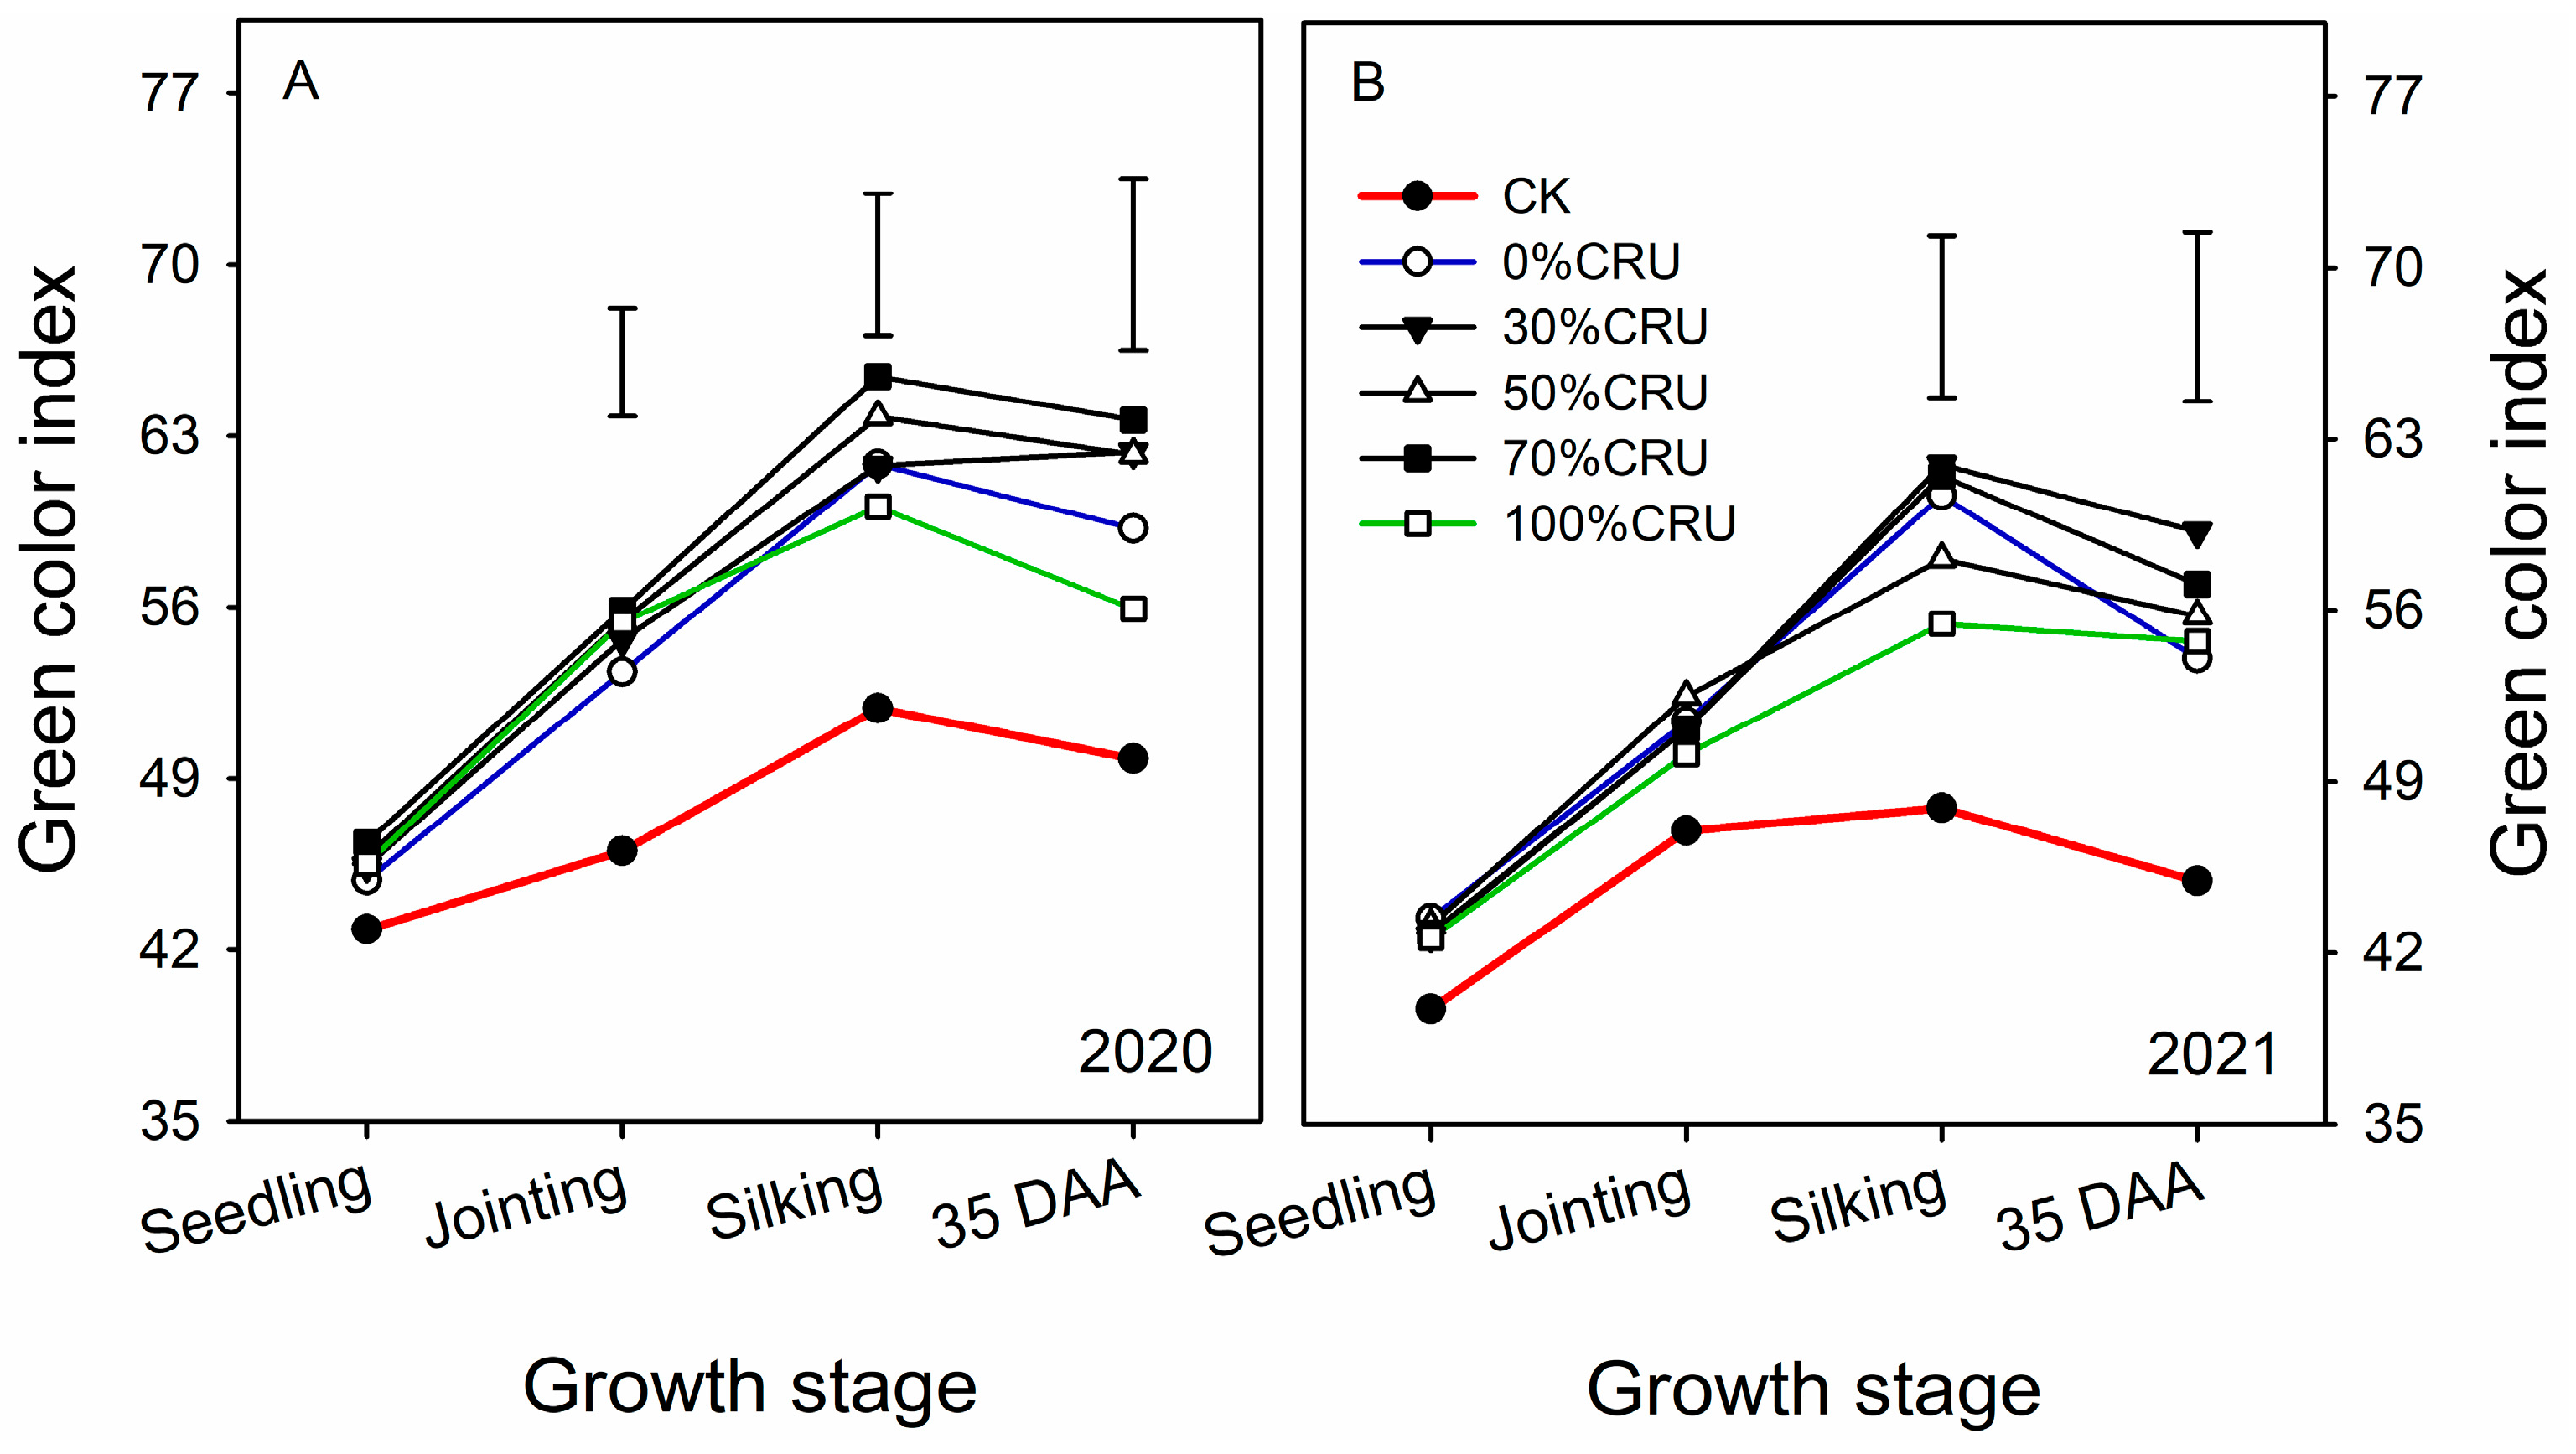
3.4. Effect of Controlled-Release N Fertilization on Chlorophyll Content and Dry Matter Accumulation and Remobilization

The plant height of maize at the seedling stage was not significantly different among N treatments, but compared to the treatment without N, N fertilization significantly increased plant height at the jointing stage, silking stage, milk ripening stage, and maturity stage, respectively (Figure 5). However, controlled-release N fertilization did not significantly affect plant height at all the growth stages compared to common N fertilization (i.e., 0%CRU). N fertilization increased the green color index (SPAD) compared to without N fertilization (Figure 6). Compared to common N fertilization, controlled-release N fertilization slightly increased SPAD values, and the improvement in chlorophyll content showed an increasing trend with the extension of the growth period (Figure 6A,B).
Biomass accumulation of maize varied with year, growing stage, and N treatments (Table 5). Biomass accumulation in the 2020 season was greater at the seedling stage, jointing stage, and silking stage than in the 2021 season, but it was higher at the milk ripening stage and maturity stage in the 2021 season. Compared to the treatment without N, averaged across the five N application treatments, biomass accumulation under N fertilization was increased by 22% at the seedling stage, jointing stage, and silking stage, by 33% at the milk ripening stage, and by 37% at the maturity stage, respectively. Compared to U200, on average, controlled-release N fertilization increased biomass accumulation by 12% at the seedling stage, by 7% at the jointing stage, by 8% at the silking stage, by 11% at the milk ripening stage, and by 5% at the maturity stage, respectively; meanwhile, the proportion of biomass increase under 70%CRU was larger at all growth stages than that in the other treatments.
Pre-anthesis dry matter remobilization (DMR), post-anthesis DM accumulation (PDM), the extent to which pre-anthesis dry matter is mobilized to the grain (CDMR), and the extent to which post-anthesis dry matter accumulates in the grain (CPDM) were affected by year and N managements (Table 6). DMR, PDM, CDMR, and CPDM in the 2020 growing season were lower than in 2021. On average, CDMR varied from 13.4% to 32.4%, and CPDM varied from 67.7% to 86.7%. The treatment without N fertilization significantly enhanced DMR and CDMR, but reduced PDM and CPDM when compared to N fertilization treatments (Table 5). Compared to 0%CRU, controlled-release N fertilization significantly increased DMR and CDMR. DMR and CDMR were the greatest in 50%CRU and were lowest in 0%CRU. Compared to 0%CRU, PDM in 70%CRU was significantly increased by 12%, but it was not significantly different in the other treatments. However, controlled-release N fertilization tended to decrease CPDM. Under 200 kg N ha−1, the greatest CDMR was observed in 0%CRU, followed by 30%CRU and 70%CRU, and was lowest in 50%CRU and 100%CRU.

3.5. Effect of Controlled-Release N Fertilization on Yield and Water Use Efficiency

Grain quantity per ear, 100-grain weight, and grain yield were lower in CK than in other treatments (Table 7). Under the same N application rate, compared to 0%CRU, grain number per ear in 70%CRU was significantly increased by 6.0% and 8.5% in the 2020 and 2021 seasons, respectively; 100-grain weight was increased by 9.2 and 10.8 (p > 0.05), respectively, in the 2020 and 2021 growing seasons. The quantity of grains per ear and the weight of 100 grains showed an average increase of 7.2% and 10.0%, respectively, under the 70%CRU treatment compared to the 0%CRU treatment. Grain yield was greater in 2020 (wet) than in 2021 (dry). Compared to 0%CRU, grain yield under 70%CRU was significantly increased by 30.1 and 11.9%, respectively, in the 2020 and 2021 growing seasons (p < 0.05). On average, grain yield was highest in 70%CRU, followed by 50%CRU, 100%CRU, 30%CRU, and 0%CRU, and was lowest in CK. The harvest index varied from 45.6% to 55.6%; on average, the HI was highest in 50%CRU and 70%CRU, followed by 30%CRU, and was lowest in CK, 100%CRU, and 0%CRU.
WUEg varied from 22.6 kg mm−1 ha−1 to 36.7 kg mm−1 ha−1 among different N treatments. The lowest WUEg was found in CK. Under the same N application rate, on average, WUEg tended to increase with the proportion of the controlled-release nitrogen fertilizer application. WUEg under 70%CRU was significantly increased by 17.2% compared to 0%CRU (Table 8). The trend of WUEg change with N management is consistent with the trend of WUEg change (Table 8).

3.6. Effect of Controlled-Release N Fertilization on Nitrogen Use Efficiency

The agronomic efficiency of nitrogen (AEN), apparent nitrogen recovery (ANR), and physiological use efficiency of nitrogen (PhEN) varied with year and N treatments (Table 9). On average, AEN was significantly increased by 23.5, 51.0, 90.8, and 25.5%, respectively, in 30%CRU, 50%CRU, 70%CRU, and 100%CRU when compared to 0%CRU (Table 9). ANR varied from 26.1% to 39.7%; on average, ANR was highest in 100%CRU, followed by 70%CRU and 50%CRU, and was lowest in 30%CRU and 0%CRU. The physiological use efficiency of nitrogen varied from 14.6 kg kg−1 to 83.8 kg kg−1; PhEN increased with an increase in the controlled-release urea application amount.

4. Discussion

4.1. Effect of Controlled-Release N Fertilization on Soil Enzyme Activities, Biomass Accumulation, and Grain Yield

Soil enzyme activities were greatly increased under N fertilization, mainly because fertilizer application regulated the activities of enzymes involved in nutrient turnover’s utilization of substrate [39,40]. At the silking stage, controlled-release nitrogen fertilization increased the associated enzymes involved in soil nitrogen utilization, such as soil urease, nitrate reductase, and nitrite reductase, to variable degrees, consistent with a previous study [41]. It is very important to improve the soil nitrogen supply and promote the nitrogen uptake of maize. However, under controlled-release urea fertilization, compared to conventional urea treatment, there was no increase in the content of soil nitrate nitrogen content and alkali-hydrolyzable nitrogen. This was likely because high biomass accumulation enhanced N uptake, thus reducing soil nitrate nitrogen and alkali-hydrolyzable nitrogen concentrations in controlled-release urea fertilizer treatments.
In dryland regions, the productivity of crops is significantly influenced by both soil water conditions and fertilization practices [4,19]. Nitrogen fertilization increased grain yield, mainly because of an increase in biomass accumulation, especially post-anthesis dry matter buildup, thus improving the grain no. per ear and grain weight, which is in line with earlier research [4,19,31]. Our two-year study showed that controlled-release N fertilization increased grain yield. Similar findings were discovered in wheat and maize cropping seasons [2,10,23]. Grain yield was increased with the proportion of the controlled-release nitrogen fertilizer application increase, mainly because of a greater biomass accumulation during the growth period and pre-anthesis dry matter remobilization. High biomass accumulation and pre-anthesis dry matter remobilization increased yield components, such as the grain no. per ear and 100-grain weight, as it has been shown in previous studies [4,19,38,42]. In this study, grain yield first increases and then decreases with an increase in the proportion of controlled-release nitrogen fertilization; this was likely because the increases in biomass accumulation and pre-anthesis dry matter remobilization were not accompanied by an increase in the proportion of controlled-release nitrogen fertilizer application, When the proportion of controlled-release nitrogen fertilizer application exceeds 70%, the accumulation of biomass showed a downward trend, which is in agreement with results from a previous study [41].

4.2. Effect of Controlled-Release N Fertilization on Water and Nitrogen Use Efficiency

High biomass accumulation under controlled-release urea, especially biomass accumulation during the vegetative growth stage, greatly enhanced WUEb, thereby improving WUEg. Similar findings were discovered in the wheat growing season [4,7]. This is likely because the greater biomass accumulation before anthesis increases canopy cover, reduces canopy temperature, and enhances crop transpiration efficiency [38,43,44]. This result is supported by our evidence that although controlled-release urea application significantly increased biomass accumulation, it did not increase evapotranspiration. The trend of changes in the agronomic efficiency of nitrogen is similar to WUEg. Controlled-release nitrogen fertilization increases the nitrogen use efficiencies of maize, which is in agreement with results from previous studies [16,23,27]. As the amount of controlled-release urea applied increases, the agronomic efficiency of nitrogen initially improves and then declines. Maize has shown similar responses in previous studies [10,25,27]. The high agronomic efficiency of nitrogen was associated with an increase in biomass accumulation, grain no. per ear, 100-grain weight, and harvest index. High N uptake under controlled-release urea enhanced biomass accumulation, thus increasing apparent nitrogen recovery. Increased biomass accumulation and grain yield improved the physiological use efficiency of nitrogen, ultimately leading to an increase in the agronomic efficiency of nitrogen. These findings suggest that there is an optimal proportion of controlled-release urea application that can enhance the efficiency of nitrogen in maize farming in the semiarid region of the Loess Plateau. Taking all the factors into consideration, we conclude that a combination of 70% controlled-release urea and 30% common urea should be considered as the suitable application ratio in the semiarid region of Loess Plateau within western China.

5. Conclusions

The present findings illustrate the significant prospects for optimizing the N fertilizer management for spring maize on the semiarid Loess Plateau. This study found that 70%CRU combined with 30% common urea had great potential for improving the resource utilization efficiency of maize under plastic film mulching on the semiarid Loess Plateau. Nevertheless, the expensive cost of controlled-release urea also has limitations on the popularization of this fertilizer. In the future, we should pay more attention to the low-cost production of controlled-release urea for improving its promotion, and multi-locational studies are also suggested to clarify how climatic variations in different semiarid regions would influence the potential effects of N fertilization on maize yield and water and nitrogen utilization efficiency.

Author Contributions

Conceptualization, J.Z. and L.W. (Linlin Wang); methodology, T.F.; software, J.Z.; validation, L.W. (Lei Wang) and G.Z. (Gang Zhao); formal analysis, G.Z.(Gang Zhou) and Y.D.; investigation, J.Z. and S.L.; resources, J.Z. and G.Z. (Gang Zhao); data curation, J.Z.; writing—original draft preparation, J.Z. and L.W. (Linlin Wang); writing—review and editing, S.K.F. and J.A.P.; visualization, J.Z. and L.W. (Linlin Wang); supervision, J.Z. and L.W. (Linlin Wang); project administration, J.Z. and L.W. (Linlin Wang); funding acquisition, J.Z. and L.W. (Linlin Wang) All authors have read and agreed to the published version of the manuscript.

Funding

This work was supported by the National Key Research and Development Plan Project (2021YFD1900700), Foundation of Key Laboratory of High-Water Utilization on Dryland of Gansu Province (HNSJJ-2021), and Project of Gansu Academy of Agricultural Sciences (2019GAAS28).

Data Availability Statement

Not applicable.

Acknowledgments

We appreciate the excellent technical assistance for field sampling and laboratory tests provided by undergraduate and graduate students at the Northwest Dry Farming Nutrition and Fertilization Scientific Observation and Experiment Station of the Ministry of Agriculture and Rural Affairs.

Conflicts of Interest

The authors declare no conflict of interest.

References

  1. Deng, X.; Shan, L.; Zhang, H.; Turner, N.C. Improving agricultural water use efficiency in arid and semiarid areas of China. Agric. Water Manag. 2006, 80, 23–40. [Google Scholar] [CrossRef]
  2. Guo, L.; Ning, T.; Nie, L.; Li, Z.; Lal, R. Interaction of deep placed controlled-release urea and water retention agent on nitrogen and water use and maize yield. Eur. J. Agron. 2016, 75, 118–129. [Google Scholar] [CrossRef]
  3. Lal, R. Climate-strategic agriculture and the water-soil-waste nexus. J. Plant Nutr. Soil Sci. 2013, 176, 479–493. [Google Scholar] [CrossRef]
  4. Wang, L.; Palta, J.A.; Chen, W.; Chen, Y.; Deng, X. Nitrogen fertilization improved water-use efficiency of winter wheat through increasing water use during vegetative rather than grain filling. Agric. Water Manag. 2018, 197, 41–53. [Google Scholar]
  5. Huang, G.; Chen, W.; Li, F. Rainfed farming systems in the Loess Plateau of China. In Rainfed Farming System; Tow, P., Cooper, I., Partridge, I., Birch, C., Eds.; Springer: Dordrecht, The Netherlands, 2011; pp. 643–669. [Google Scholar]
  6. Yang, X.; Li, P.; Zhang, S.; Sun, B.; Xinping, C. Long-term-fertilization effects on soil organic carbon, physical properties, and wheat yield of a loess soil. J. Plant Nutr. Soil Sci. 2011, 174, 775–784. [Google Scholar] [CrossRef]
  7. Peng, Z.; Wang, L.; Xie, J.; Li, L.; Coulter, J.A.; Zhang, R.; Luo, Z.; Cai, L.; Carberry, P.; Whitbread, A. Conservation tillage increases yield and precipitation use efficiency of wheat on the semi-arid Loess Plateau of China. Agric. Water Manag. 2020, 231, 106024. [Google Scholar]
  8. Wang, L.; Zechariah, E.; Fudjoe, S.K.; Li, L.; Xie, J.; Luo, Z.; Cai, L.; Khan, S.; Xu, W.; Chen, Y. Continuous maize cultivation with high nitrogen fertilizers associated with the formation of dried soil layers in the semiarid farmland on the Loess Plateau. J. Hydrol. 2022, 613, 128324. [Google Scholar]
  9. Godfray, H.C.J.; Beddington, J.R.; Crute, I.R.; Haddad, L.; Lawrence, D.; Muir, J.F.; Pretty, J.; Robinson, S.; Thomas, S.M.; Toulmin, C. Food security: The challenge of feeding 9 billion people. Science 2010, 327, 812–818. [Google Scholar]
  10. Zhang, W.; Liang, Z.; He, X.; Wang, X.; Shi, X.; Zou, C.; Chen, X. The effects of controlled release urea on maize productivity and reactive nitrogen losses: A meta-analysis. Environ. Pollut. 2019, 246, 559–565. [Google Scholar]
  11. Chen, X.; Cui, Z.; Fan, M.; Vitousek, P.; Zhao, M.; Ma, W.; Wang, Z.; Zhang, W.; Yan, X.; Yang, J.; et al. Producing more grain with lower environmental costs. Nature 2014, 514, 486–489. [Google Scholar] [CrossRef]
  12. Ju, X.-T.; Xing, G.-X.; Chen, X.-P.; Zhang, S.-L.; Zhang, L.-J.; Liu, X.-J.; Cui, Z.-L.; Yin, B.; Christie, P.; Zhu, Z.-L.; et al. Reducing environmental risk by improving N management in intensive Chinese agricultural systems. Proc. Natl. Acad. Sci. USA 2009, 106, 3041–3046. [Google Scholar] [CrossRef] [PubMed]
  13. Abdo, A.I.; Shi, D.; Li, J.; Yang, T.; Wang, X.; Li, H.; Abdel-Hamed, E.M.; Merwad, A.-R.M.; Wang, L. Ammonia emission from staple crops in China as response to mitigation strategies and agronomic conditions: Meta-analytic study. J. Clean. Prod. 2021, 279, 123835. [Google Scholar]
  14. Wang, L.; Coulter, J.A.; Li, L.; Luo, Z.; Chen, Y.; Deng, X.; Xie, J. Plastic mulching reduces nitrogen footprint of food crops in China: A meta-analysis. Sci. Total Environ. 2020, 748, 141479. [Google Scholar] [PubMed]
  15. Huang, J.; Xu, C.-C.; Ridoutt, B.G.; Wang, X.-C.; Ren, P.-A. Nitrogen and phosphorus losses and eutrophication potential associated with fertilizer application to cropland in China. J. Clean. Prod. 2017, 159, 171–179. [Google Scholar]
  16. Bai, J.; Li, Y.; Zhang, J.; Xu, F.; Bo, Q.; Wang, Z.; Li, Z.; Li, S.; Shen, Y.; Yue, S. Straw returning and one-time application of a mixture of controlled release and solid granular urea to reduce carbon footprint of plastic film mulching spring maize. J. Clean. Prod. 2021, 280, 124478. [Google Scholar]
  17. Wang, S.; Luo, S.; Li, X.; Yue, S.; Shen, Y.; Li, S. Effect of split application of nitrogen on nitrous oxide emissions from plastic mulching maize in the semiarid Loess Plateau. Agric. Ecosyst. Environ. 2016, 220, 21–27. [Google Scholar] [CrossRef]
  18. Xie, J.; Wang, L.; Li, L.; Coulter, J.A.; Chai, Q.; Zhang, R.; Luo, Z.; Carberry, P.; Rao, K. Subsoiling increases grain yield, water use efficiency, and economic return of maize under a fully mulched ridge-furrow system in a semiarid environment in China. Soil Tillage Res. 2020, 199, 104584. [Google Scholar]
  19. Xie, J.; Wang, L.; Li, L.; Anwar, S.; Luo, Z.; Fudjoe, S.K.; Meng, H. Optimal Nitrogen Rate Increases Water and Nitrogen Use Efficiencies of Maize under Fully Mulched Ridge–Furrow System on the Loess Plateau. Agriculture 2022, 12, 1799. [Google Scholar] [CrossRef]
  20. Li, T.; Zhang, W.; Yin, J.; Chadwick, D.; Norse, D.; Lu, Y.; Liu, X.; Chen, X.; Zhang, F.; Powlson, D.; et al. Enhanced-efficiency fertilizers are not a panacea for resolving the nitrogen problem. Glob. Change Biol. 2018, 24, e511–e521. [Google Scholar] [CrossRef]
  21. Azeem, B.; KuShaari, K.; Man, Z.B.; Basit, A.; Thanh, T.H. Review on materials & methods to produce controlled release coated urea fertilizer. J. Control. Release 2014, 181, 11–21. [Google Scholar]
  22. Payne, K.M.; Hancock, D.W.; Cabrera, M.L.; Lacy, R.C.; Kissel, D.E. Blending polymer-coated nitrogen fertilizer improved bermudagrass forage production. Crop Sci. 2015, 55, 2918–2928. [Google Scholar] [CrossRef]
  23. Geng, J.; Chen, J.; Sun, Y.; Zheng, W.; Tian, X.; Yang, Y.; Li, C.; Zhang, M. Controlled release urea improved nitrogen use efficiency and yield of wheat and corn. Agron. J. 2016, 108, 1666–1673. [Google Scholar] [CrossRef]
  24. Hu, H.; Ning, T.; Li, Z.; Han, H.; Zhang, Z.; Qin, S.; Zheng, Y. Coupling effects of urea types and subsoiling on nitrogen–water use and yield of different varieties of maize in northern China. Field Crops Res. 2013, 142, 85–94. [Google Scholar] [CrossRef]
  25. Yao, Z.; Zhang, W.; Wang, X.; Zhang, L.; Zhang, W.; Liu, D.; Chen, X. Agronomic, environmental, and ecosystem economic benefits of controlled-release nitrogen fertilizers for maize production in Southwest China. J. Clean. Prod. 2021, 312, 127611. [Google Scholar] [CrossRef]
  26. Hu, H.; Ning, T.; Li, Z.; Han, H.; Zhang, Z.; Qin, S.; Zheng, Y. Improving crop yields, nitrogen use efficiencies, and profits by using mixtures of coated controlled-released and uncoated urea in a wheat-maize system. Field Crops Res. 2017, 205, 106–115. [Google Scholar]
  27. Guo, J.; Wang, Y.; Blaylock, A.D.; Chen, X. Mixture of controlled release and normal urea to optimize nitrogen management for high-yielding (>15 Mg ha−1) maize. Field Crops Res. 2017, 204, 23–30. [Google Scholar] [CrossRef]
  28. Kaur, G.; Zurweller, B.A.; Nelson, K.A.; Motavalli, P.P.; Dudenhoeffer, C.J. Soil waterlogging and nitrogen fertilizer management effects on corn and soybean yields. Agron. J. 2017, 109, 97–106. [Google Scholar] [CrossRef]
  29. Rubin, J.C.; Struffert, A.M.; Fernández, F.G.; Lamb, J.A. Maize yield and nitrogen use efficiency in upper midwest irrigated sandy soils. Agron. J. 2016, 108, 1681–1691. [Google Scholar] [CrossRef]
  30. Yu, H.; Tremblay, N.; Wang, Z.; Bélec, C.; Yang, G.; Grant, C. Evaluation of Nitrogen Sources and Application Methods for Nitrogen-Rich Reference Plot Establishment in Corn. Agron. J. 2010, 102, 23–30. [Google Scholar] [CrossRef]
  31. Li, T.; Liu, J.; Wang, S.; Zhang, Y.; Zhan, A.; Li, S. Maize yield response to nitrogen rate and plant density under film mulching. Agron. J. 2018, 110, 996–1007. [Google Scholar] [CrossRef]
  32. Gong, Z. Chinese Soil Taxonomy; Science Press: Beijing, China, 2001. [Google Scholar]
  33. del Carmen Cuevas-Díaz, M.; Martínez-Toledo, Á.; Guzmán-López, O.; Torres-López, C.P.; del C Ortega-Martínez, A.; Hermida-Mendoza, L.J. Catalase and phosphatase activities during hydrocarbon removal from oil-contaminated soil amended with agro-industrial by-products and macronutrients. Water Air Soil Pollut. 2017, 228, 159. [Google Scholar] [CrossRef]
  34. Jin, K.; Sleutel, S.; Buchan, D.; De Neve, S.; Cai, D.; Gabriels, D.; Jin, J. Changes of soil enzyme activities under different tillage practices in the Chinese Loess Plateau. Soil Tillage Res. 2009, 104, 115–120. [Google Scholar] [CrossRef]
  35. Abdelmagid, H.; Tabatabai, M. Nitrate reductase activity of soils. Soil Biol. Biochem. 1987, 19, 421–427. [Google Scholar] [CrossRef]
  36. Barro, F.; Fontes, A.G.; Maldonado, J.M. Organic nitrogen content and nitrate and nitrite reductase activities in tritordeum and wheat grown under nitrate or ammonium. Plant Soil 1991, 135, 251–256. [Google Scholar] [CrossRef]
  37. Arduini, I.; Masoni, A.; Ercoli, L.; Mariotti, M. Grain yield, and dry matter and nitrogen accumulation and remobilization in durum wheat as affected by variety and seeding rate. Eur. J. Agron. 2006, 25, 309–318. [Google Scholar] [CrossRef]
  38. Wang, L.; Wang, S.; Chen, W.; Li, H.; Deng, X. Physiological mechanisms contributing to increased water-use efficiency in winter wheat under organic fertilization. PLoS ONE 2017, 12, e0180205. [Google Scholar] [CrossRef]
  39. Pérez-Guzmán, L.; Acosta-Martínez, V.; Phillips, L.A.; Mauget, S.A. Resilience of the microbial communities of semiarid agricultural soils during natural climatic variability events. Appl. Soil Ecol. 2020, 149, 103487. [Google Scholar] [CrossRef]
  40. Wang, X.; Wang, G.; Guo, T.; Xing, Y.; Mo, F.; Wang, H.; Fan, J.; Zhang, F. Effects of plastic mulch and nitrogen fertilizer on the soil microbial community, enzymatic activity and yield performance in a dryland maize cropping system. Eur. J. Soil Sci. 2021, 72, 400–412. [Google Scholar] [CrossRef]
  41. Ji, P.; Peng, Y.; Cui, Y.; Li, X.; Tao, P.; Zhang, Y. Effects of reducing and postponing controlled-release urea application on soil nitrogen regulation and maize grain yield. Int. J. Agric. Biol. Eng. 2022, 15, 116–123. [Google Scholar] [CrossRef]
  42. Yang, J.; Zhang, J.; Liu, L.; Wang, Z.; Zhu, Q. Carbon remobilization and grain filling in Japonica/Indica hybrid rice subjected to postanthesis water deficits. Agron. J. 2002, 94, 102–109. [Google Scholar] [CrossRef]
  43. Kang, S.; Shi, W.; Zhang, J. An improved water-use efficiency for maize grown under regulated deficit irrigation. Field Crops Res. 2000, 67, 207–214. [Google Scholar] [CrossRef]
  44. Turner, N.C. Agronomic options for improving rainfall-use efficiency of crops in dryland farming systems. J. Exp. Bot. 2004, 55, 2413–2425. [Google Scholar] [CrossRef] [PubMed]
Figure 1. Monthly total precipitation from 2020 to 2021 and the long-term (1983–2019) average at the Northwest Dry Farming Nutrition and Fertilization Scientific Observation and Experiment Station of the Ministry of Agriculture and Rural Affairs. Within the growing season, S, V6, R1, and R6 indicate the time of maize sowing, the six-leaf collar stage of maize (jointing stage), the silking stage of maize, and maize physiological maturity, respectively.
Agronomy 13 02320 g001
Figure 2. Soil water content in the 0–200 cm soil depths for maize at different growing stages under controlled-release urea fertilizer. Shown is the mean value (n = 3). Horizontal bars denote Fisher’s protected least significant difference at p ≤ 0.05.
Agronomy 13 02320 g002
Figure 3. Average soil total nitrogen content and alkali-hydrolyzable nitrogen concentration at the silking stage in the 0–20 cm soil layer in the 2020 and 2021 growing seasons. Shown is the mean value (n = 3). Different letters represent significant differences (one-way ANOVA, p < 0.05).
Agronomy 13 02320 g003
Figure 4. Average soil nitrate nitrogen content (NO3-N) and ammonium nitrogen concentration (NH4+–N) at the silking stage in the 0–20 cm soil layer in the 2020 and 2021 growing seasons. Shown is the mean value for the two years (n = 6). Different letters represent significant differences (one-way ANOVA, p < 0.05).
Agronomy 13 02320 g004
Figure 5. Average plant height of maize at different growth stages under controlled-release urea fertilizers in 2020 and 2021. Shown is the mean value for the two years (n = 6). Vertical bars denote Fisher’s protected least significant difference at p ≤ 0.05.
Agronomy 13 02320 g005
Figure 6. Effect of controlled-release urea fertilization on green color index (SPAD) at different growth stages in 2020 and 2021. DAA, days after anthesis. Shown is the mean value (n = 3). Vertical bars denote Fisher’s protected least significant difference at p ≤ 0.05.
Agronomy 13 02320 g006
Table 1. Details of experimental treatments.
TreatmentTotal N Fertilization Rate (kg N ha−1)P2O5
CRU-NCommon Urea-Nkg ha−1
CK00120
0%CRU0225120
30%CRU67.5157.5120
50%CRU112.5112.5120
70%CRU157.567.5120
100%CRU2250120
Table 2. Seasonal rainfall for the experimental years at the Northwest Dry Farming Nutrition and Fertilization Scientific Observation and Experiment Station of the Ministry of Agriculture and Rural Affairs.
YearAnnual
Rainfall
DI 1 forSoil Water ConditionFallow
Period
DI for FallowSoil Water ConditionSeasonal RainfallDI for Soil Water Condition
(mm)Annual
Rainfall
for Annual RainfallRainfall (mm)Period Rainfallfor Fallow
Period Rainfall
(mm)Seasonal Rainfallfor Seasonal Rainfall
2020565.30.241Normal115.1−0.26 Normal450.20.48 Wet
2021549.70.09 Normal148.00.61 Wet401.7−0.04 Normal
Mean (1970–2019)540.0125.0405.5
1 Classified as dry, normal, and wet when DI < −0.5, −0.5 ≤ DI ≤ 0.5, and DI > 0.5, respectively.
Table 3. Evapotranspiration (ET) between the sowing and jointing stage, between the jointing and tasseling stage, and between the tasseling stage and physiological maturity under different controlled-release urea fertilizations during the 2020–2021 seasons.
YearTreatmentEvapotranspiration (mm)
Sowing–JointingJointing–SilkingSilking–MaturitySum
2020CK98.2 b 1148.5 b138.6 a385.3 c
0%CRU89.7 bc157.5 ab145.1 a392.2 c
30%CRU105.5 ab161.7 ab130.2 a397.5 bc
50%CRU105.9 ab170.1 a149.4 a425.5 ab
70%CRU116.8 a176.3 a148.9 a442.2 a
100%CRU86.1 c168.1 ab133.4 a387.7 c
2021CK149.8 c106.9 ab56.0 b312.7 b
0%CRU176.3 bc116.1 a81.2 a373.6 a
30%CRU204.6 a101.7 ab67.9 ab374.2 a
50%CRU204.7 a88.5 b70.4 ab363.5 a
70%CRU193.8 ab86.8 b62.9 ab343.5 ab
100%CRU195.0 ab98.3 ab53.9 b347.2 ab
AverageCK124.0 b127.7 a97.3 ab349.0 b
0%CRU133.0 b136.8 a113.2 a382.9 a
30%CRU155.1 a131.7 a99.0 ab385.9 a
50%CRU155.3 a129.3 a109.9 ab394.5 a
70%CRU155.4 a131.5 a105.9 ab392.9 a
100%CRU140.6 ab133.2 a93.7 b367.5 ab
1 Within a column, means followed by different lowercase letters are significantly different (one-way ANOVA, p ≤ 0.05).
Table 4. Average soil enzyme activities at the silking stage under different N managements during the 2020−2021 seasons.
TreatmentSoil Enzyme Activities
UreaseNitrate ReductaseNitrite ReductaseSucraseCatalase
µg NH4+-N d−1 g−1 soiµg NO2-N d−1 g−1 soiµmol NO2-N d−1 g−1 soimg Glucose d−1 g−1 soilmmol H2O2 d−1 g−1 soi
CK542.86 b 13.03 d3.14 e27.28 ab58.33 a
0%CRU577.01 ab4.73 ab3.61 de29.70 a59.34 a
30%CRU586.13 ab3.39 d5.94 b30.56 a63.22 a
50%CRU595.83 ab3.90 c4.80 c27.91 ab62.55 a
70%CRU611.79 ab4.64 b4.14 d25.00 b61.94 a
100%CRU618.99 a5.28 a6.64 a29.18 ab59.45 a
1 Within a column, means followed by different lowercase letters are significantly different (one-way ANOVA, p ≤ 0.05). Shown is the mean value (n = 6).
Table 5. Effect of controlled-release urea fertilization on biomass accumulation of maize at the seedling stage, jointing stage, silking stage, milk ripening stage, and maturity stage during the 2020–2021 seasons.
YearTreatmentBiomass Accumulation (kg ha–1)
Seedling StageJointing StageSilking StageMilk Ripening StageMaturity Stage
2020CK365 c 12143 b16,571 b20,483 c25,500 b
0%CRU415 bc2470 b15,964 b22,525 b26,378 b
30%CRU378 c2495 b16,639 b23,370 ab26,688 b
50%CRU488 b2605 ab16,804 b23,570 ab26,915 b
70%CRU590 a3110 a17,786 a24,590 a29,210 a
100%CRU485 b2690 ab17,449 a22,853 b26,558 b
2021CK318 b1981 b12,275 c15,670 d18,100 c
0%CRU351 ab2297 ab17,146 b21,697 c30,800 b
30%CRU345 b2289 ab17,871 b24,180 b31,850 b
50%CRU381 ab2393 ab18,049 ab24,693 ab31,950 b
70%CRU402 a2594 a19,104 a26,978 a34,575 a
100%CRU367 ab2168 ab18,741 ab25,991 ab32,975 ab
AverageCK342 b2062 b14,423 c18,077 d21,800 c
0%CRU383 b2384 ab16,555 b22,111 c28,589 b
30%CRU362 b2392 ab17,255 ab23,775 bc29,269 ab
50%CRU435 ab2499 ab17,427 ab24,132 ab29,433 ab
70%CRU496 a2852 a18,445 a25,784 a31,893 a
100%CRU426 ab2429 ab18,095 a24,422 ab29,767 ab
1 Within a column, means followed by different lowercase letters are significantly different (one-way ANOVA, p ≤ 0.05).
Table 6. Effect of controlled-release urea fertilizer on pre-anthesis dry matter remobilization (DMR), the contribution of pre-anthesis dry matter remobilization to grain (CDMR), post-anthesis DM accumulation (PDM), and the contribution of post-anthesis dry matter accumulation to grain (CPDM).
YearTreatmentDMRCDMRPDMCPDM
kg ha−1(%)kg ha−1(%)
2020CK2691 c 123.2 bc8929 c76.8 ab
0%CRU2065 d16.5 c10,414 b83.5 a
30%CRU3306 c24.8 b10,049 b75.2 ab
50%CRU4055 b28.6 ab10,111 ab71.4 bc
70%CRU4806 a29.6 ab11,424 a70.4 bc
100%CRU4205 ab31.6 a9109 bc68.4 c
2021CK4131 a41.5 a5825 c58.5 c
0%CRU1544 c10.2 bc13,654 b89.8 ab
30%CRU1808 c11.5 bc13,979 b88.5 ab
50%CRU2760 b16.6 b13,901 b83.4 b
70%CRU1534 c9.0 c15,471 a91.0 a
100%CRU1715 c10.8 bc14,234 ab89.2 ab
AverageCK3411 a32.4 a7377 c67.7 c
0%CRU1805 d13.4 c12,034 b86.7 a
30%CRU2557 c18.2 bc12,014 b81.9 ab
50%CRU3408 a22.6 b12,006 b77.4 b
70%CRU3170 ab19.3 b13,448 a80.7 ab
100%CRU2960 b21.2 b11,672 b78.8 b
1 Within a column, means followed by different lowercase letters are significantly different (one-way ANOVA, p ≤ 0.05).
Table 7. Effect of controlled-release urea fertilizer on maize yield components, grain yield, and harvest index (HI).
YearTreatmentGrain No. per Ear100-Grain WeightGrain YieldHI
(g)kg ha−1(%)
2020CK611.3 c 129.4 b11,620 d45.6 d
0%CRU630.4 b31.6 ab12,479 cd47.3 c
30%CRU642.4 ab30.8 ab13,355 bc50.0 b
50%CRU654.8 ab33.2 ab14,166 b52.6 b
70%CRU668.2 a34.5 a16,230 a55.6 a
100%CRU647.1 ab33.0 ab13,314 bc50.1 b
2021CK464.9 c29.0 b9956 c55.0 a
0%CRU601.2 b32.3 ab15,198 bc49.3 c
30%CRU602.1 b34.9 ab15,787 b49.6 c
50%CRU642.7 ab34.3 ab16,661 ab52.1 b
70%CRU652.3 a35.8 a17,006 a49.2 c
100%CRU616.5 ab33.5 ab15,949 b48.4 c
AverageCK538.1 d29.2 b10,788 c49.5 b
0%CRU615.8 c32.0 ab13,839 bc48.4 b
30%CRU622.3 bc32.9 ab14,571 b49.8 ab
50%CRU648.8 ab33.8 ab15,414 ab52.4 a
70%CRU660.3 a35.2 a16,618 a52.1 a
100%CRU631.8 abc33.3 ab14,632 b49.2 b
1 Within a column, means followed by different lowercase letters are significantly different (p ≤ 0.05)
Table 8. Water use efficiency for the biomass yield (WUEb) and grain yield (WUEg) of maize between sowing and jointing, between jointing and silking, and between silking and maturity as affected by controlled-release urea fertilizer during the 2020–2021 seasons.
YearTreatmentWUEb (kg ha−1 mm−1)WUEg
Sowing–JointingJointing–SilkingSilking–Maturitykg ha−1 mm−1
2020CK21.8 c 197.2 a64.4 c30.1 c
0%CRU27.5 ab85.7 b71.8 ab31.9 bc
30%CRU23.6 b87.5 b77.2 a33.6 b
50%CRU24.6 b83.5 b67.7 bc33.3 b
70%CRU26.6 b83.2 b76.7 a36.7 a
100%CRU31.2 a87.8 b68.3 bc34.4 ab
2021CK13.2 a96.3 d104.1 d22.6 c
0%CRU13.0 a127.9 c168.1 c26.4 bc
30%CRU11.2 b153.2 b205.9 b27.3 b
50%CRU11.7 b176.9 b197.5 b30.5 ab
70%CRU13.4 a190.3 a245.8 a32.9 a
100%CRU11.1 b168.6 b264.0 a29.1 ab
Average CK16.6 bc96.8 b75.8 c30.9 c
0%CRU17.9 ab103.6 ab106.4 b36.1 b
30%CRU15.4 c112.9 a121.3 ab37.8 b
50%CRU16.1 bc115.4 a109.2 b39.1 ab
70%CRU18.4 a118.5 a127.0 a42.3 a
100%CRU17.3 ab117.6 a124.6 ab39.8 ab
1 Within a column, means followed by different lowercase letters are significantly different (one-way ANOVA, p ≤ 0.05).
Table 9. Effect of controlled-release urea fertilizer on the agronomic efficiency of nitrogen (AEN), apparent nitrogen recovery (ANR), and physiological use efficiency of nitrogen (PhEN) during the 2020–2021 seasons.
YearTreatmentAENANRPhEN
kg kg−1%kg kg−1
2020CK
0%CRU3.8 d 126.1 d14.6 e
30%CRU7.7 c29.7 c26.0 c
50%CRU11.3 b33.3 bc34.0 b
70%CRU20.5 a34.5 b59.4 a
100%CRU7.5 c38.8 a19.4 d
2021CK
0%CRU23.3 c32.9 d70.8 bc
30%CRU25.9 bc34.7 c74.7 b
50%CRU29.8 ab36.3 bc82.1 a
70%CRU31.3 a37.4 b83.8 a
100%CRU26.6 b39.7 a67.1 c
AverageCK
0%CRU15.3 d29.5 c46.0 cd
30%CRU18.9 c32.2 bc52.2 bc
50%CRU23.1 b34.8 b59.1 b
70%CRU29.2 a36.0 ab72.1 a
100%CRU19.2 c39.3 a43.5 d
1 Within a column, means followed by different lowercase letters are significantly different (p ≤ 0.05).
Disclaimer/Publisher’s Note: The statements, opinions and data contained in all publications are solely those of the individual author(s) and contributor(s) and not of MDPI and/or the editor(s). MDPI and/or the editor(s) disclaim responsibility for any injury to people or property resulting from any ideas, methods, instructions or products referred to in the content.

