Abstract
Hydrological conditions are key factors in the evaluation of water resources and ecosystems. The Yongding River Basin has many irrigated areas, and excessive agricultural water consumption has led to serious water shortages and ecosystem damage. To investigate the evolution of ecohydrological conditions and their driving factors in the Yongding River basin in a changing environment, this study combines indicators of hydrologic alteration with the range of variability approach (IHA-RVA) to identify the most ecologically relevant hydrological indicators (ERHIs) and to determine the periods of hydrological variability in the basin, using the Xiangshuipu section on the Yang River as the study area. By calculating the degree of hydrological alteration, the evolutionary pattern of ecohydrological conditions in the basin was analyzed, and the WetSpa model was used to quantitatively identify the contributions of climate change, reservoir storage, and irrigation water withdrawal to the alteration of hydrological conditions. The results showed that the rise and fall rate; maximum and minimum 1 day flows; dates of maximum flow; and July flows were the most ecologically relevant hydrological indicators for the Xiangshuipu section. Variability of this section occurred between 1982 and 1988; except for the annual maximum 1 day flows and fall rate, which underwent moderate changes; all other indicators exhibited small changes and the overall hydrological alteration of the Xiangshuipu section was low. The most influential change in the hydrological conditions was irrigation water withdrawal (from specific irrigation); followed by climate change and reservoir storage. The results of this study provide an important basis for water resources utilization and ecological management in the Yongding River basin.
1. Introduction
Hydrological conditions refer to changes in the hydrological elements of natural water bodies, such as rivers, lakes, and reservoirs; over time and space [1], which play a crucial role in maintaining the stability of river ecosystems [2,3]. In 1996, Richter [4] proposed hydrological alteration indicators and evaluated the changes in hydrological conditions in the basin using 5 groups of 33 indicators. Currently, the indicator of hydrologic alteration (IHA) is widely used for the assessment of various scenarios, such as changes in hydrological conditions [5]; ecological environmental impact [6]; and ecological environment flow estimation [7]. The hydrological conditions correspond to the ecological effects of the river basin. The range of variability approach (RVA) method can calculate the degree of hydrological alteration and reflect the evolution of hydrological conditions in a basin [8,9,10]. Many scholars have combined the IHA with RVA (IHA-RVA) to analyze hydrological alteration in different river basins. First, by calculating the value of the IHA index and then by calculating the degree of change of each index using the RVA method.
Changes in hydrological conditions due to climate change and human activities pose serious challenges to the stability of watershed ecosystems and resource management [11,12]. Related studies have shown that climate change and human activities impact river basins in China in different ways [13]. River runoff in the basins of the northern regions is more influenced by human activities, whereas in the southern basins, climate change is the main factor affecting runoff variability [14]. Many researchers have explored the impact of changing environments on runoff from different perspectives. Alrajoula [15] explored the impact of dam construction on hydrological conditions and analyzed its impact on the watershed ecosystem. Lu [16] analyzed the water-sand mediation scheme of the Xiaolangdi dam on the hydrological alteration of the lower Yellow River, and Ashraf [17] evaluated the impact of climate change and river regulation on the flow system under a cold climate. The effects of climate change and human activity on watershed runoff has become a major research hotspot [18,19].
The Yongding River basin receives scarce precipitation [20,21] and is a typical water-scarce basin in northern China [22,23,24]; thus, the severe water shortages have received considerable attention from researchers [25,26,27]. The agricultural economy is an important economic source in the Yongding River basin, and water for agricultural irrigation is an important factor contributing to water scarcity in the Yongding River [28,29]. There are 52 large- and medium-sized irrigations in the upper part of the basin, with an irrigated area of 3795 km2 [30,31]. With economic development, the agricultural water consumption has increased dramatically, resulting in the degradation of the Yongding River ecosystem [32,33]. In 2020, the Ministry of Water Resources included the Yongding River in second place in the list of key rivers and lakes assessing ecological flow [34]. Upstream Xiangshuipu was set as the assessment section to strengthen the ecological protection of the Yongding River and promote the construction of an ecological civilization.
Using the Xiangshuipu section as the study area, this study used the IHA-RVA method to identify the most ecologically relevant hydrological indicators (ERHIs) and to solve the problem of redundant information in 33 IHA indicators. The evolution of the hydrological conditions was determined by calculating the hydrological variability. Based on the WetSpa model, four scenarios were established to simulate the daily runoff in the section from 1962 to 2021. The contribution of climate change, irrigation water withdrawal, and reservoir storage to hydrological alteration were quantitatively calculated, and the main driving factors affecting hydrological alteration were identified. The results of this study provide a reference for ecological management of the Yongding River basin.
2. Study Area and Data Sources
2.1. Study Area
The Yongding River basin is one of the seven major river systems in the Haihe River basin, located between 112° and 117°45′ E, and between 39° and 41°20′ N. The upper reaches flow through Neimenggu, Shanxi, Hebei, and Beijing; and consist of two major tributaries, the Yang and Sanggan Rivers, covering 43,000 km2, which accounts for 93% of the total area of the Yongding River basin (Figure 1). The Yongding River basin has a temperate continental monsoon climate with four distinct seasons. Annual precipitation is concentrated between June and September, and the average annual precipitation is between 360 and 650 mm. The Xiangshuipu Reservoir is located on the Yang River and the study area mainly includes the Zhangjiakou City, Hebei Province. There are four medium-sized irrigations and one large-sized irrigation around the Xiangshuipu Reservoir, with an average agricultural water consumption of 4.88 × 10⁸ m3 from 2015 to 2021, and an average annual precipitation of 422 mm. The high demand for agricultural water and the scarcity of rainfall have made the problem of water shortage increasingly prominent, bringing great challenges to economic and social development and ecological civilization construction.
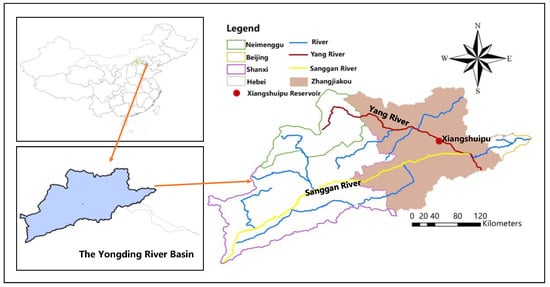
Figure 1.
The geographical location of the study area.
2.2. Data Sources
The basic data required for this study included runoff, hydro-meteorological information, irrigation water withdrawal, a digital elevation model (DEM), land use, and soil type. The hydro-meteorological data used the daily outflow of the Xiangshuipu Reservoir, as well as the daily monitoring data of the Zhangjiakou meteorological station and six rainfall stations. The irrigation water withdrawal data was obtained from 62 water withdrawal daily monitoring stations, and the agricultural water use data was obtained from the Zhangjiakou Statistical Bulletin. The DEM, land use, and soil type data were extracted using ArcGIS with a spatial resolution of 1 × 1 km.
3. Methodology
3.1. IHA-RVA Method
- (1)
- IHA indicator system
The IHA indicator system is commonly used to represent the characteristics of the change in hydrological conditions and to evaluate the process of change. It is currently the most widely used set of indicators. The IHA indicator system is divided into five groups based on flow magnitude, epoch duration, occurrence period, frequency, and the rate of change; and contains 33 hydrological indicators with corresponding ecosystem impacts (Table 1). To eliminate or reduce the response of hydrological indicators to interannual climate change, it is recommended that the length of hydrological data should be at least 20 years [35]. In the IHA index system, the characteristics of river flow change are depicted by several aspects, such as monthly flow and duration; extreme flow and pulse flow occurrence time; frequency and duration; and flow change frequency.

Table 1.
IHA indicator system.
- (2)
- Range of variability
To analyze the ecohydrological characteristics of rivers, Richter [36] proposed the RVA in 1997 and defined RVA thresholds that help determine the degree of change in the IHA. The period of stability was considered as the period before and after the variation, when the hydrological conditions were more stable for a longer period. The degree of hydrological alteration was used to quantitatively assess the degree of change in ERHIs after disturbance using 75% and 25% as the upper and lower limits of the RVA thresholds of ERHIs during stable periods, respectively. The degree of hydrological alteration is defined as follows:
where Di is the degree of hydrological alteration of the i-th ERHIs; Ni0 is the number of years in which the i-th ERHIs remains within the RVA threshold in the unstable period; Nie is the number of years in which the i-th ERHIs are expected to fall within the RVA threshold in the unstable period; r is the proportion of the i-th ERHIs within the RVA threshold in the stable period (50% in this study); and NT is the number of years recorded in the affected time series in the unstable period. The criteria for determining the degree of hydrological alteration of the ERHIs are listed in Table 2.
Table 2.
Judgment criteria for the degree of hydrological alteration.
3.2. WetSpa Model
The WetSpa model, proposed in 1996 [37], is a distributed hydrological model based on physical mechanisms for simulating water–air transport and energy exchange among the soil, vegetation, and atmosphere at the daily watershed scale (Figure 2). The model considers the processes of precipitation, interception, snowmelt, depression, infiltration, evapotranspiration, surface runoff, and subsurface runoff, and uses a multi-layer model to represent the water and energy balance of each grid cell. The grid cell size was set to 1 × 1 km, and 11 flow production parameters and 4 sink parameters were involved in determining the flow rate model. The flow production process is calculated using the grid as a unit, and the flow confluence process is calculated according to the upstream and downstream relationships one-by-one sub-basin.
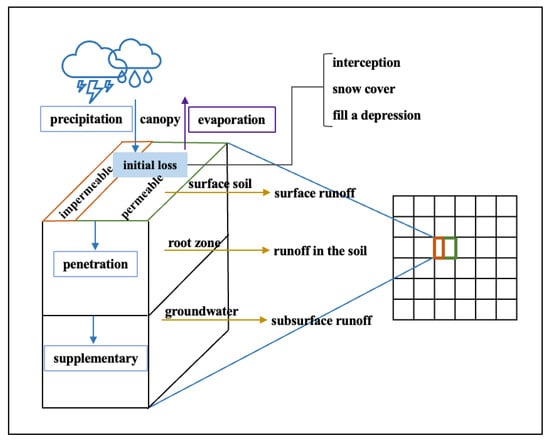
Figure 2.
Diagram showing the principles of the WetSpa model.
The WetSpa model is vertically divided into four layers: the vegetation canopy, surface layer, soil layer, and the groundwater aquifer. After precipitation has evaporated in the first layer, the model determines the surface yield by analyzing the land use, soil type, slope, rainfall intensity, and soil water content of the grid cells. Surface runoff is formed after meeting the amount of ground fill. The infiltrated part will form soil water, which will continue to move laterally to form a soil midstream as the soil water content increases, or it will infiltrate downward to form groundwater. After the infiltrated amount of water partially exceeds the storage capacity of the underground aquifer, it will flow out in the form of underground runoff. Surface runoff, underground runoff, and mid-loam flow together make up the total runoff on each grid.
Daily runoff data from the Xiangshuipu section from 2017 to 2021 were used to calibrate and verify the model parameters. The simulated time step is 1 day. We considered 2017 as the warm-up period, 2018–2019 as the calibration period, and 2020–2021 as the verification period. As the Xiangshuipu section is adjacent to the Xiangshuipu Reservoir, the storage of the reservoir has a significant influence on the simulation results of the section runoff. Therefore, the inflow of the Xiangshuipu Reservoir was calibrated and simulated. As the inflow is difficult to measure directly in the reservoir, it is usually calculated according to the observed outflow and reservoir storage using the water–balance method. However, the inconsistent observation of outflow requires imputation data, which will cause the calculated inflow to have abnormal values. But the timing and value of peaks are not impactful to the later analysis. From the simulation results (Figure 3), the relative biases (RB) of the calibration and validation period are 0.15 and 0.08, respectively. The result shows that these ‘errors’ are in an acceptable range and the simulated runoff is close to the actual runoff. This indicates that the WetSpa model is applicable to the simulation of runoff processes in the Yongding River basin and can be used for subsequent research analysis. RB is calculated as follows:
where is the simulated value of t-time flow; is the observed value of t-time; and RB is the relative biases of the simulated value and the measured value. The closer the RB value is to 0, the smaller the difference between the simulated flow and the measured flow. When |RB|< 0.2, the simulation results are considered acceptable.
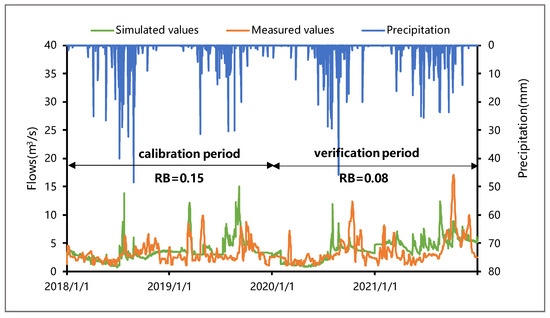
Figure 3.
Simulated and measured time series of flow rates of the Xiangshuipu Reservoir inflow during the calibration and verification period.
3.3. Driving Factor Analysis Model
As shown in Figure 4, the water withdrawal activity between the critical section and the upstream section can be generalized as one interval water withdrawal unit. The flow rate (Q) can be expressed as follows:
where I is the water arriving from upstream during the period; ∆S is the reservoir storage volume; ∆W is the inter-district water withdrawal; and L is the evaporation and seepage losses from the river.
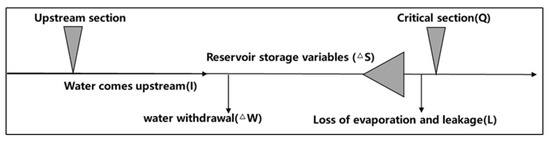
Figure 4.
Key driving factors of changes in hydrological conditions.
Equation (4) and Figure 4 show that the changes in the ecohydrological conditions of the basin are mainly influenced by three factors: climate change, water withdrawal, and reservoir storage. To quantitatively determine the degree of influence of the three factors, the multi-series contribution split method was used. The related formulae are as follows:
where Ei,1 refers to the current series (considering reservoir and withdrawal effects); Ei,2 refers to the original series (not considering reservoir and withdrawal effects); Ei,3 refers to the series only considering water withdrawal effects; and Ei,4 refers to the natural series (before variation of climate conditions).
The above four series are all calculated during the stable period. To obtain the natural series, firstly, the climate conditions during the stable period need to be revised to the level of the natural period (namely, no variation occurred). Then, the WetSpa model is driven by the revised climate conditions to obtain the daily runoff process under natural conditions.
m is the number of ERHIs indicators. Vi,1, Vi,2, and Vi,3 are the rate of change of the i-th ERHI compared to the natural series. The positive and negative of Vi,s can be seen as the relationship between Vi,s in which the change of the indicator is positively or negatively correlated. βc, βw, βr are the contributions of climate change, interval water withdrawal, and reservoir storage in relation to the change in ERHI indicator values, respectively. To avoid a small Vi,1 value, which excessively contributes to rate calculation results, when the absolute value of Vi,1 was <3%, no statistical analysis was performed.
4. Results
4.1. IHA Indicators Refinement and Screening of ERHIs
The daily runoff of the Xiangshuipu section from 1962 to 2021, was used as the data to calculate the IHA indicators. According to the simulation results, there were no zero flow days in the Xiangshuipu section; thus, the number of days of the breakage index was removed, and only the remaining 32 indices were analyzed. Figure 5 demonstrates the correlations among the indicators, which were strong, with absolute values of correlation coefficients >0.9. Specifically, there was a strong correlation between the annual maximum 7-, 30- and 90 day flows and the July, August, and September flows. There was also a strong correlation among October, November, and December flows. There is high autocorrelation among the IHA indicators, and the problem of information redundancy is prominent.
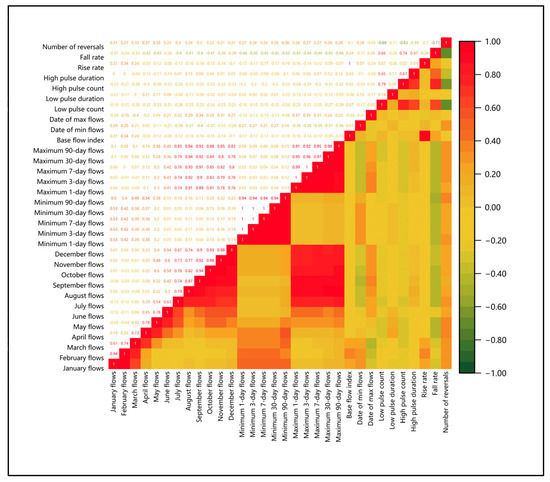
Figure 5.
Correlation of IHA indicators.
To solve the problem of redundancy in IHA indicators, we extracted and refined the IHA indicators and screened six ERHIs. As shown in Table 3, the six ERHIs involved all subgroups of IHA and achieved full coverage of the wet and dry periods. In addition, As shown in Figure 6, compared with that before the screening of the most ecologically relevant hydrological indicators, the correlation between ERHIs was significantly reduced, and the correlation coefficient between most ERHIs did not exceed 0.4. The indicators screened according to the sensitivity analysis method for similar years effectively retain the information of the original data while reducing the redundancy of the IHA variables, which is highly representative.
Table 3.
Coverage of ERHIs.
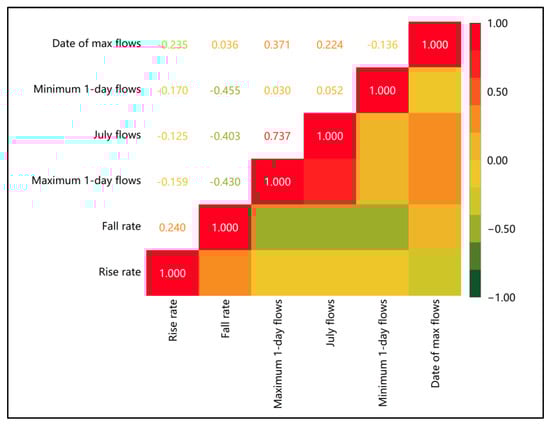
Figure 6.
Correlation of ERHIs.
4.2. Variation Period and Degree of Hydrological Alteration
- (1)
- Variation in hydrological conditions over time
Variant diagnosis of ERHIs in the Xiangshuipu section. First, the Hurst coefficient method [38] was used for the preliminary diagnosis, and indicators with a high degree of variation were used as the basis for further detailed diagnosis. The degree of variation in the ERHIs are shown in Table 4. After testing, the Hurst coefficients of the fall rate and minimum 1 day flows were 0.73 and 0.74, respectively, which indicate medium variations.
Table 4.
Variation degree of ERHIs.
Based on the preliminary diagnosis, various test methods were applied to the two indicators with the strongest degree of variation (minimum 1 day flows and fall rate) for a detailed diagnosis. The variation period of the minimum 1 day flows indicator was 1982–1988, and the variation period of the fall rate indicator was 1982–1987. The Xiangshuipu section varied between 1982 and 1988 (Table 5) during the years in which the variations were merged.
Table 5.
Diagnostic results of strong index variation.
- (2)
- Degree of hydrological alteration
The RVA thresholds and hydrological alteration of the ERHIs during the stable period was calculated based on the variation period of the Xiangshuipu section; thus, 1989–2021 was considered as the stable period. As shown in Table 6, two ERHIs were moderately altered and four ERHIs were slightly altered. Figure 7a,b show that the fall rate almost always lies outside the lower limit of the RVA during the unstable period, and the maximum 1 day flows mostly fall outside the upper limit of the RVA threshold during the unstable period with moderate hydrological alteration. The minimum 1 day flows (Figure 7c); rise rate (Figure 7d); July flows (Figure 7e); and the dates of maximum flow (Figure 7f), which are indicators of the dry period, have a low degree of variation. Generally, the overall hydrological alteration in the Xiangshuipu section was low.
Table 6.
Change the degree of ERHIs.
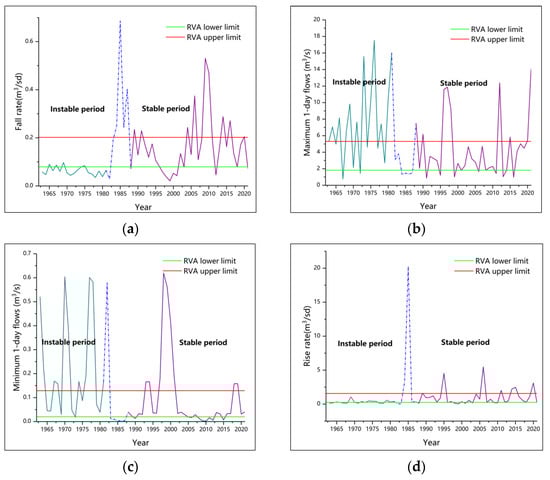
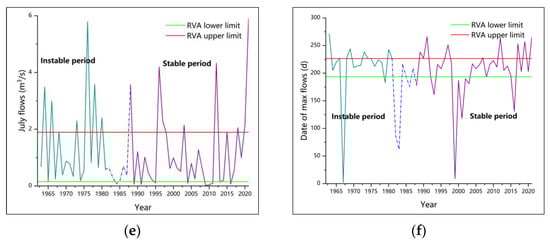
Figure 7.
RVA thresholds for ERHIs. (a) Fall rate. (b) Maximum 1 day flows. (c) Minimum 1 day flows. (d) Rise rate. (e) July flows. (f) Dates of maximum flow.
4.3. Contribution of Different Driving Factors
As the absolute value of Vi,1 of the date of maximum flows was too small (2.75%), this indicator was not considered. Only the five remaining indicators were analyzed for the driving factors contribution rate. First, the water withdrawal data were interpolated and extended to meet the data length requirements for the stable period. The contribution rate of each driving factor was calculated using Equations (2)–(7). Figure 8a shows the contribution of each driving factor to the changes in EHRI values. The indicators were mainly influenced by water withdrawal from the irrigation, except for the minimum 1 day flows which is strongly influenced by reservoir storage. Among them, water withdrawal had the greatest impact on the maximum 1 day and July flows. In addition, climate change had a negative impact on the maximum 1 day and July flows.
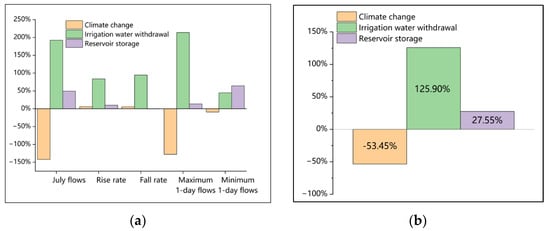
Figure 8.
Contribution of different driving factors to ERHI index values. (a) Contribution of different driving factors to the ERHI index values. (b) Contribution of different driving factors to the change in ecohydrological conditions.
Figure 8b shows the contributions of climate change, irrigation water withdrawal, and reservoir storage to the overall change in ecohydrological conditions. The contribution of climate change was negative, whereas the contributions of irrigation water withdrawal and reservoir storage were positive; the contribution of irrigation water withdrawal was larger than that of reservoir storage.
5. Discussion
5.1. The Evolution of Hydrological Conditions
By screening the IHA indicators, the analysis of indicator coverage and redundancy showed that the six ERHIs were acceptable. A variation diagnosis of the ERHIs was performed, and the variation period of the Xiangshuipu section was determined to be from 1982 to 1988. The fall and rise rates had a moderate and low degree of change, respectively; and overall, were considered to be relatively low changes. To some extent, this reflects that the flow in the Yang River changed during the study period, but it maintained a relatively stable state in the ecosystem. The maximum and minimum 1 day flows had a moderate and low degree of change, respectively; however, both decreased after variation, indicating that the habitat environment of aquatic organisms was damaged, and the ecological flow required further assurance. The July flows show a low degree of change, indicating that during the flood season, the Xiangshuipu Reservoir can be used to reduce outflow. The dates of maximum flow were low, indicating that changes in hydrological conditions had little impact on fish migration. The overall hydrological conditions of the Xiangshuipu section showed little change, indicating that the water environment of the Yang River was stable during the study period.
5.2. The Impact of Human Activities on the Hydrological Conditions
Changes in the hydrological conditions are mainly influenced by human activities, among which water withdrawal is the most influential. From the different ERHIs, the maximum 1 day and July flows were most influenced by water withdrawal. Both these indicators were in the crop-growing period when agricultural water use was higher. China implemented its land reform policy in 1978. This policy was implemented in the Yang River in the early 1980s and led to a significant increase in agricultural water use. Xiangshuipu is located in Zhangjiakou City, where agricultural production is an important economic source for the local area. According to the statistical bulletin of Zhangjiakou City from 2015 to 2021, the agricultural water use in Zhangjiakou City in all years accounted for more than 50% of the total water use in that year (Figure 9), with an overall upward trend in agricultural water use. In addition, the Xiangshuipu section is adjacent to the Yang River II Irrigation (a large irrigation) and four other medium-sized irrigations. Accelerated agriculturalization and rapid economic development during this period also led to increased water withdrawal from the irrigation.
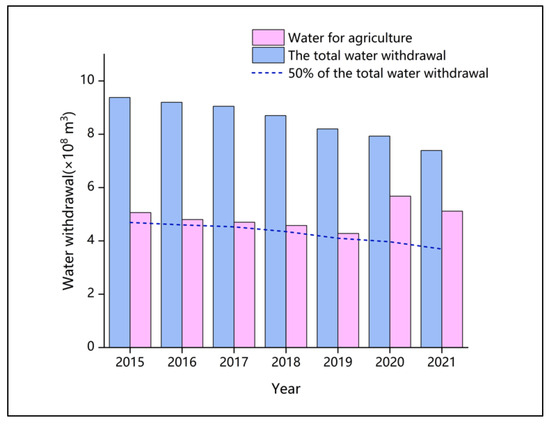
Figure 9.
Total agricultural water consumption in Zhangjiakou City (2015–2021).
Although the influence of reservoir storage on the overall hydrological conditions was small, the minimum 1 day flows were mostly influenced by the effect of reservoir storage. Figure 10 shows the course curves of the outflow and minimum 1 day flows from the Xiangshuipu Reservoir during the stabilization period. The rise and fall trends of the minimum 1 day flows coincide with the outflow of the reservoir. This indicates that during the dry period, the storage effect of the upstream reservoir has a significant influence on the runoff process of the downstream section, which can reduce water shortage problems, such as basin outflow during the dry period.
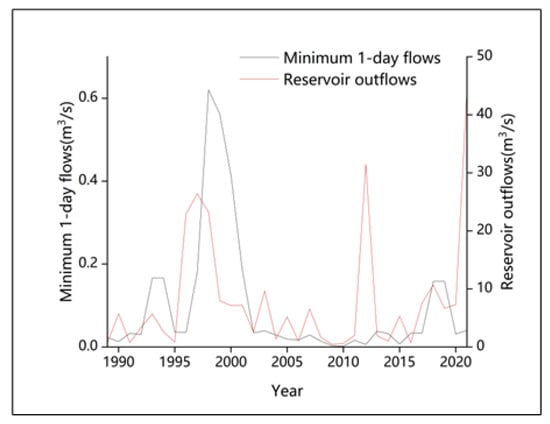
Figure 10.
The effect of storage in the Xiangshuipu Reservoir on the minimum 1 day flows.
5.3. The impact of Climate Change on Hydrological Conditions
Climate change has a negative impact on the evolution of hydrological conditions, with the greatest impact on the maximum 1 day and July flows. The maximum 1 day flows occur mostly from June to August; therefore, the average rainfall and temperature from June to August of each year during the stability period were analyzed. As shown in Figure 11, although temperature showed an insignificant downward trend (R2 = 0.06); the downward trend in precipitation was significant (R2 = 0.68). Precipitation is an important source of runoff, and a decrease in precipitation leads to a decrease in river runoff. The analysis of Figure 7b,e show that both the maximum 1 day and July flows show an increasing trend during the stabilization period. Under the combined action of different meteorological factors, climate change negatively affected the evolution of hydrological conditions.
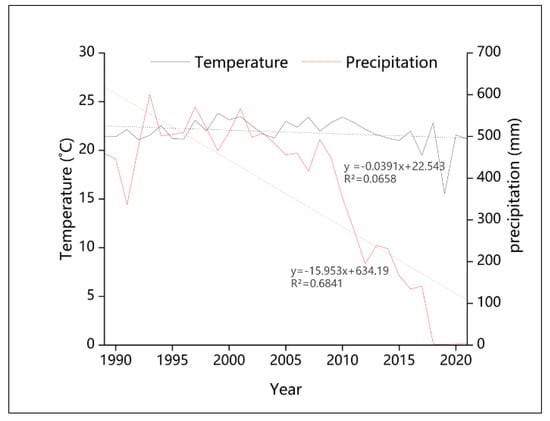
Figure 11.
Changes in temperature and precipitation during the stabilization period (1989–2021).
5.4. Limitations of this Study
In this study, when we applied the WetSpa model to simulate runoff data, only the effects of reservoir storage and irrigation water withdrawal were considered, such that the simulation results were within a reasonable error range and had scientific validity. However, actual runoff processes are also influenced by various human activities. In addition, we calculated the contribution rate of climate change as a whole while analyzing the trends of change of some climate factors. Therefore, subsequent studies should consider multiple influencing factors and separate climate factors to consider the contribution levels of the different factors, such as rainfall and temperature, to further improve simulation accuracy.
6. Conclusions
Considering that climate change and human activities continue to have an increasingly serious impact on runoff, this study combined the IHA-RVA method with the WetSpa model to calculate the degree of hydrological alteration in the Xiangshuipu section of the Yongding River basin to reveal the changing characteristics of hydrological conditions. Then, by considering climate change, reservoir storage, and irrigation water withdrawal, we simulated the daily runoff process under four scenarios based on the WetSpa model. We also quantitatively identified the key driving factors influencing the hydrological alteration by comparing different hydrological conditions in different runoff periods. The main conclusions are as follows: the IHA indicator was used to identify ERHIs and was based on periods of ecohydrological variability; and we also found that variability occurred during 1982–1988; among the ERHIs, except for the maximum 1 day flows and fall rate, which had a moderate degree of change, all other ERHIs had a low degree of change. Finally, the overall hydrological alteration in the Xiangshuipu was low, with relatively stable changes in hydrological conditions. Overall, human activity is the main factor affecting hydrological conditions, and the influence of climate change is relatively small. The contributions of the three factors, in descending order, were irrigation water withdrawal > climate change > reservoir storage. The contribution of climate change was negative. Irrigation water withdrawal is the most important reason for hydrological change. Therefore, irrigation techniques should be improved in the future to reduce water use in agriculture. Relevant departments should issue relevant policies to achieve the purpose of protecting the water resources of the Yongding River.
Author Contributions
Y.Y.: conceptualization, formal analysis, methodology, writing—original draft, visualization; S.C.: conceptualization, methodology, supervision, writing—review and editing; H.W.: supervision, writing—review and editing; P.W.: visualization, data curation W.L.: visualization. All authors have read and agreed to the published version of the manuscript.
Funding
This research was funded by the National Key Research and Development Program of China (2021YFC3000205) and the National Nature Science Fund (52209045).
Data Availability Statement
The authors do not have permission to share data.
Conflicts of Interest
The authors declare no conflict of interest.
References
- Zhao, F.; Feng, S.; Xie, F.; Zhu, S.; Zhang, S. Extraction of long time series wetland information based on Google Earth Engine and random forest algorithm for a plateau lake basin—A case study of Dianchi Lake, Yunnan Province, China. Ecol. Indic. 2023, 146, 109813. [Google Scholar] [CrossRef]
- Shih, S.; Liu, C.; Ning, J. In-river weir effects on the alteration of flow regime and regarding structural stream habitat. J. Hydrol. 2022, 615, 128670. [Google Scholar] [CrossRef]
- Wang, Y.; Rhoads, B.; Wang, D. Assessment of the flow regime alterations in the middle reach of the Yangtze River associated with dam construction: Potential ecological implications: Assessment of Flow Regime Alterations in the Yangtze River. Hydrol. Process. 2016, 30, 3949–3966. [Google Scholar] [CrossRef]
- Richter, B.; Baumgartner, J.; Powell, J. A method for assessing hydrologic alteration within ecosystems. Conserv. Biol. 1996, 10, 1163–1174. [Google Scholar] [CrossRef]
- Fang, G.; Yan, M.; Dai, L.; Huang, X.; Zhang, X.; Lu, Y. Improved indicators of hydrological alteration for quantifying the dam-induced impacts on flow regimes in small and medium-sized rivers. Sci. Total Environ. 2023, 867, 161499. [Google Scholar] [CrossRef]
- Chen, L.; Xu, Y.; Li, S.; Wang, W.; Liu, G.; Wang, M.; Shen, Z. New method for scaling nonpoint source pollution by integrating the SWAT model and IHA-based indicators. J. Environ. Manag. 2023, 325, 116491. [Google Scholar] [CrossRef]
- Tang, Y.; Chen, L.; She, Z. Evaluation of instream ecological flow with consideration of ecological responses to hydrological variations in the downstream Hongshui River Basin, China. Ecol. Indic. 2021, 130, 108104. [Google Scholar] [CrossRef]
- Lin, K.; Lin, Y.; Xu, Y.; Chen, X.; Chen, L.; Singh, V. Inter- and intra- annual environmental flow alteration and its implication in the Pearl River Delta, South China. J. Hydro-Environ. Res. 2017, 15, 27–40. [Google Scholar] [CrossRef]
- Vu, T.; Kiesel, J.; Guse, B.; Fohrer, N. Analysis of the occurrence, robustness and characteristics of abrupt changes in streamflow time series under future climate change. Clim. Risk Manag. 2019, 26, 100198. [Google Scholar] [CrossRef]
- Yu, C.; Yin, X.; Yang, Z. A revised range of variability approach for the comprehensive assessment of the alteration of flow regime. Ecol. Eng. 2016, 96, 200–207. [Google Scholar] [CrossRef]
- Lin, L.; Tang, C.; Liang, Q.; Wu, Z.; Wang, X.; Zhao, S. Rapid urban flood risk mapping for data-scarce environments using social sensing and region-stable deep neural network. J. Hydrol. 2023, 617, 128758. [Google Scholar] [CrossRef]
- Liu, Z.; Yang, Q.; Shao, J.; Wang, G.; Liu, H.; Tang, X.; Xue, Y.; Bai, L. Improving daily precipitation estimation in the data scarce area by merging rain gauge and TRMM data with a transfer learning framework. J. Hydrol. 2022, 613, 128455. [Google Scholar] [CrossRef]
- Zhao, Y.; Zou, X.; Cao, L.; Yao, Y.; Fu, G. Spatiotemporal variations of potential evapotranspiration and aridity index in relation to influencing factors over Southwest China during 1960–2013. Theor. Appl. Climatol. 2018, 133, 711–726. [Google Scholar] [CrossRef]
- Xing, W.; Wang, W.; Zou, S.; Deng, C. Projection of future runoff change using climate elasticity method derived from Budyko framework in major basins across China. Glob. Planet. Chang. 2018, 162, 120–135. [Google Scholar] [CrossRef]
- Alrajoula, M.; Al Zayed, I.; Elagib, N.; Hamdi, M. Hydrological, socio-economic and reservoir alterations of Er Roseires Dam in Sudan. Sci. Total Environ. 2016, 566–567, 938–948. [Google Scholar] [CrossRef]
- Lu, M.; Zhao, Q.; Ding, S.; Wang, S.; Hong, Z.; Jing, Y.; Wang, A. Hydro-geomorphological characteristics in response to the water-sediment regulation scheme of the Xiaolangdi Dam in the lower Yellow River. J. Clean. Prod. 2022, 335, 130324. [Google Scholar] [CrossRef]
- Ashraf, F.B.; Torabi Haghighi, A.; Marttila, H.; Kløve, B. Assessing impacts of climate change and river regulation on flow regimes in cold climate: A study of a pristine and a regulated river in the sub-arctic setting of Northern Europe. J. Hydrol. 2016, 542, 410–422. [Google Scholar] [CrossRef]
- Sheikh, V.; Sadoddin, A.; Najafinejad, A.; Zare, A.; Hollisaz, A.; Siroosi, H.; Tajiki, M.; Gholipouri, M.; Sheikh, J. The density difference and weighted RVA approaches for assessing hydrologic regime alteration. J. Hydrol. 2022, 613, 128450. [Google Scholar] [CrossRef]
- Kumar, S.; Merwade, V.; Kam, J.; Thurner, K. Streamflow trends in Indiana: Effects of long term persistence, precipitation and subsurface drains. J. Hydrol. 2009, 374, 171–183. [Google Scholar] [CrossRef]
- Deng, L.; Guo, Y.; Qi, Y.; Shen, Y. Impacts of Climate Change and Human Activities on Streamflow of Upper Yongding River Basin, North China. Water 2022, 14, 2798. [Google Scholar] [CrossRef]
- Wang, M.; Du, L.; Ke, Y.; Huang, M.; Zhang, J.; Zhao, Y.; Li, X.; Gong, H. Impact of Climate Variabilities and Human Activities on Surface Water Extents in Reservoirs of Yongding River Basin, China, from 1985 to 2016 Based on Landsat Observations and Time Series Analysis. Remote Sens. 2019, 11, 560. [Google Scholar] [CrossRef]
- Bai, Y.; Zhang, S.; Mu, E.; Zhao, Y.; Cheng, L.; Zhu, Y.; Yuan, Y.; Wang, Y.; Ding, A. Characterizing the spatiotemporal distribution of dissolved organic matter (DOM) in the Yongding River Basin: Insights from flow regulation. J. Environ. Manag. 2023, 325, 116476. [Google Scholar] [CrossRef] [PubMed]
- Dai, D.; Sun, M.; Lv, X.; Hu, J.; Zhang, H.; Xu, X.; Lei, K. Comprehensive assessment of the water environment carrying capacity based on the spatial system dynamics model, a case study of Yongding River Basin in North China. J. Clean. Prod. 2022, 344, 131137. [Google Scholar] [CrossRef]
- Lu, W.; Tang, J.; Lu, C.; Lu, C.; Jia, Y.; Sun, Q.; He, X.; Zhang, X. Attribution analysis of the spatiotemporal variation in water balance in a typical semiarid basin in northern China. Hydrol. Process. 2022, 36, e14651. [Google Scholar] [CrossRef]
- Song, C.; Yao, L.; Hua, C.; Ni, Q. A novel hybrid model for water quality prediction based on synchrosqueezed wavelet transform technique and improved long short-term memory. J. Hydrol. 2021, 603, 126879. [Google Scholar] [CrossRef]
- Fu, Y.; Zhang, J.; Zhang, C.; Zang, W.; Guo, W.; Qian, Z.; Liu, L.; Zhao, J.; Feng, J. Payments for Ecosystem Services for watershed water resource allocations. J. Hydrol. 2018, 556, 689–700. [Google Scholar] [CrossRef]
- Yu, S.; He, L.; Lu, H. A tempo-spatial-distributed multi-objective decision-making model for ecological restoration management of water-deficient rivers. J. Hydrol. 2016, 542, 860–874. [Google Scholar] [CrossRef]
- Sun, K.; Hu, L.; Sun, J.; Zhai, Y.; Zhang, S.; Cao, X. Quantifying the contribution of ecological water replenishment on aquifer recovery using a refined groundwater model. Sci. Total Environ. 2023, 857, 159216. [Google Scholar] [CrossRef]
- Wong, C.; Jiang, B.; Bohn, T.; Lee, K.; Lettenmaier, D.; Ma, D.; Ouyang, Z. Lake and wetland ecosystem services measuring water storage and local climate regulation: Lake and Wetland Ecosystem Services. Water Resour. Res. 2017, 53, 3197–3223. [Google Scholar] [CrossRef]
- Chen, X.; Lu, J.; Zhu, J.; Liu, C. Characteristics of denitrifying bacteria in different habitats of the Yongding River wetland, China. J. Environ. Manag. 2020, 275, 111273. [Google Scholar] [CrossRef]
- Wang, Y.; Zhang, S.; Cui, W.; Meng, X.; Tang, X. Polycyclic aromatic hydrocarbons and organochlorine pesticides in surface water from the Yongding River basin, China: Seasonal distribution, source apportionment, and potential risk assessment. Sci. Total Environ. 2018, 618, 419–429. [Google Scholar] [CrossRef] [PubMed]
- Luo, Z.; Zhao, S.; Wu, J.; Zhang, Y.; Liu, P.; Jia, R. The influence of ecological restoration projects on groundwater in Yongding River Basin in Beijing, China. Water Supply 2019, 19, 2391–2399. [Google Scholar] [CrossRef]
- Liu, C.; Pan, C.; Chang, Y.; Luo, M. An integrated autoregressive model for predicting water quality dynamics and its application in Yongding River. Ecol. Indic. 2021, 133, 108354. [Google Scholar] [CrossRef]
- Zhai, L.; Cheng, S.; Sang, H.; Xie, W.; Gan, L.; Wang, T. Remote sensing evaluation of ecological restoration engineering effect: A case study of the Yongding River Watershed, China. Ecol. Eng. 2022, 182, 106724. [Google Scholar] [CrossRef]
- Chen, Z.; Zhao, T.; Tu, T.; Tu, X.; Chen, X. PairwiseIHA: A python toolkit to detect flow regime alterations for headwater rivers. Environ. Model. Softw. 2022, 154, 105427. [Google Scholar] [CrossRef]
- Richter, B.; Baumgartner, J.; Wigington, R.; Braun, D. How much water does a river need? Freshw. Biol. 1997, 37, 231–249. [Google Scholar] [CrossRef]
- Wu, M.; Liu, P.; Lei, X.; Liao, W.; Cai, S.; Xia, Q.; Zou, K.; Wang, H. Impact of Surface and Underground Water Uses on Streamflow in the Upper-Middle of the Weihe River Basin Using a Modified WetSpa Model. J. Hydrol. 2023, 616, 128840. [Google Scholar] [CrossRef]
- Kendziorski, C.; Bassingthwaighte, J.; Tonellato, P. Evaluating maximum likelihood estimation methods to determine the Hurst coefficient. Phys. A-Stat. Mech. Its Appl. 1999, 273, 439. [Google Scholar] [CrossRef]
- Wang, Q.; Wang, S.; Hu, Q.; Wang, Y.; Liu, Y.; Li, L. Calculation of instream ecological water requirements under runoff variation conditions: Taking Xitiao River in Taihu Lake Basin as an example. J. Geogr. Sci. 2021, 31, 1140–1158. [Google Scholar] [CrossRef]
- Ma, Q.; Zhang, J.; Lai, Q.; Zhang, F.; Dong, Z.; Si, A.L. Temporal and spatial variations of extreme climatic events in Songnen Grassland, Northeast China during 1960–2014. Chin. J. Appl. Ecol. 2017, 28, 1769–1778. [Google Scholar] [CrossRef]
- Leveson, N. A new accident model for engineering safer systems. Saf. Sci. 2004, 42, 237–270. [Google Scholar] [CrossRef]
Disclaimer/Publisher’s Note: The statements, opinions and data contained in all publications are solely those of the individual author(s) and contributor(s) and not of MDPI and/or the editor(s). MDPI and/or the editor(s) disclaim responsibility for any injury to people or property resulting from any ideas, methods, instructions or products referred to in the content. |
© 2023 by the authors. Licensee MDPI, Basel, Switzerland. This article is an open access article distributed under the terms and conditions of the Creative Commons Attribution (CC BY) license (https://creativecommons.org/licenses/by/4.0/).