Article

Chemical and Biological Profiling of Fish and Seaweed Residues to Be Applied for Plant Fertilization

by
Marios Maroulis
1,
Sevasti Matsia
1,
Georgios Lazopoulos
1,
Oana Cristina Pârvulescu
2,
Violeta Alexandra Ion
3,
Oana-Crina Bujor
3,
Joshua Cabell
4,
Anne-Kristin Løes
4 and
Athanasios Salifoglou
1,*
1
Laboratory of Inorganic Chemistry and Advanced Materials, School of Chemical Engineering, Aristotle University of Thessaloniki, 54124 Thessaloniki, Greece
2
Chemical and Biochemical Engineering Department, University Politehnica of Bucharest, 1-7 Gheorghe Polizu Str., 011061 Bucharest, Romania
3
Research Center for Studies of Food Quality and Agricultural Products, University of Agronomic Sciences and Veterinary Medicine of Bucharest, 59 Marasti Blvd., 011464 Bucharest, Romania
4
Norwegian Centre for Organic Agriculture, Gunnars veg 6, NO-6630 Tingvoll, Norway
*
Author to whom correspondence should be addressed.
Agronomy 2023, 13(9), 2258; https://doi.org/10.3390/agronomy13092258
Submission received: 27 July 2023 / Revised: 18 August 2023 / Accepted: 23 August 2023 / Published: 28 August 2023
(This article belongs to the Section Agroecology Innovation: Achieving System Resilience)

Abstract

:
Brown algae and fish waste contain high-value compounds with potentially beneficial effects on plant growth. Several commercial fertilizer products are currently available, but the characteristics of the materials are usually not well-described. Fish and seaweed residues originating from the Norwegian coast are available, after industrial processing, which may be combined into complete fertilizers exerting additional effects on crop plants (biostimulants). In this study, raw samples of fish and seaweed residues were investigated using ecofriendly technologies (drying, leaching), targeting search and isolation of potential biostimulants, followed by physicochemical characterization (elemental analysis, UV–visible, FT-IR, ICP-MS, ICP-OES, electrical conductivity, pH, etc.). Organic solvent extractions were employed to determine the available mineral content, micro- and macro-nutrients, antioxidant compounds, and amino acid content by chemical hydrolysis. The in vitro biotoxicity profile (cell viability, morphology, migration) of the generated extracts was also perused, employing Gram-positive (Staphylococcus aureus) and Gram-negative bacteria (Escherichia coli) along with sensitive neuronal eukaryotic cell lines N2a58 and SH-SY5Y, to assess their time- and concentration-dependent efficacy as antimicrobials and agents counteracting oxidative stress. The analytical composition of all raw materials showed that they contain important nutrients (K, P, Ca, N) as well as organic compounds and amino acids (Gly, Asp, Glu, Leu, Phe) capable of acting as plant biostimulants. Concurrently, the inherently high conductivity values and salt content necessitated leaching processes, which result in Na+ and K+ decreasing by more than ~60% and justifying further their use in soil treatment formulations. The aforementioned results and assertions, combined with physical measurements (pH, electrical conductivity, etc.) on naturally occurring and dried samples as well as green solvent extracts, formulated a physicochemical profile reflecting well-defined inorganic–organic species that might function as biostimulants. The collective physicochemical and biological properties support the notion that appropriate mixtures of marine organism residues may be efficient fertilizers for crop plants and concurrently possess biostimulant characteristics.

Graphical Abstract

1. Introduction

As mineral reserves of phosphorus (P) [1], potassium (K) [2], and other essential plant nutrients on the planet are progressively getting scarce, there is increasing interest in natural sources of minerals and other valuable compounds to be applied as fertilizers, concurrently exerting biostimulant effects. Organic materials may also contain compounds, which may act as biostimulants. Keen interest in the latter family of compounds has risen significantly in recent years, with biostimulants defined in the EU regulation [3] as organic or inorganic products containing bioactive substances and/or microorganisms, which, when applied to the plant or rhizosphere, stimulate the growth and productivity of the plant by improving the absorption and assimilation efficiency of nutrients, tolerance to abiotic stresses, and/or the quality of the product regardless of their nutrient content [3]. These biostimulants act in addition to fertilizers, trying to optimize fertilizer efficiency and reduce nutrient application rates. In practice, it will be very difficult to distinguish between the effects on plant growth, caused by mineral nutrients, and the effects caused by other compounds in fertilizer/biostimulant materials. Nevertheless, it is of great interest to investigate and define relevant raw materials in detail, in order to be able to understand their component influence on crop plant growth [4,5,6].
As an alternative to currently employed fertilization practices in agriculture, in coastal regions, residues of seaweed, fish, and other marine-derived organisms have traditionally been applied as animal feed and toward fertilization of crop plants. In fact, it has been a tradition to knock cod heads into the sward on peat soil in Norway. In the marine sector, there are still significant amounts of residual materials, which may be applied as fertilizers/biostimulants [7,8]. To that end, due attention has been directed over the recent years toward marine resources, with seaweeds and seaweed extracts found to be one of the four major groups of agriculturally competent materials promoting root growth and nutrient uptake. Treatment of plants with seaweeds, especially brown algae, increases the N and P concentration in leaves [8]. Seaweeds also possess high levels of trace elements, hormones, and polysaccharides. Moreover, from the economic point of view, using seaweeds may be an attractive approach to generating fertilizers containing crop plant biostimulants, especially so through composting or extraction methods [9], thus balancing the cost of collection and reaping significantly accumulated bioactivating power [10,11]. In that respect, residues from rockweed (Ascophyllum nodosum) contain many such valuable compounds, including polyphenols, peptides, and carotenoids shown to exhibit biological activities [12,13], with extracts thereof linked to the production of liquid fertilizer/biostimulants. Residual materials from seaweed extraction are currently incinerated.
On a similar line of thought, large quantities of fish waste are produced daily in fish markets and industries (canneries, fresh and frozen fish processing plants, etc.). Fish-based fertilizers usually contain significant amounts of N, P, and Ca nutrients [14], depending on the fish waste type (whole fish, fish trimmings, bones, skins, heads, etc.). Here too, composting could generate solid or liquid fertilizers [15] as useful agricultural products [16]. This category of marine materials includes residues of white fish (e.g., cod (Gadus morhua), saithe (Pollachius virens), and common ling (Molva molva)) that contain excessive amounts of bone fragments not suitable for fish or animal feed. Such material is sometimes incinerated or disposed of in the sea. Furthermore, fish bone material has demonstrated a very rapid growth effect on crop plants [7,17], whereas seaweed residual sludge has exhibited a significant effect on growth of residual crops [17,18]. However, to what extent growth effects are induced by minerals, such as P and N in the fish material, and K in the seaweed material, or possibly also by additional biostimulant effects, has not yet been studied with these materials. Concurrently, given that these materials are to be used in agriculture, the chemical and biological properties emerge as an essential component of their global profile. In that respect, examination of their biotoxicity and antioxidant properties is expected to provide insight into their biological potency in the field. Consequently, the biological dimension in research complements the chemical dimension, collectively providing a substantive picture of the macroscopic effects of all components in materials destined to be used as fertilizers.
In light of the aforementioned, the purpose of the present work is to present the results of (a) a thorough physicochemical exploration of selected marine waste materials (BlueBio), including screening for important bioactive compounds, thereby generating a physicochemical profile, and (b) the establishment of a well-defined biological activity profile reflecting the biotoxicity (cell viability, morphology, chemotactic migration, proliferation) and antioxidant potential of the raw materials and/or green extracts thereof in in vitro bacterial (E. coli, S. aureus) and eukaryotic (N2a58, SH-SY5Y) cell line cultures. For the first time, a multilateral investigation of variable nature marine organism residual materials provides a novel comprehensive global (bio)chemical profile, based on which well-defined hybrid composites can emerge that are capable of acting as ecofriendly fertilizers/biostimulants in crop plant agriculture.

2. Experimental

2.1. Materials and Methods

The work included both physicochemical and biological investigation of the marine residual materials at hand. In that framework, an entire series of physical and analytical chemical methodologies were evoked to discover the properties of the natural origin samples that would ensure their identity and justify further biological perusal of their potential fertilizing and biostimulant characteristics. In line with that logic, the ensuing biological investigation included a plethora of biotoxicity and antioxidant activity assays in bacterial and eukaryotic cultures, collectively providing a complete picture of the scientific background, further supporting the formulation of naturally emerging hybrid fertilizers capable of stimulating crop plant growth. The individual methods and instrumentation used in that effort are presented below.

2.1.1. Description of the Tested Materials

The production of liquid fertilizers/biostimulants is a well-established industry in Norway, where wild rockweed (Ascophyllum nodosum) is harvested along the coast, dried, ground, and extracted with acid and alkaline solutions to produce a liquid with significant positive effects on plant growth. The producing company is Algea AS, located in Kristiansund, NW Norway. The residues after such extractions are a sludge with about 30% dry matter (DM), which is still rich in important minerals, such as K, and could be applied as a soil amendment, whereas the amounts per hectare and year would have to be restricted because of the concentrations of some potentially toxic elements, especially cadmium [19]. The industry (Algea AS) uses two main types of extraction, resulting in two main types of sludge, both chemically quite comparable, except for their total nitrogen (N) content. Nitric acid (HNO3) is applied in the extraction process of the sludge, which is herein dubbed high-N seaweed (HNSW), whereas another acid is also applied in the extraction of the second sludge type, which is herein dubbed low-N seaweed (LNSW). Sludge was transported from Algea AS to the Norwegian Centre for Organic Agriculture (NORSØK) in open IPC tanks, and representative samples of HNSW and LNSW were frozen and brought to our labs for investigation.
Clip fish is a typical fish product in Norway, made by salting and drying fillets from captured white fish. The material, which was analyzed in the present study, was ground backbones from cod (Gadus morhua), cusk (Brosme brosme), and common ling (Molva molva). The backbones contain some other tissues, but the main part is fishbone. The material is hereby dubbed ground fish bones (GFB). The material was created from thawed backbones (Sigurd Folland AS, Averøy, Norway) and sent to our labs for investigation. Upon arrival, the samples were still frozen and as such they were stored frozen (−20 °C) until further use.

2.1.2. Materials Applied in Chemical Analyses

Ethyl acetate (CH3COOC2H5), hydrochloric acid (HCl) 37%, ultrapure hydrogen peroxide (H2O2) 30% for trace metal analysis, and n-hexane (C6H14) reagent for pesticide analysis were purchased from J.T. Baker (Phillipsburg, NJ, USA) and were used without further purification. Dimethylsulfoxide of biology grade (DMSO), ethanol 99%, 2,2′-diphenyl-1-picrylhydrazyl, and ninhydrin reagent for amino acid analysis were purchased from Sigma-Aldrich (St. Louis, MO, USA). Buffers were used with pH values of 4.00, 7.00, and 10.00. Sodium carbonate (Na2CO3), sodium hydrogen carbonate (NaHCO3), and toluene (C6H5CH3) of p.a. grade were supplied by Chem-Lab NV (Zedelgem, Belgium). Nitric acid (HNO3 65%) and ethylenediaminetetraacetic acid (EDTA) of purity grade, petroleum ether 40–60%, sodium sulfate (Na2SO4), sodium hydroxide (NaOH), phenol (C6H5OH), sodium hypochlorite (NaClO), sodium nitroferricyanide(III) dihydrate (Na2[Fe(CN)5NO] · 2H2O), and boron trifluoride (BF3) of p.a. purity were supplied by PanReac AppliChem ITW (Applichem PanReac, Darmstadt, Germany). Sodium citrate dihydrate was purchased from Mallinckrodt (Staines-upon-Thames, UK) and thioglycolic acid ≥ 98% from Fluka (Fluka, Munich, Germany).
The two conductivity standards used in this work were supplied by PanReac AppliChem ITW and had 147 and 1413 μS/cm values, respectively. The calibration standards used for ICP analyses were purchased from CPA Chem (Bogomilovo, Bulgaria), including (a) one standard containing a 100 mg/L mixture of 32 metals, and (b) the internal standards at 1000 mg/L, specifically containing 6Li, 72Ge, 89Y, 103Rh, 232Th, 59Co, 89Y, 140Ce, and 205Tl.
Restek FAME Mix, Food Industry FAME Mix, and Methyl heptadecanoate standard neat were obtained from Restek (Restek Co, Bellefonte, PA, USA). An AS14a Dionex column (Thermo Fisher, Waltham, MA, USA) was used as an anion separation column. A 100 m HP-88 0.25 μm × 0.25 μm capillary chromatographic column was used for the separation of fatty acid methyl esters (F.A.M.E.).
A citrate buffer solution (pH 2.2) was prepared using sodium citrate dihydrate (1.967 g), thioglycolic acid (10 mL), and HCl 37% until the pH reached a value of 2.2.

2.2. Physical Measurements

As a general rule, all physical, chemical, and biological parameters investigated in this work are the result of triplicate experiments carried out according to the protocols, methods, and instrumental measurements described below. Due mention of the multiplicity of experiments run over the course of the present research is provided in the ensuing description of experimental methods and techniques employed.

2.2.1. pH and Conductivity

An automated robotic pH conductivity system model AR-2 (Seal Minilab, Mequon, WI, USA) was employed to conduct reliable measurements of pH and conductivity on the materials at hand. For pH and conductivity measurements, a 2:1 water (Type 1 ASTM water, ultrapure) to sample ratio was used. Subsequently, the mixture was stirred for 10 s with a robotic extraction system and measurements ensued automatically using the pH and conductivity probes.

2.2.2. Total Carbon, Total Organic Carbon (TOC), and Total Nitrogen Determination

A CN elemental analyzer (Leco Truspec, St. Joseph, MI, USA) was employed for the analysis of carbon and organic carbon content as well as total nitrogen content. To that end, a sample of known weight was placed into a high-temperature furnace. The ensuing combustion converts carbon to CO2, and nitrogen to N2 for carbon and nitrogen measurement, respectively. The respective gases are swept through scrubbers into detection systems. The same method was employed for organic C by determining the carbon content after removal of calcium carbonate with HCl (37%).
For total carbon, total nitrogen, and total organic carbon (TOC) determination, 100% silver cups of 8 × 4 mm dimensions (Elemental Microanalysis, Devon, UK) were used for the preparation of samples. In order to measure TOC using the elemental analyzer, it was necessary to effectively remove all inorganic carbon. To that end, the procedure involved the following: after removal of all inorganic carbon, the remaining carbon in the sample was only the organic carbon portion. In that respect, 100 mg of every sample was weighed into a pure silver cup and 100 μL of pure HCl acid was added three times every 8 h for a total of 24 h to remove all carbonates, i.e., inorganic carbon. Subsequently, the remaining sample was placed into the elemental analysis system for carbon analysis. The amount of carbon measured is the organic carbon (OC %) content.
All experiments were run in multiple sets of three independent measurements, with each individual group involving three repeated measurements.

2.2.3. FT-IR Spectral Measurements

FT infrared spectral measurements were taken in the solid state, on a Thermo Finnigan FT-Infra Red IR-200 spectrometer (Thermo Fisher, Waltham, MA, USA) using KBr pellets. FT-IR spectroscopy provides the vibrational imprint of a material (solid, liquid, gas), through which its identity as well as properties can be revealed. The materials were dried, mixed with KBr in a ratio of 99:1 w/w, and pellets were produced through a press. The samples were subsequently introduced into the spectrometer and scanned in the range from 4000 to 400 cm−1.

2.2.4. Microwave Digestion

A CEM digestion unit (Mars 6, Matthews, NC, USA) was used with the appropriate Mars XP-1500 carousel starter set (Mars 6, Matthews, NC, USA). Teflon high-pressure liners were used. Practically, a quantity of 500 mg of sample was weighed, with 0.1 mg accuracy, into a teflon liner. A volume of 4 mL of nitric acid (HNO3 65%) and 1 mL of hydrogen peroxide (H2O2 30%) were added to the liner containing the sample under investigation. Subsequently, a pressure ramp program gradient up to 200 psi (25 min ramp, 10 min hold at 200 psi) was used to fully digest the sample. Then, the digest was diluted into a 50 mL volumetric flask and taken for ICP-MS and ICP-OES analyses.

2.2.5. ICP-MS Spectrometry

ICP-MS spectrometry was run on a 7500 Series ICP-MS (Agilent Technologies, Santa Clara, CA, USA) facility. It is an inductively coupled plasma mass spectrometer (ICP-MS), which can measure trace elements as low as one part per trillion (ppt) or quickly scan more than seventy elements to determine the composition of an unknown sample. The system consists of an RF-generated plasma system coupled with a single quad MS detector.
The octopole reaction system (ORS) before the detector quadrupole was an octopole ion guide, contained in a stainless steel vessel, and pressurized helium gas. The ORS eliminates any interference coming from the sample matrix. For liquid handling, an A-IS autosampler by Agilent Technologies was used. In addition, the system incorporates a high-throughput sample system for faster sample analysis. The MS system was under vacuum with a roughing Edwards 18 pump and a high-vacuum region in the vacuum manifold, maintained by a turbomolecular pump. For the ICP-MS unit, the isotope selection was as follows: for Pb, all isotope masses were used, i.e., 206, 207, and 208, with an internal standard (ISTD); for Th, the isotope with mass 232 was employed; for Cd, the isotope was that with mass 111 and ISTD was used; for Y, the isotope with mass 89 was used; for Ni, the isotope mass was 60 and ISTD was used; for Ge, the isotope with mass 72 was employed; for Cr, the isotope mass 52 was selected with ISTD; finally, for As, the isotope used was the one having mass 75 with ISTD. All measurements were performed in triplicate with median values recorded (vide infra).

2.2.6. ICP-OES Analysis

The same digests used for ICP-MS analysis were also used for ICP-OES analysis. To that end, a 5110 ICP-OES (Agilent Technologies, Santa Clara, CA, USA) inductively coupled plasma optical emission spectrometer was employed, with technology enabling synchronous radial and axial measurements. An SPS-3 autosampler was used for running the standard solution and the unknown samples. The ICP-OES was used in radial plasma viewing mode and the respective lines used were as follows: K 766.491 nm, Ca 318.127 nm, Mg 279.800 nm, Na 589.592 nm, P 213.618 nm, Fe 238.204 nm, Mn 259.372 nm, Cu 327.395 nm, Zn 213.857 nm, Se 196.020 nm, Si 251.611 nm, Al 396.152 nm, Co 228.615 nm, Mo 202.032 nm, B 249.678 nm, S 181.672 nm. All measurements were performed in triplicate with median values recorded (vide infra).

2.2.7. Total Fat Analysis

An automated Soxtherm 6 position system (Gerhardt, Bonn, Germany) was used and an extraction cycle at 150 °C was programmed for 1.5 h. The extracted solution was subsequently evaporated to remove the extraction solvent. Then, it was placed at 105 °C for 45 min to remove any solvent residues. The difference in weight provided the extractable content, expressed as total fat. Apparently, there were extracted compounds that were not fatty acids. That is the reason why the samples were further examined through F.A.M.E. analysis (vide infra).

2.2.8. Nitrate Determination through Ion Chromatography

The method used an anion separation AS14a Dionex column (Thermo Fisher, Waltham, MA, USA) with an A SRS 300 anion suppressor (Thermo Fisher, Waltham, MA, USA) set at 100 mA power. The flow was set at 1.2 mL/min under isocratic conditions, with an aqueous mixture of Na2CO3 and NaHCO3, at 3.5 mM and 1.8 mM concentration, respectively. A calibration curve from 0.15 to 500 mg/L NO3 was constructed to measure the unknown samples.

2.2.9. Ammonium Determination through Derivatization Ultraviolet Spectroscopy (UV–Visible)

Measurements were carried out on a UV–visible spectrophotometer 1240 UV-Mini (Shimadzu, Kyoto, Japan). During a typical experiment, ammonium ions in a sample react with hypochlorite ions (HClO) and form chloramine, which in turn reacts with alkaline phenol in the presence of nitroferricyanide. A blue indophenol dye was produced and this reaction was used to create a calibration curve with ammonium standard solutions, thus allowing measurement of unknown samples at 660 nm (the blue color absorption wavelength). A range of up to 3 mg/L was sufficient to measure all diluted samples. All experiments were run three times, each in triplicate samples.

2.2.10. Fatty Acid Methyl Ester Analysis through GC–FID

Methyl esterification took place with boron trifluoride to produce fatty acid methyl esters (F.A.M.E.). Their profile was determined using the information from the retention times of the 37 standard FAME mix (Restek Co, Bellefonte, PA, USA). A 100 m HP-88 type column (Agilent Technologies, Santa Clara, CA, USA) was employed with a HP6890 GC–FID system (Agilent Technologies, Palo Alto, CA, USA). Running conditions include 2 mL/min flow and a temperature gradient as follows: 120 °C, hold 1 min; ramp 10 °C/min to 175 °C, hold 10 min; ramp 5 °C/min up to 210 °C, hold 5 min; ramp 5 °C/min up to 230 °C, hold 5 min.
The areas of the generated methyl esters identified were compared to the areas of the methyl heptadecanoate standard in order to calculate the actual fat content of the samples. All experiments were run three times, each in triplicate samples.

2.2.11. Gas Chromatography–Mass Spectrometry (GC–MS)

For the organic screening, analyses of extracted samples were performed using a Trace GC Ultra, Thermo, TSQ Quantum XLS system (Thermo Fisher Scientific, Waltham, MA, USA) in full scan mode, with a DB-5UI capillary column (Agilent, Santa Clara, CA, USA) (30 m, 0.25 mm i.d., 0.25 μm film thickness). The carrier gas was helium, running at a flow rate of 1.3 mL/min. The column temperature was initially 45 °C for 15 min, then gradually increased to 280 °C at 25 °C/min, and finally stayed for 18 min at 280 °C. For GC–MS detection, an electron ionization system was used with an ionization energy of 70 eV. The extracts were injected undiluted, at 2.0 μL volume, in split mode with a 1:50 split ratio. Injector and detector temperatures were set at 250 and 280 °C, respectively. All experiments were run three times, each in triplicate samples.

2.3. Leaching Procedure

A mass of 20 g of sample was leached with 1 L of type 1 ultra-pure water. The water was poured, while mixing on the surface of a 0.500 μm sieve. Water was poured at a rate of 100 mL/min. The sample was subsequently dried and analyses were performed on the leached out samples (HNSW-L, LNSW-L, and GFB-L). All experiments were run three times, each in triplicate samples.

2.4. Extraction Procedure of HNSW, LNSW, and GFB Samples

A quantity of 7–8 g of fresh sample of each material was weighed and allowed to stay in the open air until completely dry. After that, ~1.5 g of dry sample was ground (ceramic mortar) into fine powder, and then placed in a 250 mL separatory funnel. A volume of 12.5 mL of ethyl acetate (EA) was then added and the mixture was shaken for 10 min. The resulting extraction mixture for HNSW (yellow solution for LNSW, colorless solution for GFB) was subsequently filtered into a 50 mL falcon tube, thereby producing a green filtrate (yellow for LNSW and colorless for GFB). The procedure was repeated twice. The final volume (out of the three extractions in each case) of the ~35 mL solution was centrifuged for 5 min at 9000× g at 4 °C. The so-generated clear solution was allowed to evaporate at room temperature. After 15 days, the extracted materials (HNSW-E-EA, LNSW-E-EA, and GFB-E-EA) were used for further analysis and biological studies. The aforementioned procedure was repeated with n-hexane as a solvent (HNSW-E-H, LNSW-E-H and GFB-E-H). All experiments were run three times, each in triplicate samples.

2.5. Amino Acid Analysis

The samples (HNSW, LNSW, and GFB) were digested according to the AOAC 994.12 method with some adjustments [20]. Specifically, a defined amount of a dried sample was weighed in a 30 mL vial (on the basis of the calculation formula of the AOAC 994.12 method) and 25 mL of 6 N HCl, with a 0.1% phenol solution, was added. Protein hydrolysis was performed in a drying oven (Memmert, Poznan, Poland) with temperature control for 23 h at 110 °C. Subsequently, after the mixture reached room temperature, it was filtered and rinsed three times, and brought to a volume of 100 mL in a volumetric flask. From this solution, 1 mL of the extract was evaporated under a nitrogen flow and the residue was dissolved in 2 mL of H2O. The sample was then ready for analysis.
For the amino acid (AA) analysis, a standard solution of amino acids (AAs) (mixture), which contained His, Ser, Arg, Gly, Asp, Glu, Thr, Ala, Pro, Lys, Tyr, Val, Ile, Leu, Phe, and Met, at the same concentration of 2.5 mmol/L and Cys at the concentration of 1.25 mmol/L, was purchased from ThermoFisher. Reagents for pre-column derivatization of amino acids were purchased in the form of the AccQ-Tag reagent kit (Waters, Milford, MA, USA). The mobile phase was composed of solvent A, 5% AccQ-Tag Ultra Eluent A, and solvent B, 100% acetonitrile. For the actual experiment, the ACQUITY I UPLC system (Waters, Milford, MA, USA), comprising a column oven (thermostat), autosampler, high-pressure binary pump, and photodiode array detector PDA, was used for the analysis of the 17 AAs. Chromatographic separation was pursued with the AccQ-Tag Ultra C-18 column (2.1 mm × 100 mm; 1.7 µm). The separation of the AAs was carried out according to the protocol provided (Waters, Milford, MA, USA). Briefly, the following chromatographic conditions were employed: PDA detector wavelength—260 nm, injection volume—1 µL, samples and column were kept at a temperature of 20 °C and 55 °C, respectively. The AA separation was carried out using gradient elution for 10 min, with a flow rate of 0.7 mL/min. All experiments were run three times, each in triplicate samples.

2.6. DPPH Radical Scavenging Activity

The 2,2′-Diphenyl-1-picrylhydrazyl (DPPH) radical scavenging activity of the selected extracts (vide infra) was investigated according to a procedure described elsewhere [21], with slight modifications. After full evaporation of the solvent at room temperature, 55.5 mg of HNSW-E-EA, 48.4 mg of LNSW-E-EA, and 19.8 mg of GFB-E-EA were dissolved in 1 mL, 0.5 mL, and 1.5 mL methanol, respectively. A quantity of 50 μL of the extract was mixed thoroughly with 1.95 mL of 0.1 mM DPPH solution in methanol. The samples were placed in darkness for 30 min. Subsequently, the absorbance was measured at 515 nm, also including a control sample (50 μL of methanol and 1.95 mL 0.1 mM DPPH methanolic solution), using a U-1900 Hitachi spectrophotometer (Hitachi, Tokyo, Japan). Every sample was measured in triplicate and the percentage of DPPH scavenging activity was calculated as follows:
%   D P P H   S c a v e n g i n g   a c t i v i t y = ( A b s C o n t r o l A b s S a m p l e ) A b s C o n t r o l
The results were expressed as ascorbic acid equivalent (AAE)/g dry extract.

2.7. Bacterial Cell Cultures

In vitro bacterial cell culture experiments were conducted using the well diffusion method on Luria–Bertani agar (LB agar) (Applichem PanReac, Darmstadt, Germany) petri dishes. A Luria–Bertani broth (LB broth) (Sigma Aldrich, Munich, Germany) was also used as a liquid nutritional medium in cell cultures. Specifically, sample extracts were studied in Gram-positive (Gram (+)) (Staphylococcus aureus; S. aureus) and Gram-negative (Gram (−)) (Escherichia coli; E. coli) bacterial cultures. During the experiments, positive (LB Broth) and negative controls (penicillin-streptomycin (Biowest, Nuaillé, France)) were also included in every experiment run. All experiments were run in triplicate under aseptic conditions.
A shaking incubator operating at 37 °C was used for bacterial culture incubations (solid and liquid cultures). Optical density (O.D.) measurements attesting to the growth of liquid cultures of bacteria were carried out on a Hitachi UV–visible U-2800 spectrophotometer (Hitachi, Tokyo, Japan).
Specifically, prior to a solid or liquid bacterial culture investigation, 3–5 freshly grown bacterial colonies were inoculated into a 3 mL LB broth, using a 25 mL Erlenmeyer flask in an Edmund Bühler TH15 shaking incubator (Edmund Bühler Gmb, Bodelshausen, Germany) at 37 °C for 1–2 h until the O.D. at 600 nm reached a value of 0.5 (5 × 10⁵ CFU·mL−1). The specific inoculum was further used for solid or liquid culture studies. The specific extract concentrations investigated are shown next in % v/v, for simplicity, and correspond to a specific amount of extract/dry matter as shown in Table S1. All experiments were run three times, each in triplicate samples.

2.7.1. Growth Rate of Bacteria in Liquid Cultures

A 1:50 dilution of inoculum was further carried out in a 250 mL Erlenmeyer flask and the growth rate of each type of bacterium was investigated at 37 °C under standard shaking conditions for 3–6 h. UV–visible spectrophotometry U-2800 (Hitachi, Tokyo, Japan) was used for the measurement of the optical density (O.D.) value at specific time intervals, until the value had reached ~1.0. LB broth was used as positive control and penicillin-streptomycin as negative control. The growth rate of bacteria was monitored upon exposure to HNSW-E-EA, LNSW-E-EA, GFB-E-EA samples in DMSO (compared to the appropriate control). All experiments were run three times, each in triplicate samples.

2.7.2. Determination of Zone of Inhibition (ZOI) in Solid Bacterial Cultures

Well diffusion tests were carried out for the determination of ZOI on Muller–Hinton agar plates. Specifically, 30–35 mL of LB agar was poured out onto a plate and left to dry out for about 30 min, in order to allow for the absorption of excess moisture. Subsequently, 6 mm wells were created using a sterile micropipette tip through punching into the agar flat bed. Subsequently, 100 μL of each investigated extract concentration was applied into the wells. The plates were incubated at 37 °C overnight (15 h). Four wells were created and thus investigated in every independent plate. Two of the wells served as control groups and two for the monitoring of the investigated extracts. All experiments were run four times, each in triplicate samples.

2.8. Neuronal Cell Cultures

In the present study, murine neuroblastoma N2a58 and human neuroblastoma SH-SY5Y cell lines were employed to investigate the in vitro biological profile of the seaweed (HNSW-E-EA, LNSW-E-EA) and fish (GFB-E-EA) samples dissolved in DMSO. Cells were cultured in 75 cm2 cell culture flasks, under appropriately chosen conditions (5% CO2 at 37 °C and standard humidity), in either Dulbecco’s modified Eagle’s medium DMEM (Biowest, Nuaillé, France) for N2a58 or in a 1:1 mixture of DMEM and Ham’s F-12 nutrient mixture, hereafter called DMEM-F12 (Biowest, Nuaillé, France), for SH-SY5Y cells. Culture media were supplemented with 10% fetal bovine serum (FBS) (Biowest, Nuaillé, France) and 1% penicillin-streptomycin (Biowest, Nuaillé, France) prior to use. All experiments were run at least in triplicate, employing cells with a low passage number. For the SH-SY5Y cell line only, the adherent population was taken into consideration and used further, whereas floating cells were discarded during media change. All experiments were run four times, each in triplicate samples.

2.8.1. Cell Viability and Proliferation Studies

Cell viability (expressed as % survival rate), following incubation in the presence of the herein generated samples under the aforementioned conditions, was investigated using the XTT (Sodium 3-[1-(phenylaminocarbonyl)-3,4-tetrazolium]-bis(4-methoxy-6-nitro)benzenesulfonic acid hydrate) (Cell Signaling) assay. Briefly, 96 well plates were used, with 5000 cells in a 100 μL volume of the complete medium seeded into each well and incubated overnight. Subsequently, the cells were treated with the sample extracts at various concentrations (~0.20–6.5 × 10³ ngextract/g dry extract) for 24, 48, and 72 h. The XTT detection solution was prepared according to manufacturer instructions (electron coupling solution to XTT reagent (1:50 volume ratio)) and 50 μL of that was added to each well, followed by incubation of the plate for four hours. Immediately after incubation, the absorbance was measured at 450 nm, using an EL10A Elisa Microplate Reader spectrophotometer (Biobase, Shandong, China), as described elsewhere [22,23]. The XTT assay is based on the reduction of the XTT tetrazolium salt to a highly colored formazan dye by dehydrogenase enzymes in metabolically active cells, thus providing a proportional correlation between the amount of formazan produced (measured by the absorbance) and the viable cells in each well.
Extracted materials (HNSW-E-EA, LNSW-E–EA and GFB-E-EA) (vide supra) were dissolved in 8.5 mL of molecular biology grade DMSO, followed by vortexing, sonication, and filtration. Fresh stock solutions of the sample extracts (HNSW-E-EA, LNSW-E-EA and GFB-E-EA) were prepared from the DMSO stock solution at the desired concentration, in the appropriate complete culture medium (DMEM or DMEM-F12, with both containing 1% penicillin-streptomycin and 10% FBS). All derived solutions were freshly prepared prior to experimentation. Final working concentrations of samples were added directly to the cell cultures and the latter were incubated for the desired time periods according to the protocols followed. All experiments were run three times, each in triplicate samples.

2.8.2. Cell Morphology Studies

To further assess the biotoxicity profile (cell viability, morphology, migration) of the extracts, cell morphology studies on both cell lines were conducted. Briefly, 200,000 cells and 2 mL of culture medium for each cell line were seeded into a well of a sterile 6-well plate and left to incubate overnight, in order for the cells to attach onto the well surface. Subsequently, the cells were treated with the sample extracts (~0.20–6.5 × 10³ ngextract/g dry extract) and incubated for 24, 48, and 72 h, to examine any morphological alterations. Visualization of the cells was performed using an Oxion Inverso biological microscope (Euromex, Arnhem, The Netherlands). Observations made during visualization were followed by processing the generated images of cell cultures through the ImageJ 1.53t imaging software (National Institutes of Health, Bethesda, MD, USA), thereby resulting in pictures depicting any morphological alterations of cells under the influence of the employed samples and the extent to which changes occur. All experiments were run three times, each in triplicate samples.

2.8.3. Cell Migration Studies

An important feature of the studied cells, contributing to the formulation of the biotoxicity profile of the extracts, is chemotacticity (the movement of cells in response to a chemical stimulus) and any changes that might occur in the presence of the extracts. To pursue such experiments, a wound-healing (scratch) assay was employed [24]. Specifically, 200,000 cells in 2 mL of culture medium were seeded into a well of a sterile 6-well plate. The plate was placed in the incubator until confluency of the cells had reached ≈80%. Then, a scratch on the monolayer of the cells was drawn, using a sterile pipette tip. Subsequently, the culture medium was replaced by the sample extract solutions and the plate was returned to the incubator for 24, 48, and 72 h. At the end of the indicated periods, visualization and quantification of cell migration was observed, using an Oxion Inverso biological microscope (Euromex, Arnhem, The Netherlands). Observations made at this juncture were followed by processing of the generated images of cell cultures through the appropriate imaging software, ImageJ version 1.53t, (National Institutes of Health, Bethesda, MD, USA) [25], thereby resulting in pictures depicting any chemotactic movement of cells (reflecting biologically repaired scratches through cell migration) that might have taken place and the extent to which that has occurred. All experiments were run three times, each in triplicate samples.

2.9. Statistical Analysis

The obtained experimental data are presented as average ± standard error mean (SEM) values of multiple sets of independent measurements. Mean cell survival rates and SEMs were calculated for each individual group. Absolute survival rates were calculated for each control group and one-way analysis of variance (ANOVA) was performed for all pair comparisons, followed by post hoc analyses (Dunnett) using GraphPad Prism v.6 (GraphPad Software Inc., Boston, MA, USA). Significance levels were assessed as follows: * p < 0.05 (significant), ** p < 0.01 (highly significant), *** p < 0.001 (extremely significant) and **** p ≤ 0.0001 (extremely significant) or non-significant (p > 0.05).

3. Results

3.1. pH and Electrical Conductivity Measurements

Filter cakes of HNSW, LNSW, and GFB samples (air-dried) were used for determination of their pH and electrical conductivity (EC) at room temperature. Table 1 shows alkaline pH values exhibited by HNSW and LNSW, whereas neutral pH values are exhibited by GFB. Measured electrical conductivities exhibit high values shown for both seaweed samples, whereas lower values emerge for ground fish bone (GFB) samples.

3.2. FT-IR Spectra of Marine-Derived Materials

Comparative FT-IR spectra of air-dried HNSW, LNSW, and GFB samples were recorded in the solid state and are shown in Figure S1A. Important vibrationally active functional groups can be observed and identified as hydroxyl, amino, ester, and amide moieties, thus verifying the existence of compounds of biological importance [26]. The broad bands (Figure S1B–D) at 3374 cm−1 for HNSW, 3343 cm−1 for LNSW, and 3280 cm−1 for GFB are assigned to hydrogen-bonded O–H and N–H stretching vibrations, which correspond to polysaccharides and amino acids. Intense peaks at 2922 and 2856 cm−1, in all cases, are related to C–H antisymmetric stretching modes on saturated carbon atoms, in line with the existence of aliphatic groups. In the observed pattern of seaweed residual samples (Figure S1A,B), shoulders and low intensity resonances appear in the range 2540–2150 cm−1, attributed to the stretching modes of the C≡C and C=C moieties. In the range from 1740 to 1388 cm−1, strong features arose verifying the presence of COOH (C=O) and amino acids (N–H) [27,28]. The peaks between 1082 and 1020 cm−1 were due to the C–O bond stretching mode of polysaccharides and the features from 879 to 790 cm−1 were attributed to C=C stretching vibrations [29].

3.3. Total Carbon, Total Nitrogen and Total Organic Carbon Determination

Upon complete combustion of the samples, infrared absorption and thermal conductivity were employed to measure combustion gases for carbon and nitrogen, respectively. The results of TOC analysis are provided in Table 1. A small proportion of the total C in the fish material, about 22%, was inorganic. We might expect a higher proportion of inorganic C, since quite a high proportion of the material is fish bones, which contain calcium and magnesium carbonate [30]. However, significant amounts of soft tissue were attached to the bones. In the seaweed sludge material, about 50% of the total C was inorganic. This is likely due to alginate bound by calcium (or magnesium) [31], which is dissociated by HCl and recorded as inorganic C.

3.4. Essential Elements and Heavy Metal Distribution

The nutrient and heavy metal (potentially toxic elements) content of all samples was investigated and determined through ICP-MS and ICP-OES, with the results shown in Table 2. Of the heavy metal presence noted in the content of the samples, in (a) HNSW, arsenic (As) and chromium (Cr) appear to be the species at high concentrations (mg/kg) compared to the rest of them. Nickel (Ni), cadmium (Cd), and lead (Pb) were found to be at low concentrations, with Pb being at the lowest concentration (<0.1 mg/kg) among all of the metals examined. In (b) LNSW, arsenic (As), chromium (Cr), and nickel (Ni) were found to be at concentrations higher than 1.0 mg/kg, with cadmium (Cd) staying at 0.3 mg/kg and lead (Pb) being present at the lowest concentration (<0.1 mg/kg). And in (c) GFB, arsenic (As) was the only element found at concentrations higher than 1.0 mg/kg, with the rest of the metals staying at levels below 1.0 mg/kg. It is worth pointing out that arsenic is an element common in marine-derived materials.
In the case of nutrients, in (a) HNSW, the alkali and alkaline earth metal ion concentrations were found to decrease in the order K > Ca > Mg > Na; in (b) LNSW, the alkali and alkaline earth metal ion concentrations were found to decrease in the order Ca > K > Na > Mg; and in (c) GFB, the alkali and alkaline earth metal ion concentrations were found to decrease in the order Na > K > Mg.
In the case of transition metals, the trends observed suggest that in (a) HNSW, metal concentrations decreased in the order Fe > Zn > Mn > Cu, with all species present at concentrations >1.0 mg/kg. The exception to this trend comes from cobalt (Co) and molybdenum (Mo), with both being present at concentrations below 0.5 mg/kg. In (b) LNSW, the comparative order of concentration of the metal ions is the same as in the case of HNSW, including cobalt and molybdenum. And in (c) GFB, the concentration order is Zn > Fe, with the rest of the metal ions pronouncedly lower in concentration, exhibiting an order of Cu > (Mn, Co, Mo), with the latter group of metals at concentrations <0.5 mg/kg.
Of the non-transition metal elements, in (a) HNSW, the presence of silicon (Si), boron (B), and aluminum (Al) at concentrations displayed in the order Si > B > Al stands out in comparison to selenium (Se), sulfur (S), and phosphorus (P), the concentrations of which line up in the order Se > S > P, with all of them being below 1.0 mg/kg; in (b) LNSW, the same trends in concentrations were observed here as well; and in (c) GFB, the same trends in concentration was observed as in HNSW and LNSW, with the non-metal concentrations exhibiting a trend of P > Se > S, but with higher concentrations of P in GFB than in the seaweed materials (1.2% w/w).
Altogether, the chemical analyses show that in order to obtain a fertilizer containing the plant macro nutrients, arranged in approximate order of magnitude according to plant demand, i.e., N, K, Ca, Mg, P, and S, we need to combine materials from fish to obtain N and P, whereas seaweed materials will support K, Mg, and S, with both materials containing relatively meaningful amounts of Ca.

3.5. Total Fat Determination

To pursue total fat determination in all samples, extraction of the raw materials was carried out in petroleum ether. The extracted crude material of the employed samples was then determined to be (total fat %) 11.5 ± 1.2% in HNSW, 2.3 ± 0.3% in LNSW, and 0.20 ± 0.02% in GFB.

3.6. Nitrate and Ammonium Analysis

Nitrates were expressed as nitrate-nitrogen (NO3-N). Measured values of 78.7 ± 9.5 mg/kg for HNSW, 69.1 ± 8.3 mg/kg for LNSW, and 15.8 ± 1.9 mg/kg for GFB were determined. Ammonia was also determined and expressed as ammonium nitrogen (NH4-N). The experimentally determined concentrations were 256.7 ± 33.4 mg/kg for HNSW, 67.7 ± 8.8 mg/kg in LNSW, and 41.3 ± 5.4 mg/kg for GFB. This shows that the major part of the total nitrogen in GFB is present as organic nitrogen.

3.7. Fatty Acid Methyl Ester (F.A.M.E.) Analysis through GC–FID

In this set of GC–FID experiments, the actual fatty material was determined through methyl esterification of fatty acids to fatty acid methyl esters. Chromatograms derived from the above-mentioned process depict the actual samples run. Chromatograms (Figure 1) were full of unidentified peaks, which do not correspond to F.A.M.E.s. Proper identification of species was based on retention times identified using the industry standard F.A.M.E. mix. The determined values are as follows: 266.0 ± 50.5 mg/kg for HNSW, 225.0 ± 42.3 mg/kg for LNSW, and 41.9 ± 8.0 mg/kg for GFB.

3.8. Leaching Samples

Leaching with water was deemed imperative to arrive at samples rid of any extraneous substances (e.g., NaCl, metal ions) reflecting the original environment, from which the samples (HNSW and LNSW) were retrieved. To that end, after the leaching process, each sample had to be dried and subsequently weighed. Derived data before and after the leaching test are expressed on dry basis for direct comparison with the corresponding data from the originally employed raw materials. In the subsequently employed procedure, analytical determination of the composition of both HNSW and LNSW was pursued (Table 3). In that respect, in HNSW, Na and K concentrations were reduced more than two-fold compared to their original concentrations. In the case of metal ions (alkaline earth and transition), iron was slightly reduced in concentration, with the rest of them (Mg, Mn, Zn, and Cu) remaining essentially the same (within standard deviation). Phosphorus concentrations remained intact (0.24%), just like Cu. Finally, the carbon C and total N content underwent a marginal change, staying essentially the same.
In LNSW, Na and K concentrations were reduced more than two-fold compared to their original concentrations. In the case of metal ions (alkaline earth and transition), there was a reducing trend in the iron concentration, with Mg, Mn, Zn, and Cu remaining essentially the same (within standard deviation). Phosphorus concentrations remained intact (0.27%), just like Cu. Finally, total carbon C decreased in concentration from 41.2 to 37.2%, with the total N content undergoing a marginal decrease, staying virtually unchanged.

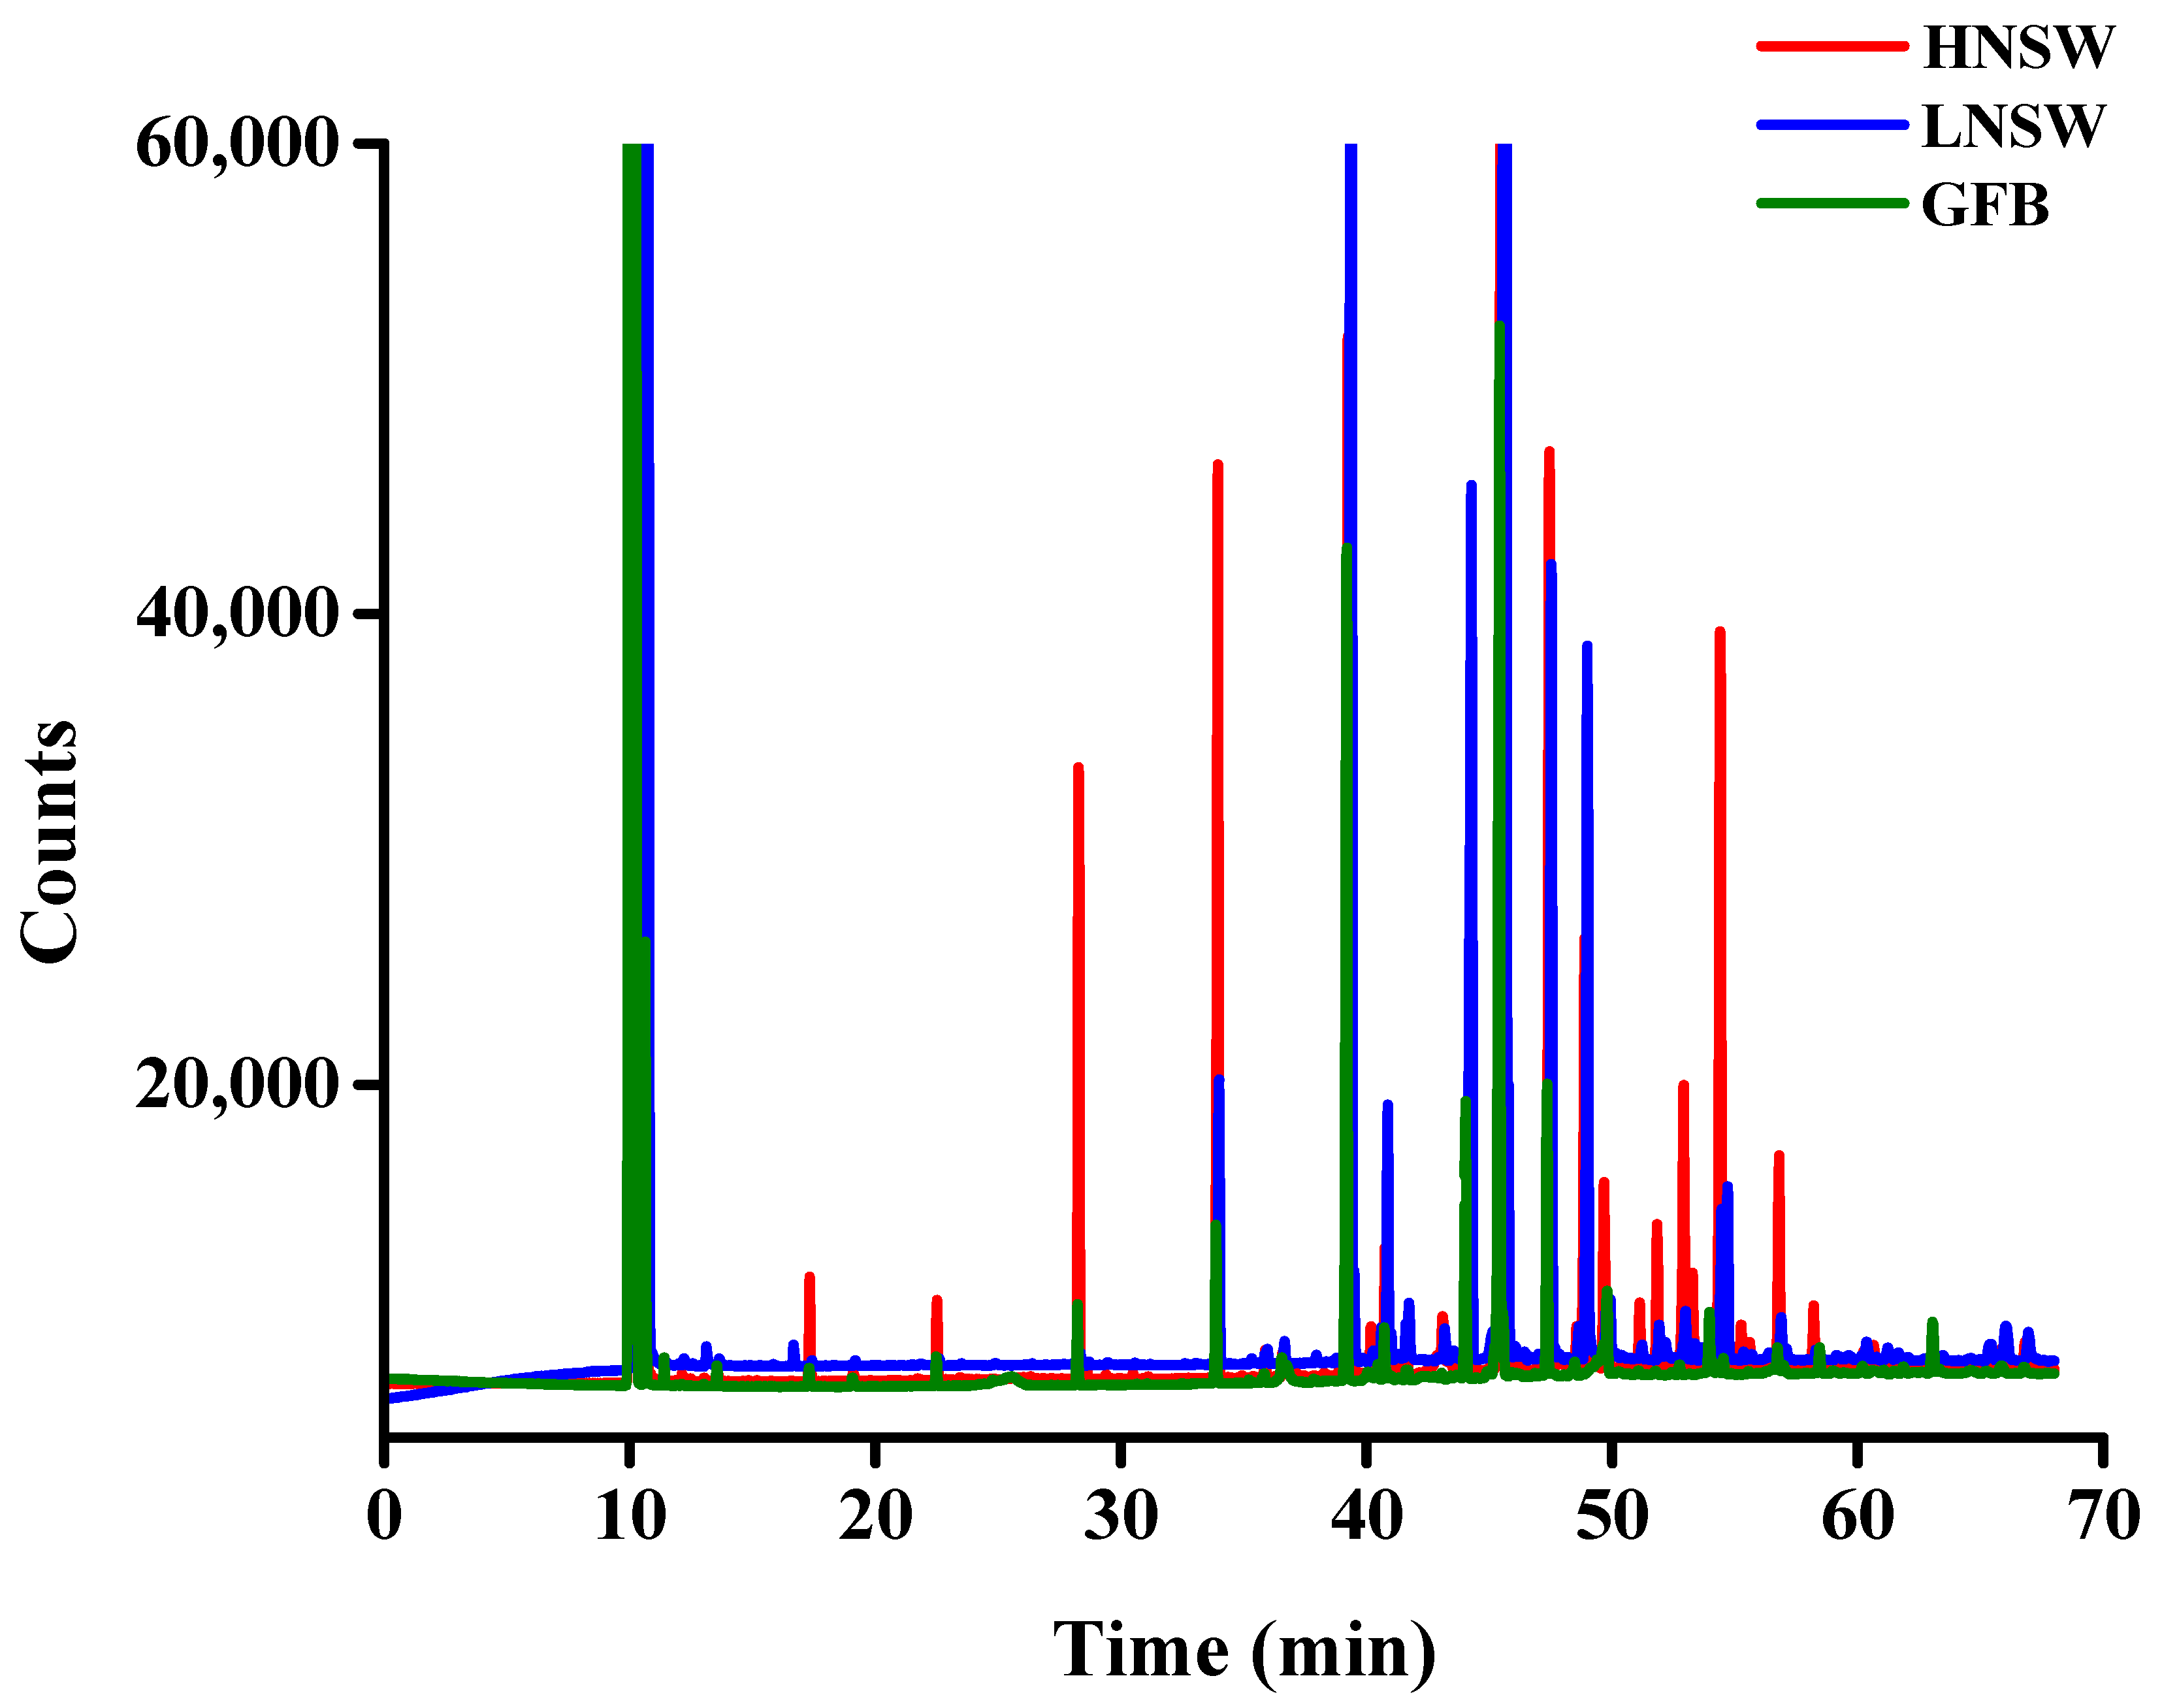
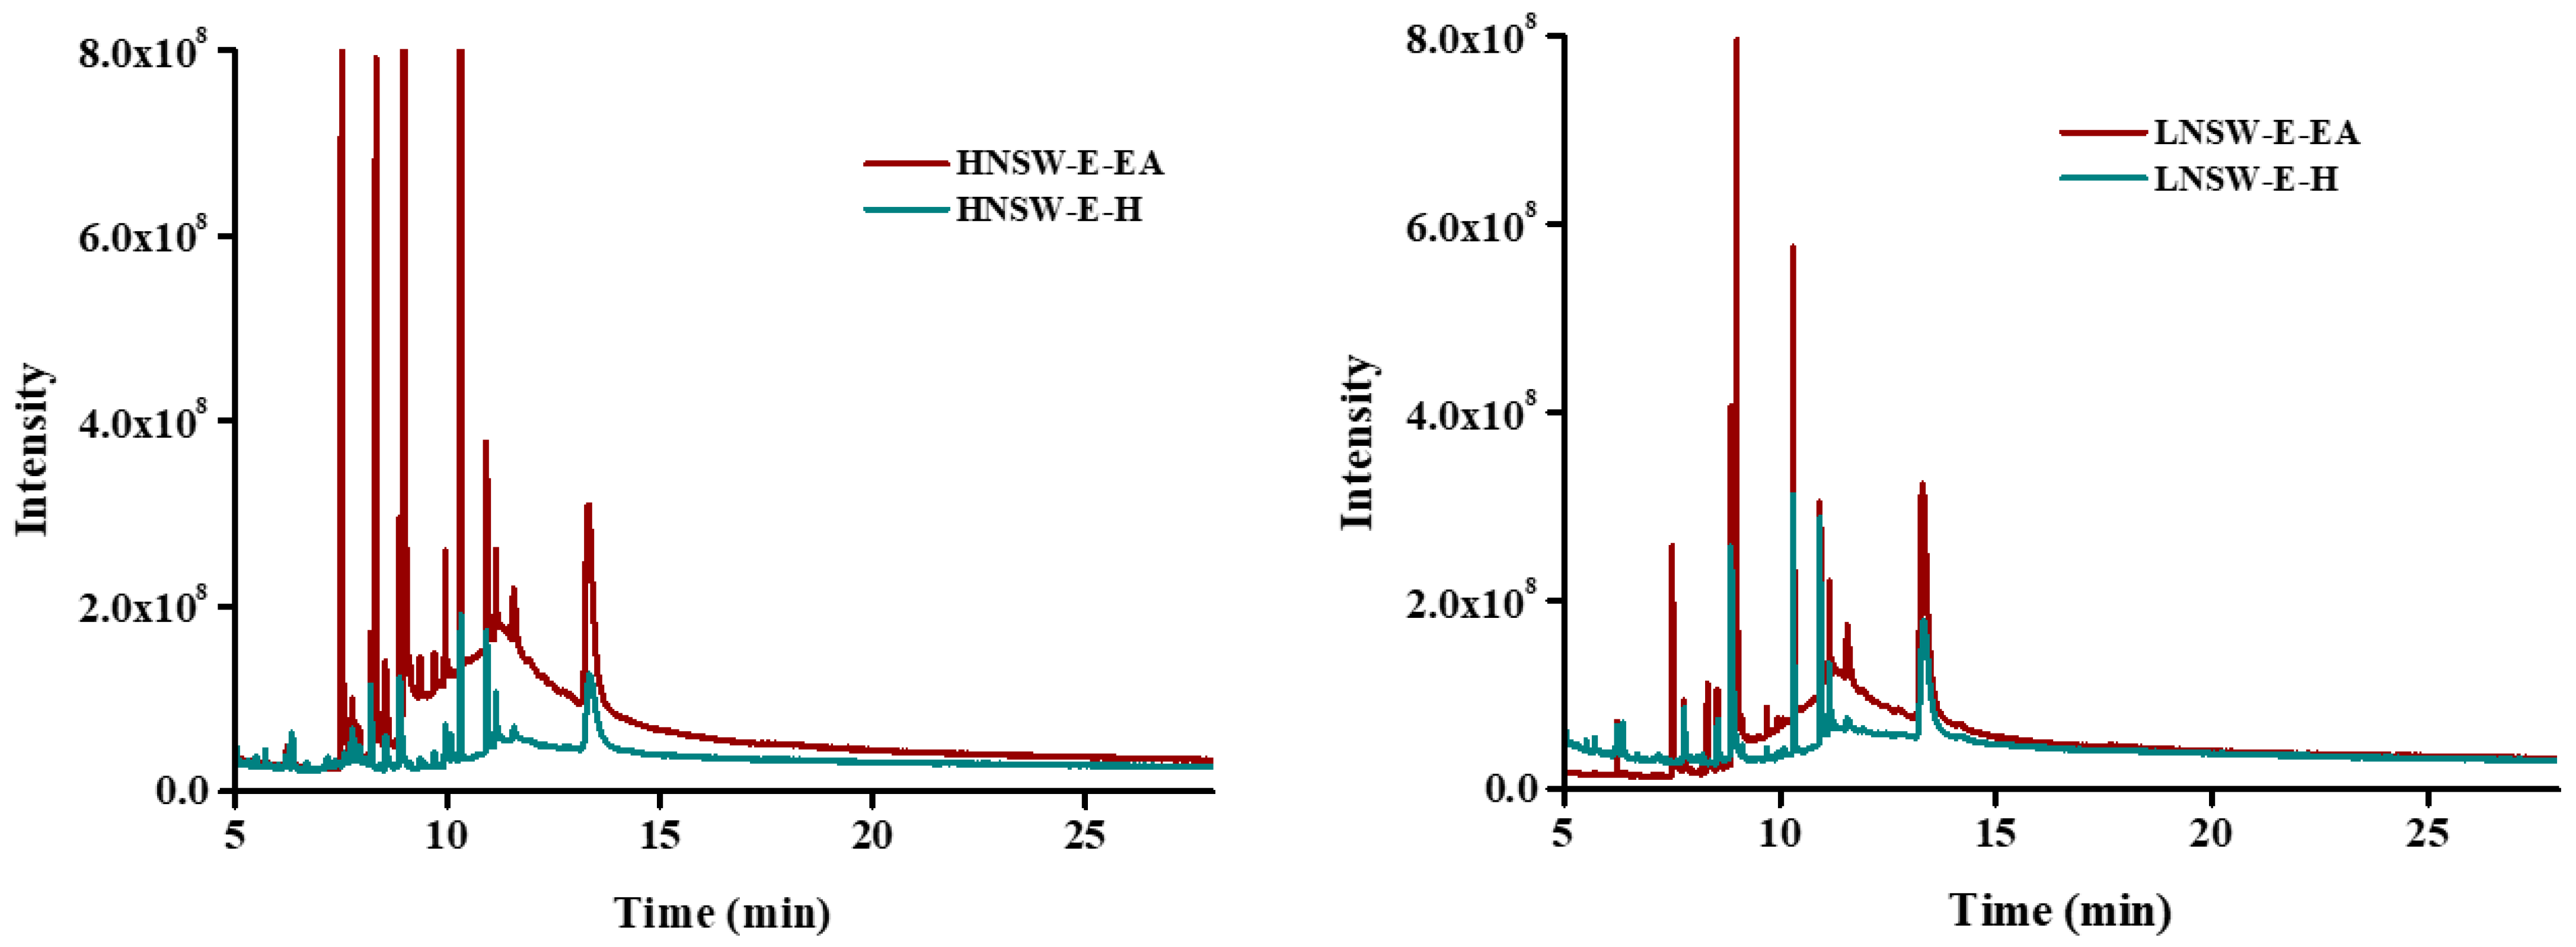
3.9. Molecular Composition of the Extracted Samples

All three samples of HNSW, LNSW, and GFB were subjected to extraction with ethyl acetate (EA) and hexane (H) solvents. The derived extracts were subsequently subjected to GC–MS analysis. Comparative spectra for every type of sample in two different solvents (EA and H) are shown in Figure 2. For the HNSW sample extracted with ethyl acetate, the compounds detected and identified through GC–MS analysis include the following: tetradecanoic acid, 2-pentadecanone, 6,10,14-trimethyl-pentadecanoic acid, arachidonic acid, phytol, cis-13-octadecenoic acid, and 1-heptatriacontanol. Among these molecules, the ones detected with higher abundance include tetradecanoic acid and pentadecanoic acid. For the LNSW sample extracted with ethyl acetate, the same observations were made as in HNSW.
For both HNSW and LNSW samples subjected to hexane extraction, the following compounds were detected through GC–MS: 2-pentadecanone, 6,10,14-trimethyl-pentadecanoic acid, arachidonic acid, phytol, cis-13-octadecenoic acid, and 1-heptatriacontanol.
All compounds were identified using the NIST libraries for GC–MS, employing NIST MS Search Software version 2.0. The identified compounds are found to be of the same type of molecular species reported in the literature [32,33,34]. Further biological work has subsequently employed the ethyl acetate extracts.

3.10. Sample Hydrolysis and Composition

HNSW samples were also subjected to hydrolysis for further investigation of the possibility of determining the amino acid composition. To that end, the hydrolyzed samples (vide supra) were analyzed for total amino acid content, expressed as leucine, using the ninhydrin method. Briefly, adjustment of the pH of the hydrolyzed material was achieved using NaOH solution of 50% w/v to a final value of 5.5 in a test tube. The ninhydrin reagent (35 mg ninhydrin in 10 mL ethanol) was then added and the tube was heated to boiling. After cooling the sample, measurements were taken against a reagent blank solution at 570 nm with a 10 mm glass cuvette. The method was calibrated with a calibration curve using leucine standards [35,36]. The derived results suggest the presence of 20 mg/kg of total amino acids, expressed as a leucine median value on a wet basis for the hydrolyzed samples. The free amino acids can be useful as building blocks for the synthesis of phytohormones, which are excellent biostimulants.

3.11. Amino Acid Analysis

All three samples (HNSW, LNSW, and GFB) were digested as per description provided (vide supra), ultimately affording a detailed amino acid analysis, useful in the identification of (a) the nature of the raw materials to be used as fertilizers, (b) the composition of molecular agents (amino acids) useful in defining their ability to assist and activate plant growth, and (c) the biological potential, when acting as nutrient-specific formulators of cell plant growth under physiological conditions. The results show a wealth of amino acids (17 AAs) being identified, with their content progressively increasing in the order LNSW < HNSW << GFB, thus exemplifying the very nature of the samples themselves as sources of amino acids. In fact, fish backbones, especially when fish meat is still attached to the bones after filleting, are rich in protein, especially glutamine (Glu) and glycine (Gly). About 20% of the mass of fish bones is typically collagen (a protein), which has about 30% glycine [30]. The detailed account of AAs present in the examined samples is provided in Table 4.

3.12. DPPH Scavenging Activity

Ethyl acetate extracts of dry HNSW, LNSW, and GFB samples were used for the determination of their free radical scavenging ability, following evaporation of the solvent. The hydrogen atom donating ability of the extracts was determined by the decolorization of a methanol solution of 2,2′-diphenyl-1-picrylhydrazyl (DPPH), producing a violet/purple color in methanolic solution, which fades into yellow in the presence of antioxidants. Consequently, dry extracts after dissolution in a minimum amount of methanol, until the solution was clear, were further used in the DPPH assay. To that end, in the case of HNSW, the scavenging activity was determined to be 0.77 ± 0.01 mg AAE/g dry HNSW extract. For LNSW, the scavenging activity stood at 0.78 ± 0.01 mg AAE/g dry LNSW extract, with the corresponding scavenging activity of GFB being absent, as there was no scavenging effect.

3.13. Antimicrobial Evaluation in Bacterial Cultures

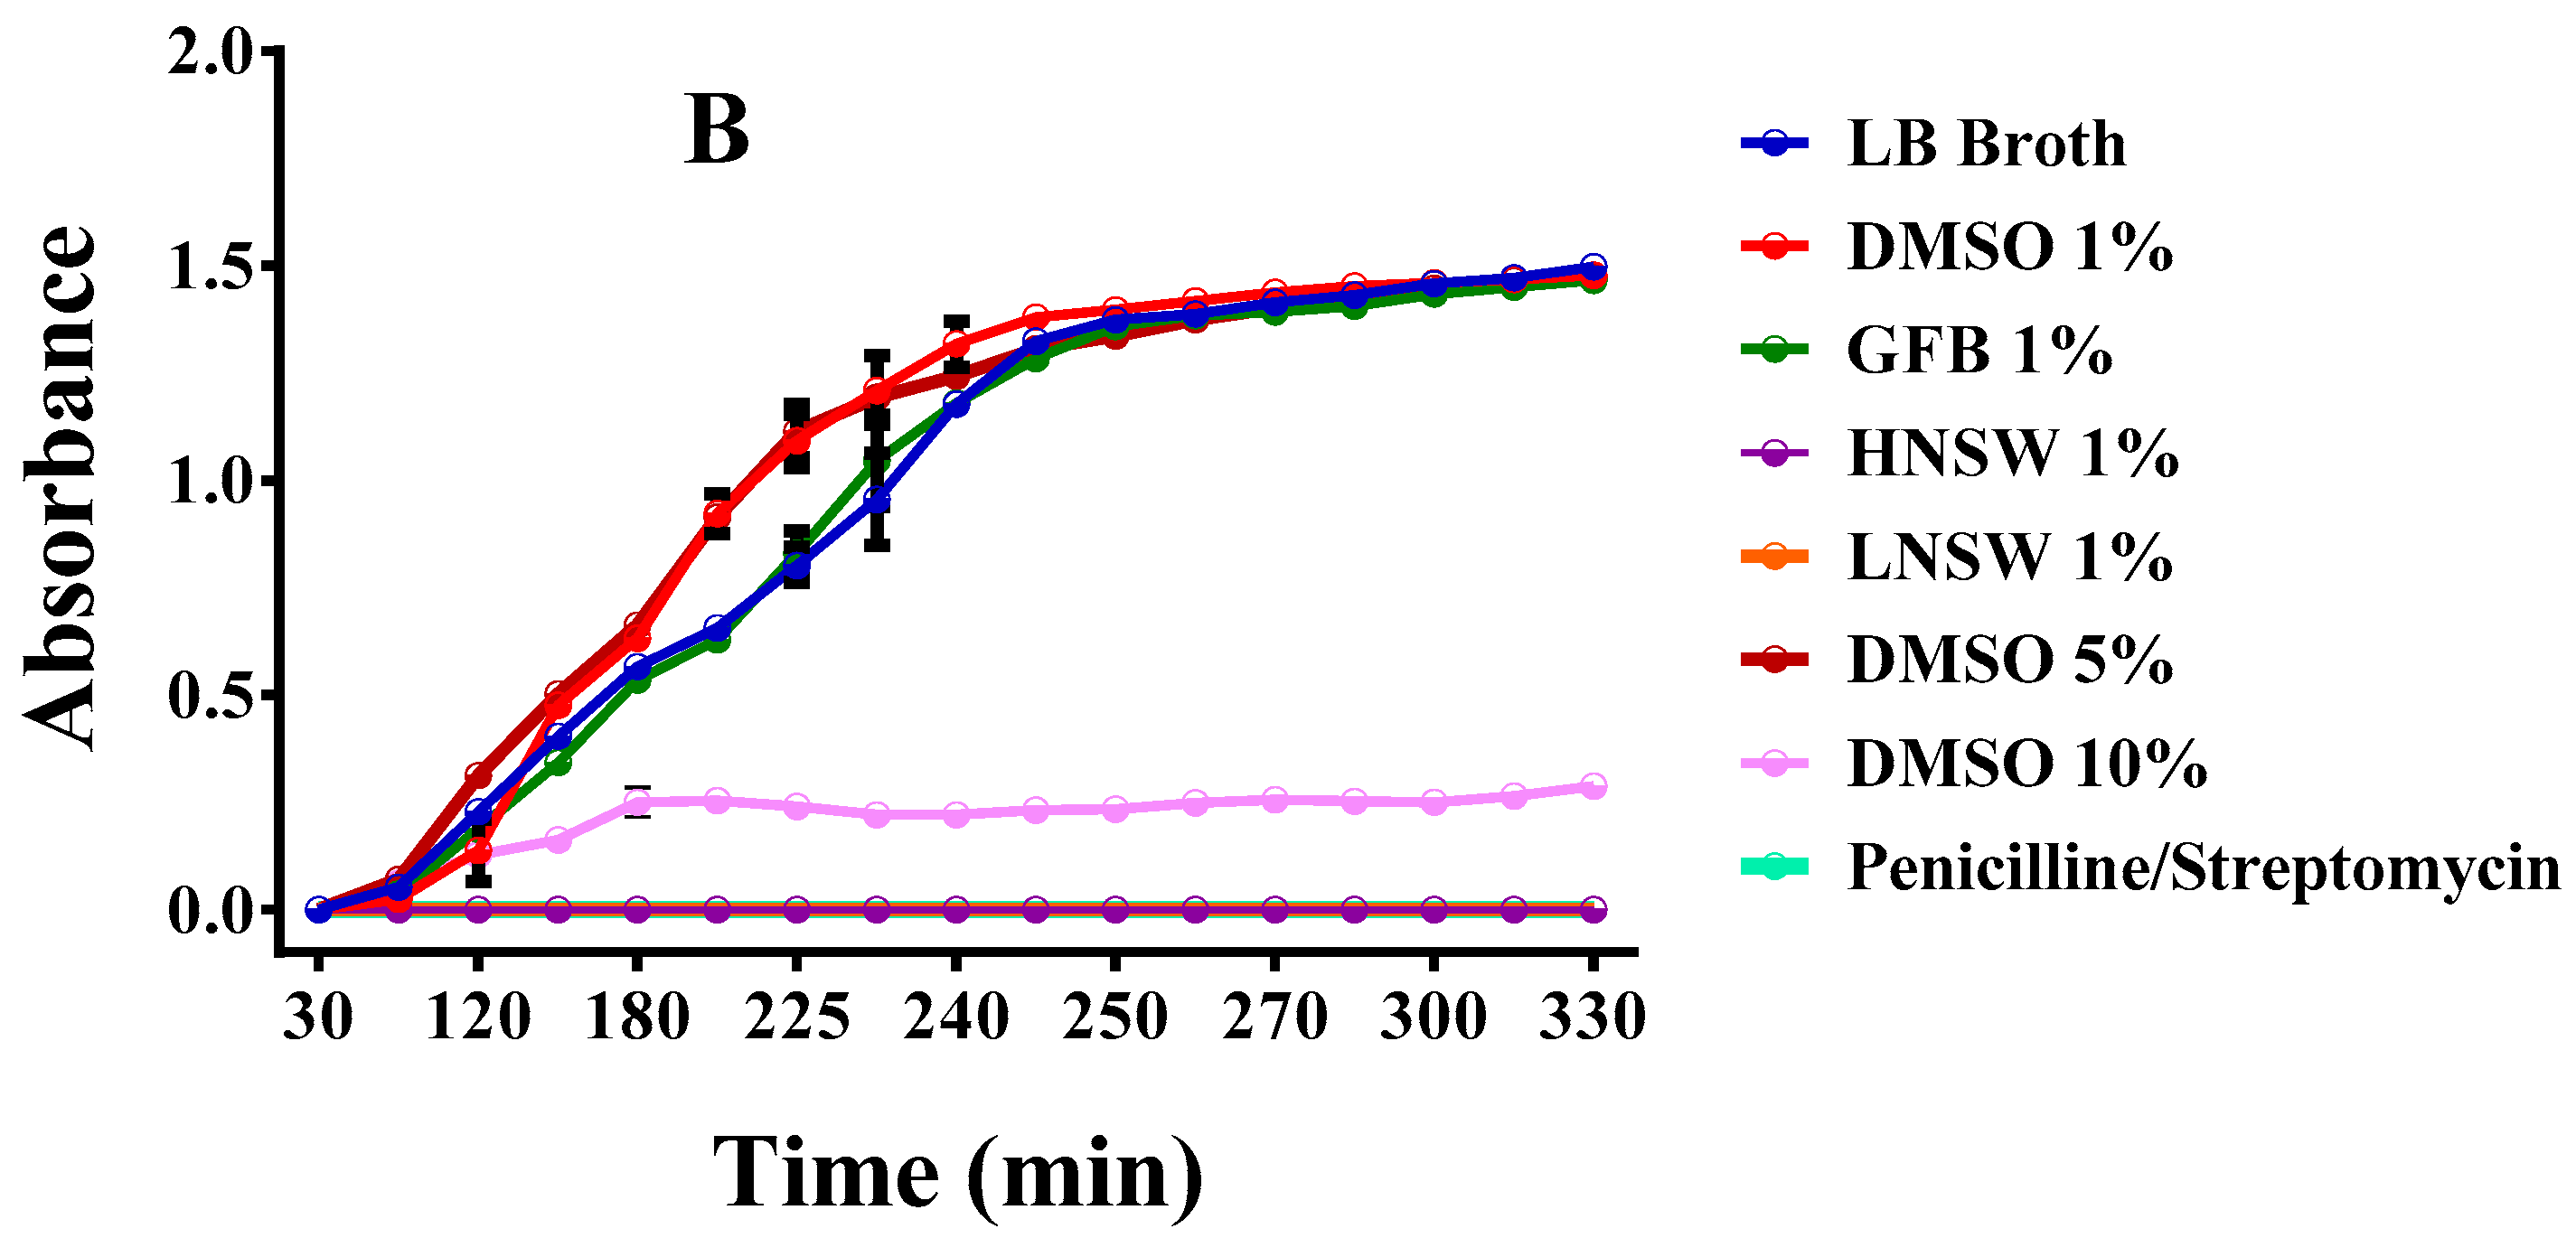
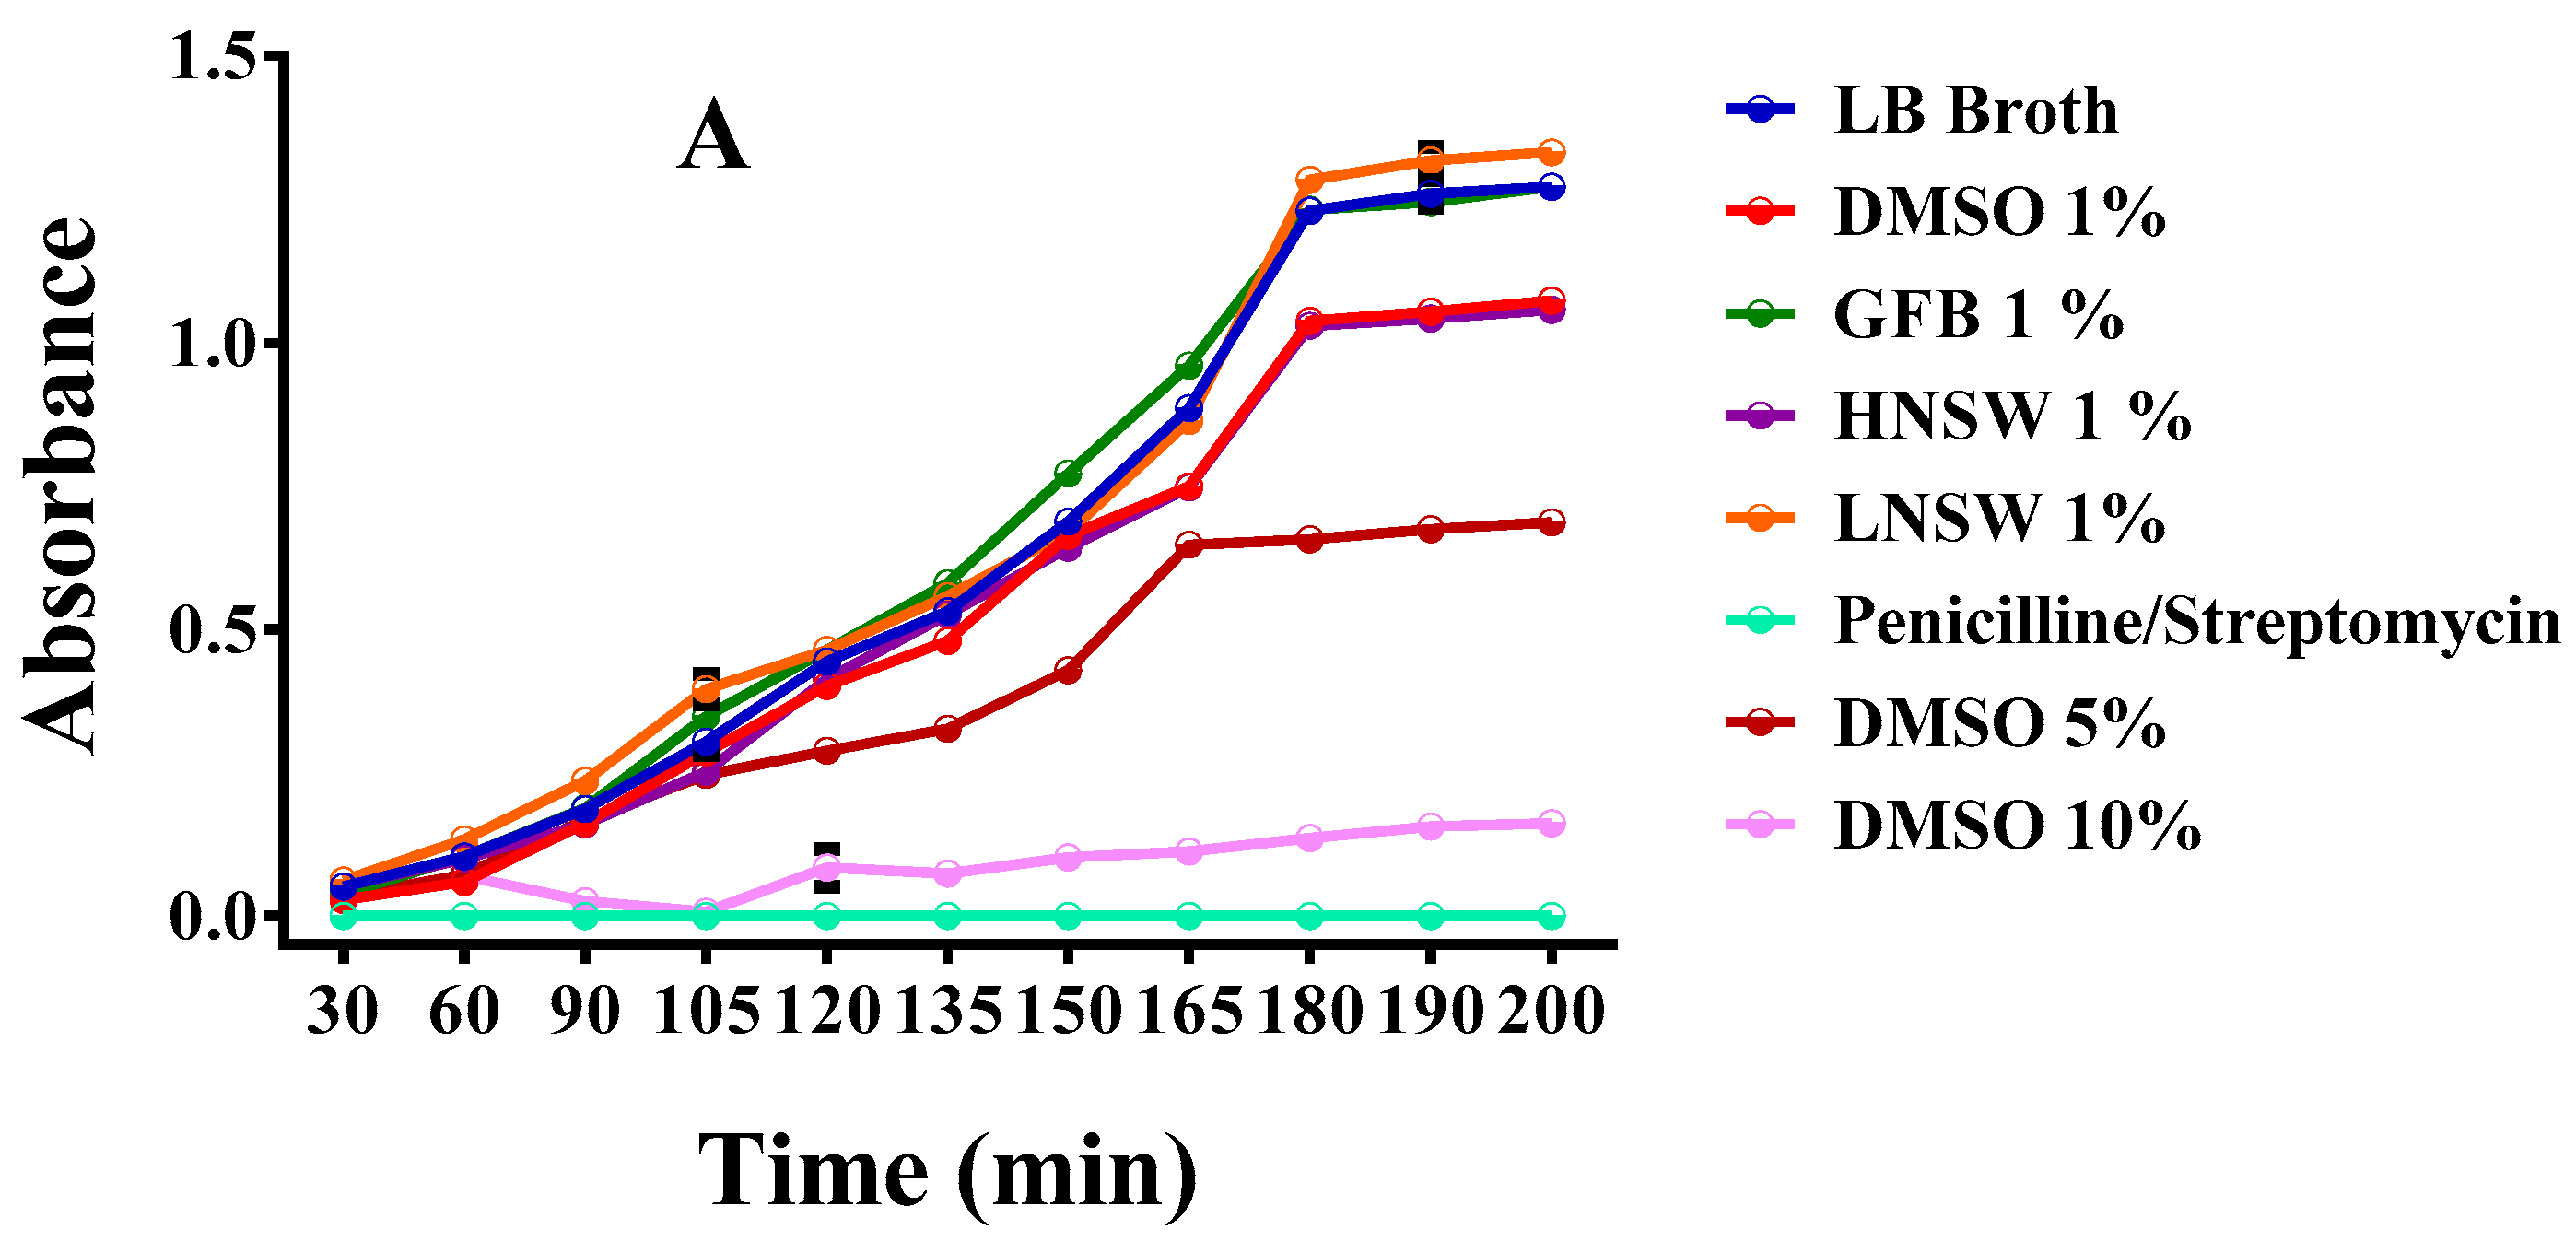
3.13.1. Liquid Cultures

LB broth and penicillin-streptomycin have been used as positive and negative controls, respectively. Specifically, the LB broth control samples were run in parallel, from the same inoculum, with every actual extract investigated. The extracts HNSW-E-EA, LNSW-E-EA, and GFB-E-EA as well as their solvent (DMSO) alone, were examined at various concentrations so as to determine their effect(s) on each bacterium. Particularly, in in vitro E. coli cell cultures (Figure 3A), HNSW-E-EA 1%, LNSW-E-EA 1%, GFB-E-EA 1%, DMSO 1%, and DMSO 5% were examined. They all seemed to enhance bacterium growth with no toxicity observed over the entire incubation time (~3 h), with the exception of DMSO 10%, which appeared to inhibit their growth over the same period of incubation. In the case of S. aureus cultures, the observed effect of GFB-E-EA 1%, DMSO 1%, DMSO 5%, and DMSO 10% showed almost the same profile as in E. coli. In contrast to that observation, the seaweed extracts (HNSW-E-EA 1%, LNSW-E-EA 1%) exhibited a different behavior. More specifically, HNSW-E-EA 1% and LNSW-E-EA 1% seemed to kill bacteria in a range of time 30–330 min (~6 h of incubation) as shown in Figure 3B.

3.13.2. Solid Agar Cultures

To determine the antimicrobial efficacy of the entitled extracts, the minimum inhibitory concentration (MIC) values were determined on an agar plate using the disc diffusion method. The MIC and ZOI values are presented in Table 5. All of the extracts, including DMSO, were studied from 1–100% concentration in E. coli and exhibit no ZOI. In the case of S. aureus cultures, the MIC was determined to be 80%. Fish residue extracts and DMSO showed no ZOI at all concentrations investigated.

3.14. Biotoxicity Investigation in Eukaryotic Cell Cultures

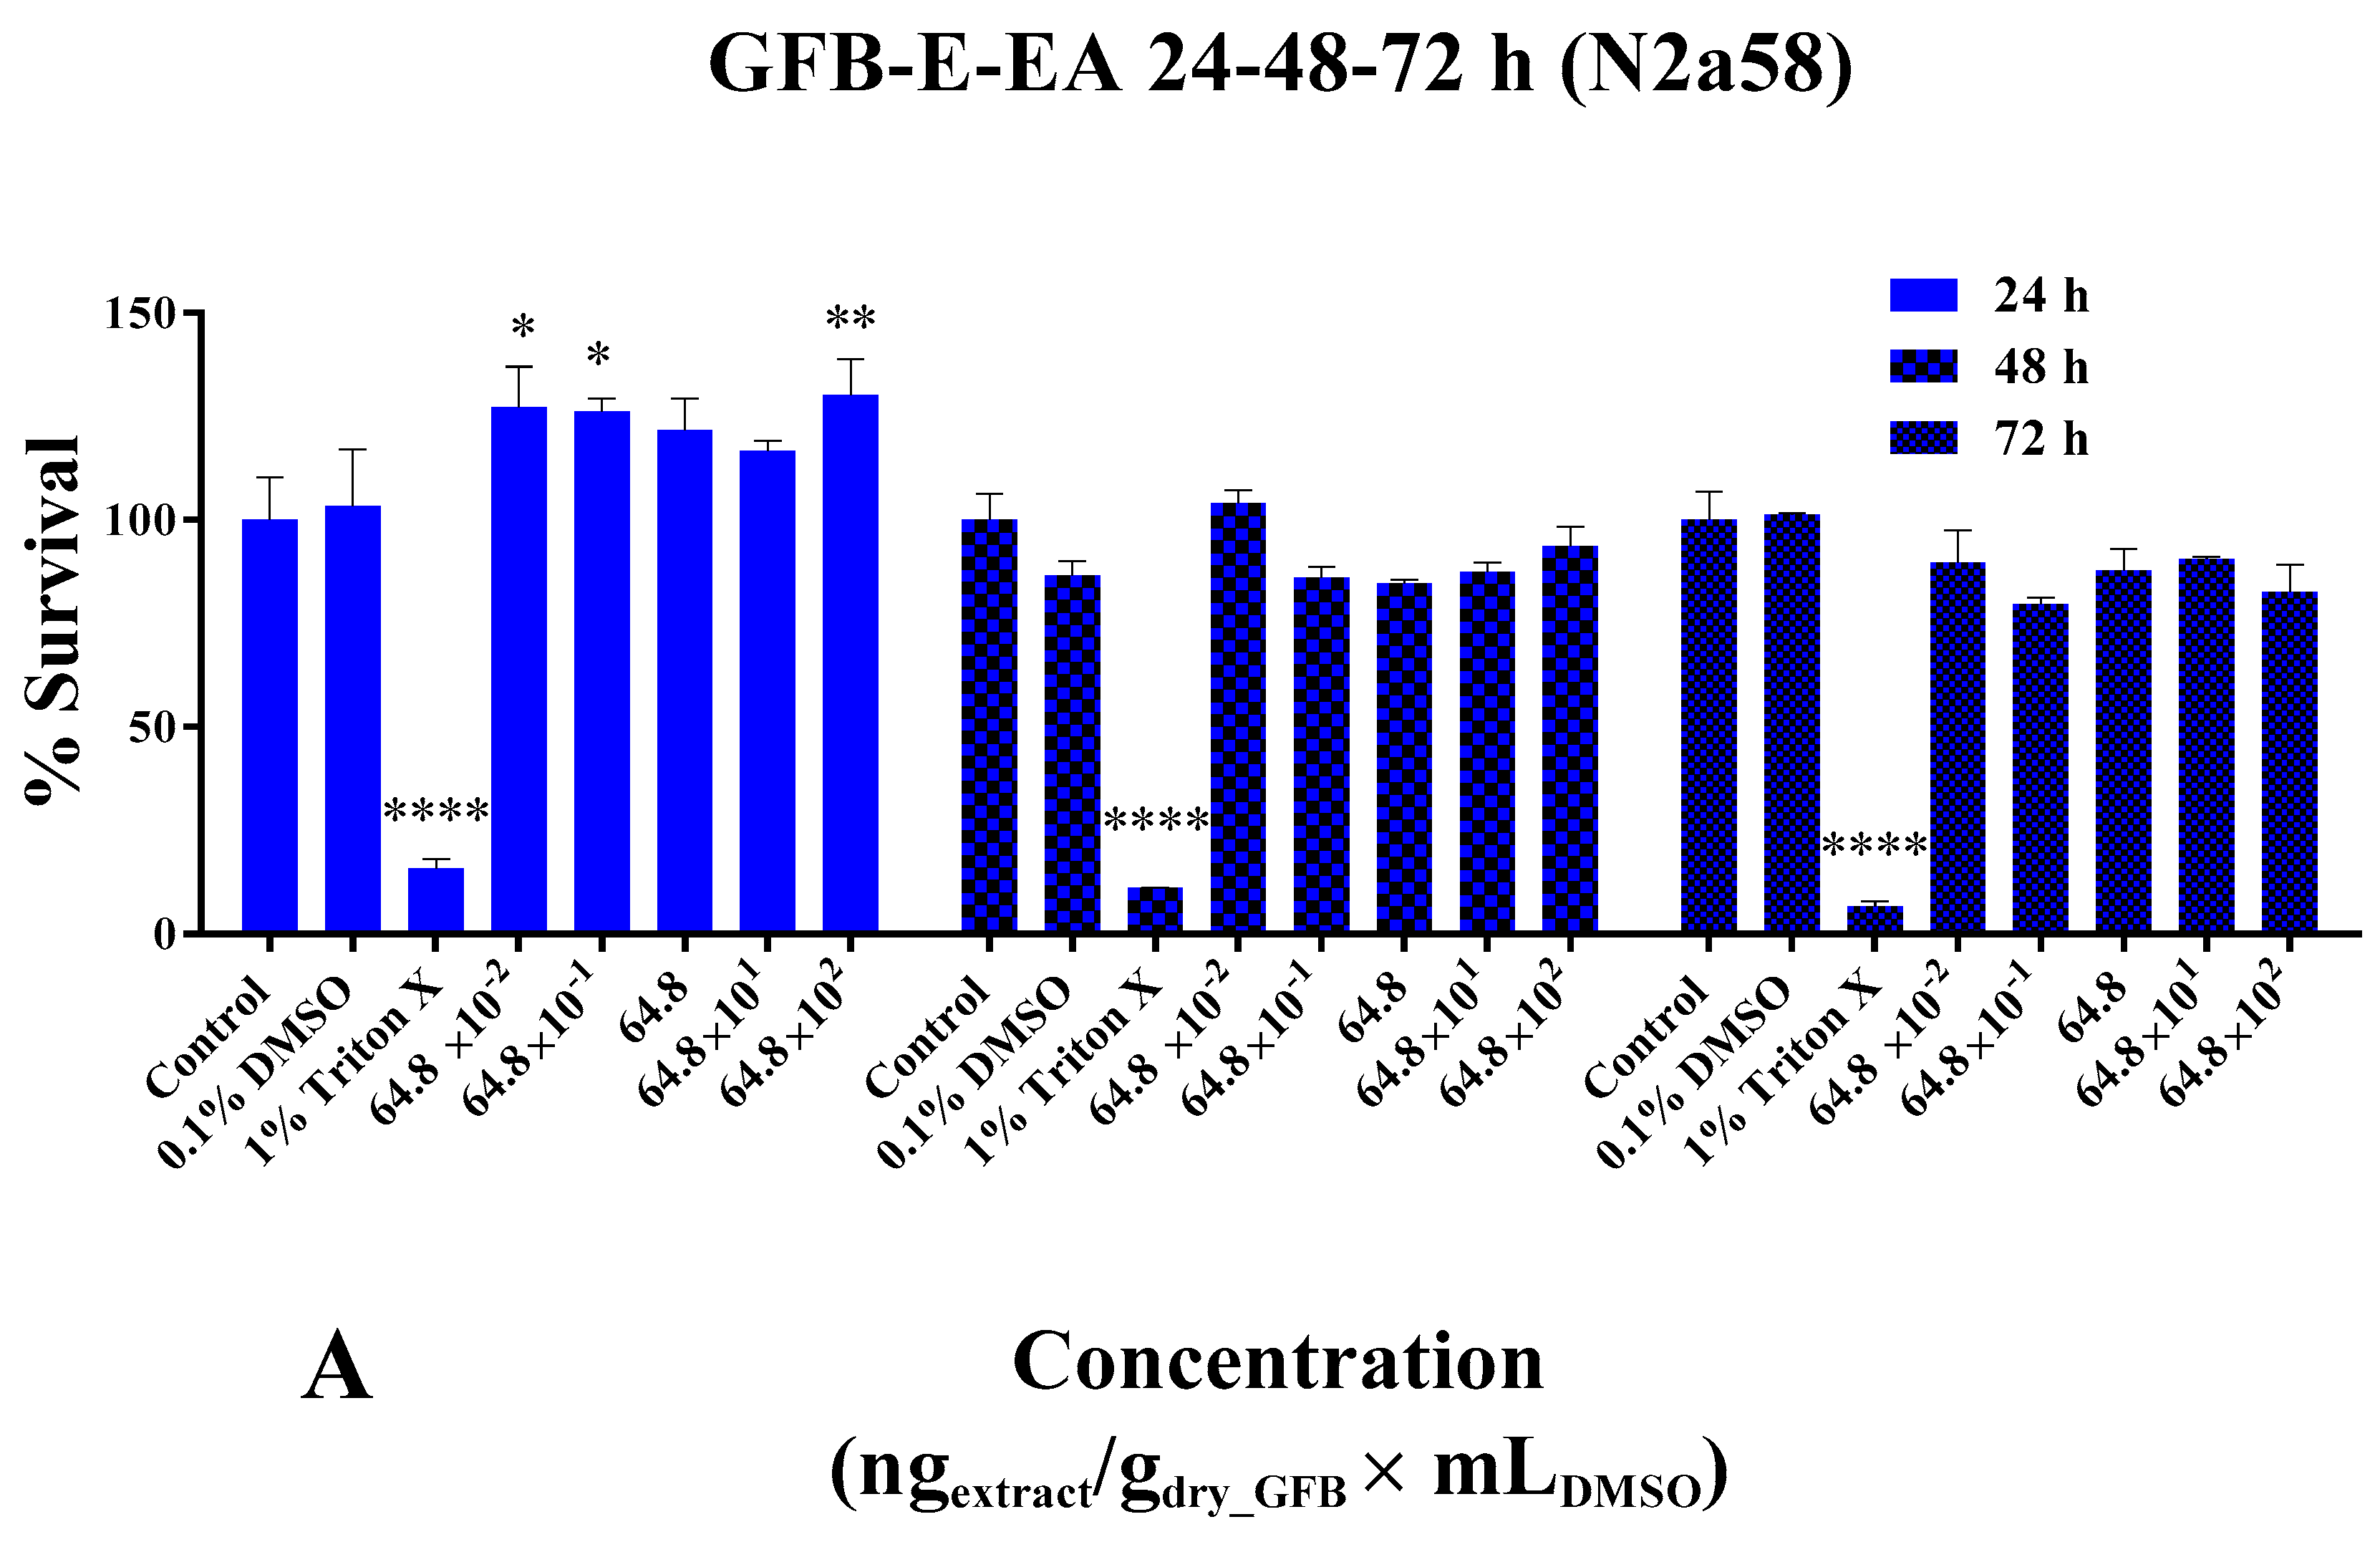
3.14.1. Cell Viability and Proliferation Studies

To assess the biotoxicity profile of the extracts, N2a58 and SH-SY5Y neuronal cell cultures were treated with the title extracts at various concentrations for 24, 48, and 72 h. Triton X-100 (1% v/v) was used as positive control for the cell viability assay, exhibiting cytotoxicity in both cell lines, with the DMSO solution alone being used to probe into possible cytotoxicity of itself. The first parameter optimized was the volumetric percentage of DMSO (in which the extract was dissolved) used in experiments. In concentrations of the DMSO solution greater than 0.5% v/v, slight cytotoxicity was observed in both cell lines. Because of these observations, all working solutions of extracts were generated using 0.1% v/v of DMSO. The viability of the cell lines in the presence of the three extracts (HNSW-E-EA, LNSW-E-EA, and GFB-E-EA) at various concentrations was investigated, following incubation for 24, 48, and 72 h. The results are shown in Figures S2, S3 and S4, for both N2a58 (A) and SH-SY5Y (B) cultures, respectively.
The concentrations studied for HNSW-E-EA were 28.0 × 10², 28.0 × 101, 28.0, 28.0 × 10⁻¹, and 28.0 × 10⁻² ngextract/g dry HNSW/mL DMSO; for LNSW-E-EA they were 24.6 × 10², 24.6 × 101, 24.6, 24.6 × 10⁻¹, and 24.6 × 10⁻² ngextract/g dry LNSW/mL DMSO; and for GFB-E-EA they were 64.8 × 10², 64.8 × 101, 64.8, 64.8 × 10⁻¹, and 64.8 × 10⁻² ngextract/g dry GFB/mL DMSO.
In the case of HNSW-E-EA, a mild proliferative effect was observed after 24 h, in both the N2a58 (Figure S2A) and SH-SY5Y (Figure S2B) cell lines, with the behavior of the cell cultures after 48 h and 72 h being close to the control group. In an analogous fashion, in the LNSW-E-EA case, there was a mild proliferative effect only in the SH-SY5Y cell line and only after 24 h (Figure S3B), with the 48 h and the 72 h experiments being quite close to the control group, suggesting a mild proliferative effect. An analogous picture was depicted in the case of the N2a58 (Figure S3A) cell line cultures, treated with LNSW-E-EA over all of the time intervals investigated. Finally, in the presence of GFB-E-EA, a slight proliferative effect was observed after 24 h both in the N2a58 (Figure 4A) and SH-SY5Y (Figure 4B) cell cultures, with the 48 h and 72 h results exhibiting viability of the cells quite close to the growth medium (control). The collective results provide solid proof of the atoxicity of the produced extracts in the studied concentrations over the specific time intervals tested.

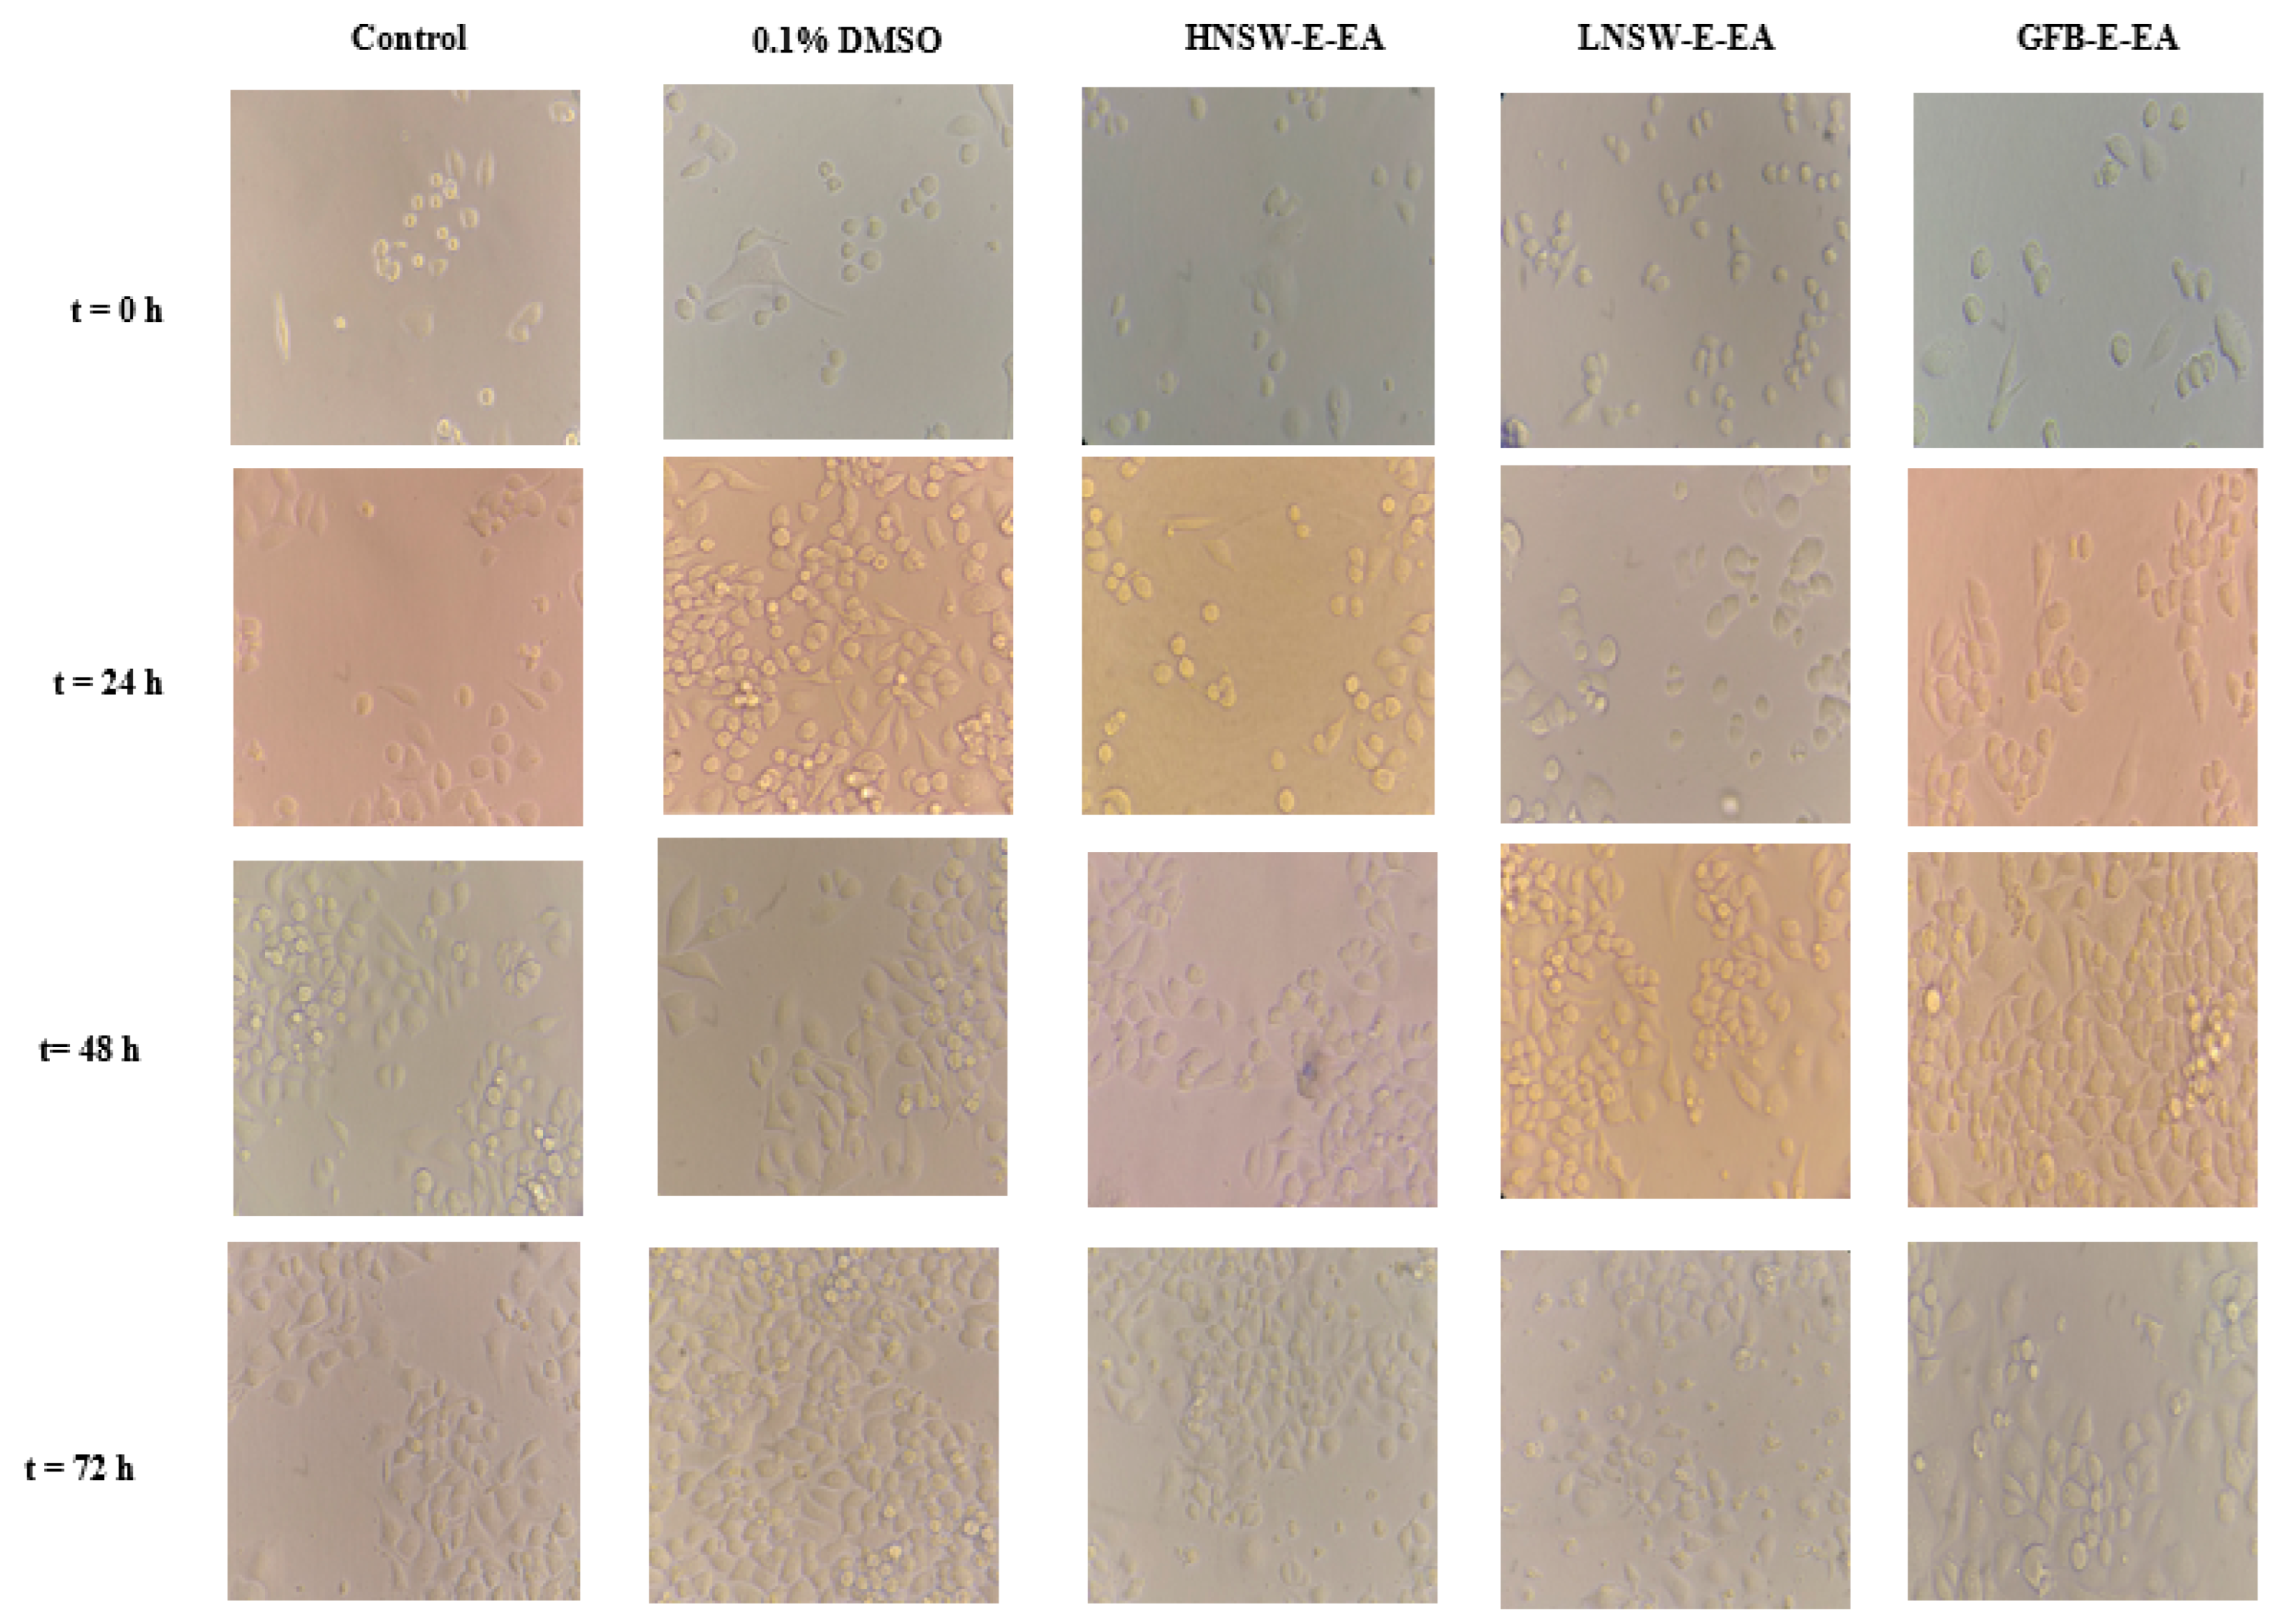
3.14.2. Cell Morphology Studies

To further evaluate the biotoxicity profile of the generated extracts, the morphology of the cells, in both the N2a58 and SH-SY5Y cell cultures, in the presence of the extracts, was considered. The extract concentrations chosen were for HNSW-E-EA 28 × 102, 28.0, and 28.0 × 10⁻² ngextract/g dry HNSW/mL DMSO; for LNSW-E-EA they were 24.6 × 10², 24.6, 24.6 × 10⁻² ngextract/g dry LNSW/mL DMSO; and for GFB-E-EA they were 64.8 × 10², 64.8, and 64.8 × 10⁻² ngextract/g dry GFB/mL DMSO, thereby preserving the volumetric percentage of DMSO in each case. Also, the culture medium (control) and 0.1% DMSO solutions were used to compare each result. Both cell lines (N2a58 and SH-SY5Y) appear to have undergone no morphological changes after 24, 48, and 72 h at the highest concentration of each extract used (Figure 5 and Figure S4), with normal cell adhesion and proliferation taking place on the well surface.

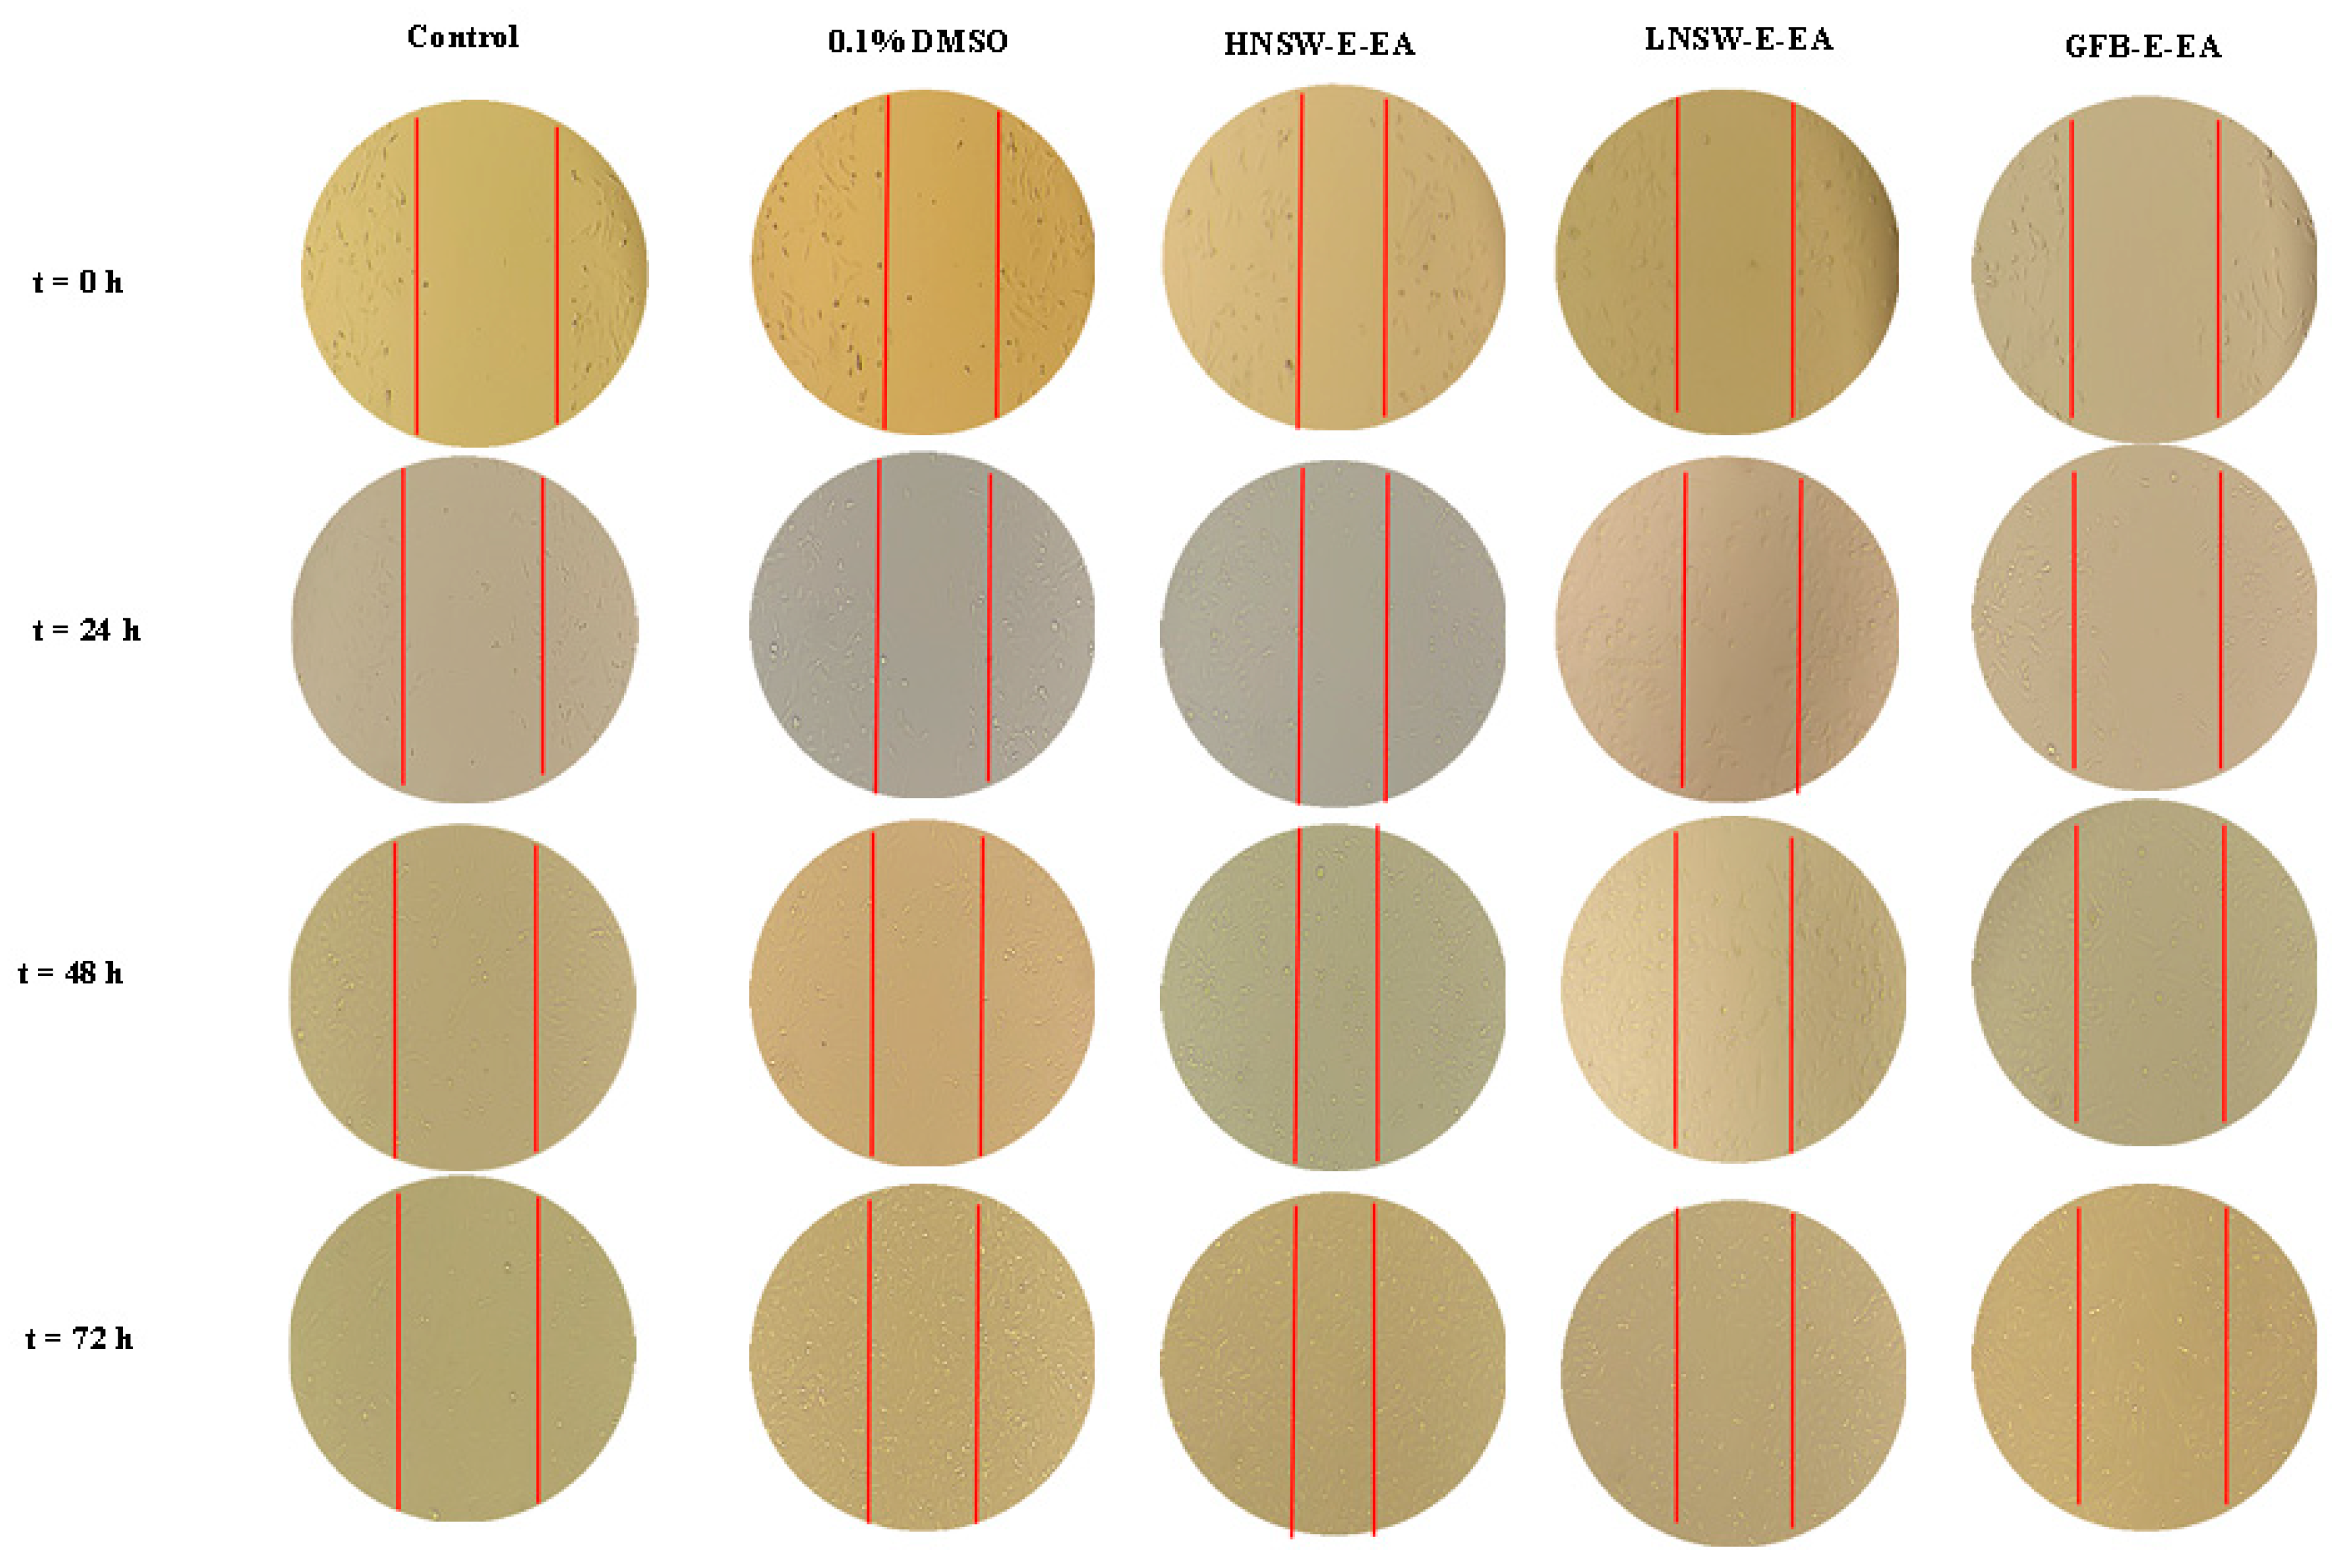
3.14.3. Migration Studies

In an attempt to enrich the biotoxicity profiles of the generated extracts, migration studies provide an opportunity to assess cell motility in the presence and absence of the extracts. The extract concentrations tested were for HNSW-E-EA 28.0 × 10², 28.0, and 28.0 × 10⁻² ngextract/g dry HNSW/mL DMSO; for LNSW-E-EA they were 24.6 × 10² and 24.6, 24.6 × 10⁻² ngextract/g dry LNSW/mL DMSO; and for GFB-E-EA they were 64.8 × 10², 64.8, and 64.8 × 10⁻² ngextract/g dry GFB/mL DMSO, thus preserving the volumetric percentage of DMSO in each case. In the N2a58 cell culture case, after the scratch had been made on the cell monolayer, what was observed was that adherent cells away from the scratch were detached from the plate surface. As a result, the created wound was progressively filled with floating cells, which randomly attached to the plate surface over the duration of the experiment, thus negating the purpose of the assay itself. In the SH-SY5Y cell culture case, the scratch of the monolayer was completely covered at all concentrations tested over less than 72 h. The picture of the progress of the experiment for the highest concentration tested is shown in Figure 6. In all cases of extracts studied through the specific assay, the cell migration speed in each case was determined and the calculated values are shown in Table 6. The observed values of migration speed in all cases of exposure experiments, examined for the SH-SY5Y cell cultures, are very comparable to the reported speeds determined for a variable number of eukaryotic cell cultures, which had been subjected to wound healing (scratch) assays in the course of the investigation of their cell motility and chemotactic behavior [37]. Overall, there is no inhibition of the natural cell motility, in any case of extracts used in the specific assay, thus providing further evidence for their atoxicity profile.

4. Discussion

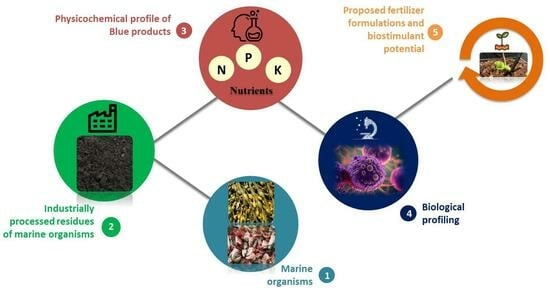
4.1. BlueBio Waste as a Potential Ecofriendly Fertilizer in Plant Growth

Naturally occurring materials originating from industrially processed organisms have in recent years assumed significance as raw materials containing useful molecular components of diverse physicochemical properties and thus potentially benevolent biological properties in a diverse spectrum of applications. Among such a plethora of marine organisms processed at the industrial level and leaving behind residues (waste) of yet unexplored applications, seaweed residues after chemical extraction, and ground fish bones constitute a well-defined group of waste of natural origin waiting to be investigated. In this context, the prospect of using such industrially produced waste as a raw material for the investigation of its potential as source for molecular components capable of acting as (a) fertilizers, and (b) biostimulants in contemporary agriculture, was explored in this work in due length.
For such an effort to be implemented, two basic tenets should formulate the approach used and the technically apt strategies to be employed: (a) effective physicochemical screening of selected raw materials, and (b) biological assessment of their potency to act as efficient fertilizers and possibly also as biostimulants. The so-arisen opportunity has therefore focused on (a) seaweed (HNSW and LNSW), and (b) ground fish bones (GFB), both emerging from their corresponding industrial processes, thus leaving them as unexplored waste for further perusal.
The physicochemical profile included elemental composition linked to metals and non-metals, nitrogen content (in the form of total and mineral nitrogen and amino acids), and organic and inorganic carbon. That way, both the potential of the starting materials to satisfy the demand of crop plants for mineral nutrients, as well as any potential toxic elements (heavy metals) could enter the profile. The physicochemical profile served as a basis of evaluation and assessment of a pluripotent biological activity emerging through a plethora of biological experiments in vitro, thus formulating the biological profile of the raw materials. Collectively, the overall arisen biochemical profile could serve as a guide to variably configured formulations of composite biofertilizers, fit to contribute to crop plant growth, potentially affecting soil, plant roots, leaves, and ultimately the fruit. Potential target plants could include strawberries, lettuce, and cucumber among others, thus exemplifying applications to be pursued in the future.

4.2. Establishment of Fundamental Physicochemical Properties

Both of the original HNSW and LNSW samples were strongly alkaline (pH > 9.1), with the ground fish bone (GFB) samples being close to the physiological pH value (7.0).
Electrical conductivity (Table 1) was high in both the HNSW and LNSW samples, with that of HNSW sample being close to two-fold higher than that of the LNSW sample. In both cases, however, conductivity was exceedingly high, i.e., several-fold higher than that in materials considered as potential biofertilizers in agricultural practices (i.e., 800–4000 μS/cm) [38,39].
In the case of the ground fish bone (GFB) samples, the electrical conductivity was still high (8500 μS/cm) compared to that of an ordinary fertilizing material, yet close to seven times lower than that of the HNSW sample and around four times lower than that of the LNSW sample.
The large difference between the seaweed and GFB samples could be attributed to the origin of the raw materials, with the seaweed sludge having been treated with salts from alkalis and acids, thus resulting in considerably higher conductivity than that in the fish bones.
In contrast, there were no significant differences between the three samples with respect to the organic carbon content, whereas the total carbon content was almost two-fold higher in the HNSW and LNSW samples compared to the total organic content and significantly higher than that in the GFB sample (Table 1). Furthermore, the fact that the total carbon content in both the HNSW and LNSW samples was practically the same is worth noting.
A different picture arose for the total nitrogen content. There, in the HNSW and LNSW samples, the total nitrogen content was low (<0.5%), with the LNSW content being close to 2.5-fold lower than that in the HNSW sample. Beyond that assertion, the nitrogen content in the GFB sample was three- to six-fold lower than the total organic carbon and carbon content, respectively, of the HNSW and LNSW samples, and three-fold lower than the carbon content values of the GFB sample. Furthermore, it was ~5–13 times higher than the corresponding nitrogen content in the HNSW and LNSW samples (Table 1).
According to our data, the HNSW and LNSW samples contain very small amounts of phosphorous (P) (0.07 and 0.08%, respectively) (Table 2). Both types of samples, however, had minuscule amounts of P compared to the GFB samples (1.20%). In light of such experimental observations, GFB represents a significant source of phosphorus, potentially suitable for use as fertilizer. HNSW and LNSW, too, may contribute slightly to phosphorus application, but to a considerably limited extent due to their comparatively very low concentrations of P.

4.3. Identity Formulation upon Leaching

The raw material samples, since they are of marine origin, have a high sodium content due to the (a) inherently present salt, and (b) residues of NaOH treatment used in the seaweed extraction process. Consequently, the industrially generated HNSW and LNSW samples have by nature a high sodium content. High salt content is to be avoided in fertilization applications, as sodium chloride is harmful and toxic at high concentrations to almost every crop [40,41,42]. Since the exact amount of aspired biofertilizers, namely their percentage in soil, is yet to be determined, it was deemed useful to run an initial study on the effects of leaching salt out of samples using water. This is a straightforward procedure, which can easily be scaled up, with minimal cost and effort. The parameters selected for investigation included electrical conductivity, which is an expression of the exchangeable salts, and basic nutrients such as total carbon, total nitrogen, potassium and most micronutrients (Table 3).
More specifically, in the HNSW samples subjected to leaching and subsequently dried, the percentile reduction of sodium content upon leaching was 62%, reflecting a >2.5-fold drop from the original raw material. The percentile reduction of the potassium content upon leaching was 66%, reflecting an approximately three-fold drop compared to the original raw material. In the case of the alkaline earth metal ions, the Mg concentration was essentially unaltered (within standard deviation).
In the case of the LNSW samples, the percentile reduction in sodium content upon leaching was 65%, reflecting an approximately three-fold drop compared to the original raw material. The percentile reduction of the potassium content upon leaching was 69%, reflecting a greater than three-fold drop from the original raw material. On the other hand, an insignificant decrease was observed in the case of the alkaline earth metals Mg and Ca (within standard deviation). Thus, divalent metal ions (Mg2+, Ca2+) were essentially not lost upon leaching.
Therefore, in the case of alkali metals, leaching was instrumental in removing Na and K, which were inherently present in the raw material samples, with the derived levels associated with normal pH and electrical conductivity values (vide supra). Since K is an important nutrient needed by crop plants in large amounts, comparable to nitrogen, loss of K by leaching to remove Na is not beneficial for subsequent application as fertilizer. This calls for further studies to reveal practical solutions and the seaweed industry should be aware of the fact that application of sodium salts should be avoided in any processing. Therefore, in overall handling of the differential changes in sodium and potassium concentrations, future attempts could concentrate on avoiding potassium loss or replenishing lost potassium upon leaching by adding the amount lost. On the other hand, the presence of considerable amounts of organic matter in the samples studied may be beneficial to the fertilizing potential of the materials, from the point of view that potassium is retained in them upon leaching instead of being completely removed. In fact, organic matter can enhance soil structure and improve cation exchange capacity (CEC), thereby formulating differential concentrations of sodium and potassium upon irrigation.
With regard to the transition metals present in the dry samples, there was a decreasing trend in the concentration of iron in the HNSW and LNSW samples (within standard deviation). As for the remainder of the alkaline earth and metal ions, the concentration of Mg, Zn, Mn, and Cu remained essentially unchanged upon leaching. Undoubtedly, the forms of the aforementioned transition metal ions in the tested samples allude to discretely configured metal–organic structural variants of such solubility that either any increase or decrease thereof follows the same pattern in both the HNSW as well as LNSW samples.
In an analogous fashion, in both HNSW and LNSW samples, the phosphorus content remained unchanged upon leaching. To that end, it appears that the form of phosphorus in the investigated samples is tied down to distinctly differentiated forms that are not subject to removal upon leaching with water.
Apart from the aforementioned changes taking place in the above elements, the total carbon content in the case of HNSW dropped slightly, with the corresponding drop in the case of LNSW being ~4.0%. For the total nitrogen content, the decrease was insignificant (~0.1%) in both the HNSW and LNSW samples upon leaching. The experimental results suggest that in the case of HNSW samples, the total carbon content reflects forms of that element not easily removed in their majority through aqueous leaching (e.g., hydrophobic). The observations might be linked to alkaline earth, Zn, Mn, Cu, and P changing contemporaneously with C, thus affording ultimately the same overall concentrations as before leaching. In the case of total nitrogen content in both HNSW and LNSW samples, no nitrogenous forms leach out, thus alluding to the equally distinct nature of the compounds in which that element is a component.

4.4. Amino Acid Hydrolysis Supporting Fertilizer Formulations

In general, amino acids are fairly water-soluble. At the pI of an amino acid, the carboxylic acid group is deprotonated and the amine group is in the ammonium form. When pH is high, all groups in an amino acid undergo deprotonation. For some amino acids, in order to facilitate solubilization, pH needs to increase above the amino acid pKa. Cognizant of the aforementioned pertaining to the structure and chemical reactivity of amino acids and the fact that seaweed samples are fairly rich in organic matter and possess a pH of 10, (a) the choice of sample to be analyzed for amino acids should be based on hydrolytic processing, and (b) a specific method should be used to subject the sample to hydrolysis, pursuant to which amino acid analysis could be carried out. The crux of this part of the investigation rests on the principle that a sample reasonably rich in amino acid content could be processed, from which amino acids or amino acid-containing fragments/species would arise and subsequently be isolated. The so-arisen amino acids and/or amino acid peptide fragments generated thereof could be used to enrich raw materials of the two types of marine organism residual waste in a manner that (a) is in line with the composition of conventional fertilizers supporting plant growth [43], and (b) leads to a plethora of combinations that would arise, distinctly differentiating the nature of the hybrid mix generated so as to fit the needs of the soil and enhance the plant growth of a crop, while concurrently being in line with conventional fertilizer characteristics when applied in the field. Ostensibly, enrichment of the hybrid combinations emerging upon mixing of the two marine organism residues should come from GFB (vide infra).
As a first approximation to the implementation of the approach described above, the amino acid content of all three samples was determined according to officially acceptable methods involving digestion under acidic conditions (Table 4). The sample with the highest content of AAs was, as could be expected from its origin, GFB, followed by HNSW and LNSW. Our study confirms that fish bones with some soft tissue attached are a rich source of AAs. Since they also contain significant amounts of P and Ca, the fish bones may be considered as a viable source of nutrients in agricultural practices. Furthermore, observation of the fact that GFB is the only sample containing cysteine (albeit low in concentration compared to other amino acids) (Table 4), suggests another reason for which reducing sulfur-containing amino acid sources (e.g., cysteine) could enhance the provision of essential amino acid strength to the plant. In fact, cysteine plays a central role in plant metabolism due to its chemical potential as a donor of a reducing sulfur atom or a sink for sequestering potential heavy metallotoxins. In that capacity, this specific amino acid is involved in the synthesis of molecules vital to the integrity, growth, and resistance-defense mechanism in oxidative stress [44,45,46].
On the other hand, specific criteria reflecting a well-defined carbon and nitrogen content were used as the basis for selecting a sample for further hydrolytic processing on a large scale to obtain the much-needed amino acids for application in a field-linked composite fertilizer comprising an appropriate combination of the three types of samples. In that sense, the HNSW sample was chosen for further processing as it was found to have the highest amount of fatty content (266.0 ± 50.5 mg/kg) followed by the LNSW sample containing 225.0 ± 42.3 mg/kg. The fish bone sample (GFB) shows the lowest fatty content, close to 41.9 ± 8.0 mg/kg. A pH 10 buffer was used in that case, with the emerging content being 20 mg/kg of total amino acids, expressed as a leucine median value on a wet basis (vide supra). The emerging hydrolyzed sample was transferred to and mixed with the unprocessed seaweed samples.
The experimental results suggest that all seaweed samples contain the most necessary nutrients for plant growth in the form of macronutrients and minerals, except for phosphorus, but not in the proportions required by crop plants. Phosphorus and nitrogen could be enriched through the use of ground fish bone (GFB) samples. The majority of the nitrogen in the GFB material is organic, and present as amino acids. The amino acid content in GFB was ~20- and ~75-fold higher than that in HNSW and LNSW samples, respectively.
Taking into consideration the cumulative physicochemical data on all three types of samples it appears that their unraveled composition and properties jibe with past reports in the literature on commercially available fertilizers, derived from mixed fish residual materials or seaweed, albeit of a different nature from the ones investigated in the present work [47]. These fertilizer materials are currently employed in agricultural practices as stimulators of plant growth, productivity, etc. [48]. Undoubtedly, a more in-depth look at the three types of materials studied here will confirm the fact that (a) they contain a more extensive list of micro and macro-nutrients, thus providing a more comprehensive and global picture of the potential of such nutrients useful in plant growth, and (b) a distinct compositional milieu reflects similar or higher percentages of certain inorganic and organic constituents that could support plant growth [49].
In view of the aforementioned, if liquid fertilizers are to be produced, hydrolysis of the fish residues is an option and many liquid fertilizers are available from such materials. However, with the semi-solid seaweed material as a basic component rich in organic matter, which is beneficial to most agricultural soils, solid fertilizers are more realistic in practice. Previous studies [7,17] have demonstrated that fish bones give a very rapid growth effect, in fact even better than mineral nitrogen fertilizers. Hence, no hydrolysis would be required for the production of solid fertilizers.

4.5. Biological Studies

4.5.1. Bacterial Cell Cultures

The bacterial growth profile of E. coli (Gram-negative) and S. aureus (Gram-positive) cultures has been investigated upon exposure to the extracts derived from the HNSW, LNSW, and GFB raw materials. The results show that there is a difference in the growth of the two bacteria as a function of time, when it comes to the effect of seaweed extracts. Specifically, the differential influence that the extracts HNSW-E-EA and LNSW-E-EA exert on the two bacterial (Gram-negative E. coli and Gram-positive S. aureus) cell cultures occur as these seaweed extracts contain, among other things, arachidonic acid (ARA). ARA belongs to the family of polyunsaturated fatty acids (PUFAs) with the following features: (a) it is present in the phospholipids (especially phosphatidylethanolamine, phosphatidylcholine and phosphatidylinositide) of membranes of the body’s cells; (b) it is abundant in the brain, muscles, and liver; (c) it is released during inflammatory bursts by macrophages and neutrophils; and (d) it is metabolized enzymatically to prostaglandins, hydroxytetraenoic acids, and leukotrienes [50].
In the case of S. aureus, ARA causes production of various electrophilic substances (e.g., isoprostanes, prostaglandins) through a lipid peroxidation (autoxidation) mechanism. These substances can react with nucleophilic groups of cellular macromolecules (e.g., proteins) and induce a stress response in a bacterium. This, however, cannot happen in E. coli due to (a) the different structure that it has as a Gram-negative bacterial organism, containing a thin peptidoglycan layer and an outer lipid membrane. Thus, PUFAs can be incorporated into membrane phospholipids, thereby preventing them from further reaction with cellular macromolecules, and (b) the absence of teichoic and lipoteichoic acid that can further contribute to the lipid peroxidation mechanism [51]. An observation worth pointing out is that the level of ARA released and the amount of reactive oxygen species (ROS) generated in the host–pathogen ARA system determines the degree of toxicity that can be modulated by altering cellular reactive oxygen species (ROS).
Furthermore, in the case of both bacteria studied, it can be seen that under the employed experimental conditions, E. coli cells grow up to 180 min, at which point the growth rate is stabilized, whereas in the case of S. aureus, bacterial growth rate stabilization occurs at 245 min. Also worth mentioning is the fact that in E. coli, the same time (180 min) is needed for the stabilization of bacterial cell culture in DMSO 1%, HNSW-E-EA 1%, LNSW-E-EA 1%, and GFB-E-EA 1%. In contrast to this behavior, the Gram-positive bacterium S. aureus adopts a growth rate stabilization profile in its cell culture that takes 240 min in the presence of DMSO 1% and GFB-E-EA 1% to reach a plateau, whereas in the presence of HNSW-E-EA 1% and LNSW-E-EA 1% it does not take any time to achieve that (plateau from the starting time point). In addition, the stabilization of the cell growth rate in DMSO 5%, takes 165 min for E. coli and 225 min for S. aureus. In the case of DMSO 10% and in the presence of penicillin-streptomycin (PEN), no plateau is observed from the starting time point in both profiles. Therefore, the differential profiles observed in the case of the two bacterial cell organisms are juxtaposed against the employed controls in a well-defined manner.
As far as solid agar cultures are concerned, in the case of the Gram-positive organism S. aureus, a distinct ZOI was observed for PEN 16% (15.6 mm). In the case of LB broth alone, no ZOI was observed as expected (Table 5). Furthermore, whereas HNSW-E-EA 1% and LNSW-E-EA 1% were detrimental to the integrity of the S. aureus cells in liquid cultures, in the solid agar cultures a distinct ZOI was observed at high concentrations (80–100%) of HNSW-E-EA and LNSW-E-EA, exhibiting values in the range from 8 to 13 mm.

4.5.2. Eukaryotic Cell Cultures

The employed cell cultures involved eukaryotic cells from sensitive neuronal tissues in an effort to assess the fortitude of potentially toxic components (even minutely toxic ones) in the marine residue samples (as fertilizers) that could (a) negatively affect the growth of plants, thus either limiting the growth-promoting /enhancing ability of the samples or becoming detrimental to the integrity of the plants, or (b) positively affect plant growth through the activation of their biologically active components. To that end, the cell viability studies on the N2a58 and SH-SY5Y cell cultures, exposed to variable concentrations of HNSW-E-EA (28.0 × 10⁻²–28.0 × 10² ngextract/g dry HNSW/mL DMSO), LNSW-E-EA (24.6 × 10⁻²–24.6 × 10² ngextract/g dry LNSW/mL DMSO), and GFB-E-EA (64.8 × 10⁻²–64.8 × 10² ngextract/g dry GFB/mL DMSO), over 24, 48, and 72 h, showed that (a) at all time points, the extracts were not toxic to both cell lines and (b) there was a slight proliferative effect noted in all cases over the initial period of 24 h of exposure. The latter observation may be a temporary transition phase for the cells exposed to the extracts, with likely enhancement of their physiology due to the infusion of essential components from the extracts (at the indicated concentrations) into the growth media, thereby leading to slightly increasing numbers. Gradual adaptation of the cells to the extracts over the ensuing 48 and 72 h periods returns the cells to a normal cell cycle state in comparison to the control. Individual aberrations from that behavior in both cell lines and at different concentrations (e.g., LNSW-E-EA at 24.6 × 101 ngextract/g dry LNSW/mL DMSO in N2a58 cells over 24 h; LNSW-E-EA at 24.6–24.6 × 10² ngextract/g dry LNSW/mL DMSO in SH-S5SY cells over 48 h) were also observed, thereby signifying the individualized effects bestowed upon the cells by the same extracts at different time points, all indicative of the discrete nature of the cells themselves.
Associated with the above behavior of the cells was also the investigation of their morphology as a function of concentration and time. To that end, the cell culture experiments conducted with both cell lines, using the same concentrations of extracts as in the previous case, over 24, 48 and 72 h, showed that there was no morphological change occurring during the examined periods of exposure. More specifically, in the case of N2a58 cell cultures, careful examination of their behavior over the monitoring period reveals that there are two types of cell shapes: cells with a round shape and cells with an extended shape. In all culture treatments with the three extracts HNSW-E-EA, LNSW-E-EA, and GFB-E-EA (compared to control), the cultures were very similar, with the round shaped cells dominating over the extended type of cells [52]. This behavior is common and has been previously noted in the literature [52]. Worth noting is the case of SH-SY5Y cell cultures, where careful observation of the cells throughout their period of incubation in the presence and absence of the three extracts HNSW-E-EA, LNSW-E-EA, and GFB-E-EA (in comparison to control) reveals the presence of two distinct types of cells, i.e., N-type and S-type, consistent with a) previously seen culture populations, exemplifying neuroblast-like and epithelial-like morphology, respectively, and b) retention of the hybrid cell nature reflected in their appearance, shape, and protruding processes in the culture media [53]. Concurrently, in both N2a58 and SH-SY5Y cell cultures, the cells exhibited normal cell adhesion in all cases (over all time points considered) and slight proliferation in distinct cases (vide supra), thereby complementing the observations made during the viability studies.
Further assessment of the chemotacticity of the cells exposed to the specified extracts at the defined concentrations mentioned above over a period of 24, 48 and 72 h, led to the employment of migration studies initiated through “scratch” or wound-healing assays in both N2a58 and SH-S5SY cell line cultures. Two factors were examined in this context: the migratory ability of the cells and the migration speed under the presence of various concentrations of the extracts HNSW-E-EA, LNSW-E-EA, and GFB-E-EA. The conducted assays are important in describing the migratory ability of the cells under the influence of exogenous agents (in this case the three extracts), thereby providing a more detailed picture of cell behavior that could not be observed through the previous two studies. To that end, monitoring of their chemotactic behavior in trying to expand, proliferate, and reach confluency, while concurrently closing the artificially generated gap in the culture (hence the wound-healing term), reveals that the cells retain to a great extent their potential to grow, expand and repossess their original area of coverage over a period of ~72 h. An added advantage to conducting such experiments was the concurrent determination of the migration speed, with which the cells move to reclaim the space allotted to them due to the inflicted scratch, thereby providing a measure of how well they function under the influence of the three distinctly defined extracts (compared to control). The results (Table 6) suggest that the speed with which the cells migrate remains almost the same and is not affected significantly by the exposure to the three extracts as a function of their concentration over a period of ~72 h. In that respect, the results obtained complement the observations made in the previous viability and morphology studies. Undoubtedly, both facets of the experimentation projecting the migratory ability of the two types of cells under the influence of the extracts describe useful factors contributing to the overall picture of the biological potential of the extracts themselves.

4.5.3. Antioxidant Potential

The antioxidant potency of the extracts of all three studied materials was examined through DPPH scavenging activity experiments, thereby reflecting their ability to scavenge free radicals emerging as a result of oxidative stress conditions in all cells. The specific in vitro assay was conducted with ethyl acetate extracts of dry HNSW, LNSW, and GFB samples and showed that (a) HNSW and LNSW both displayed very mild scavenging activity, and (b) GFB exhibited no activity. The observed results are not surprising in view of the fact that the samples are essentially residues of industrially processed raw marine organisms. Therefore, significant amounts of antioxidant components have been removed, with the ultimate case being that of GFB, which represents ground fish bones. Even so, the mild scavenging activity of the two seaweed samples denotes their existing capacity as antioxidant agents and to that end, the specific property adds to the global biological profiles determined for the investigated extracts.
The cumulative experimental data for all three samples examined establish a well-defined atoxic biological profile for the three extracts, projecting distinctly described properties of the investigated cell lines, collectively useful in assessing the potential of the extracts in further applications in agricultural practices.

5. Conclusions

This study has provided thorough insight into the chemical and biological characteristics of marine residual materials, which may be processed into complete fertilizers for agricultural crops. Detailed screening of HNSW and LNSW samples from seaweeds and ground fish bones (GFB) revealed their analytical composition (metals and nutrients, total carbon, total nitrogen), pH, and electrical conductivity, among other things. With high conductivity, leaching was necessary. Leaching with a ratio of 1:50 removed significant proportions of monovalent cations Na+ and K+. Whereas removal of sodium is required for fertilization, especially of horticultural crops, removal of potassium is not positive from a fertilization perspective, with the conductivity of marine materials calling for further in-depth studies.
None of the studied materials contain an appropriate blend of essential plant nutrients, when applied as a single fertilizers. In horticulture, nitrogen-rich fertilizers are often applied in addition to basic fertilizer dressings to enhance the growth of nitrogen-demanding crops. The fish bone material GFB may be applied for such purposes. For a complete fertilization formulation, the materials need to be blended, and it may also be relevant to blend other types of materials into such fertilizers, e.g., to increase the potassium content.
Amino acid analysis revealed that the HNSW material contained a rich suite of AAs at relatively low concentrations. Even more AAs, at much higher concentrations, were found in the fish GFB material, demonstrating the high biological quality of this resource. Fish protein seems to be easily degradable in soil, since fish material will increase plant growth very quickly. Fish waste also contains significant amounts of phosphorus, a scarce resource, and should definitely be utilized for fertilization purposes instead of going to waste as is often the case today. By analogy, in-depth studies employing organic solvent extraction led to the discovery of a family of organic compounds of potential biostimulant activity (e.g., amino acids, arachidonic acid) [43,54].
Collectively, the physicochemically formulated global (bio)chemical profile of the samples at hand compelled further work on the biological properties of the generated materials as essential factors for normal cell physiology in plant growth. To that end, both bacterial (Staphylococcus aureus and Escherichia coli), and eukaryotic cell lines (N2a58 and SH-SY5Y) were employed in in vitro work, with the sought out experiments targeting (a) the biotoxicity profile formulation of the generated extracts (viability, antimicrobial activity, defined zone of inhibition values) in bacterial cell cultures, (b) the biotoxicity profile (viability, morphology, chemotacticity, proliferation) of the generated extracts in eukaryotic cell lines, and (c) determination of the antioxidant potential of the generated extracts (low DPPH scavenging activity). So-conducted, the experiments revealed the discrete character of the cell line behavior to the exposure of the extracts, thus revealing the connection with the determined composition of molecular components capable of delivering physicochemical potency supporting the biological effects on plant growth in the field.
The collective results, suggest that the well-defined physicochemical and biological profile of the extracts, generated from the raw materials of the selected marine organisms (seaweeds and ground fish bones), (a) provides a clear and in-depth account of interconnected physicochemical and biological parameters of a multiparametric system such as a biofertilizer, and (b) supports an equally defined spectrum of biofertilizer formulation variants (relating composition to biological potential) that could emerge through appropriate proportional mixing of the generated extracts from the HNSW and/or LNSW and/or GFB raw materials. As a result, the arising hybrid materials possess analytical composition commensurate with the biological demands of crop plant growth, thereby justifying further investigation of their efficacy as ecofriendly fertilizers and biostimulants in the field.

Supplementary Materials

The following supporting information can be downloaded at: https://www.mdpi.com/article/10.3390/agronomy13092258/s1: Extract concentrations in DMSO (Table S1), FT-IR spectra (HNSW, LNSW, GFB) (Figure S1), in vitro cell viability diagrams (HNSW-E-EA, LNSW-E-EA) (Figures S2 and S3), and in vitro morphological studies (HNSW-E-EA, LNSW-E-EA, GFB-E-EA) (Figure S4).

Author Contributions

Conceptualization, M.M, S.M. and A.S.; methodology, M.M., S.M., G.L., O.C.P., J.C. and A.S.; project administration, A.S.; validation, S.M. and A.S.; formal analysis, M.M., S.M., G.L. and V.A.I.; investigation, M.M., S.M., G.L., V.A.I. and O.-C.B.; data curation, M.M. and S.M.; writing—original draft preparation, S.M., M.M., G.L., V.A.I., O.-C.B. and A.S.; writing—review and editing, M.M., S.M., O.C.P., A.-K.L. and A.S.; visualization, S.M. and G.L.; supervision, A.S. All authors have read and agreed to the published version of the manuscript.

Funding

This research is part of the MARIGREEN project, which has received funding from the European Union’s Horizon 2020 research and innovation program under agreement 817992 and GSRI (Τ12ΕΡΑ5-00071).

Institutional Review Board Statement

Not applicable.

Informed Consent Statement

Not applicable.

Data Availability Statement

The data and relevant material used and/or analyzed during the current study are available from the corresponding author on reasonable request.

Acknowledgments

All authors acknowledge Algea AS (Kristiansund, Norway) and Sigurd Folland AS (Averøy, Norway) for providing the seaweed and ground fish bone samples, respectively, investigated in this work.

Conflicts of Interest

The authors declare no conflict of interest.

Abbreviations

AAEAscorbic Acid Equivalent
ARAArachidonic acid
ANOVAAnalysis of variance
DMDry matter
DMEMDulbecco’s modified Eagle’s medium
DMSODimethylsulfoxide
EAEthyl acetate
ECElectrical conductivity
EDTAEthylenediaminetetraacetic acid
F.A.M.E.Fatty Acid Methyl Esters
GC–MS Gas Chromatography–Mass Spectrometry
GFBGround Fish Bone
HHexane
HNSWHigh-Nitrogen Seaweed
ICP-MSInductively Coupled Plasma Mass Spectrometry
ICP-OESInductively Coupled Plasma Optical Emission Spectrometry
ISTDInternal Standard
LNSWLow-Nitrogen Seaweed
ODOptical Density
OSOptical Density
ORSOctopole Reaction System
PENPenicillin-streptomycin
TOCTotal Organic Carbon
UPLCUltra Performance Liquid Chromatography
XTT(Sodium 3-[1-(phenylaminocarbonyl)-3,4-tetrazolium]-bis(4-methoxy-6-nitro) benzenesulfonic acid hydrate)
ZOIZone of Inhibition

References

  1. Cordell, D.; White, S. Peak Phosphorus: Clarifying the key issues of a vigorous debate about long-term Phosphorus security. Sustainability 2011, 3, 2027–2049. [Google Scholar] [CrossRef]
  2. Al Rawashdeh, R. World peak potash: An analytical study. Resour. Policy 2020, 69, 101834. [Google Scholar] [CrossRef]
  3. EU 2019. Regulation (EU) 2019/1009 of the European Parliament and of the Council of 5 June 2019 Laying down Rules on the Making Available on the Market of EU Fertilising Products and Amending Regulations (EC) No 1069/2009 and (EC) No 1107/2009 and Repealing Regulation (EC) No 2003/2003. Available online: https://eur-lex.europa.eu/legal-content/EN/TXT/?uri=CELEX%3A32019R1009 (accessed on 13 June 2023).
  4. Mącik, M.; Gryta, A.; Frąc, M. Biofertilizers in agriculture: An overview on concepts, strategies and effects on soil microorganisms. Adv. Agron. 2020, 162, 31–87. [Google Scholar] [CrossRef]
  5. Chaney, R.L. Food safety issues for mineral and organic fertilizers. Adv. Agron. 2012, 117, 51–116. [Google Scholar] [CrossRef]
  6. Halpern, M.; Bar-Tal, A.; Ofek, M.; Minz, D.; Muller, T.; Yermiyahu, U. The use of biostimulants for enhancing nutrient uptake. Adv. Agron. 2015, 130, 141–174. [Google Scholar] [CrossRef]
  7. Ahuja, I.; Løes, A.-K. Effect of Fish Bones and Algae Fibre as Fertilisers for Ryegrass; Report, no. 7; Norwegian Centre for Organic Agriculture (NORSØK): Tingvoll, Norway, 2019; Volume 4, Available online: https://orgprints.org/id/eprint/36439/ (accessed on 22 June 2023).
  8. Moloșag, A.; Pârvulescu, O.C.; Ion, V.A.; Asănică, A.C.; Soane, R.; Moț, A.; Dobrin, A.; Frîncu, M.; Løes, A.-K.; Cabell, J.; et al. Effects of marine residue-derived fertilizers on strawberry growth, nutrient content, fruit yield and quality. Agronomy 2023, 13, 1221. [Google Scholar] [CrossRef]
  9. Matos, G.S.; Pereira, S.G.; Genisheva, Z.A.; Gomes, A.M.; Teixeira, J.A.; Rocha, C.M.R. Advances in extraction methods to recover added-value compounds from seaweeds: Sustainability and Functionality. Foods 2021, 10, 516. [Google Scholar] [CrossRef]
  10. Gibilisco, P.E.; Lancelotti, J.L.; Negrin, V.L.; Idaszkin, Y.L. Composting of seaweed waste: Evaluation on the growth of Sarcocornia perennis. J. Environ. Manag. 2020, 274, 111193. [Google Scholar] [CrossRef]
  11. El-Beltagi, H.S.; Mohamed, A.A.; Mohamed, H.I.; Ramadan, K.M.A.; Barqawi, A.A.; Mansour, A.T. Phytochemical and potential properties of peaweeds and their recent applications: A Review. Mar. Drugs 2022, 20, 342. [Google Scholar] [CrossRef]
  12. Hrólfsdóttir, A.Þ.; Arason, S.; Sveinsdóttir, H.I.; Gudjónsdóttir, M. Added value of Ascophyllum nodosum side stream utilization during seaweed meal processing. Mar. Drugs 2022, 20, 340. [Google Scholar] [CrossRef] [PubMed]
  13. Kim, H.-S.; Je, J.-G.; An, H.; Baek, K.; Lee, J.M.; Yim, M.-J.; Ko, S.-C.; Kim, J.-Y.; Oh, G.-W.; Kang, M.-C.; et al. Isolation and characterization of efficient active compounds using high-performance centrifugal partition chromatography (CPC) from anti-inflammatory activity fraction of Ecklonia maxima in South Africa. Mar. Drugs 2022, 20, 471. [Google Scholar] [CrossRef]
  14. Illera-Vives, M.; Labandeira, S.S.; Brito, L.M.; López-Fabal, A.; López-Mosquera, M.E. Evaluation of compost from seaweed and fish waste as a fertilizer for horticultural use. Sci. Hortic. 2015, 186, 101–107. [Google Scholar] [CrossRef]
  15. Ahuja, I.; Dauksas, E.; Remme, J.F.; Richardsen, R.; Løes, A.-K. Fish and fish waste-based fertilizers in organic farming—With status in Norway: A review. Waste Manag. 2020, 115, 95–112. [Google Scholar] [CrossRef] [PubMed]
  16. López-Mosquera, M.E.; Fernández-Lema, E.; Villares, R.; Corral, R.; Alonso, B.; Blanco, C. Composting fish waste and seaweed to produce a fertilizer for use in organic agriculture. Proc. Environ. Sci. 2011, 9, 113–117. [Google Scholar] [CrossRef]
  17. Løes, A.-K.; Ahuja, I.; de Boer, A.; Rittl, T. Fertilisation Effects of Marine-Derived Residual Materials on Agricultural Crops; Report, no. 13; Norwegian Centre for Organic Agriculture (NORSØK): Tingvoll, Norway, 2022; Volume 7, Available online: https://orgprints.org/id/eprint/45330/ (accessed on 22 June 2023).
  18. Løes, A.-K.; Grønmyr, F.; Pommeresche, R.; Rittl, T. Algae Fibre for Soil Improvement (FIMO); Report, no. 8; Norwegian Centre for Organic Agriculture (NORSØK): Tingvoll, Norway, 2022; Volume 7, Available online: https://orgprints.org/id/eprint/44040/ (accessed on 22 June 2023).
  19. Løes, A.-K. Benefits and challenges of marine-derived fertilisers. In Proceedings of the RELACS Webinar Series, Frick, Switzerland, March–April 2021; Norwegian Centre for Organic Agriculture (NORSØK): Tingvoll, Norway. Available online: https://orgprints.org/id/eprint/44770/ (accessed on 22 June 2023).
  20. Amino Acids in Feeds. Performic Acid Oxidation with Acid Hydrolysis-Sodium Metabisulfite Method, AOAC 1997 994.12. In Official Methods of Analysis of AOAC INTERNATIONAL, 21st ed.; AOAC INTERNATIONAL: Rockville, MD, USA, 2019; Method 994.12. [CrossRef]
  21. Mourtzinos, I.; Konteles, S.; Kalogeropoulos, N.; Karathanos, V.T. Thermal oxidation of vanillin affects its antioxidant and antimicrobial properties. Food Chem. 2009, 114, 791–797. [Google Scholar] [CrossRef]
  22. Wang, Y.; McGivern, D.R.; Cheng, L.; Li, G.; Lemon, S.M.; Niu, J.; Su, L.; Reszka-Blanco, N.J. Ribavirin contributes to hepatitis C Virus suppression by augmenting pDC activation and type 1 IFN Production. PLoS ONE 2015, 10, e0135232. [Google Scholar] [CrossRef]
  23. Chaveroux, C.; Bruhat, A.; Carraro, V.; Jousse, C.; Averous, J.; Maurin, A.C.; Parry, L.; Mesclon, F.; Muranishi, Y.; Cordelier, P.; et al. Regulating the expression of therapeutic transgenes by controlled intake of dietary essential amino acids. Nat. Biotechnol. 2016, 34, 746–751. [Google Scholar] [CrossRef] [PubMed]
  24. Martinotti, S.; Ranzato, E. Scratch wound healing assay. Methods Mol. Biol. 2020, 2109, 225–229. [Google Scholar] [CrossRef] [PubMed]
  25. Schneider, C.A.; Rasband, W.S.; Eliceiri, K.W. NIH Image to ImageJ: 25 years of image analysis. Nat. Methods 2012, 9, 671–675. [Google Scholar] [CrossRef]
  26. Gangidi, R.R.; Proctor, A.; Meullenet, J.F. Milled rice surface lipid measurement by diffuse reflectance fourier transform infrared spectroscopy (DRIFTS). J. Am. Oil. Chem. Soc. 2002, 79, 7–12. [Google Scholar] [CrossRef]
  27. Thomas, A.S.; Saravanakumar, R.; Gupta, P.V. Evaluation of cytotoxic activity of protein extracts from the leaves of morinda pubescens on human cancer cell lines. Rev. Bras. Farmacogn. 2017, 27, 99–104. [Google Scholar] [CrossRef]
  28. Yang, Y.; Zhang, M.; Alalawy, A.I.; Almutairi, F.M.; Al-Duais, M.A.; Wang, J.; Salama, E.S. Identification and characterization of marine seaweeds for biocompounds production. Environ. Technol. Innov. 2021, 24, 101848. [Google Scholar] [CrossRef]
  29. Yip, W.H.; Joe, L.S.; Mustapha, W.A.W.; Maskat, M.Y.; Said, M. Characterisation and stability of pigments extracted from sargassum binderi obtained from Semporna. Sabah. Sains Malays. 2014, 43, 1345–1354. [Google Scholar]
  30. Løes, A.-K.; Ahlin, J.P.; Ahuja, I.; Krogstad, T.; Smevoll, S.; Waag, H. Effects of formic acid preservation of fishbones on the extractability of ammonium lactate–acetate soluble calcium, phosphorus, magnesium, and potassium. Waste Biomass Valorization 2022, 13, 3547–3559. [Google Scholar] [CrossRef]
  31. Jönsson, M.; Allahgholi, L.; Sardari, R.R.R.; Hreggviðsson, G.O.; Karlsson, E.N. Extraction and modification of macroalgal polysaccharides for current and next-generation applications. Molecules 2020, 25, 930. [Google Scholar] [CrossRef] [PubMed]
  32. Ragunathan, V.; Pandurangan, J.; Ramakrishnan, T. Gas chromatography-mass spectrometry analysis of methanol extracts from marine red seaweed Gracilaria corticata. Pharmacogn. J. 2019, 11, 547–554. [Google Scholar] [CrossRef]
  33. Shobier, A.H.; Abdel Ghani, S.A.; Barakat, K.M. GC/MS spectroscopic approach and antifungal potential of bioactive extracts produced by marine macroalgae. Egypt. J. Aquat. Res. 2016, 42, 289–299. [Google Scholar] [CrossRef]
  34. Yamamoto, M.; Baldermann, S.; Yoshikawa, K.; Fujita, A.; Mase, N.; Watanabe, N. Determination of volatile compounds in four commercial samples of Japanese green algae using solid phase microextraction gas chromatography mass spectrometry. Sci. World J. 2014, 2014, 289780. [Google Scholar] [CrossRef]
  35. Machado, M.; Machado, S.; Pimentel, F.B.; Freitas, V.; Alves, R.C.; Oliveira, M.B.P.P. Amino acid profile and protein quality assessment of macroalgae produced in an integrated multi-trophic aquaculture system. Foods 2020, 9, 1382. [Google Scholar] [CrossRef]
  36. Lourenco, S.O.; Barbarino, E.; De-Paula, J.C.; Pereira, L.O.d.S.; Marquez, U.M.L. Amino acid composition, protein content and calculation of nitrogen-to-protein conversion factors for 19 tropical seaweeds. Phycol. Res. 2002, 50, 233–241. [Google Scholar] [CrossRef]
  37. Kauanova, S.; Urazbayev, A.; Vorobjev, I. The frequent sampling of wound scratch assay reveals the “opportunity” window for quantitative evaluation of cell motility-impeding Drugs. Front. Cell Dev. Biol. 2021, 9, 640972. [Google Scholar] [CrossRef]
  38. Savvas, D. Hydroponics: A modern technology supporting the application of integrated crop management in greenhouse. J. Food Agric. Environ. 2003, 1, 80–86. [Google Scholar]
  39. Sambo, P.; Nicoletto, C.; Giro, A.; Pii, Y.; Valentinuzzi, F.; Mimmo, T.; Lugli, P.; Orzes, G.; Mazzetto, F.; Astolfi, S.; et al. Hydroponic solutions for soilless production systems: Issues and opportunities in a smart agriculture perspective. Front. Plant Sci. 2019, 10, 923. [Google Scholar] [CrossRef] [PubMed]
  40. Lee, M.K.; van Iersel, M.W. Sodium chloride effects on growth, morphology, and physiology of Chrysanthemum (Chrysanthemum × morifolium). Hort Sci. Horts 2008, 43, 1888–1891. [Google Scholar] [CrossRef]
  41. Flowers, T.J.; Munns, R.; Colmer, T.D. Sodium chloride toxicity and the cellular basis of salt tolerance in halophytes. Ann. Bot. 2015, 115, 419–431. [Google Scholar] [CrossRef]
  42. Huang, Z.; Wang, C.; Feng, Q.; Liou, R.-M.; Lin, Y.-F.; Qiao, J.; Lu, Y.; Chang, Y. The mechanisms of sodium chloride stress mitigation by salt-tolerant plant growth promoting rhizobacteria in wheat. Agronomy 2022, 12, 543. [Google Scholar] [CrossRef]
  43. Malík, M.; Velechovský, J.; Praus, L.; Janatová, A.; Kahánková, Z.; Klouček, P.; Tlustoš, P. amino acid supplementation as a biostimulant in medical cannabis (Cannabis sativa L.) plant nutrition. Front. Plant Sci. 2022, 13, 868350. [Google Scholar] [CrossRef] [PubMed]
  44. Romero, L.C.; Ángeles Aroca, M.; Laureano-Marín, A.M.; Moreno, I.; García, I.; Gotor, C. Cysteine and cysteine-related signaling pathways in Arabidopsis thaliana. Molec. Plant 2014, 7, 264–276. [Google Scholar] [CrossRef]
  45. Haag, A.F.; Kerscher, B.; Dall’Angelo, S.; Sani, M.; Longhi, R.; Baloban, M.; Wilson, H.M.; Mergaert, P.; Zanda, M.; Ferguson, G.P. Role of cysteine residues and disulfide bonds in the activity of a legume root nodule-specific, cysteine rich peptide. J. Biol. Chem. 2012, 287, 10791–10798. [Google Scholar] [CrossRef]
  46. Richau, K.H.; Kaschani, F.; Verdoes, M.; Pansuriya, T.C.; Niessen, S.; Stuber, K.; Colby, T.; Overkleeft, H.S.; Bogyo, M.; Van der Hoorn, R.A. Subclassification and biochemical analysis of plant papain-like cysteine proteases displays subfamily-specific characteristics. Plant Physiol. 2012, 158, 1583–1599. [Google Scholar] [CrossRef] [PubMed]
  47. Madende, M.; Hayes, M. Fish by-product use as biostimulants: An overview of the current state of the art, including relevant legislation and regulations within the EU and USA. Molecules 2020, 25, 1122. [Google Scholar] [CrossRef]
  48. Parađiković, N.; Teklić, T.; Zeljković, S.; Lisjak, M.; Špoljarević, M. Biostimulants research in some horticultural plant species—A review. Food Energy Secur. 2019, 8, e00162. [Google Scholar] [CrossRef]
  49. Rouphael, Y.; Cardarelli, M.; Bonini, P.; Colla, G. Synergistic action of a microbial-based biostimulant and a plant derived-protein hydrolysate enhances lettuce tolerance to alkalinity and salinity. Front Plant Sci. 2017, 8, 131. [Google Scholar] [CrossRef] [PubMed]
  50. Beavers, W.N.; Monteith, A.J.; Amarnath, V.; Mernaugh, R.L.; Roberts, L.J., 2nd; Chazin, W.J.; Davies, S.S.; Skaar, E.P. Arachidonic acid kills staphylococcus aureus through a lipid peroxidation mechanism. mBio 2019, 10, e01333-19. [Google Scholar] [CrossRef]
  51. Herndon, J.L.; Peters, R.E.; Hofer, R.N.; Simmons, T.B.; Symes, S.J.; Giles, D.K. Exogenous polyunsaturated fatty acids (PUFAs) promote changes in growth, phospholipid composition, membrane permeability and virulence phenotypes in Escherichia coli. BMC Microbiol. 2020, 20, 305. [Google Scholar] [CrossRef]
  52. Jeon, W.B.; Park, B.H.; Choi, S.K.; Lee, K.M.; Park, J.K. Functional enhancement of neuronal cell behaviors and differentiation by elastin-mimetic recombinant protein presenting Arg-Gly-Asp peptides. BMC Biotechnol. 2012, 12, 61. [Google Scholar] [CrossRef] [PubMed]
  53. Feles, S.; Overath, C.; Reichardt, S.; Diegeler, S.; Schmitz, C.; Kronenberg, J.; Baumstark-Khan, C.; Hemmersbach, R.; Hellweg, C.E.; Liemersdorf, C. Streamlining culture conditions for the neuroblastoma cell line SH-SY5Y: A prerequisite for functional studies. Methods Protoc. 2022, 5, 58. [Google Scholar] [CrossRef] [PubMed]
  54. Lewis, D.C.; van der Zwan, T.; Richards, A.; Little, H.; Coaker, G.L.; Bostock, R.M. The oomycete microbe-associated molecular pattern, arachidonic acid, and an ascophyllum nodosum-derived plant biostimulant induce defense metabolome remodeling in tomato. Phytopathology 2023, 113, 1084–1092. [Google Scholar] [CrossRef]
Figure 1. FC-FID chromatograms for HNSW, LNSW, and GFB samples. Each chromatogram is of a different color, corresponding to each one of the three samples employed (HNSW, red; LNSW, blue; GFB, green).
Agronomy 13 02258 g001
Figure 2. Comparative GC–MS spectra for HNSW and LNSW samples in ethyl acetate (EA) and hexane (H) solvents.
Agronomy 13 02258 g002
Figure 3. Growth rate of (A) E. coli, and (B) S. aureus in in vitro liquid cell cultures exposed to ethyl acetate extracts. The experimental graphs (a) are depicted in different colors, (b) include all three types of samples employed (HNSW, LNSW, GFB), (c) reflect all DMSO concentrations used (1, 5, 10%), and (d) involve the appropriate controls (LB broth and antibiotics penicillin-streptomycin), as shown on the side of the Figure.
Agronomy 13 02258 g003aAgronomy 13 02258 g003b
Figure 4. In vitro cell viability in the presence of GFB-E-EA for 24, 48, and 72 h in (A) N2a58, and (B) SH-SY5Y neuronal cell cultures in a concentration-dependent fashion (with details provided in the text). Significance levels were assessed as follows: * p < 0.05 (significant), ** p < 0.01 (highly significant), and **** p ≤ 0.0001 (extremely significant) or non-significant (p > 0.05).
Agronomy 13 02258 g004aAgronomy 13 02258 g004b
Figure 5. Cell morphology studies of HNSW-E-EA, LNSW-E-EA, and GFB-E-EA in N2a58 neuronal cell cultures for 0, 24, 48, and 72 h, at the highest concentration of extracts investigated (HNSW-E-EA, 28.0 × 10² ngextract/g of dry HNSW/mL DMSO; LNSW-E-EA, 24.6 × 10² ngextract/g of dry LNSW/mL DMSO, and GFB-E-EA, 64.8 × 10² ngextract/g of dry GFB/mL DMSO).
Agronomy 13 02258 g005
Figure 6. Migration studies of HNSW-E-EA, LNSW-E-EA, and GFB-E-EA in SH-SY5Y neuronal cell cultures for 0, 24, 48, and 72 h, at the highest concentration of extracts investigated (HNSW-E-EA, 28.0 × 10² ngextract/g dry HNSW/mL DMSO; LNSW-E-EA, 24.6 × 10² ngextract/g dry LNSW/mL DMSO, and GFB-E-EA, 64.8 × 10² ngextract/g dry GFB/mL DMSO). Close ups of the provided experiments, provide tangible proof of the progress of cell migration during the investigation.
Agronomy 13 02258 g006
Table 1. Physical measurements and carbon–nitrogen composition of HNSW, LNSW, and GFB samples.
ParameterHNSWLNSWGFB
pH9.5 ± 0.210.3 ± 0.27.1 ± 0.2
EC (μS/cm)58,000 ± 217531,750 ± 11908500 ± 319
Total C (% w/w)12.1 ± 0.212.1 ± 0.27.9 ± 0.1
Total Organic C (% w/w)6.5 ± 0.16.2 ± 0.16.1 ± 0.1
Total Nitrogen (% w/w)0.42 ± 0.050.16 ± 0.022.05 ± 0.23
Dry matter (%)29.4 ± 1.528.8 ± 1.424.5 ± 1.2
Table 2. Distribution of nutrients (ICP-OES) and heavy metals (ICP-MS) in seaweed and fish samples.
Element (Concentration)HNSWLNSWGFB
Heavy metalsPb (mg/kg)<0.1<0.1<0.1
Cd (mg/kg)0.20 ± 0.020.30 ± 0.03<0.05
Ni (mg/kg)0.70 ± 0.121.5 ± 0.30.30 ± 0.05
Cr (mg/kg)1.2 ± 0.21.3 ± 0.20.6 ± 0.1
As (mg/kg)7.1 ± 1.04.5 ± 0.61.7 ± 0.2
NutrientsK (% w/w)2.35 ± 0.101.52 ± 0.090.22 ± 0.01
Ca (% w/w)1.05 ± 0.172.22 ± 0.372.06 ± 0.34
Mg (% w/w)0.55 ± 0.100.32 ± 0.060.05 ±0.01
Na (% w/w)0.45 ± 0.080.34 ± 0.060.27 ± 0.05
P (% w/w)0.07 ± 0.010.08 ± 0.021.20 ± 0.24
Fe (mg/kg)29.5 ± 6.628.3 ± 6.38.5 ± 1.9
Mn (mg/kg)13.2 ± 1.77.9 ± 1.0<0.5
Cu (mg/kg)1.3 ± 0.31.0 ± 0.2<1.0
Zn (mg/kg)21.5 ± 3.112.2 ± 1.812 ± 1.7
Se (mg/kg)<1.0<1.0<1.0
Si (mg/kg)215.8 ± 42.783.8 ± 16.663.7 ± 12.6
Al (mg/kg)37.4 ± 5.619.5 ± 2.93.6 ± 0.5
Co (mg/kg)<0.5<0.5<0.5
Mo (mg/kg)<0.5<0.5<0.5
B (mg/kg)43.1 ± 9.723.6 ± 5.310.1 ± 2.3
S (% w/w)0.31 ± 0.040.26 ± 0.040.16 ± 0.02
DMDry matter (%)29.4 ± 1.528.8 ± 1.424.5 ± 1.2
Table 3. Composition of seaweed samples before (HNSW and LNSW) and after leaching (HNSW-L and LNSW-L).
ParameterHNSW
Dry Basis
HNSW-L
Dry Basis
LNSW
Dry Basis
LNSW-L
Dry Basis
EC (μS/cm)76,243 ± 28591940 ± 73143,389 ± 53771720 ± 65
K (% w/w)8.16 ± 0.472.78 ± 0.165.17 ± 0.301.60 ± 0.09
Ca (% w/w)4.11 ± 0.643.65 ± 0.609.16 ± 1.517.55 ± 1.25
Mg (% w/w)1.91 ± 0.362.23 ± 0.421.09 ± 0.210.97 ± 0.18
Na (% w/w)1.56 ± 0.270.60 ± 0.111.16 ± 0.200.41 ± 0.07
P (% w/w)0.24 ± 0.050.24 ± 0.050.27 ± 0.050.27 ± 0.05
Fe (mg/kg)102.4 ± 22.979.5 ± 17.896.3 ± 21.675.2 ± 16.8
Mn (mg/kg)45.8 ± 6.052.0 ± 6.826.9 ± 3.529.9 ± 3.9
Cu (mg/kg)4.5 ± 1.14.2 ± 1.03.4 ± 0.83.4 ± 0.8
Zn (mg/kg)74.7 ± 10.879.9 ± 11.541.5 ± 6.040.0 ± 5.8
Total C (% w/w)42.0 ± 0.639.9 ± 0.641.2 ± 0.637.2 ± 0.5
Total N (% w/w)1.46 ± 0.161.34 ± 0.150.54 ± 0.060.44 ± 0.05
Table 4. Amino acid content of LNSW, HNSW, and GFB samples in mg/g.
NoAmino AcidHNSWLNSWGFB
1His0.18 ± 0.010.04 ± 0.015.74 ± 0.79
2Ser0.55 ± 0.040.06 ± 0.0032.77 ± 3.61
3Arg0.35 ± 0.010.04 ± 0.0044.35 ± 4.85
4Gly2.86 ± 0.020.73 ± 0.0273.55 ± 8.14
5Asp3.58 ± 0.040.94 ± 0.0356.26 ± 7.83
6Glu5.96 ± 0.041.28 ± 0.0484.52 ± 10.64
7Thr0.60 ± 0.000.07 ± 0.0025.27 ± 3.00
8Ala3.59 ± 0.031.02 ± 0.0648.68 ± 5.70
9Pro1.86 ± 0.010.48 ± 0.0239.38 ± 4.64
10Cys--2.04 ± 0.23
11Lys1.70 ± 0.040.45 ± 0.0451.71 ± 3.70
12Tyr1.51 ± 0.090.41 ± 0.0126.77 ± 2.26
13Met0.71 ± 0.010.15 ± 0.0117.04 ± 1.77
14Val2.50 ± 0.020.63 ± 0.0325.29 ± 3.20
15ILe1.88 ± 0.020.38 ± 0.0220.88 ± 2.81
16Leu3.77 ± 0.010.91 ± 0.0439.71 ± 4.95
17Phe2.28 ± 0.040.59 ± 0.0322.07 ± 2.43
Table 5. ZOI values (mm) of HNSW and LNSW extracts from ethyl acetate, and the negative control (penicillin-streptomycin) in E. coli and S. aureus solid agar cultures.
ExtractControlHNSW-E-EALNSW-E-EA
Species 16%80%100%80%100%
E. coli27.0n.e.z.n.e.z.
28.0n.e.z.n.e.z.
27.0n.e.z.n.e.z.
28.0n.e.z.n.e.z.
28.0n.e.z.n.e.z.
Average 27.6 n.c.v.n.c.v.
SD 0.5 n.c.v.n.c.v.
S. aureus15.09.011.015.09.0
16.010.012.016.010.0
16.010.011.016.010.0
15.08.012.015.08.0
16.09.010.016.09.0
Average 15.6 9.3 11.2 15.6 9.3
SD 0.5 0.8 0.8 0.5 0.8
GFB-E-EA, DMSO 80–100% and LB broth (positive control) show no ZOI. n.e.z: no evaluable zone. n.c.v: no calculated value.
Table 6. Migration speed of SH-SY5Y cells in the presence of the extracts studied.
Concentration
(ngextract/g Dry Material/mL DMSO)
Migration Speed (mm/h)
Control0.01130 ± 0.001
0.1% DMSO0.00881 ± 0.002
HNSW-E-EA28.0 × 1020.00797 ± 0.001
28.00.01100 ± 0.001
28.0 × 10−20.00898 ± 0.001
LNSW-E-EA24.6 × 1020.00839± 0.001
24.60.01190 ± 0.001
24.6 × 10−20.00881 ± 0.002
GFB-E-EA64.8 × 1020.00840 ± 0.001
64.80.00750 ± 0.001
64.8 × 10−20.01250 ± 0.002
Disclaimer/Publisher’s Note: The statements, opinions and data contained in all publications are solely those of the individual author(s) and contributor(s) and not of MDPI and/or the editor(s). MDPI and/or the editor(s) disclaim responsibility for any injury to people or property resulting from any ideas, methods, instructions or products referred to in the content.

