Article

Assessment of Sowing Density Impact on Water Front Advancement and Infiltration in Furrow Irrigation

1
National Research Institute for Rural Engineering, Water and Forestry, INRGREF, University of Carthage, Tunis 2080, Tunisia
2
Ministry of Agriculture, Water Resources and Fisheries, Tunis 1002, Tunisia
3
National Agronomic Institute of Tunisia (INAT), University of Carthage, Tunis 1082, Tunisia
*
Author to whom correspondence should be addressed.
Agronomy 2023, 13(8), 2080; https://doi.org/10.3390/agronomy13082080
Submission received: 11 May 2023 / Revised: 12 June 2023 / Accepted: 15 June 2023 / Published: 7 August 2023
(This article belongs to the Section Water Use and Irrigation)

Abstract

:
This research aims to evaluate the impact of durum-wheat sowing density on wetting front advancement and water infiltration rate along the furrow length. In addition, durum wheat yield and furrow irrigation performance under the different sowing densities were assessed. For that purpose, a field experiment was conducted under semi-arid conditions in Tunisia using four durum-wheat sowing densities: SD1 (250 seeds m−2), SD2 (350 seeds m−2), SD3 (450 seeds m−2) and SD0 (bare soil). The results reveal that water front advancement tends to be inversely proportional to sowing density. In fact, under the SD3 treatment, both irrigation duration and applied water volume increased about twofold compared to those recorded under SD0, resulting in an increasing soil infiltration rate. Furthermore, the two-point method performed well in estimating water front advancement, with an R2 value close to 1. Regarding durum wheat yield, values varied between 3.5 and 4.9 t ha−1 with the highest value attributed to the SD3 treatment. Meanwhile, higher irrigation water productivity was recorded under SD1. Considering irrigation performance indicators, the results indicate that distribution uniformity (DU) increases with increasing sowing density. Moreover, the lowest application efficiency values (75%) were recorded under the SD0 and SD3 treatments as compared to 82% for SD2 and 80% for SD1.

1. Introduction

In recent years, water resource managers have confronted difficulties in satisfying the increased water needs of semi-arid regions. More rational agricultural water use is necessary to maintain agricultural production, especially in regions where irrigation practices and systems are generally inefficient. Water-saving irrigation technologies, including sprinkler irrigation and drip irrigation, are frequently used to address the issue of water scarcity. However, the cost of modern irrigation systems is quite high for small farmers, which limits their promotion and use. Therefore, the need for appropriate agricultural methods and reasonably inexpensive, effective irrigation techniques is critical [1].
Irrigated agriculture in Tunisia is characterized by limited and declining water availability for which it faces competitive demand with other sectors. Thus, the agro-economic beneficial use of each cubic meter of water and the control of irrigation techniques are major objectives because the sustainability of agricultural production systems depends on the efficient use of water and the profitability of hydro-agricultural investments. Modernization of irrigated areas has been implemented, since 1995, in the framework of the national program for water conservation in irrigation, resulting in an increase in areas equipped with modern irrigation systems (drip irrigation, sprinkler and improved surface irrigation). In 2020, about 413,000 ha, 94% of the total irrigated area, was equipped with water-saving irrigation systems [2]. These areas are divided as follows: 23% with improved surface irrigation systems, 27% with sprinkler irrigation systems and 50% with drip irrigation systems. Despite these water conservation efforts, irrigation water use efficiency remains low as a result of water loss. Losses in supply and distribution networks are estimated to be 40% for irrigation networks [2].
Surface irrigation is the most commonly adopted irrigation method worldwide because of its low cost and energy consumption in comparison with pressurized irrigation systems [3]. Nevertheless, surface irrigation presents some limits such as low irrigation efficiency, poor distribution uniformity and high deep percolation. These limits induce a significant decrease in the surface irrigation’s extent, particularly in water-scarce regions [4]. According to Gillies et al. [5], these limits can be overcome by adopting optimal management methods and appropriate models that can be calibrated using field measurement data (inflow, furrow cross-section, slope and field length, etc.).
Furrow irrigation, as one surface irrigation method, remains a relevant irrigation system in Mediterranean regions [4]. Therefore, improving its efficiency is recommended for better water resources management [6]. The design, management and evaluation of furrow irrigation depend on how well infiltration characteristics are identified. In this context, knowledge of soil infiltration parameters is highly required because their variations could affect the hydraulic behavior of furrow irrigation. It is worth mentioning that infiltration characteristics might vary with soil and hydraulic properties (inflow, furrow cross-section, field slope and length and initial and boundary conditions).
Clemmens et al. [7] indicated that the performance of irrigation is linked to on-farm water management and to the irrigation system. The performance of surface irrigation is determined by soil infiltration, soil heterogeneity, land leveling, border or furrow length, field slope and inlet discharge [8,9]. Ignoring these factors would result in excessive water consumption and water losses.
The importance of soil water infiltration has been emphasized in many disciplines, including hydrologic studies, hydrogeology, drainage systems, agricultural water management and irrigation system design and modeling [10,11]. In particular, infiltration processes have received considerable attention in surface irrigation modeling studies [12]. Under surface irrigation, infiltration characteristics vary depending on the adopted surface irrigation method (e.g., basin, border or furrow irrigation), physical properties of the soil (texture and bulk density), soil moisture and vegetation cover [13]. In fact, vegetation cover improves water infiltration, limiting surface runoff.
Regarding the impact of plant density on yield and irrigation performance, Bahú Ben et al. [14] reported that specific densities of plants maximized the yield of maize at each irrigation level, demonstrating that the choice of plant density is a critical variable in the second crop of maize and significantly influences the components of production.
To evaluate the impacts of various drip irrigation rates and plant population densities on corn production and irrigation water use efficiency, El-Hendawy et al. [15] demonstrated that a high irrigation rate with a low or medium plant population density or a medium irrigation rate with a low plant population density are recommended for drip-irrigated corn in sandy soil. In addition, Karimi and Gomrokchi [16] studied the effect of irrigation method and plant density on water use efficiency and yield of corn crop. According to a variance analysis of grain yield data, the authors found that both planting pattern and the interaction of planting pattern and crop density significantly affected the yields. Furthermore, Sani et al. [17] investigated the effect of irrigation and plant density on the growth, yield and water use efficiency of early maize in the Nigerian savanna. Their results show that the highest plant population density resulted in better water use efficiency (25% less water used than other populations). Thus, the water use efficiency of maize was changed through the manipulation of plant population density. According to Holzapfel et al. [18], when surface irrigation is adopted, the infiltration process could affect the wetting front advance and recession phase after the time of cut-off. Meanwhile, with pressurized irrigation methods, the infiltration process affects the rate of water application [12].
Few studies dealing with wheat sowing density and irrigation performance are available in the literature. Van den Boogaard et al. [19] investigated the impact of different sowing densities and wheat cultivars on yield and water use efficiency in a Mediterranean environment. They revealed that the water was used more efficiently for biomass production and equally efficiently for grain production under irrigation compared to rainfed conditions. Zhang et al. [20] compared the effect of two irrigation regimes on the water use efficiency of winter wheat. The results showed that although the grain yield with the lower applied water volume was reduced, the water use efficiency for total water consumption increased.
Accurate assessment of infiltration is considered complex because of the spatial and temporal variability of the infiltration process [21]. In addition, its determination via field measurements is time-consuming and demanding in terms of skilled users [22]. Thus, a wide range of models have been proposed in the literature for the estimation of the infiltration rate [23], which can be classified into empirical and physically based models. Commonly, empirical models, such as the Kostiakov–Lewis model, have been adopted and recommended by the scientific community for estimating soil water infiltration [12,24,25,26,27].
Numerous studies have been conducted to assess the suitability of empirical models for estimating the infiltration rate under different surface soil conditions and soil water content. In this context, Seyedzadeh et al. [28] evaluated the different conditions for obtaining the parameters of the Kostiakov–Lewis equation using the two-point method and determined its validity range. Maghferati et al. [29] compared five methods of calculating water advance, among them Elliot and Walker (1982), Shepard et al. (1993), Valiantzas et al. (2001), Mailapalli et al. (2008) and Modified Mailapalli (Vatankhah et al., 2010) for furrows’ different soil textures. Maghferati et al. highlighted that Elliot and Walker’s (1982) and Vatankhah et al.’s (2010) methods showed the best results regarding furrow irrigation. However, limited studies have been undertaken to determine soil water infiltration parameters under different soil canopy cover rates. Therefore, the main objective of this paper is to assess the effect of durum-wheat sowing density on wetting front advance, the infiltration process, crop yield and furrow irrigation performance.

2. Materials and Methods

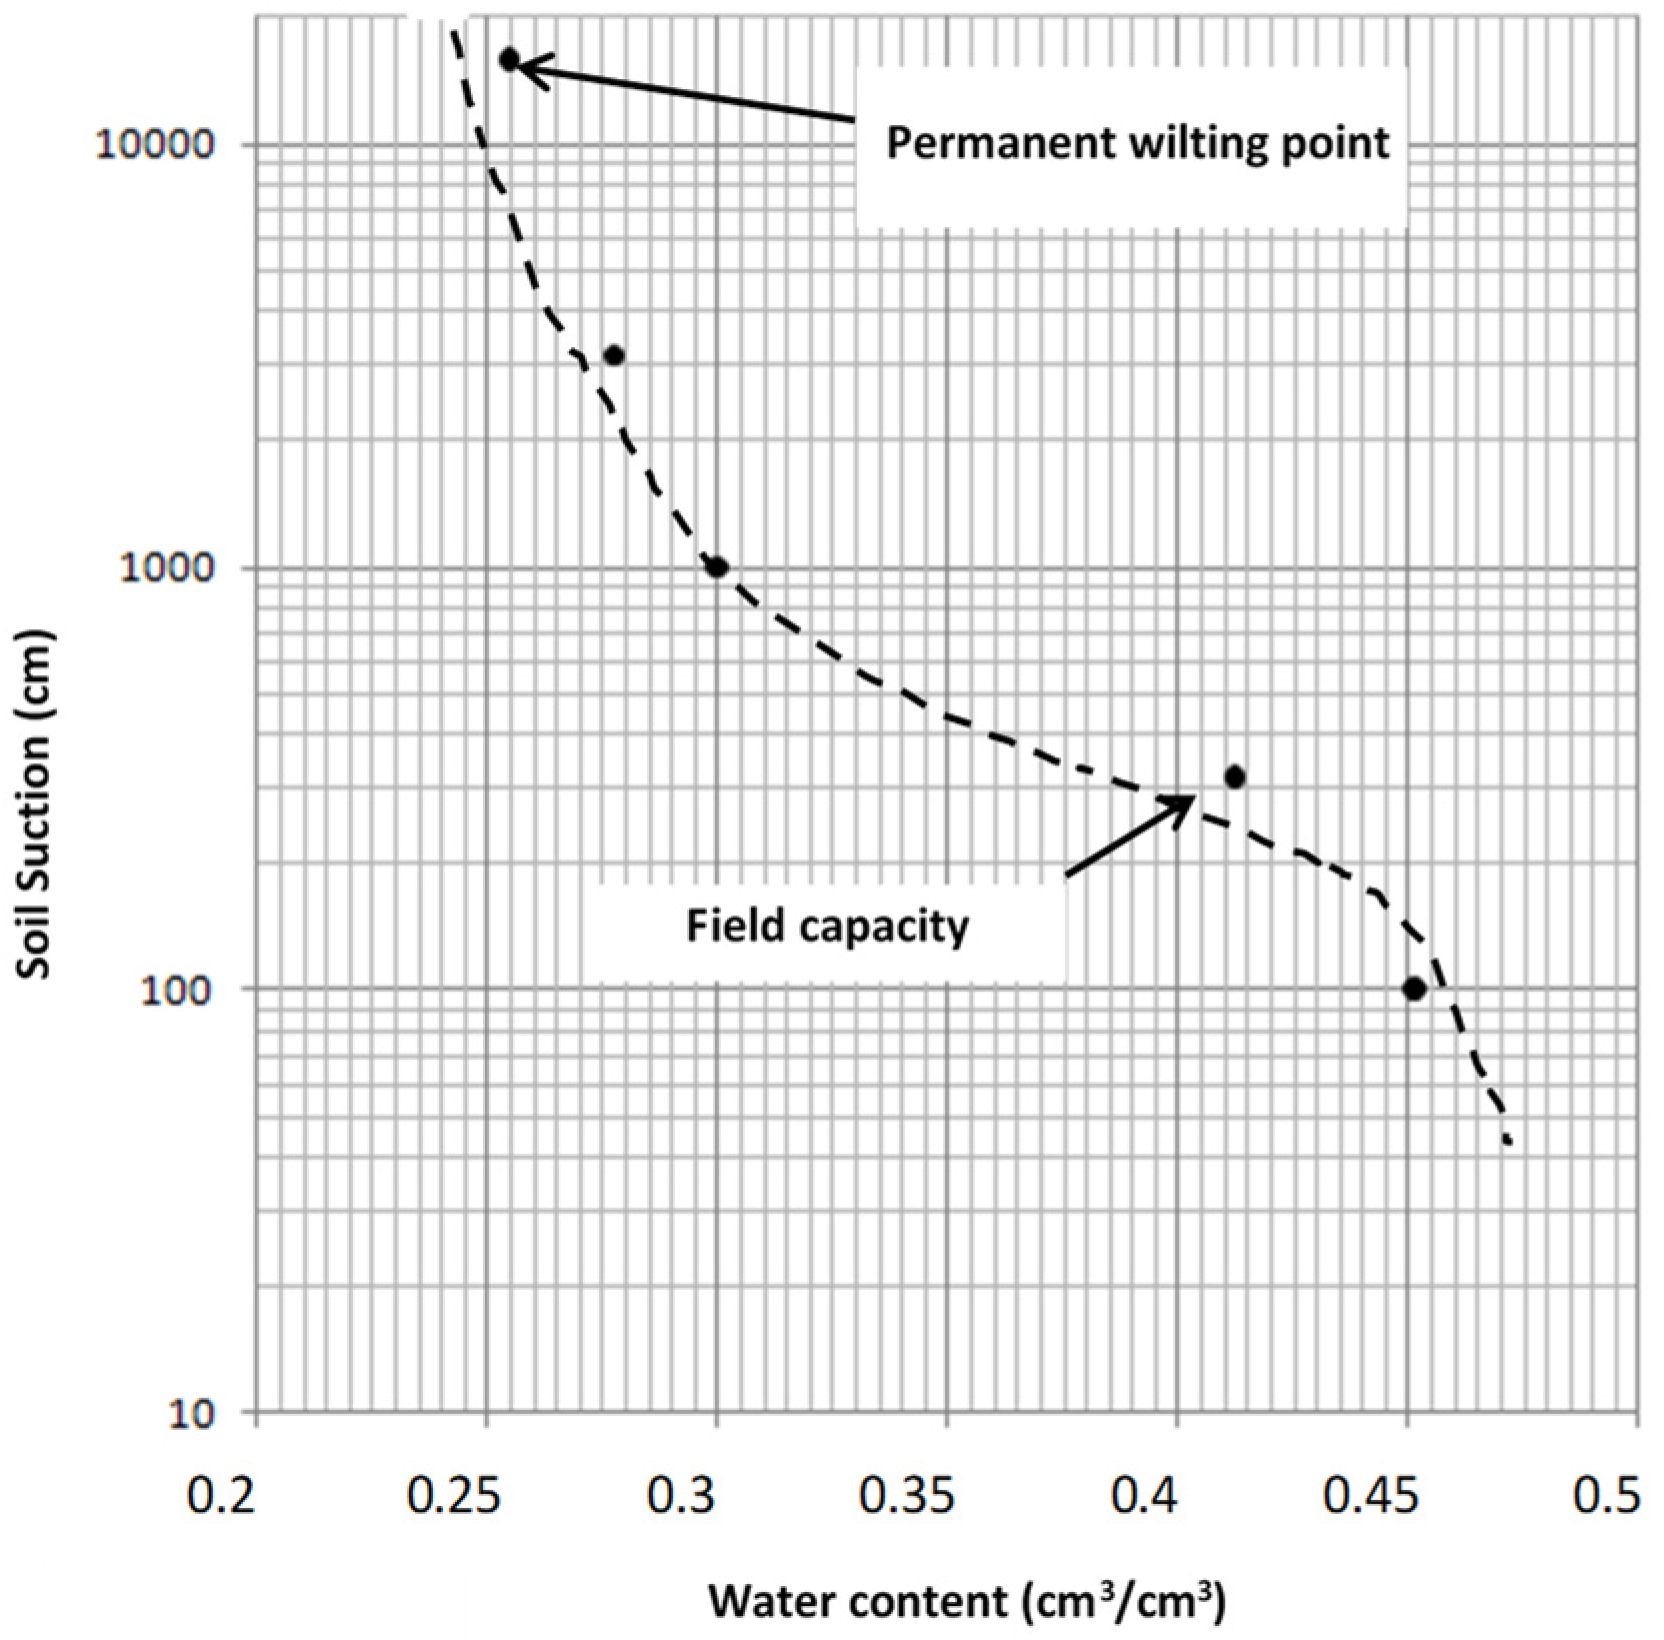
2.1. Theoretical Background

Cumulative infiltration I(t) is defined as the total amount of infiltrated water across the top surface of soil in a given time period t [30], and it can be determined as follows with Equation (1):
I t = t = t 0 t i t d t
where i(t) (mm h−1) is infiltration rate at time t.
Under surface irrigation, the time period during which the infiltration process can occur at a given point along the furrow length corresponds to the infiltration opportunity time. This is later expressed as the difference between water recession and advance times at the same point [31].
Under furrow irrigation, both water advance velocity and infiltration rate depend on the furrow cross-sectional shape and length, irrigation unit flow and soil roughness. Within this case study, soil roughness is closely related to soil tillage such as the opening of furrows after sowing and sowing density.

Two-Point Method

The two-point method [32] is one of the widely used methods for estimating infiltration characteristics from surface irrigation evaluation data and mass balance. It consists of a simple application of the volume balance approach, which assumes that at any time during the advance phase of an irrigation event, the applied water volume is equal to the sum of the stored water volume on the surface and the infiltrated volume at that time, as shown in Equation (2):
Q 0 t = σ y A 0 x + 0 x I t x t s   d s
where Q0 (m3 min−1) is the inflow in the furrow; t (min) is the time interval of the irrigation event; x (m) is the distance reached by the wetting front in time t; A0 (m2) is the cross-sectional area of the furrow upstream; σy is the surface storage shape factor (σy is equal to 0.77) [33,34] and I (m3 m−1) is the cumulative infiltrated volume per length unit of furrow.
The above-mentioned method uses only two points on the advance curve, usually at the mid-distance and downstream of the furrow. Despite its simplicity, the application of the two-point method requires preliminary knowledge of the basic infiltration rate f0 [34,35,36,37]. It is worth mentioning that the two-point method is based on the modified Kostiakov equation. Applying the volume balance equation to the advance data enables us to obtain three equations for estimating the infiltration function parameters a and k [38]:
Q 0 t = σ y A 0 x + σ z k t a   x + f 0 t x 1 + r
a = L n   ( Q 0 t 1 x 1 σ y A 0 f 0 t 1 1 + r ) L n   ( Q 0 t 2 x 2 σ y A 0 f 0 t 2 1 + r ) L n   ( t 1 / t 2 )
k = Q 0 t 1 x 1 σ y A 0 f 0 t 1 1 + r σ z   t 1 a
where t1 and t2 are the time (min) required for the wetting front advance to reach the mid-distance of the furrow and the downstream, respectively. Further, σz is the sub-surface shape factor for the model furrow, estimated as follows:
σ z = a + r   1 a + 1 1 + a 1 + r
where r is the power of the advance curve equation. It can be estimated from the two advance points with linear regression and a simple logarithmic transformation of the following function:
x = p   t r

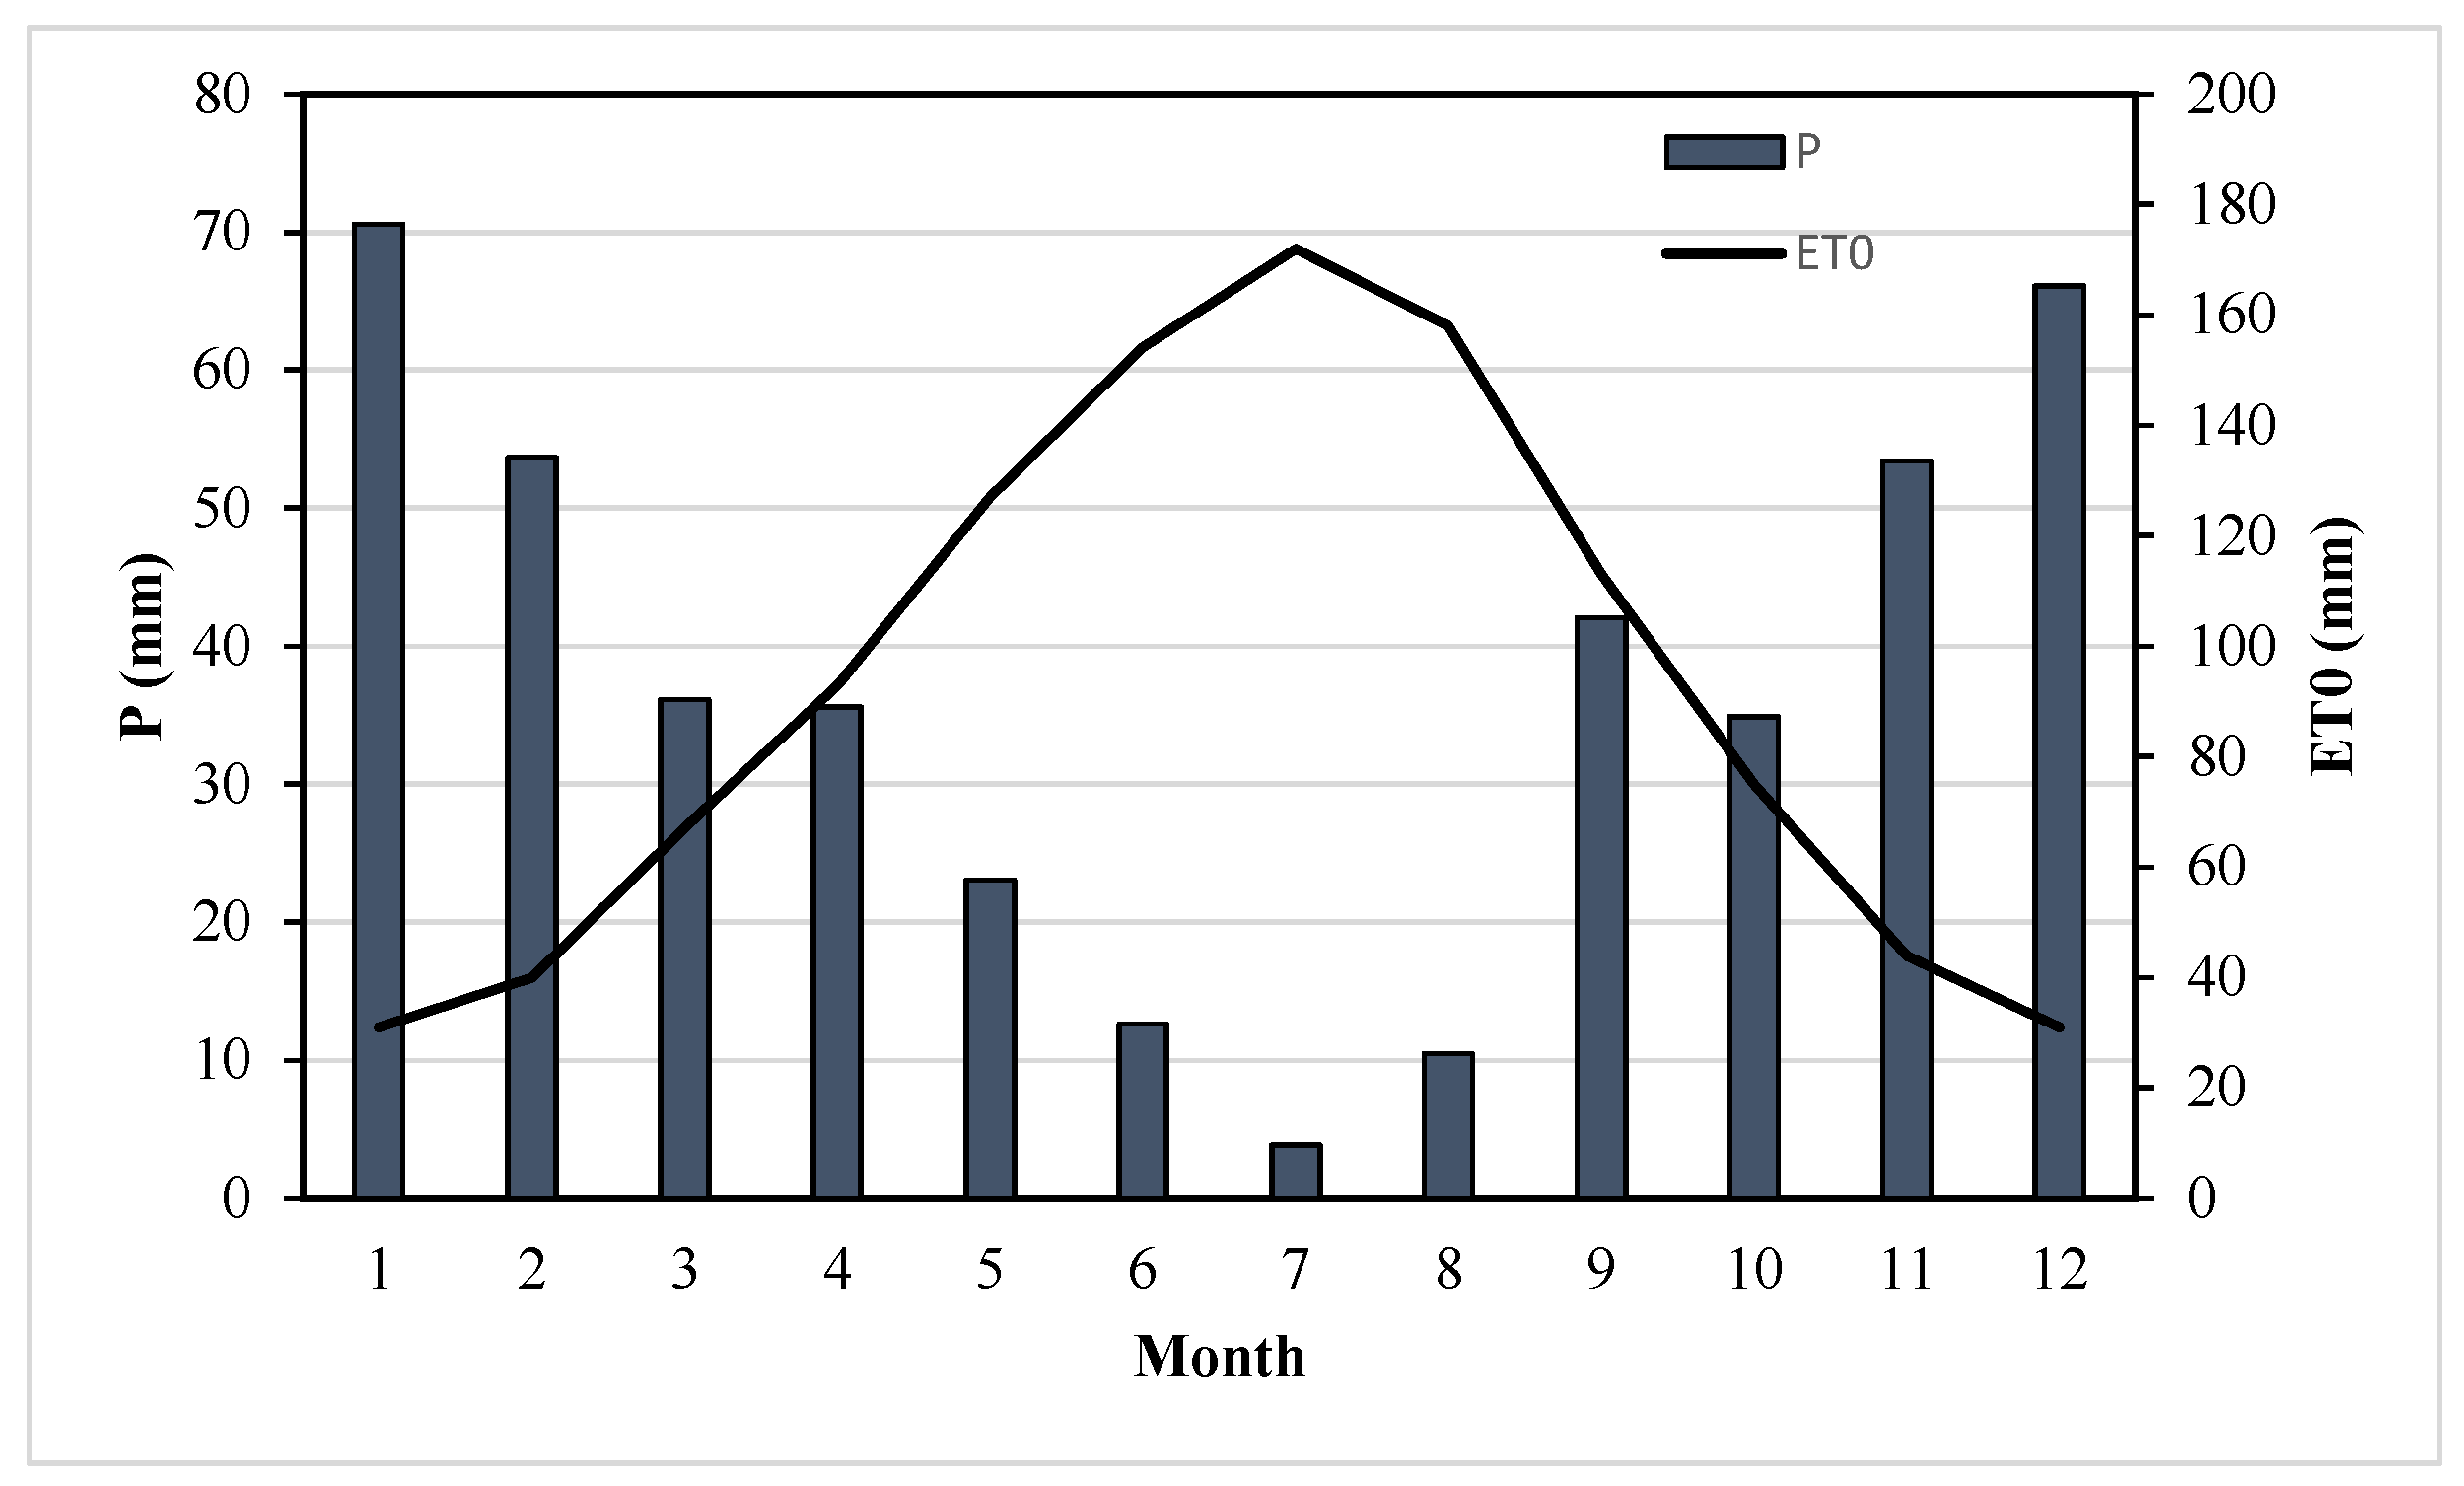
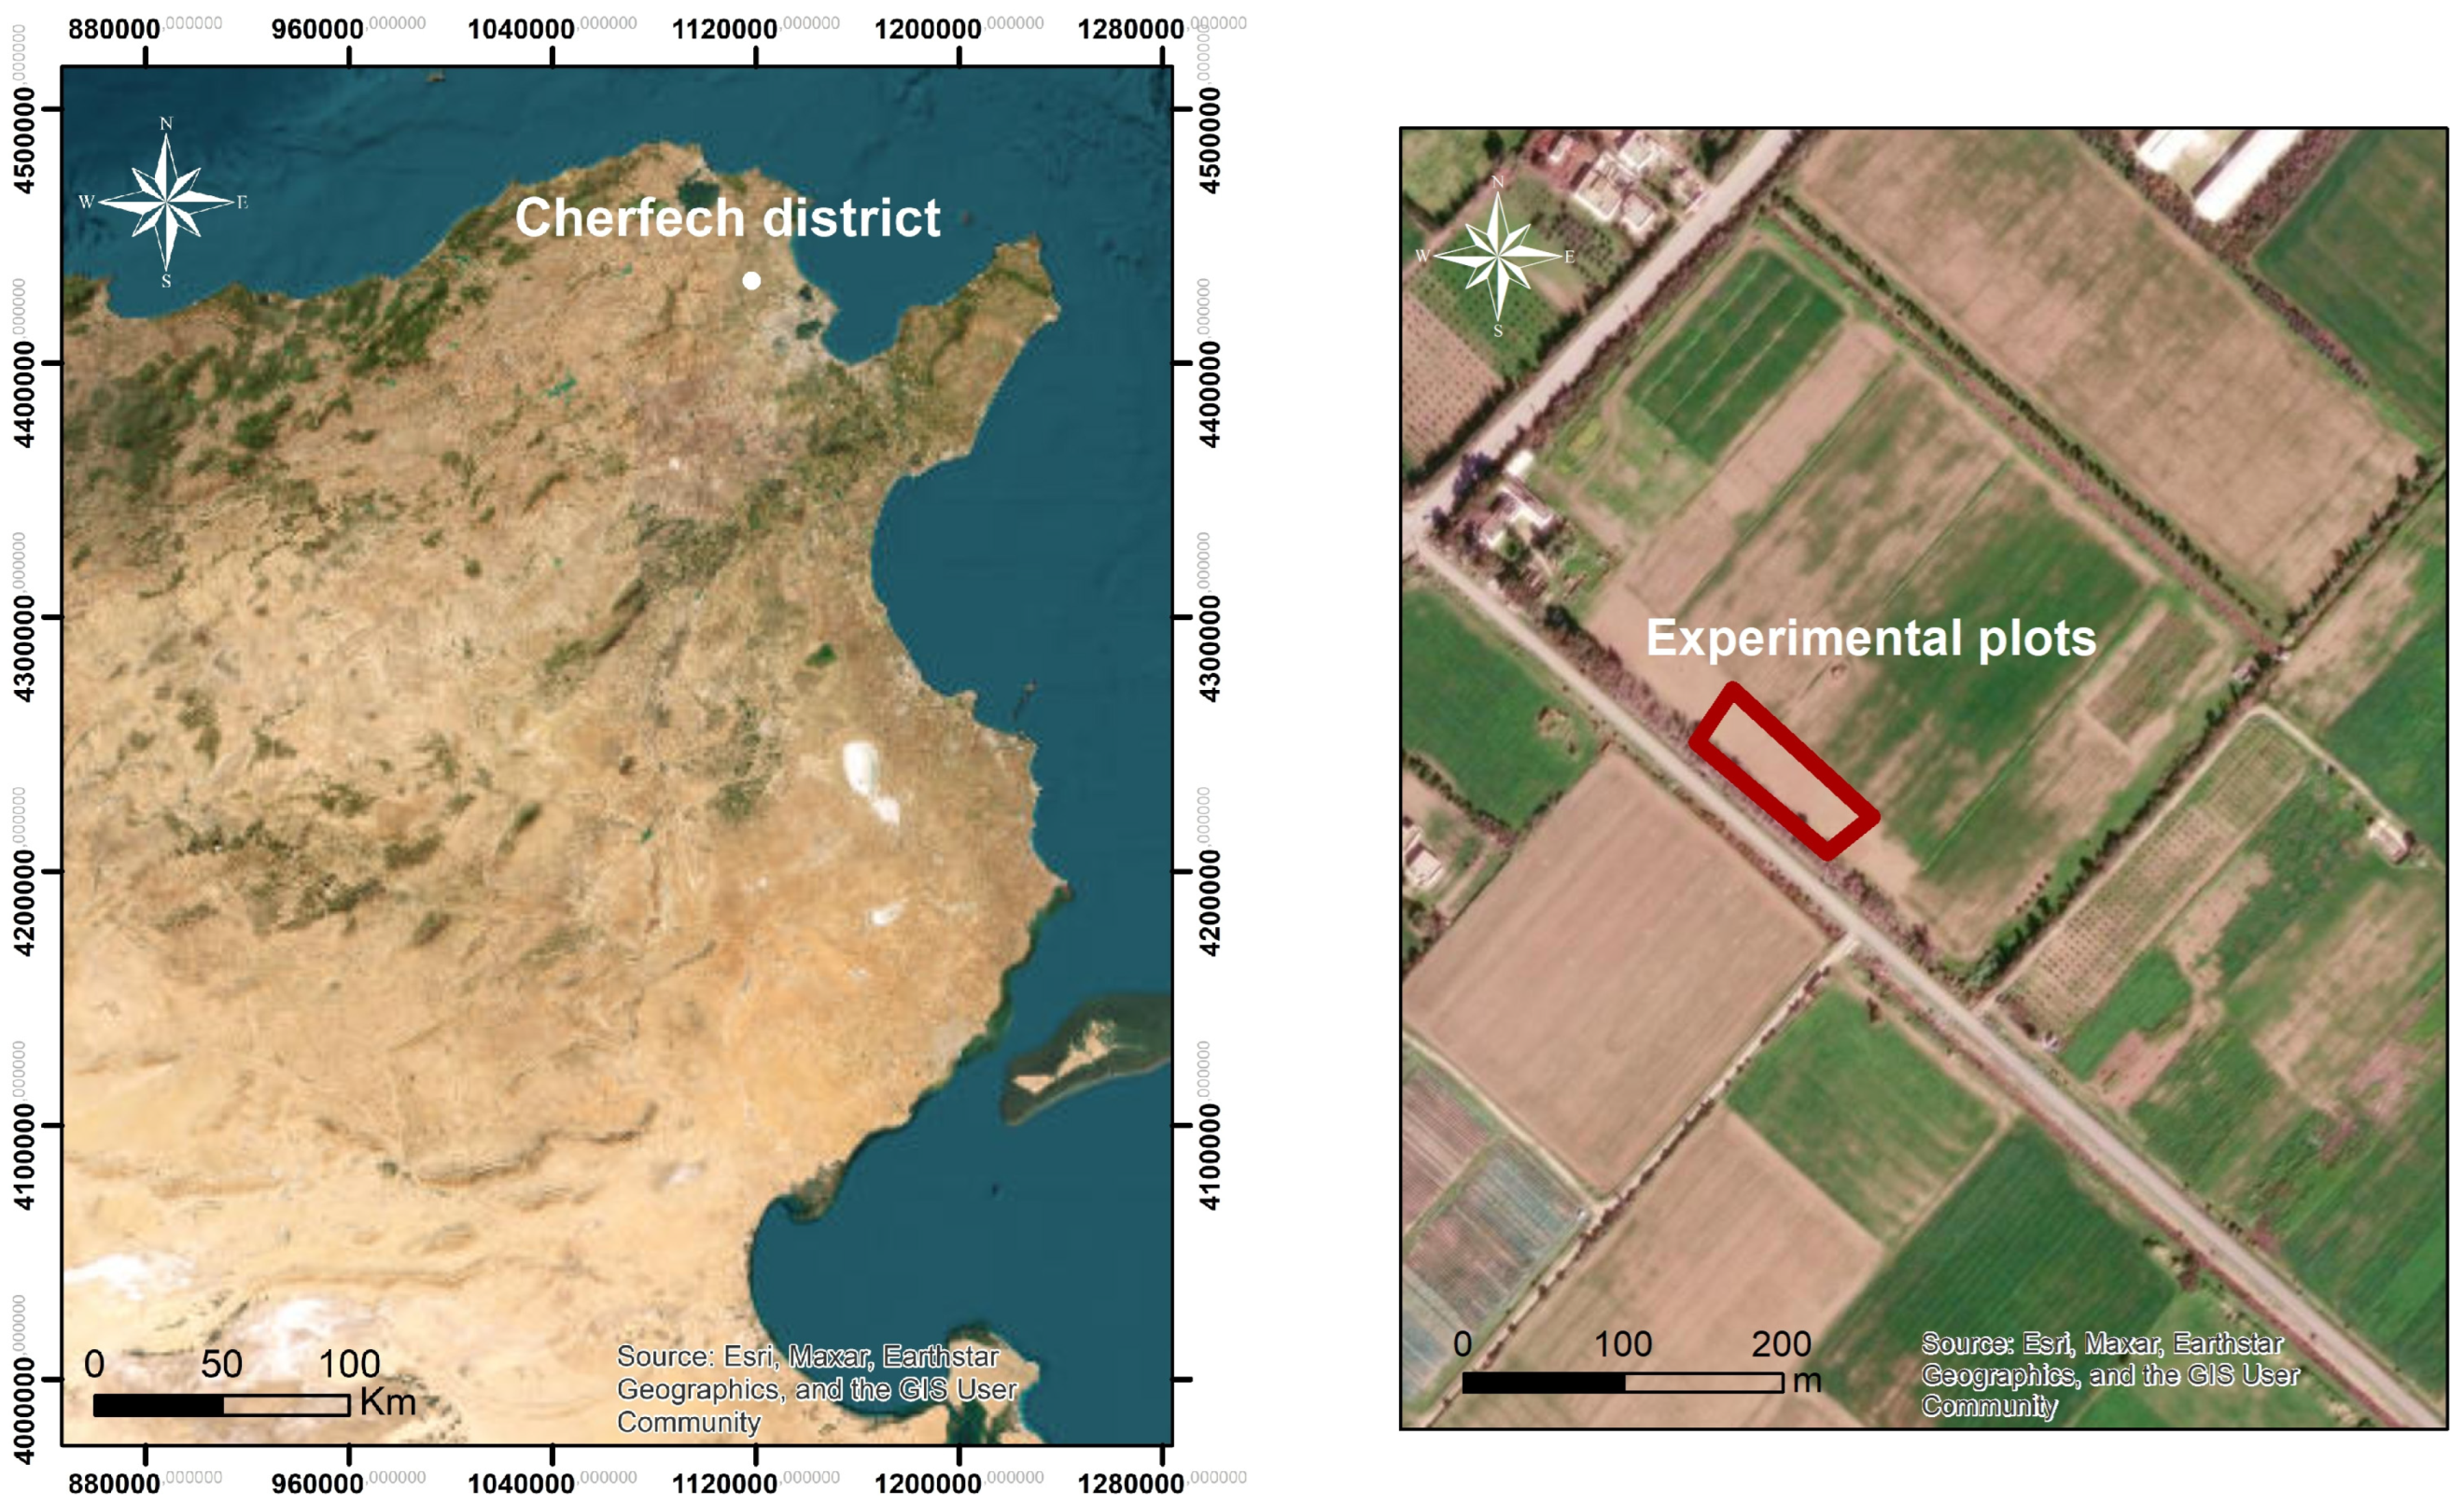
2.2. Site Description, Experimental Design and Irrigation Management

The field experiment was conducted at the experimental station of the National Research Institute for Rural Engineering, Water and Forestry (INRGREF) of Cherfech, located 20 km north of Tunis in the low valley of the Medjerda River (Lat. 37.1° N; Long. 10.5° E, Alt. 328 m a.s.l) (Figure 1).
The study area is characterized by a Mediterranean semi-arid climate. Mean monthly values of minimum (Tmin) and maximum (Tmax) air temperature and wind speed (WS) of the study area are summarized in Table 1.
Minimum and maximum air temperatures vary between 6 and 19 °C and between 15.7 and 33.5 °C, respectively. Highest values were recorded during the summer season (June–August) and lowest values were recorded in the winter season (December–February). Therefore, the climate is characterized by relatively mild winters and hot, dry summers.
Figure 2 shows the evolution of monthly precipitation and reference evapotranspiration estimated using the FAO-56 Penman–Monteith model. Average annual precipitation is equal to 440 mm year−1, unevenly distributed in time. Annual reference evapotranspiration is about 1110 mm. As is shown in Figure 2, the average monthly precipitation is concentrated from September to February with a maximum value of about 70 mm in January. July presents the lowest value of precipitation (5 mm). Climate water deficit (P-ET0 < 0) in the region starts in March and ends in October.
Table 2 summarizes the values of soil water content at field capacity (θfc) and permanent wilting point (θpwp) at each 20 cm depth (0–20 cm, 20–40 cm, 40–60 cm, 60–80 cm and 80–100 cm) of the investigated soil profile (1 m).
Soil water content at field capacity varies between 38.6 to 44.8%, showing an average value of 42.04%. Soil water content at wilting point for most of the horizons is close to 26%. According to the USDA classification, the soil is clay loam (clay: 28%; loam: 49%).
Figure 3 shows the values of matric potential versus the volumetric soil water content in the investigated soil. The experimental values were fitted using the van Genuchten model, whose parameters were estimated with the non-linear fitting software SWRC-Fit.
Soil water content at field capacity and at permanent wilting point are 420 and 260 mm m−1. The available water is equal to 160 mm m−1 [33]. The maximum root depth exceeds 120 cm.
The experimental field (0.45 ha) was divided into 4 equal plots in which durum wheat was sown. The treatment variation was based on the sowing density. The 4 treatments are as follows: SD1 with 250 seeds m−2 (nearly 70% of SD2 density), SD2 with 350 seeds m−2, SD3 with 450 seeds m−2 (nearly 130% of SD2 density) and SD0 (bare soil: control treatment). It is worth mentioning that for the SD2 treatment, 350 seeds m−2 represents the recommended sowing density for the northern region of Tunisia [39].
Irrigation water was provided from the Laroussia dam. It is characterized by an electrical conductivity of ECw= 2.5 dS m−1 which can be used in soils of good permeability and indicates that a special leaching is required. In addition, used irrigation water has a sodium adsorption ratio (SAR) value equal to 7.5 which can be classified as excellent.
Irrigation was applied using furrow irrigation method with blocked-end boundary. Each plot consisted of 10 trapezoidal-shaped furrows 100 m long with 0.75 m spacing. Furrows were characterized by a longitudinal slope equal to 0.2% with minimal cross slope. The experimental plots were irrigated on the same day. Irrigation was shut off once the wetting front advanced a distance of 95 m (95% of furrow length).
Regarding irrigation application amounts, treatments SD1, SD2 and SD3 received an irrigation volume per time equal to the crop evapotranspiration of the previous days as estimated using the FAO crop coefficient approach. EVAPOT model was used to compute reference evapotranspiration, ET0, according to the Penman–Monteith equation. Durum wheat Kc values were estimated using the KcISA model [40]. Cumulative crop water requirement, ETc, over the growing season was equal to 450 mm. Regarding SD0 treatment, irrigation depth was determined on the basis of wetting front advance and infiltration characteristics.
For the first irrigation event, a flow rate of 2 l/s/furrow was adopted. Thereafter, irrigation water was applied with a flow rate equal to 1 l/s/furrow. These values were adopted on the basis of results achieved from previous trials conducted at the experimental station of Cherfech in order to study the effect of the flow rate on the infiltration and advancement of water [26,41].

2.3. Field Measurements

For each treatment, particularly in the middle furrow, the advancing front was measured at each 10 m length. These data were used to simulate the infiltration equations for each treatment separately. Measurements were performed between the second and the third irrigation events. In fact, previous studies have shown that roughness, geometry and soil compaction remain invariant starting from the second irrigation event [26,42].
In addition, soil water content was measured gravimetrically before and after irrigation events. Samples were taken in the 0–150 cm layer. Soil water content data associated with advance and recession wetting-front measurements, infiltration rate, head flow rate, irrigation depth and irrigation duration were used to assess the performance of the furrow irrigation system under each treatment using two indices: application efficiency, Ea (%), and distribution uniformity, DU (%) [43]. Their equations are as follows:
E a ( % ) = V W R Z V a × 100
where VWRZ (m3) is volume of water stored in the root zone and Va (m3) is volume of water applied to the field; and
D U ( % ) = Z L C Z F × 100
where ZLC (mm) is average infiltrated depth in the low quarter of the field and ZF (mm) is average infiltrated depth over the whole field.
In addition, irrigation water productivity (WPirrig) is determined as the ratio between total harvestable fresh yield (Y) and the irrigation water use (IWU) supplied from planting to harvest [1,44]:
W P i r r i g ( K g   m 3 ) = Y I W U
where Y (Kg ha−1) is total harvestable fresh yield and IWU (m3 ha−1) is total irrigation water volume.

2.4. Statistical Analysis

Several statistical indices have been used to assess the performance and goodness of fit between measured and simulated data: Coefficient of determination (R2), Root Mean Square Error (RMSE), RMSE-observations Standard deviation Ratio (RSR) and Coefficient of Residual Mass (CRM). Their equations are as follows:
R 2 = i = 1 n O i O ¯ S i S ¯ 2 i = 1 n O i O ¯ 2   1 = 1 n S i S ¯ 2
RMSE = i = 1 n ( S i O i ) 2 n
CRM = i = 1 n O i i = 1 n S i i = 1 n O i
RSR =   i = 1 n ( O i S i )   2   i = 1 n ( O i O ¯ )   2
where  O ¯  and  S ¯  are the mean of observed and simulated data and n is the total number of observations.
R2 varies from 0 to 1. R2 =1 corresponds to perfect fit between estimated and observed data. RMSE and RSR can vary from the optimal value of 0 to a large positive value. However, lower values of RMSE and RSR correspond to a better match between measured and simulated data. Positive CRM value indicates a certain overestimation of the considered variables and negative value corresponds to an underestimation. Values equal to 0 indicate that the model does not deviate from observed data, considered true values.

3. Results and Discussion

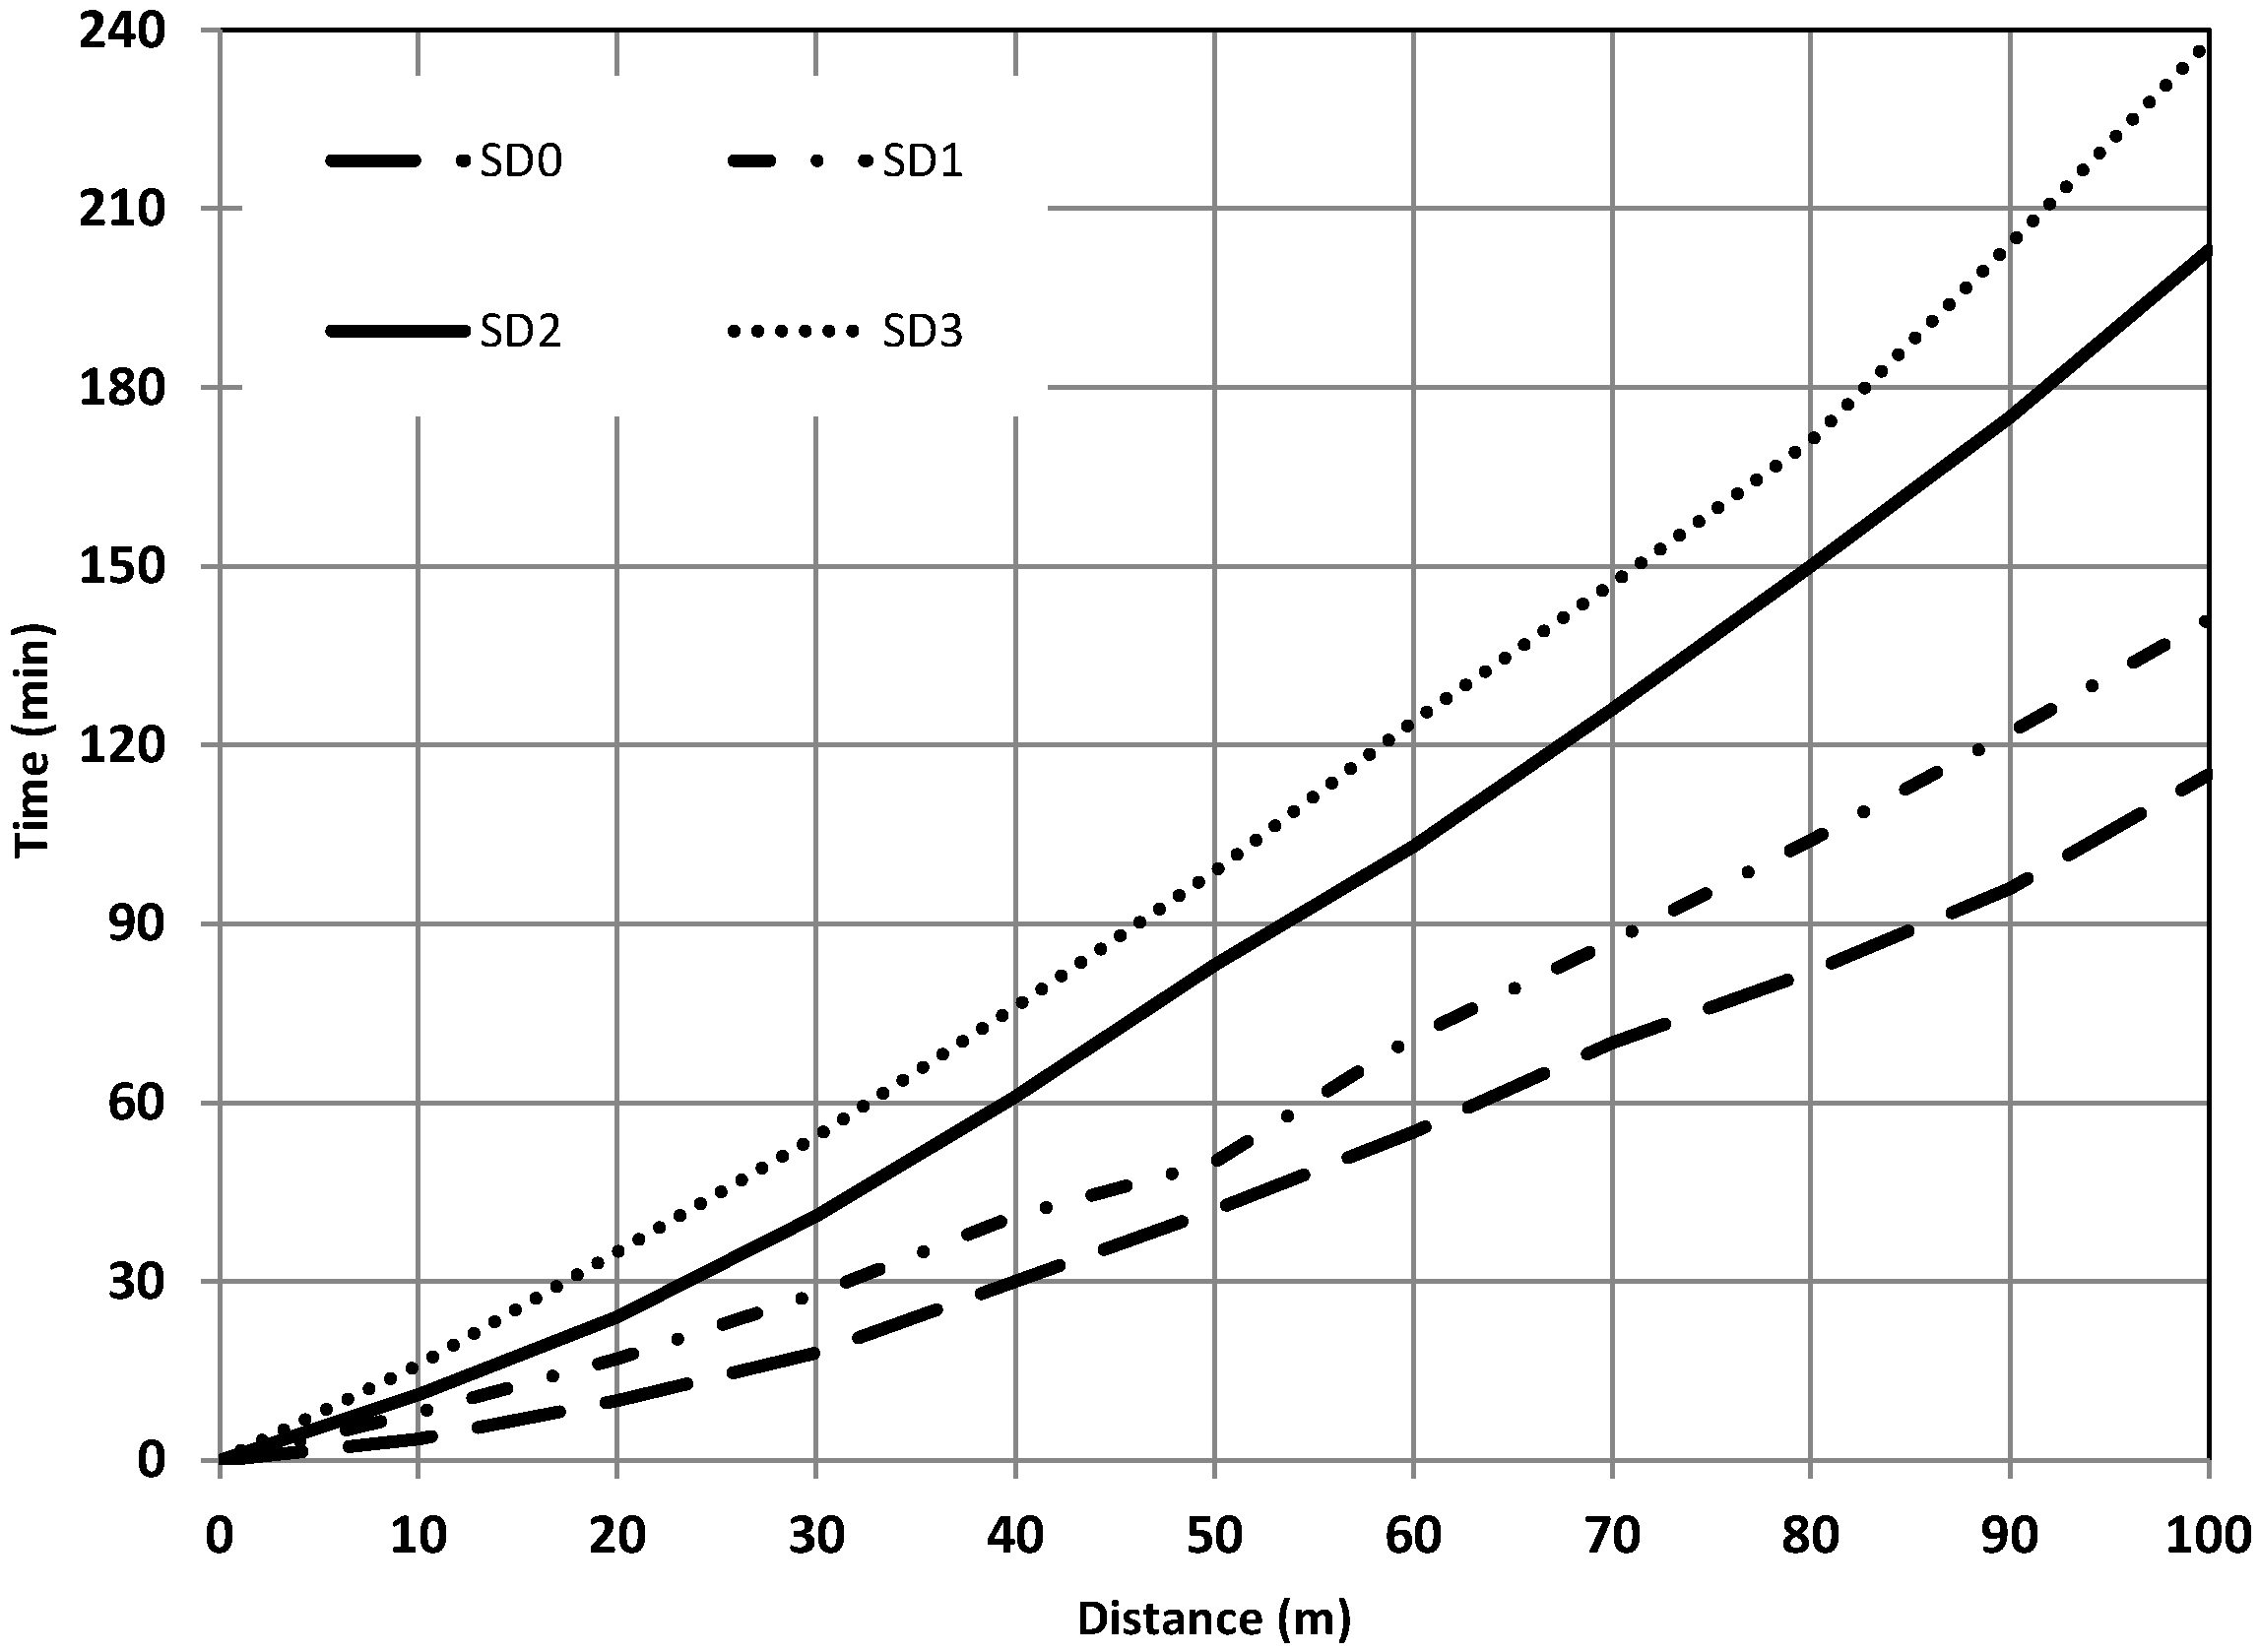
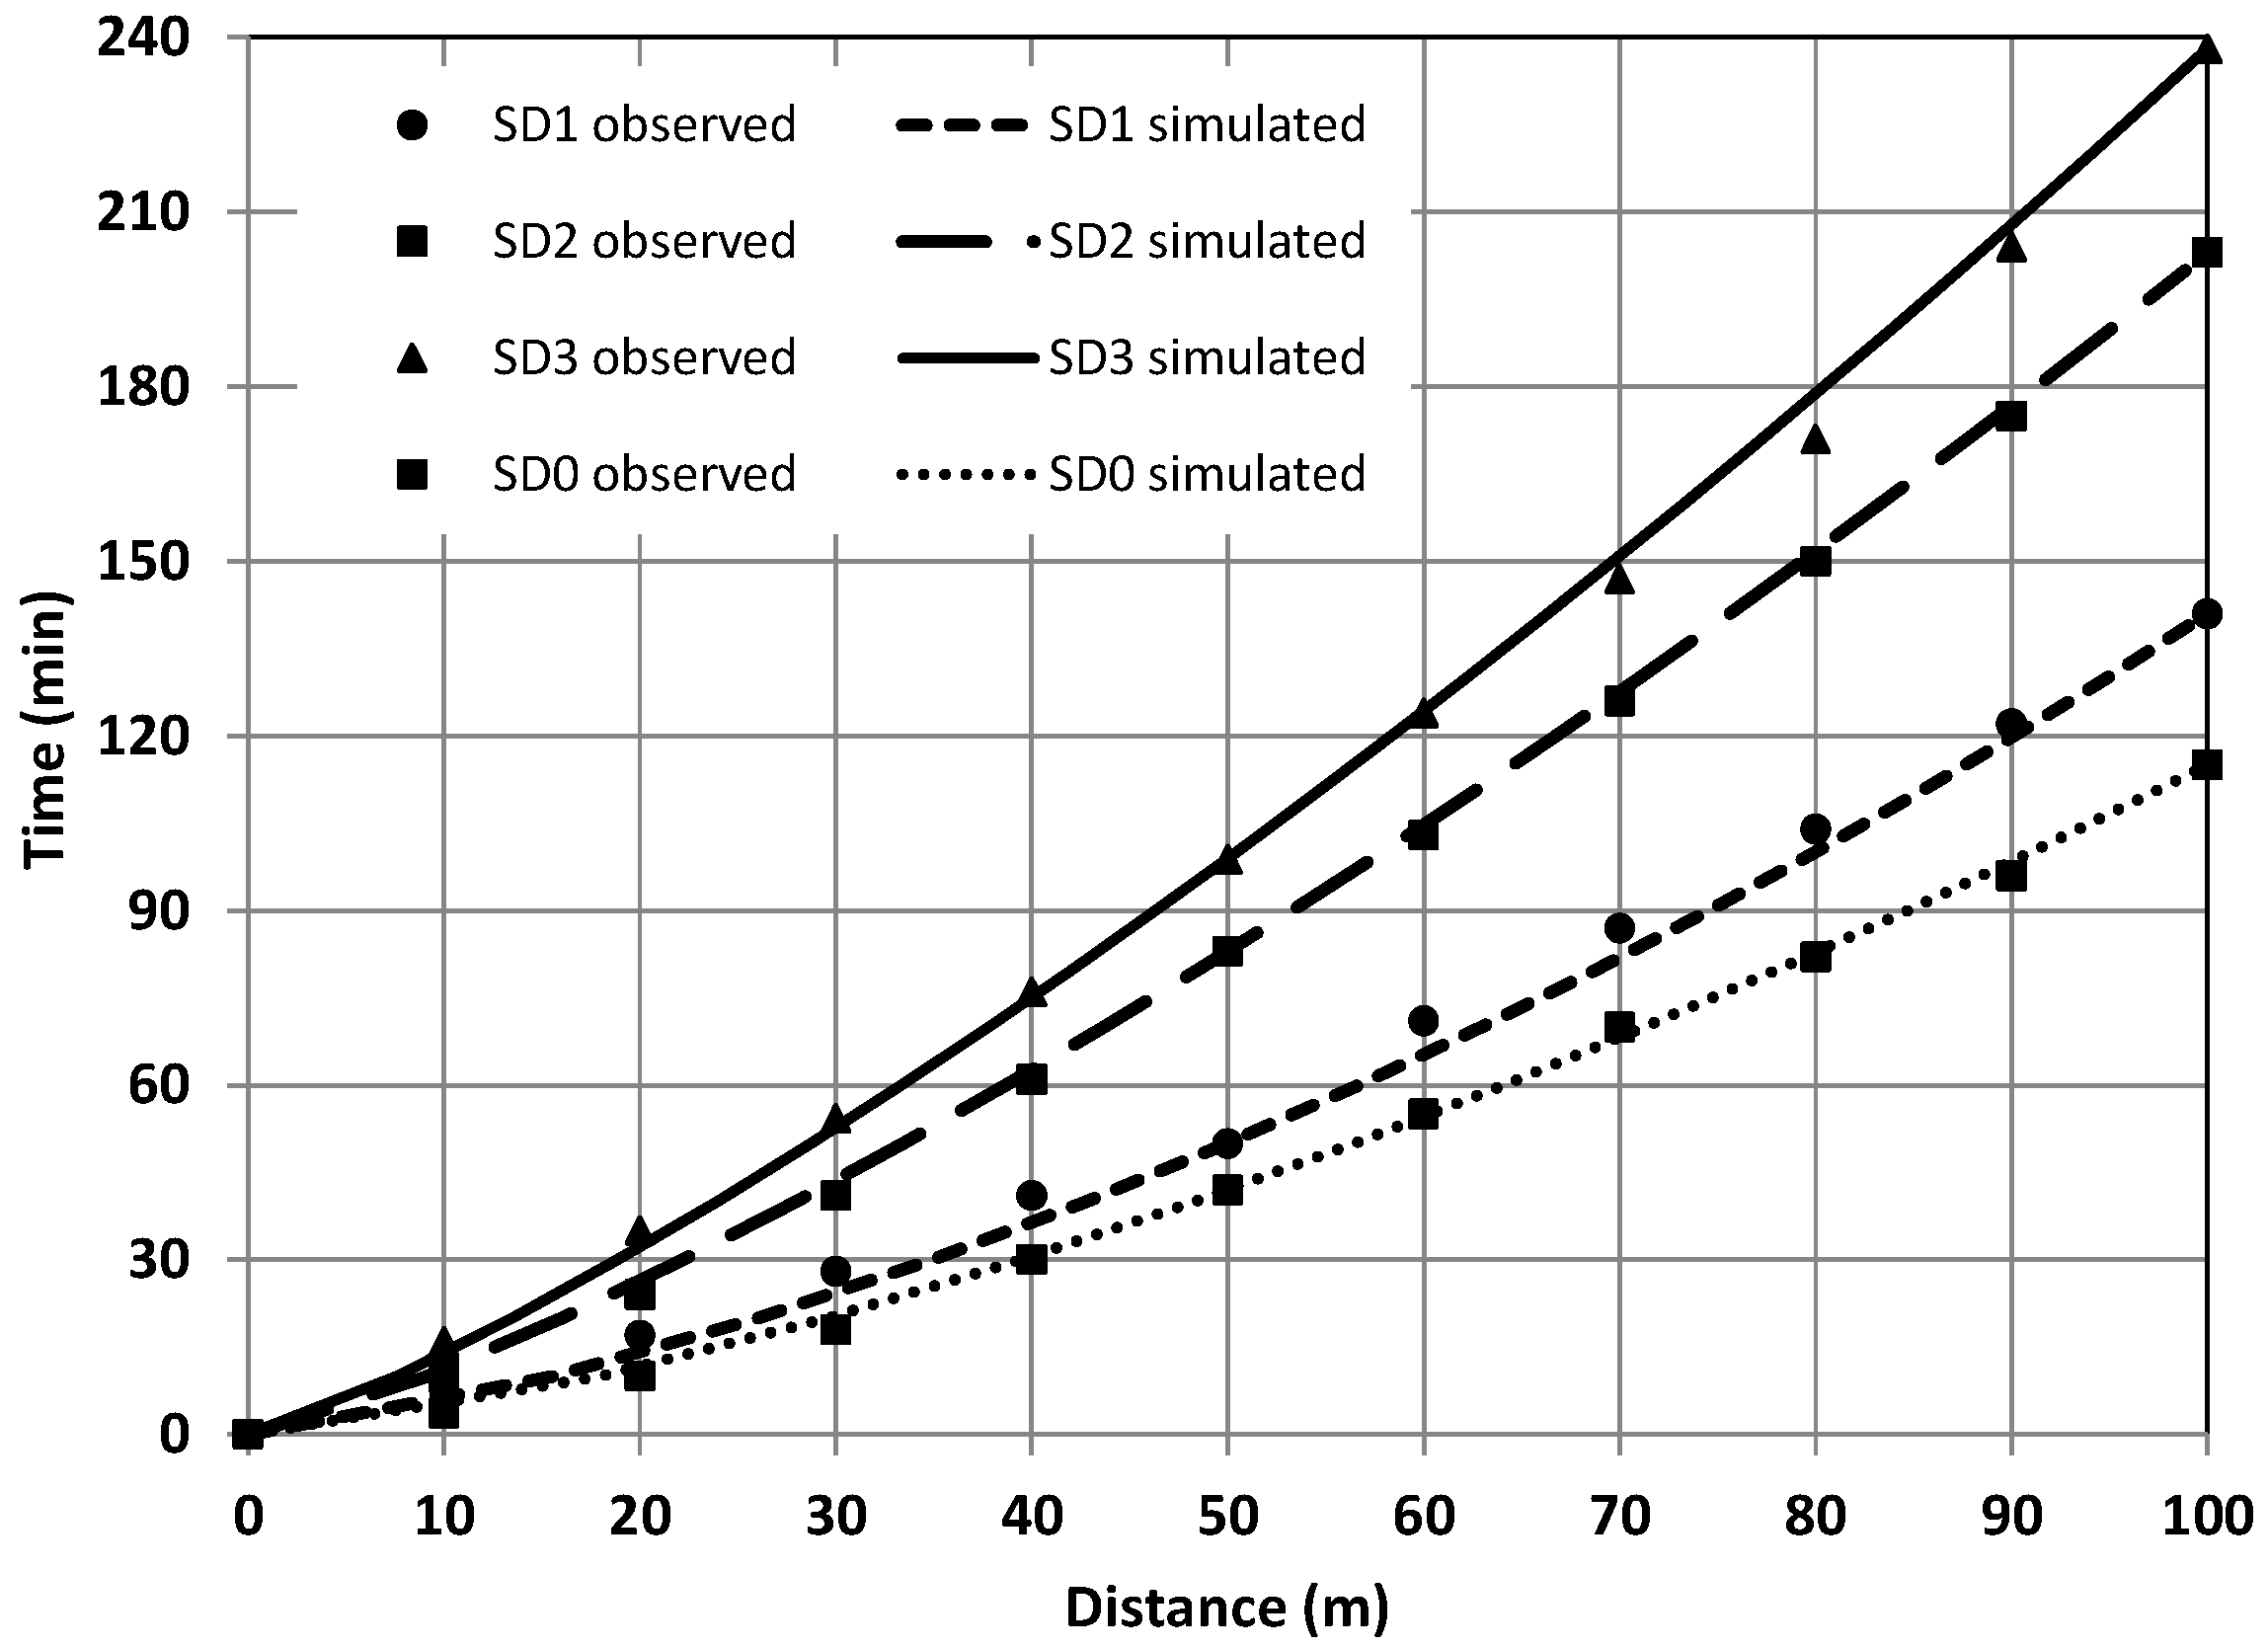
3.1. Wetting Front Advancement
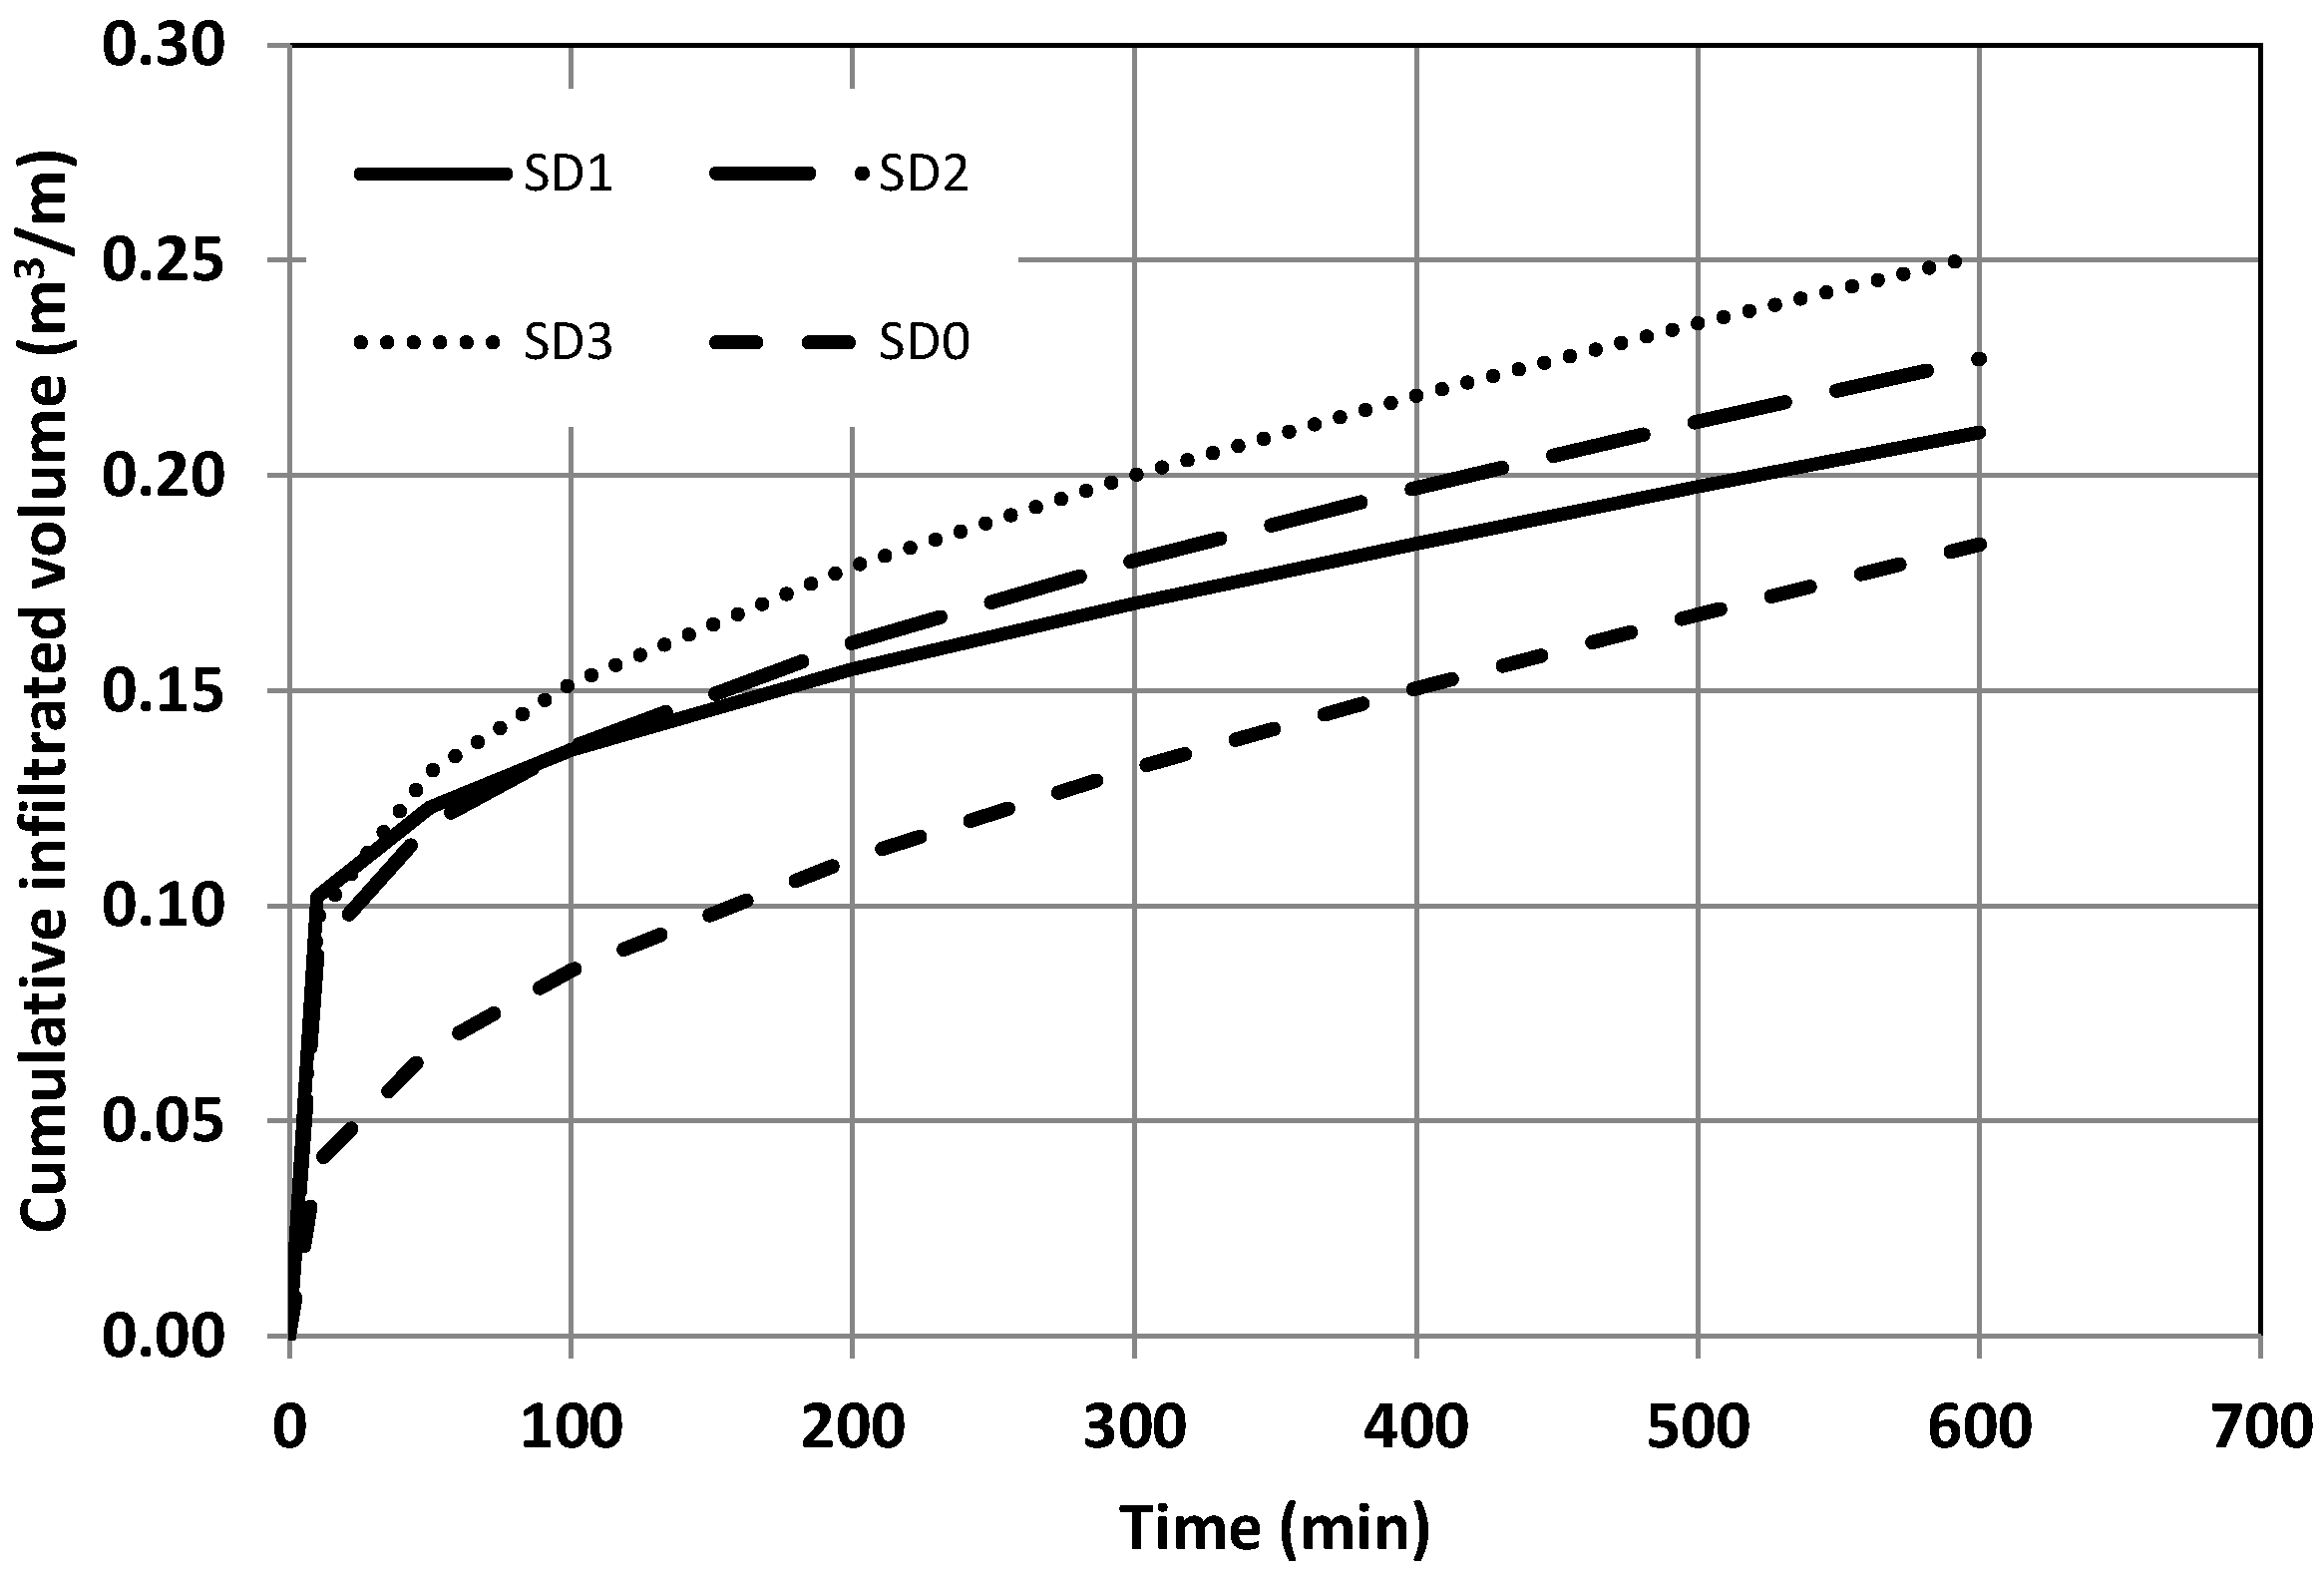
Figure 4 shows a comparison between the wetting front advancement for all treatments, which corresponds to the average of the migration distances of the wetting front for the second and third irrigation events. The wetting front advance seems to be inversely proportional to the sowing density. It was highly pronounced under SD0 followed by SD1, SD2 and SD3. These results might be explained by the fact that the increase in vegetation cover tends to decrease the surface runoff, therefore resulting in a higher infiltration rate [40]. In addition, the obtained results highlight that the sowing density can be considered a determinant factor in wetting front advancement. In fact, for the SD3 treatment, the irrigation duration doubled compared to SD0. However, a negligible difference has been recorded between SD1 and SD0.

3.2. Infiltration

The curves of cumulative infiltration for the different treatments determined using the two-point method are presented in Figure 5. The infiltration rates recorded under the SD1, SD2 and SD3 treatments were comparable during the first minutes. This behavior might be explained by the similarity of the soil physical properties in the upper layer. Then, the soil water infiltration rate tended to increase with increasing durum-wheat sowing density. The highest infiltration amount was recorded under SD3 followed by SD2 and SD1. In addition, it can be denoted that the variation in the infiltration rate between SD0 and each of the other treatments remained constant during the process. These results are in good agreement with those recorded by Regùés et al. [45], who found that low infiltration rates are registered in bare soil. Furthermore, Meek et al. [46] highlighted the importance of crop roots, in particular alfalfa roots, in increasing the infiltration rate because they facilitate the reformation of macro-pores destroyed by tillage.
A comparison between the measured and simulated waterfront advance data under the 4 treatments is shown in Figure 6, and the related goodness of fit indicators are summarized in Table 3.
As can be noticed in Figure 6, the simulated data using the two-point method [32] are highly correlated with their corresponding measurements on the ground, with R2 values close to 1 (Table 3). The RMSE values range from 1.04 to 3.31 m min−1 for SD0 and SD3, respectively. Statistically, the RMSE values relative to SD0 and SD2 are the most satisfactory and equal 1.04 and 1.78 m min−1, respectively. Except for SD1, negative CRM values have been recorded, indicating that the two-point method tends to slightly overestimate the wetting front advance. Considering the statistical results achieved in this study, it can be concluded that the two-point method is a promising tool for estimating infiltration function parameters.

3.3. Furrow Irrigation System Performance

The total irrigation volumes applied during the cropping cycle and the final yields obtained under the four treatments are reported in Table 4. As can be easily verified, the distribution uniformity (DU) increases with the durum-wheat sowing density. It ranges from 85 to 95% for the SD0 and SD3 treatments, respectively. Regarding Ea, lower values were registered under the SD0 and SD3 treatments.
The total irrigation volumes applied during the durum-wheat cropping cycle vary with the sowing density. In fact, the total irrigation volume received under SD3 represents approximately double that delivered under the benchmark treatment, SD0. However, an increment of around 18% has been recorded under SD1. As is expected, the durum wheat yield was affected by the sowing density as well as by the total irrigation amount. In our conditions, a higher yield (4.9 t ha−1) was observed under the SD3 treatment, while the sowing density and therefore irrigation volume were reduced by around 45% and 40%, respectively, resulting in a yield decrease of about 29% (SD1). In fact, the increase in the sowing density resulted in higher soil roughness. This later reduces the water front advance and increases the infiltrated water volume. Thus, under our experimental conditions, the yields were dependent on the stored water volume.
Regarding irrigation water productivity, the obtained values fall within the range of variability of those reported by Aggarwal et al. [47]. The WPirrig values range between 1 kg m−3 and 1.18 kg m−3 under SD3 and SD1, respectively. These results are in agreement with those reported by Balwinder-Singh et al. [48], who found that the highest water productivity value was achieved in the plot that received the least irrigation water amount. In our case, the highest WPirrig value is attributed to the plot characterized by a lower yield (SD1). However, according to Ali et al. [49], higher WPirrig values are of little interest if they are not associated with a high or acceptable yield.

4. Conclusions

This paper investigates the impact of durum-wheat sowing density, cultivated in clay loam soil, on the advancement and infiltration rate of irrigation water and the yield and performance of the furrow irrigation system.
The results show that the two-point method developed by Elliot and Walker (1982) and based on the Kostiakov equation can reliably predict infiltration and water front advance time. Contrary to the water front advancement process, our findings indicate that infiltration rate along furrows is positively correlated with sowing density. In fact, a higher sowing rate results in higher vegetation density and abundant availability of plant roots which impede surface runoff, therefore increasing water infiltration.
The performance of furrow irrigation was optimized by changing the sowing density and therefore the irrigation volume. From the irrigation performance indicators considered, distribution uniformity was improved with increased sowing density compared to the existing practice. The experimental results also revealed that the crop yields increased as the applied irrigation water increased. It was noticeable that the maximum crop yield of 4.9 t ha−1 was recorded under the SD3 treatment. It is worth mentioning that the SD2 treatment generated a yield of 4.6 t ha−1, close to that obtained with SD3. However, a higher WPirrig value (1.18 kg m−3) was registered under SD1. Therefore, further investigations are required to identify the optimal durum-wheat sowing density for better water productivity, in particular under circumstances of water scarcity.
The obtained results could be considered a contribution to the acquisition of technical references focusing on the impact of sowing density on the advancement and infiltration of water under furrow irrigation. Nevertheless, further economic studies are recommended to determine the optimum sowing density of durum wheat conducted under furrow irrigation.

Author Contributions

A.S. conceptualized, prepared the draft and wrote the original draft of the manuscript. S.Y. completed data curation and reviewed and improved the manuscript. T.H. reviewed and improved the manuscript. B.L. reviewed and edited the writing in the manuscript. K.Z. supervised the study. All authors have read and agreed to the published version of the manuscript.

Funding

This research received no external funding.

Data Availability Statement

The data cannot be shared because they are in priority of INRGREF.

Acknowledgments

The authors are thankful to the National Research Institute for Rural Engineering, Water and Forestry (INRGREF) for its valuable support of this research.

Conflicts of Interest

The authors declare no conflict of interest.

References

  1. Pereira, L.S.; Cordery, I.; Iacovides, I. Improved indicators of water use performance and productivity for sustainable water conservation and saving. Agric. Water Manag. 2012, 108, 39–51. [Google Scholar] [CrossRef]
  2. MARHP. Rapport National du Secteur de l’Eau; MARHP: Tunis, Tunisia, 2020; p. 282. [Google Scholar]
  3. Mazarei, R.; Soltani, M.A.; Ebrahimian, H.; Naseri, A.A. Temporal variability of infiltration and roughness coefficients and furrow irrigation performance under different inflow rates. Agric. Water Manag. 2021, 245, 106465. [Google Scholar] [CrossRef]
  4. Slatni, A.; Zayani, K.; Zairi, A.; Yacoubi, S.; Salvador, R.; Playan, E. Assessing alternate furrow strategies for potato at the Cherfech irrigation district of Tunisia. Biosyst. Eng. 2011, 108, 154–163. [Google Scholar] [CrossRef] [Green Version]
  5. Gillies, M.H.; Smith, R.J.; Raine, S.R. Accounting for temporal inflow variation in the inverse solution for infiltration in surface irrigation. Irrig. Sci. 2007, 25, 87. [Google Scholar] [CrossRef] [Green Version]
  6. Abdelmonem, M.A. Effects of water infiltration and storage in cultivated soil on surface irrigation. Agric. Water Manag. 2011, 98, 815–822. [Google Scholar]
  7. Clemmens, A.J.; Dedrick, A.R. Irrigation Techniques and Evaluations. In Advanced Series in Agricultural Sciences; Tanji, K.K., Yaron, B., Eds.; Springer: Berlin/Heidelberg, Germany, 1994; pp. 64–103. [Google Scholar]
  8. Zapata, N.; Playán, E.; Faci, J.M. Elevation and Infiltration on a Level Basin: II. Impact on Soil Water and Corn Yield. Irrig. Sci. 2000, 4, 165–173. [Google Scholar] [CrossRef] [Green Version]
  9. Playán, E.; Slatni, A.; Castillo, R.; Faci, J.M.A. Case Study for Irrigation Modernisation: II. Scenario Analysis. Agric. Water Manag. 2000, 42, 335–354. [Google Scholar] [CrossRef] [Green Version]
  10. Ghumman, A.R.; Iqbal, M.; Ahmad, S.; Hashmi, H.N. Experimental and numerical investigations for optimal emitter spacing in drip irrigation. Irrig. Drain. 2018, 67, 724–737. [Google Scholar] [CrossRef]
  11. Munish, K.; Parveen, S. Assessment of infiltration rate of soil using empirical and machine learning-based models. Irrig. Drain 2019, 68, 588–601. [Google Scholar]
  12. Karmeli, D.; Salazar, L.L.; Walker, W.R. Assessing the Spatial Variability of Irrigation Water Applications; EPA-600/2-78-041; U.S. Environmental Protection Agency, Robert S. Kerr Environmental Research Laboratory: Ada, OK, USA, 1978.
  13. Angelaki, A.; Sakellariou-Makrantonaki, M.; Tzimopoulos, C. Theoretical and experimental research of cumulative infiltration. Transp. Porous Media 2013, 100, 247–257. [Google Scholar] [CrossRef]
  14. Bahú Ben, L.H.; Xavier Peiter, M.; Dias Robaina, A.; Costenaro Parizi, A.R.; Da Silva, G.U. Influence of irrigation levels and plant density on “second-season” maize. Eng. Agric. Rev. Caatinga 2016, 29, 665–676. [Google Scholar] [CrossRef] [Green Version]
  15. El-Hendawy, S.E.; Abd El-Lattief, E.A.; Ahmed, M.S.; Schmidhalter, U. Irrigation rate and plant density effects on yield and water use efficiency of drip-irrigated corn. Agric. Water Manag. 2008, 95, 836–844. [Google Scholar] [CrossRef]
  16. Karimi, M.; Gomrokchi, A. Yield and water use efficiency of corn planted in one or two rows and applying furrow or drip tape irrigation systems in Ghazvin Province, Iran. Irrig. Drain. 2011, 60, 35–41. [Google Scholar] [CrossRef]
  17. Sani, B.M.; Oluwasemire, K.O.; Mohammed, H.I. Effect of irrigation and plant density on the growth, yield and water use efficiency of early maize in the Nigerian Savanna. J. Agric. Bio. Sci. 2008, 3, 33–40. [Google Scholar]
  18. Holzapfel, E.; Marino, M.A.; Chavez, J. Comparison and selection of furrow irrigation models. Agric. Water Manag. 1984, 9, 105–125. [Google Scholar] [CrossRef]
  19. Van den Boogaard, R.; Veneklaas, E.J.; Peacock, J.M.; Lambers, H. Yield and water use of wheat (Triticum aestivum) in a Mediterranean environment: Cultivar differences and sowing density effects. Plant Soil 1996, 181, 251–262. [Google Scholar] [CrossRef]
  20. Zhang, J.; Sui, X.; Li, B.; Su, B.; Li, J.; Zhou, D. An improved water-use efficiency for winter wheat grown under reduced irrigation. Field Crops Res. 1998, 59, 91–98. [Google Scholar] [CrossRef]
  21. Pandey, P.K.; Pandey, V. Estimation of infiltration rate from readily available soil properties (RASPs) in fallow cultivated land. Sustain. Water Resour. Manag. 2019, 5, 921–934. [Google Scholar] [CrossRef]
  22. Vand, A.S.; Sihag, P.; Singh, B.; Zand, M. Comparative evaluation of infiltration models. KSCE J. Civ. Eng. 2018, 22, 4173–4184. [Google Scholar] [CrossRef]
  23. Singh, B.; Sihag, P.; Singh, K. Comparison of infiltration models in NIT Kurukshetra campus. Appl. Water Sci. 2018, 8, 63. [Google Scholar] [CrossRef] [Green Version]
  24. Sterlkoff, T. BRDRFLW: A Mathematical Model for Border Irrigation; ARS, US, Department of Agriculture: Washington, DC, USA, 1985.
  25. Fekersillassie, D.; Einsenhauer, D.E. Feedback-controlled surge irrigation: I. Model development. Trans. ASAE 2000, 43, 1621–1630. [Google Scholar] [CrossRef]
  26. Slatni, A. Elaboration et évaluation des Scénarii D’amélioration des Performances de L’irrigation de Surface sur des Sols Lourds Gonflants. Ph.d. Thesis, National Agronomic Institute, Tunis, Tunisia, 2015. [Google Scholar]
  27. Slatni, A.; Yacoubi, S.; Zayani, K.; Playan, E. Evaluation des paramètres d’infiltration en irrigation à la raie sur trois types de sol [Evaluation of infiltration parameters in furrow irrigation on three types of soil]. Rev. Reg. Arid. 2017, 42, 97–211. [Google Scholar]
  28. Seyedzadeh, A.; Panahi, A.; Maroufpoor, E.; Singh, V.P. Developing a novel method for estimating parameters of Kostiakov–Lewis infiltration equation. Irrig. Sci. 2020, 38, 189–198. [Google Scholar] [CrossRef]
  29. Maghferati, H.R.; Chari, M.M.; Afrasia, P.; Delbari, M. Investigation of various volume–balance methods in surface irrigation. Arab. J. Geosci. 2021, 14, 241. [Google Scholar] [CrossRef]
  30. Panahi, M.; Khosravi, K.; Ahmad, A.; Panahi, S.; Heddam, S.; Melesse, A.M.; Omidvar, E.; Lee, C.W. Cumulative infiltration and infiltration rate prediction using optimized deep learning algorithms: A study in Western Iran. J. Hydrol. Reg. Stud. 2021, 35, 2214–5818. [Google Scholar] [CrossRef]
  31. Amer, A.M.; Amer, K.H. Surface Irrigation Management in Relation to Water Infiltration and Distribution in Soils. Soil Water Res. 2010, 5, 75–87. [Google Scholar] [CrossRef] [Green Version]
  32. Elliot, R.L.; Walker, W.R. Field evaluation of furrow infiltration and advance functions. Trans. ASAE 1982, 25, 396–400. [Google Scholar] [CrossRef]
  33. Walker, W.R.; Skogerboe, G.V. Surface Irrigation: Theory and Practice; Prentice-Hall, Inc.: Englewood Cliffs, NJ, USA, 1987; 386p. [Google Scholar]
  34. Ebrahimian, H.; Liaghat, A.; Ghanbarian-Alavijeh, B.; Abbasi, F. Evaluation of various quick methods for estimating furrow and border infiltration parameters. Irrig. Sci. 2010, 286, 479–488. [Google Scholar] [CrossRef]
  35. Ismail, S.M.; Depenweg, H. Simulation of continuous and surge flow irrigation under short held conditions. Irrig. Drain. 2005, 54, 217–230. [Google Scholar] [CrossRef]
  36. Upadhyaya, S.K.; Raghuwanshi, N.S. Semi-empirical infiltration equations for furrow irrigation systems. Irrig. Drain. 1999, 125, 173–178. [Google Scholar] [CrossRef]
  37. Bautista, E.; Clemmens, A.J.; Strelkoff, T.S.; Schlegel, J. Modern analysis of surface irrigation systems with WinSRFR. Agric. Water Manag. 2009, 96, 1146–1154. [Google Scholar] [CrossRef]
  38. Khatri, K.L.; Smith, R.J. Evaluation of methods for determining infiltration parameters from irrigation advance data. Irig. Drain. 2005, 54, 467–482. [Google Scholar] [CrossRef]
  39. Syar, R.; Khemira, H.; Bchini, H.; Bensalem, H.; Mosbah, M.; Nahdi, H. Utilisation des Composantes du Rendement Comme Outil D’évaluation de la Productivité chez le blé dur en Irrigué et en Pluvial; Annales de l’INRGREF. Issue Number 1; INRGREF: Tunis, Tunisia, 2007; pp. 58–67. ISSN 1737-0515. [Google Scholar]
  40. Rodrigues, P.N.; Pereira, L.S.; Machado, T.G. KCISA, A program to compute time averaged crop coefficients: Application to field grown vegetable crops. In Proceedings of the Third International Symposium on Irrigation of Horticultural Crops, Lleida, Spain, 8–11 June 2015; pp. 535–542. [Google Scholar]
  41. Zairi, A.; Slatni, A.; Mailhol, J.C.; Achour, H. Surface irrigation efficiency in cracking soils as influenced by water restriction. In Water and the Environment—Innovation Issues in Irrigation and Drainage; Pereira, L., Gowing, J., Eds.; CRC Press: Boca Raton, FL, USA, 1998; pp. 120–130. [Google Scholar]
  42. Walker, W.R. SIRMOD III: Surface Irrigation Simulation, Evaluation and Design; Software Engineering Division, Biological and Irrigation Engineering Department, Utah State University: Logan, UT, USA, 2003. [Google Scholar]
  43. Burt, C.M.; Clemmens, A.J.; Strelkoff, T.S.; Solomon, K.H.; Bliesner, R.D.; Hardy, L.A.; Howell, T.A.; Eisenhauer, D.E. Irrigation performance measures: Efficiency and uniformity. J. Irrig. Drain. Eng. ASCE 1997, 123, 423–442. [Google Scholar] [CrossRef] [Green Version]
  44. Nagaz, K.; EL Mokh, F.; Alva, A.K.; Masmoudi, M.M.; Ben Mechlia, N. Potato response to different irrigation regimes using saline water. Irrig. Drain. 2016, 65, 654–663. [Google Scholar] [CrossRef]
  45. Regüés, D.; Badía, D.; Echeverría, M.T.; Gispert, M.; Lana-Renault, N.; León, J.; Nadal-Romero, E.; Pardini, G.; Serrano-Muela, P. Analyzing the effect of land use and vegetation cover on soil infiltration in three contrasting environments in northeast Spain. Geog. Res. Lett. 2013, 43, 141–169. [Google Scholar]
  46. Meek, B.D.; Reche, E.R.; Carter, L.M.; DeTar, W.R.; Urie, A.L. Infiltration Rate of a Sandy Loam Soil: Effects of Traffic, Tillage, and Plant Roots. SSSAJ 1992, 56, 908–913. [Google Scholar] [CrossRef]
  47. Aggarwal, P.K.; Singh, A.K.; Chaturvedi, G.S.; Sinha, S.K. Performance of wheat and triticale cultivars in a variable soil—Water environment. Field Crops Res. 1986, 13, 301–315. [Google Scholar] [CrossRef]
  48. Balwinder-Singh, G.D.S.; Humphreys, E.; Eberbach, P.L.; Katupitiya, A.; Kukal, S.S. Growth, yield and water productivity of zero-till wheat as affected by rice straw mulch and irrigation schedule. Field Crops Res. 2011, 121, 209–225. [Google Scholar] [CrossRef]
  49. Ali, M.H.; Hoque, M.R.; Hassan, A.A.; Khair, A. Effects of deficit irrigation on yield, water productivity and economic returns of wheat. Agric. Water Manag. 2007, 92, 151–161. [Google Scholar] [CrossRef]
Figure 1. Study area location. Cherfech District and the experimental field are shown in white and green boxes, respectively.
Agronomy 13 02080 g001
Figure 2. Mean monthly evolution of Precipitation (P) and reference evapotranspiration (ET0) during the period 1980–2017.
Agronomy 13 02080 g002
Figure 3. Experimental values of matric potential versus soil water content for the investigated soil. The fitting curve is also shown.
Agronomy 13 02080 g003
Figure 4. Water front advancement distance along furrow.
Agronomy 13 02080 g004
Figure 5. Cumulative infiltration under the different treatments.
Agronomy 13 02080 g005
Figure 6. Measured versus simulated water front advance along furrow length.
Agronomy 13 02080 g006
Table 1. Mean monthly climate data recorded at the Cherfech meteorological station for the period 1980–2017.
MonthJFMAMJJASOND
Tmin (°C)6.15.97.08.512.116.117.719.017.313.99.86.9
Tmax (°C)15.716.418.421.326.130.433.533.830.626.320.717.0
WS (m/s)0.981.041.191.311.451.511.461.321.160.950.860.89
Table 2. Soil water characteristics.
Depth (cm)θfc (%)θpwp (%)
0–2042.626.7
20–4041.926.0
40–6042.324.5
60–8044.826.2
80–10038.626.2
Table 3. Statistical indicators computed by comparing measured and simulated water front advancement.
SD0SD1SD2SD3
RSME1.043.291.783.31
RSR0.0040.0100.0080.016
R20.990.980.990.99
CRM−0.0110.043−0.003−0.007
Table 4. Furrow irrigation system performances, Durum wheat total irrigations amount, yield and Wpirrig.
SD0SD1SD2SD3
Ea (%)75808275
DU (%)85909395
Irrigation depth (mm)6274108123
Total irrigation (mm)250295430490
Yield (t ha−1) 3.54.64.9
WPirrig (kg m−3) 1.181.071
Disclaimer/Publisher’s Note: The statements, opinions and data contained in all publications are solely those of the individual author(s) and contributor(s) and not of MDPI and/or the editor(s). MDPI and/or the editor(s) disclaim responsibility for any injury to people or property resulting from any ideas, methods, instructions or products referred to in the content.

