Article

Improving Nitrogen Status Diagnosis and Recommendation of Maize Using UAV Remote Sensing Data

1
Key Laboratory of Plant-Soil Interactions, Ministry of Education, National Academy of Agriculture Green Development, College of Resources and Environmental Sciences, China Agricultural University, Beijing 100193, China
2
Precision Agriculture Center, Department of Soil, Water and Climate, University of Minnesota, Saint Paul, MN 55108, USA
*
Authors to whom correspondence should be addressed.
Agronomy 2023, 13(8), 1994; https://doi.org/10.3390/agronomy13081994
Submission received: 8 July 2023 / Revised: 25 July 2023 / Accepted: 25 July 2023 / Published: 27 July 2023

Abstract

:
Effective in-season crop nitrogen (N) status diagnosis is important for precision crop N management, and remote sensing using an unmanned aerial vehicle (UAV) is one efficient means of conducting crop N nutrient diagnosis. Here, field experiments were conducted with six N levels and six maize hybrids to determine the nitrogen nutrition index (NNI) and yield, and to diagnose the N status of the hybrids combined with multi-spectral data. The NNI threshold values varied with hybrids and years, ranging from 0.99 to 1.17 in 2018 and 0.60 to 0.71 in 2019. A proper agronomic optimal N rate (AONR) was constructed and confirmed based on the measured NNI and yield. The NNI (R2 = 0.64–0.79) and grain yield (R2 = 0.70–0.73) were predicted well across hybrids using a random forest model with spectral, structural, and textural data (UAV). The AONRs calculated using the predicted NNI and yield were significantly correlated with the measured NNI (R2 = 0.70 and 0.71 in 2018 and 2019, respectively) and yield (R2 = 0.68 and 0.54 in 2018 and 2019, respectively). It is concluded that data fusion can improve in-season N status diagnosis for different maize hybrids compared to using only spectral data.

1. Introduction

Maize (Zea mays L.) is the most planted crop in the world, and its production reached 1.45 billion tons in recent years, with 22.7% being produced in China [1]. Nitrogen (N) loss is one of the negative factors in maize production affecting the environment in China [2]. One strategy to solve this problem is to adopt high nitrogen use efficiency (NUE) maize hybrids through breeding [3], and another strategy is through optimized N management [4]. Precision N management can effectively improve NUE and reduce environmental pollution caused by over-fertilization [5,6]. Rapid in-season N status diagnosis and N recommendation through remote sensing strategies are vital to precision N management [7,8].
The N nutrition index (NNI) is currently one of the most commonly used methods to evaluate crop N nutrition diagnosis. The NNI is already considered to be an important symbol of plant N status, which is defined by the relative relationship between measured plant N concentration (PNC) and the critical PNC [9]. An NNI value of 1 indicates optimal N status, an NNI greater than 1 indicates N surplus, while an NNI less than 1 indicates N deficiency [9]. Suitable NNI threshold values may vary with different hybrids or environments and can be determined by relative yield and NNI [10]. The relationship between the NNI and the relative grain yield was expressed with a linear plateau model, and it was found that the two have a high correlation [10]. Therefore, the NNIs of different varieties and environments could be improved continuously to evaluate the nitrogen deficiency status of crops more reasonably.
The calculation of NNI requires the determination of PNC and aboveground biomass (AGB) through destructive sampling and laboratory analysis. Given this situation, proximal and remote sensing equipment have their advantages in the non-destructive estimation of NNI [11,12]. Satellite remote sensing has the advantage of high efficiency for plant N diagnosis and yield estimation across large areas [13,14]. However, it generally has low spatial or temporal resolution and is influenced by bad weather conditions [15]. Unmanned aerial vehicles (UAVs) are widely applied for estimating plant traits based on image spectral, structural, textural information, etc. That may be due to their advantages of low cost, real-time image transmission, high spatial resolution, and flexible maneuverability [16]. Canopy spectral information based on multi-spectral or hyperspectral images has been used for estimating leaf chlorophyll content [17], PNC [18], and crop yield [19]. Canopy structure information, for instance, crop heights obtained by light detection and ranging systems, point clouds based on digital photogrammetry, and canopy cover or vegetation fractions, can interact with spectral information. And it has also been applied in crop AGB [20], leaf area index (LAI) [21], and yield research [22]. In addition, the time series canopy structure also affects the robustness of vegetation indices. The structure information can be inputted into a yield prediction model [15]. Canopy texture information extracted from UAV remote sensing images is helpful for estimating yield [23], AGB [24], LAI [25], chlorophyll content [26], and PNC [27]. In recent years, multi-sensor data fusion technology has been used for plant trait estimation [28]. However, research on the high-throughput prediction of maize NNI and yield of different hybrids from UAV remote sensing spectral, structural, and textural information has been limited.
Machine learning (ML) methods are increasingly applied in precision agriculture for their ability to process huge data. ML provides a powerful and flexible tool for decision-making and professional knowledge integration [29], and has been used together with remote sensing data for predicting AGB [30], yield [31], and plant N status indicators [32]. Studies have shown that the ML method has advantages in N status diagnosis and precision agriculture through integrating spectral, genetic, climate, and management information [33,34]. Thus, the effectiveness of using ML methods and UAV remote sensing data fusion for N status diagnosis and recommendation should be evaluated.
The objectives of this study were to (1) establish new NNI threshold values for diagnosing plant N status of different maize hybrids, (2) develop a random forest (RF) model using multispectral UAV remote sensing image data to predict NNI and grain yield, and (3) evaluate the performance of the RF model for in-season N status diagnosis and recommendation of different maize hybrids.

2. Materials and Methods

2.1. Experimental Design and Field Management

This experiment was conducted at Shangzhuang Experimental Station (116°11′ N, 48°08′ E) in Beijing, China (Figure S1). The soil was classified as sandy loam soil. The basic soil properties were determined before sowing in 2018 (Table S1). The precipitation information in 2018 and 2019 is given in Figure S2.
The experiment adopted a split-plot design with N level as the main plot and hybrid as the subplot, and it had three replications. There were six N levels (0, 60, 120, 180, 240, and 300 kg ha−1) and six hybrids randomly arranged in each replicate. The six maize hybrids included N_efficiency 30 (NE30), Jinqing 202 (JQ202), Keyu 188 (KY188), Zhengdan 958 (ZD958), N_efficiency 31 (NE31), and Xianyu 335 (XY335). NE30 and NE31 were selected by the breeding group at China Agricultural University. ZD958 and XY335 are the two maize hybrids that occupy the largest area in China. Detailed information is shown in Table S2.
For each hybrid, the area of the sub-plot was 4 m long and 5 m wide with 10 rows at a row spacing of 0.5 m. The planting densities were 80,000, 100,000, 100,000, 60,000, 60,000, and 60,000 plant ha−1 for NE30, JQ202, KY188, ZD958, NE31, and XY335, respectively, based on best management practices recommended for each hybrid. Maize was sown on 29 April 2018 and 2 May 2019, and harvested on 12 September 2018 and 14 September 2019. For N fertilizer, 30% was applied as basal fertilizer before sowing, and 70% was applied as side-dress fertilizer at the V6–V8 stages for the treatments of N60, N120, N180, and N240. For the N300 treatment, N fertilizer was applied according to the ratio 3:4:3 before sowing, at the V6–V8 stage, and V10–V12 stage. Phosphate (90 kg P2O5 ha−1) and potash (75 kg K2O ha−1) fertilizers were applied as basal fertilizers. The rest of the management practices followed local standards.

2.2. Ground Data Collection and Analysis

2.2.1. Plant Sampling and Measurement

Three uniform plants were randomly selected in one middle row from the ten rows in each plot. For each hybrid at each growth stage of V6, V9, and V12, samples were collected in the form of leaves and stems separately. First, these samples were dried to deactivate the enzymatic activities (105 °C, 30 min), and then dried to a constant weight (70 °C). Based on the leaf and stem dry weight, the plant AGB was obtained. The PNC was determined using a high-throughput method based on a near-infrared spectroscopic (NIRS) assay [35]. The plant PNU and PNC were calculated by the following formulas:
PNU = W1 × N1 + W2 × N2
PNC = PNU/(W1 + W2)
where W1 and W2 represent the dry weights of the leaves and stems, and N1 and N2 represent the N concentrations of leaves and stems, respectively.
At the maturity stage, maize ears from two rows were randomly selected for threshing to measure the ear and cob weight for grain weight (14% moisture).

2.2.2. Calculation of the Nitrogen Nutrition Index

The equation of critical N concentration (Nc) for the North China Plain was developed in a previous study [36]:
Nc = 34.914W−0.4134
where Nc is expressed in g kg−1, and the dimension of W is t ha−1.
The NNI was calculated following [9]:
NNI = Nm/Nc
where Nm is the measured PNC.

2.2.3. Determination of NNI Threshold Values

Previously, the NNI threshold was defined as 1 [9]. Here, the NNI threshold was re-estimated using the NNI and relative yield at different N rates. First, the NNI value of each hybrid at each N rate was calculated. After that, the relative yield was calculated using the following formula:
Relative yield = yield at each N level and hybrid/max yield
The max yield is the maximum yield among the six N rates of each hybrid. Based on the NNI at the V9 stage and the relative yield, the linear plus plateau model was used to identify the NNI threshold value of each hybrid in 2018 and 2019 [10]. The linear plus plateau method was fitted using the “NLIN” function in SAS v.8.1 (SAS Institute, Cary, NC, USA). The inflection points of the linear plus plateau models (start of the plateau) were used as the threshold NNI value for each hybrid.

2.2.4. N Recommendation Strategy

The in-season N recommendation is calculated by the difference between the recommended agronomic optimum nitrogen rate (AONR) and the basal N application rate. The AONR is equal to the lowest N rate applied to get the highest yield. It was defined by the inflection point of the N rate for maximum yield using the linear plus plateau model. In addition, it could be estimated by the regression relationship of the N rate and NNI based on the NNI threshold.

2.3. UAV Remote Sensing Data Collection and Analysis

2.3.1. UAV Image Acquisition and Processing

The DJI Inspire 2 equipment with a DJI FC6510 RGB camera (DJI Technology Co., Shenzhen, China) octocopter was used as the UAV platform. A 1.2 MP Parrot Sequoia multispectral camera (Parrot SA, Paris, France) was also integrated into the UAV platform. It includes four band sensors, including green (530–570 nm), red (640–680 nm), red edge (730–740 nm), and near-infrared (770–810 nm), and a separate sunshine sensor to measure solar irradiance for radiometric calibration. The 20 MP DJI RGB camera (DJI FC6510) with the pan/tilt/zoom platform of ZENMUSE X7 was used to create the RGB orthomosaic images. The white Spectralon® panel (Labsphere, Inc., North Sutton, NH, USA) was used for the camera calibration.
At the V6, V9, and V12 stages of each hybrid, the UAV images were obtained between 11:00 a.m. and 2:00 p.m. under clear and windless conditions. The flight altitude was 60 m and the forward and side overlap were 85% and 75%, respectively. Pix4Dmapper v. 4.5.6 software (Pix4D SA, Lausanne, Switzerland) was used for mosaicking the geotagged images. To register the images of different stages, 10–20 easily recognizable landmarks such as the pavilion were selected as ground control points (GCPs) of the first flight. Esri ArcGIS 10.2 (ESRI, Redlands, CA, USA) was employed to build the plot boundaries and regions of interest (ROI).

2.3.2. Multispectral Image Processing and Vegetation Index

A total of 26 spectral indices, including the four bands’ reflectance, were used as canopy spectral information defined as a multiple spectral index [37,38,39,40,41,42,43,44,45,46,47] (MS) (Table S3).
Canopy texture information was also used as the input variable based on the gray-level co-occurrence matrix (GLCM). Six features were extracted and calculated including homogeneity (green, red), variance (NIR, red, red edge), and correlation (red) (Table S3). The process was performed using ENVI 5.1 (Eris Inc., Redlands, CA, USA).

2.3.3. RGB Image Data Processing

Green cover (GC) directly reflects the growth of plants. This index represents the ratio of projected green vegetation area to the total ground surface area [48]. The formula is as follows:
GC = crop pixels/plot pixels
ENVI 5.1 software was employed for distinguishing vegetation from soil pixels. There were three steps in classifying pixels. First, the orthomosaics from the RGB color model were transformed into the YCbCr color model. Second, 100 samples of soil and plant pixels were selected from the orthomosaics. Third, canopy pixels and soil pixels were classified using the support vector machine method based on these samples. The RGB spectral band-based GC index was used as canopy structure information (Table S3).

2.4. Statistical Analysis and Model Development

Three-way ANOVA was conducted by SAS v8.1 for AGB, PNC, PNU, NNI, and grain yield. Year, N level, and hybrid were the fixed factors, and random forest (RF) was applied to predict AGB, PNU, PNC, NNI, and grain yield.
In order to improve the robustness of the prediction models, MS, GC, GLCMand N rate were combined as inputs for the RF model.
The input feature vector was expressed as:
Xi = [x1, x2, x3, x4]
where Xi represents each sample; x1 indicates the MS features including the 4 basic spectral bands and 22 vegetation indices; x2 represents the 6 GLCM features; and x3 and x4 represent GC and N rate, respectively. The model can be expressed as follows:
y = f(X1, X2, …, Xn)
where y represents an agronomic parameter, which can be AGB, PNC, PNU, NNI, or grain yield, f indicates the function of RF, X represents the integration of each sample’s spectral data with the nitrogen rate features (format 7), and n is the sample number. To build a regression model, the samples were divided into two parts, 70% of which were randomly selected as the training datasets and the remaining 30% of which were the test datasets, and 10-fold cross-validation was used to optimize the model. The RF model was established by the random forest [49] package of R 4.0.3 (https://www.r-project.org/ accessed on 5 May 2021). A total of 70% of the training datasets and 30% of the test datasets were randomly selected, and the model was optimized by 10-fold cross-validation.
The coefficient of determination (R2), root mean square error (RMSE), and relative error (RE) were computed to evaluate different models using the following equations:
R 2 = 1 i = 1 n y i y ^ i 2 i = 1 n y i y ¯ 2
R M S E = i = 1 n ( y i y ^ i ) 2 n
R E = R M S E y ¯ × 100 %
where yi and y ^ i are the measured and predicted data, respectively, y ¯ is the mean of the measured parameter, and n is the number of samples.
Areal agreement and the kappa statistic were effective methods for evaluating the diagnostic results based on the predicted NNI. The samples of each hybrid were divided into two groups: N-limiting group (NNIa < NNIt) and N-non-limiting group (NNIa ≥ NNIt), with NNIa and NNIt representing the measured NNI and NNI threshold, respectively. According to the kappa coefficient, the degree of agreement can be classified into three levels: fair (0.21–0.40), moderate (0.41–0.60), and substantial (0.61–0.80) [50].

3. Results

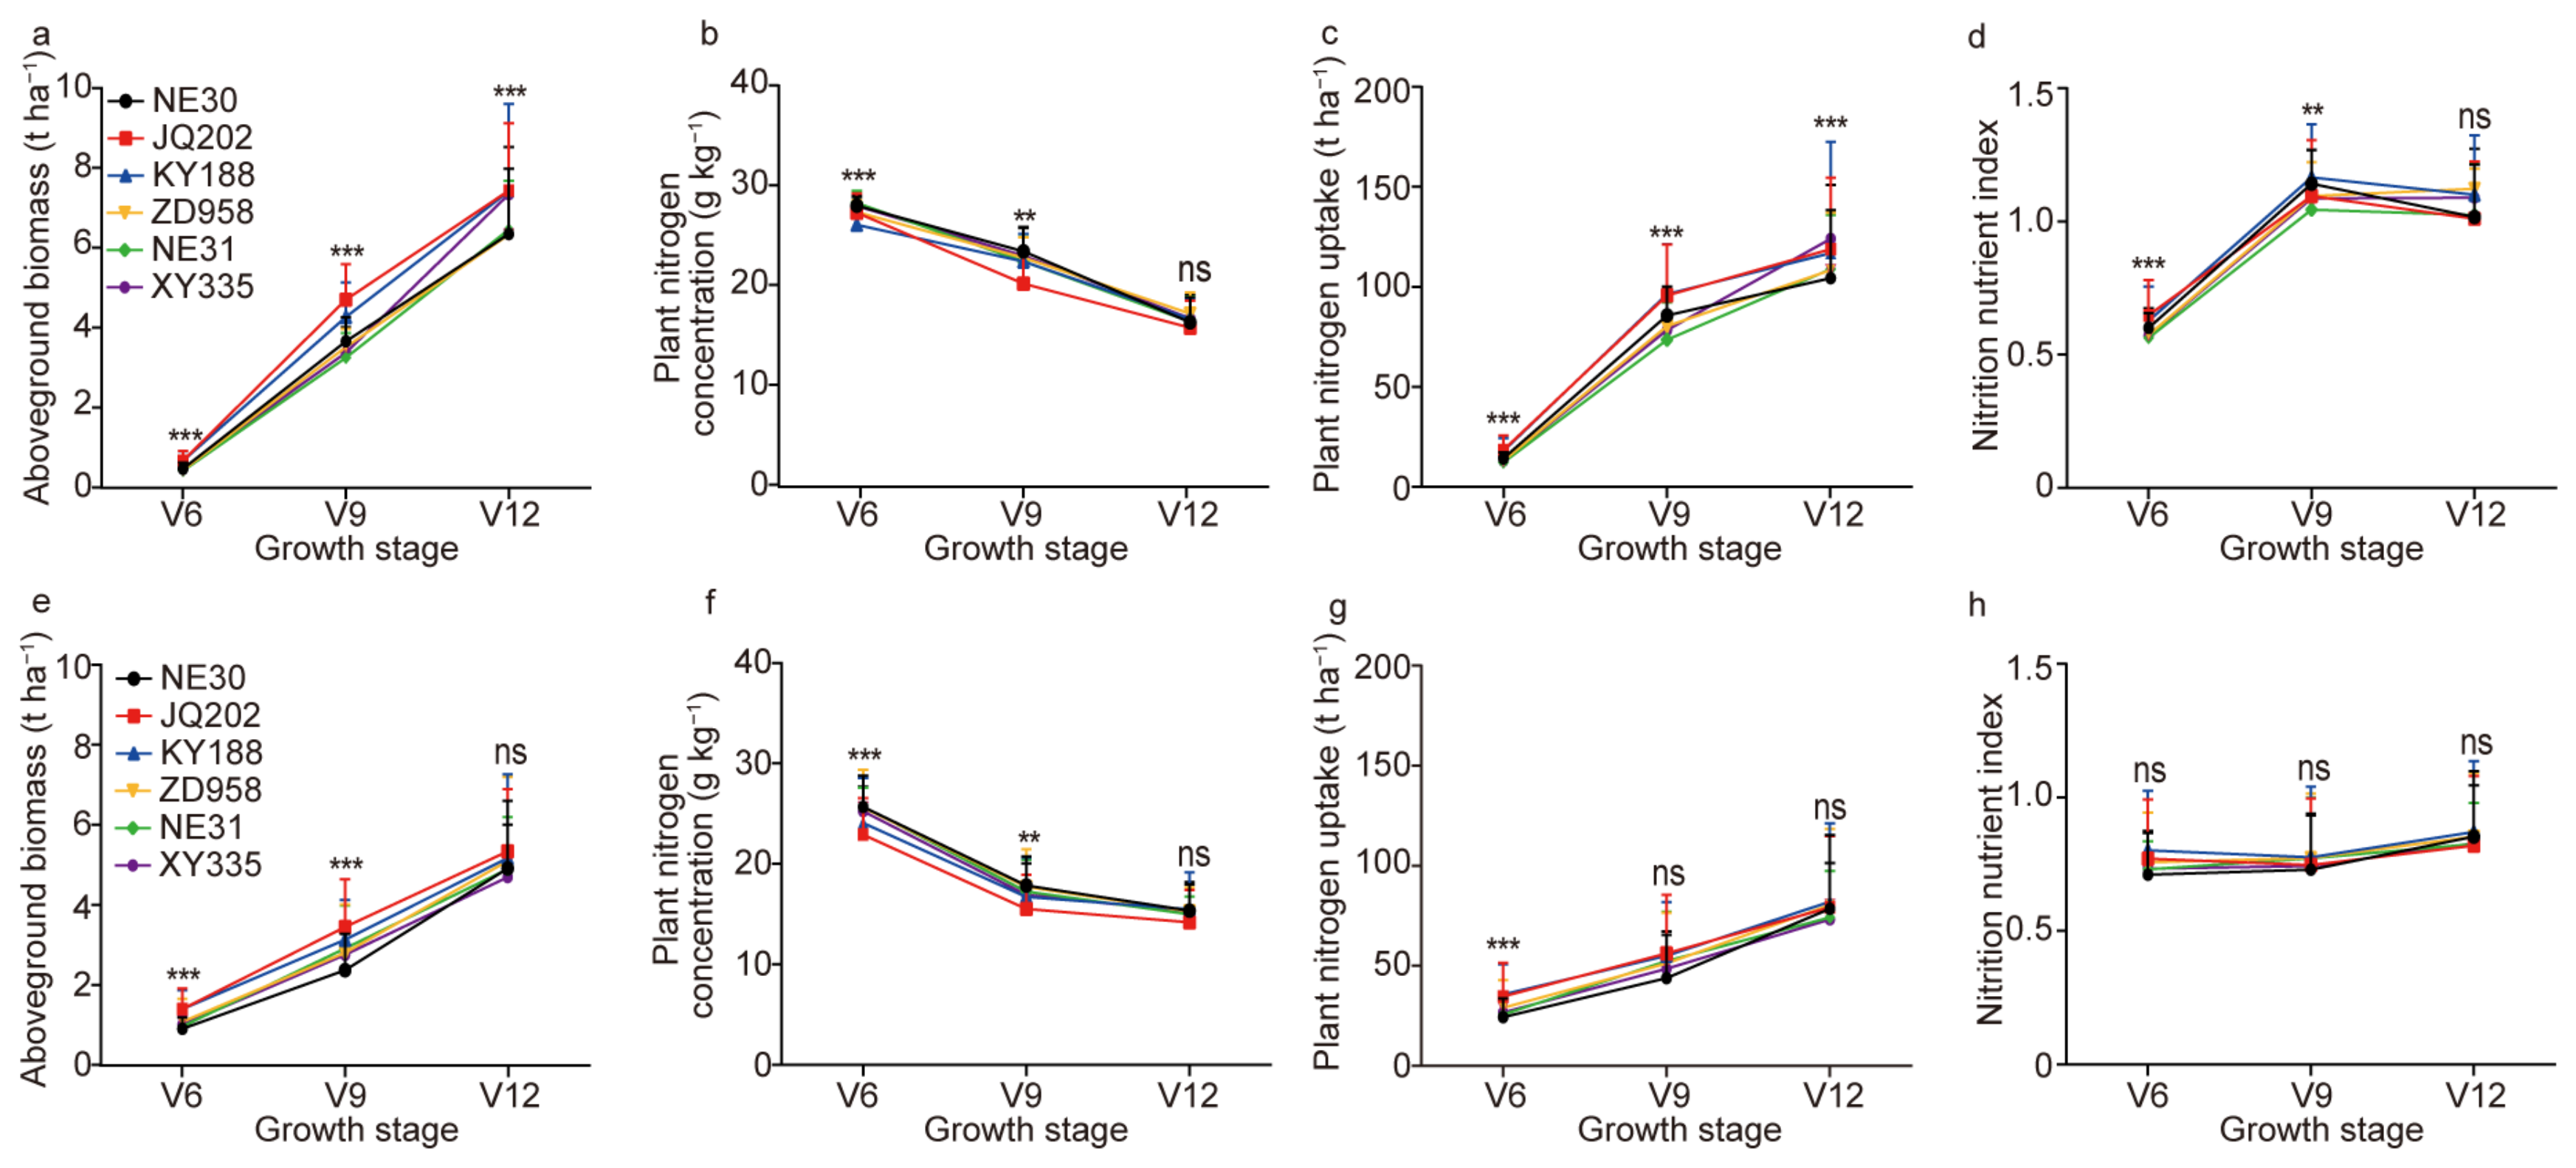
3.1. Variation in Maize Nitrogen Status Indicators and Yield

The ANOVA results showed that N rate and hybrid had significant effects on AGB, PNC, PNU, and NNI at different growth stages (Figure 1 and Figure 2). The interaction between N and hybrid had a minor effect on these traits (Table S4).
The AGB and PNC of the six hybrids increased with the N rate in 2018 and 2019. The AGB, PNC, PNU, and NNI were significantly different at N levels higher than N60 compared with N0 in 2018 (Figure 1a–d). This trend occurred at N rates equal to or above N120 in 2019 (Figure 1e–h). The six hybrids were significantly different at most growth stages in 2018 and 2019 (Figure 2a–h). The AGB, PNU, PNC, and NNI were significantly different among the hybrids at the V9 stage in 2018, but only AGB and PNC were significantly different among hybrids at the V9 stage in 2019 (Figure 2). Maize yield increased gradually from the N0 to the N60 level and reached a plateau at the N60 and N120 levels (Figure S4).
In summary, N and hybrid significantly affected plant N status indicators at different growth states. The V9 stage is the key stage for assessing N status because in-season side-dress N is usually applied around this stage.

3.2. NNI Threshold Values for Different Hybrids

In 2018, it was found that treatments with less than N60 had PNC values below the critical curve, the PNC values of N60 treatments were close to the curve, and the other points of PNC values were above the curve. In 2019, it was found that PNC values with N rates ≤ 60 kg ha−1 were below the curve, and treatments with N rates > 60 kg ha−1 had PNC values near the curve (Figure S3). These results suggested that the curve could be used under normal climatic conditions, but needed improvement under special climate conditions such as drought in 2019. Linear plus plateau analysis of NNI and relative yield showed that the NNI threshold values for different hybrids were 0.99 to 1.17 in 2018 and 0.60 to 0.71 in 2019 (Figure S4). ZD958 had the lowest threshold of 0.99, while XY335 had the highest threshold of 1.17 in 2018. JQ202 had the lowest threshold of 0.60, while ZD958 had the highest threshold of 0.71 in 2019. The average NNI threshold in 2018 was 40% higher than in 2019 (Figure S4).
The AONR was determined using the relationship between NNI and N rates for the six hybrids between 51 and 103 kg ha−1 in 2018, with an average of 74 kg ha−1 (Figure S5a). In 2019, the AONRs were between 76 and 112 kg ha−1, and 91 kg ha−1 on average (Figure S5b). Based on yield data at different N levels, the AONRs were between 62 and 94 kg ha−1 in 2018, with an average of 74 kg ha−1, and from 73 to 109 kg ha−1 in 2019, with an average of 85 kg ha−1 (Figure 3). The comparison of the linear model and non-linear model is shown in Table S5. The AONRs determined using these two methods were statistically significant, with R2 being 0.62 and 0.87 in 2018 and 2019, respectively (Figure 4). The KY188 hybrid had the lowest fertilizer demand and NE31 had the highest fertilizer demand.

3.3. Performance of the Random Forest Model for Estimating N Status Indicators

The ML analysis showed that models using the MS, GLCM, and GC information performed better than those using MS or the MS and GLCM average of two years, and the R2 was increased by 17.6% and 18.1%, respectively (Table 1). Therefore, the fusion of MS, GLCM, and GC using the RF model performed the best among the tested strategies for N status indicator prediction.
Detailed analysis of the NNI prediction models with six hybrids indicated that the R2 of the RF models was 0.72 on average in 2018 and 2019. The R2 for the RF-based NNI prediction models for each of the six cultivars varied from 0.78 to 0.98 (Figure 5a,b). The areal agreement based on the RF model was 89% in both 2018 and 2019 and the kappa statistics were 0.82 and 0.85 in 2018 and 2019, respectively.

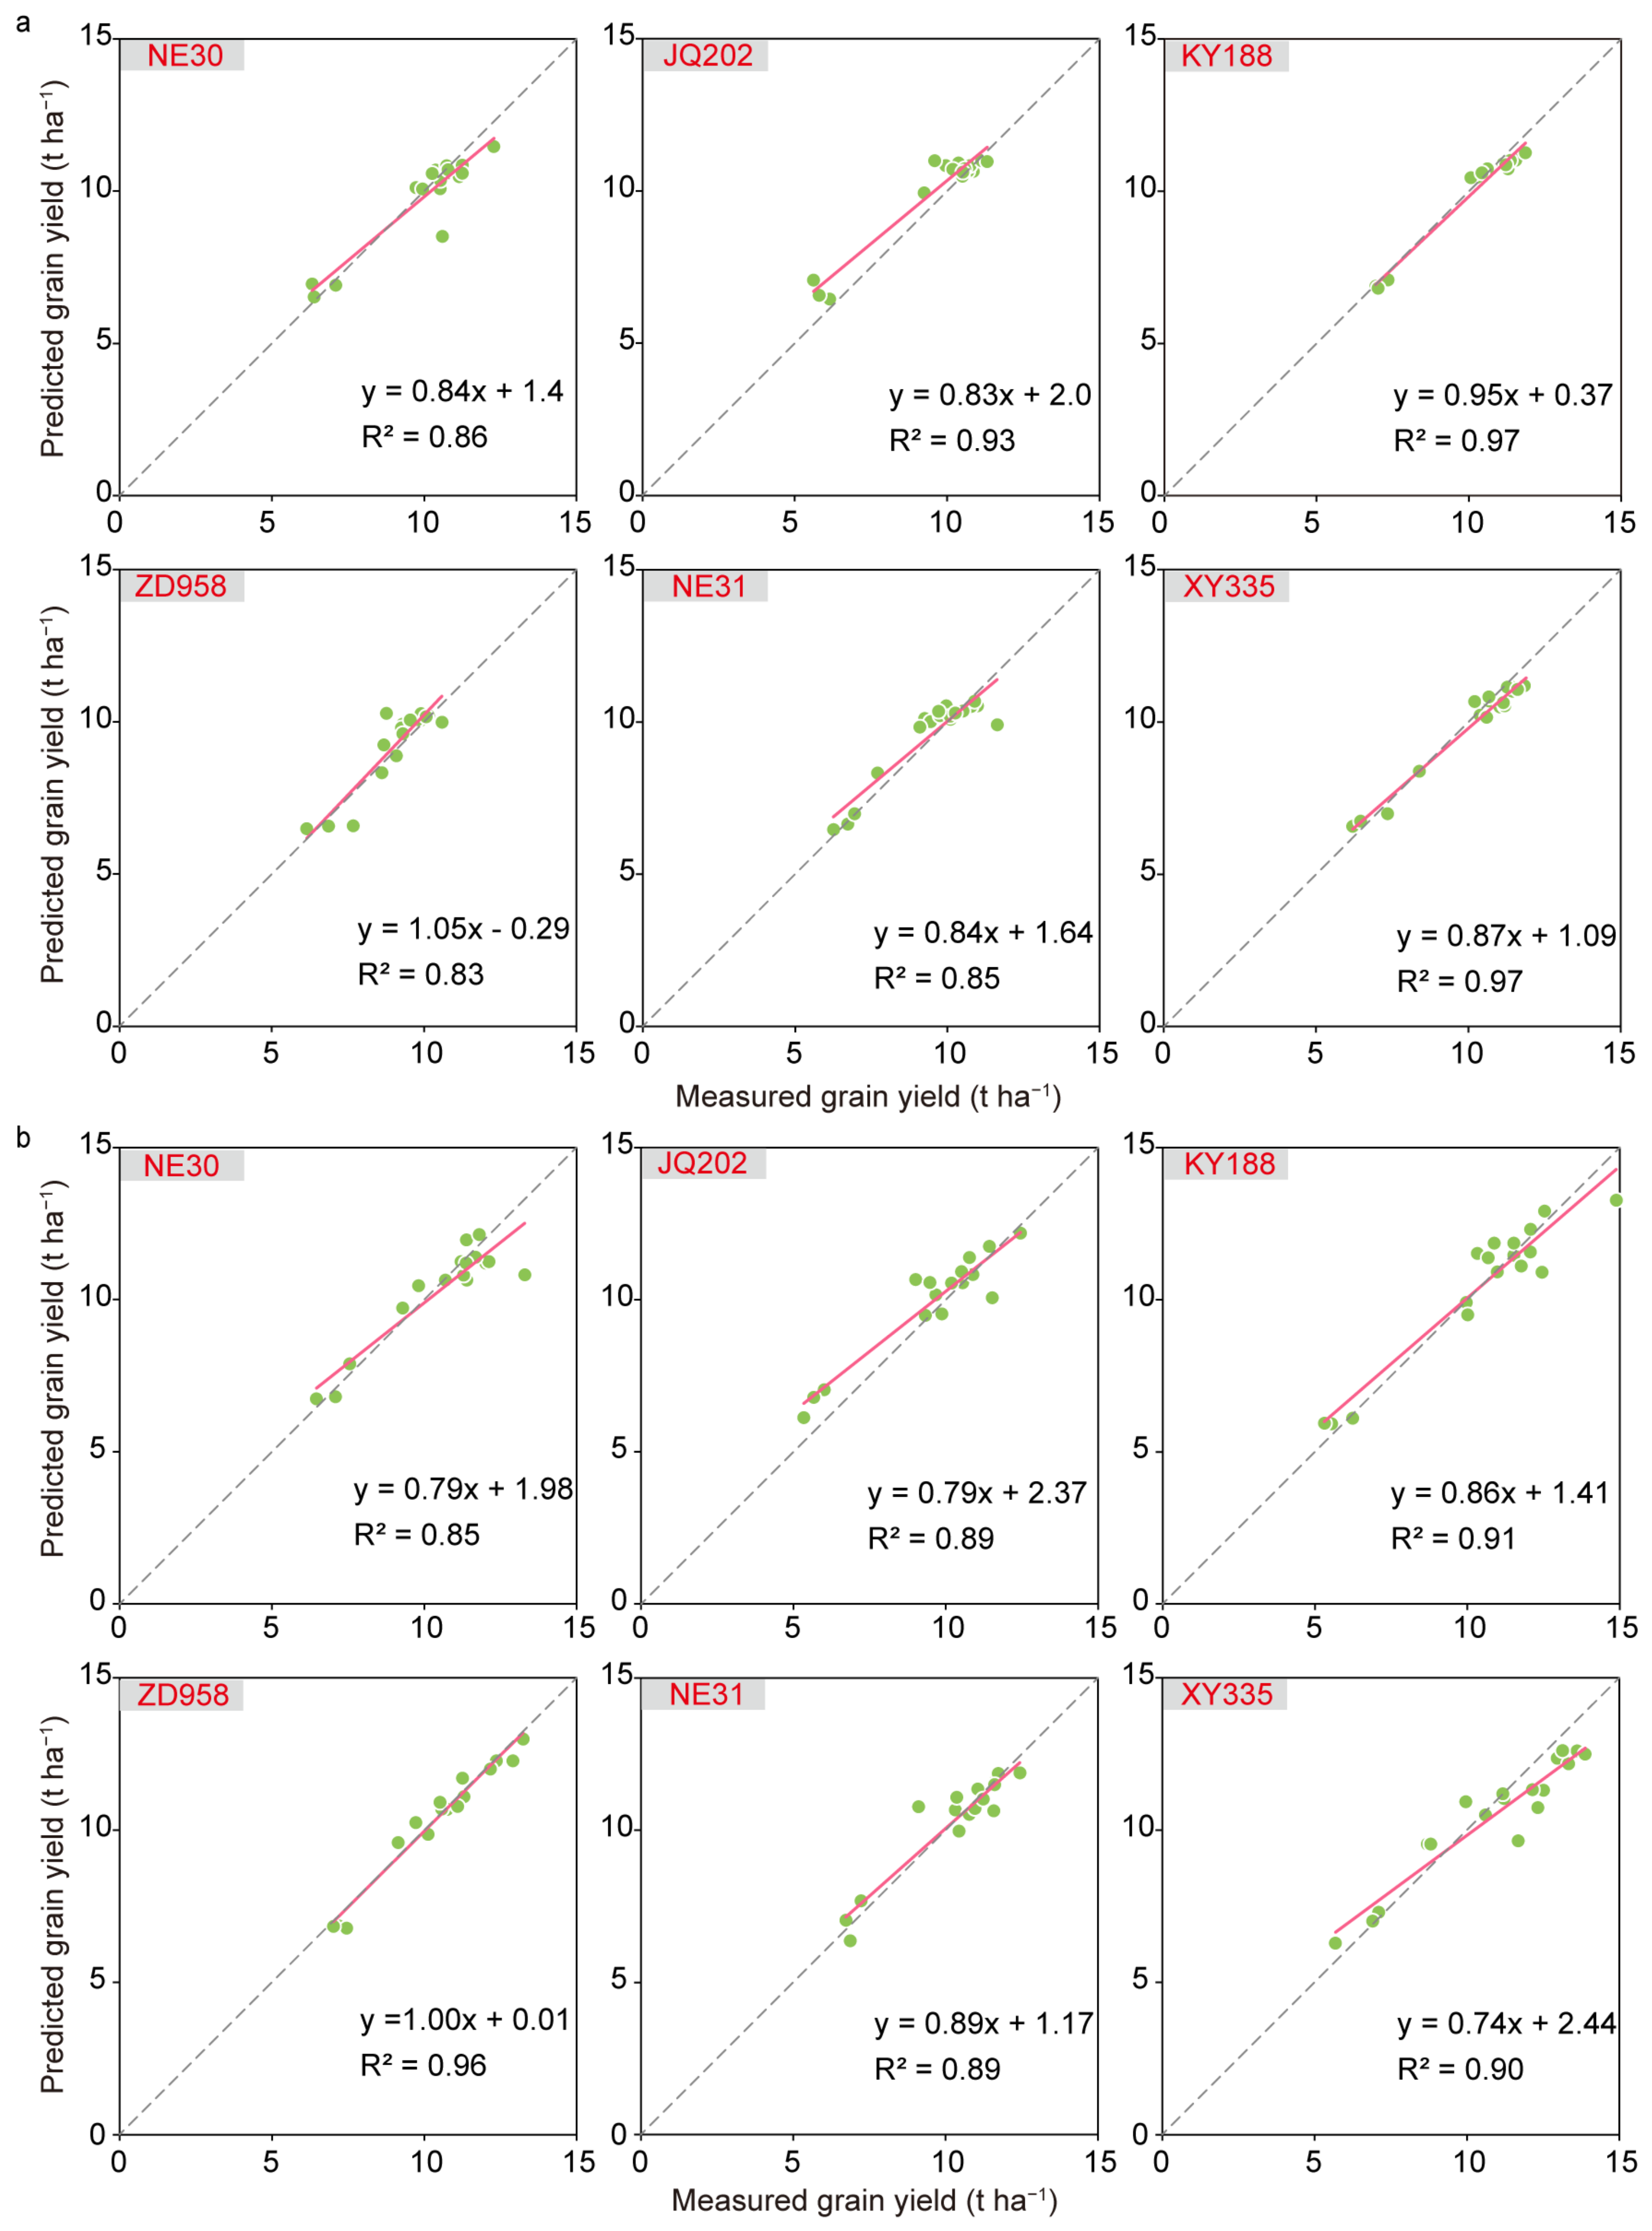
3.4. Performance of the RF Model for Yield Prediction

The ML models performed quite well in predicting maize yield, with R2 ≥ 0.66 (Table 1). The RF model combined with multi-spectral data fusion (MS+GLCM+GC) performed slightly better in 2018 (R2 = 0.77; RMSE = 8.6%) than in 2019 (R2 = 0.73; RMSE = 10.8%). Hybrid-specific analysis indicated that the R2 of the RF models for different hybrids at the V9 stage ranged from 0.82 to 0.96, and there were significant differences among hybrids in 2018 (Figure 6a). The best relationship was observed for KY188 with an R2 of 0.94 and the worst was for NE30 with an R2 of 0.86 in 2019 (Figure 6b).

3.5. Diagnosis of N Nutrition Status at the Field Scale

The N status diagnosis map is based on data at the V9 stage. The NNI calculated by the nitrogen dilution curve has a significant response to different nitrogen treatments. It received about 1 in the N60 treatment in 2018 (Figure 7a) and 0.71 in 2019 (Figure 7b). The NNI estimated based on remote sensing data (Figure 7c,d) shows the same trend among different nitrogen treatments compared to measured NNI.

3.6. Evaluation of the AONR Determination Based on the RF Model Estimation of NNI and Yield

The AONR based on the RF model estimated yield was significantly related to the AONR based on measured yield (R2 = 0.68, in 2018; R2 = 0.54, in 2019; Figure 8a,b), with about 92% of the points within the error range of 20% of the measured AONR (2018, RMSE = 9.9 kg ha−1; 2019, RMSE = 8.1 kg ha−1) (Figure 8a,b). Moreover, the AONR based on the RF-model-predicted NNI was also significantly related to the AONR based on measured NNI (R2 = 0.70, in 2018; R2 = 0.71, in 2019; Figure 8c,d), with about 83% of the points within the error range of 20% of the measured AONR (2018, RMSE = 8.9 kg ha−1; 2019, RMSE = 14.3 kg ha−1) (Figure 8c,d). The R2 for the relationship between AONR calculated by simulated yield and NNI and AONR based on measured yield and NNI were 0.62 and 0.90, respectively (Table S6). These results indicated that it was feasible to diagnose N status and make N recommendations based on NNI and yield predicted using UAV data and the RF model.

4. Discussion

4.1. Hybrid Differences in NNI Threshold Values

NNI is a reliable indicator to diagnose crop N status, and the threshold of NNI is determined by the critical N dilution curve. The parameters of the curve vary by crop species [9]. For maize, several curves have been developed for different regions [51], and the construction of a critical N dilution curve is time-consuming and labor-intensive. The threshold value of NNI is usually set as 1, but it may vary among growth stages or varieties. In addition to using the standard NNI threshold value of 1, researchers have also determined the threshold NNI values for different varieties, climate conditions, or field management practices [10]. Chen et al. [52] suggested that NNI thresholds of 1.00 and 1.25 were suitable for the study area. Zhang et al. [53] reported that the NNI threshold for different varieties was variable (0.95–1.1).
In this study, the average NNI values of six hybrids were near 1 in 2018, and 0.74 in 2019 (Figure 2), and the NNI of the N60 treatment was near 1 in 2018, but 0.55 in 2019 (Figure 1). It turned out that the N status of different hybrids varied under the influence of weather conditions in different years. Therefore, there is a need to evaluate the NNI threshold values to diagnose N status more accurately. The NNI thresholds of different hybrids based on the relative yield ranged from 0.99 to 1.15 in 2018, but from 0.60 to 0.71 in 2019, being significantly lower than 1 (Figure S4). A serious drought at the V9 stage in 2019 drastically affected the PNU (Figure S2). In addition, the N requirements of different hybrids varied in this study, and they would have different NUEs. The results revealed that the AONR based on the NNI threshold was consistent with the fertilizer rate applied to obtain the maximum yield (Figure 4). These results indicated that the NNI threshold values established by this study could be used for effective diagnosis of maize N status.

4.2. UAV Remote Sensing Data Fusion Using Machine Learning for N Status Diagnosis

Compared with proximal sensors, UAV remote sensing has the advantages of real-time information collection, cost-effectiveness, and high spatial resolution [54]. It has been used for crop N status diagnosis [24] and yield prediction [55]. This study indicated that UAV remote-sensing-based ML models performed well in predicting maize NNI and yield (R2 = 0.40–0.81) (Table 1), confirming the findings of previous research.
With the development of spectroscopy technology, canopy spectral, structural, textural, and other related information has been used to predict plant N indicators and diagnose N nutrition [56]. Crop canopy spectrum and structure provide complementary data for yield prediction [57]. Canopy texture features can provide additional information related to structural features [58]. More studies have been trying to improve plant N status prediction through data fusion. Multiple spectral data fusion performed better than models using single spectral information. For example, researchers have combined plant height, canopy coverage, and vegetation index to predict rice yield [15]. Texture and thermal information can also be used in data fusion for yield prediction [28]. In this study, 22 canopy spectral variables were applied to predict crop AGB, NNI, and yield. In general, models using canopy spectral, structural, and textural data fusion performed better than models using a single source of data (Table 1). These results are consistent with previous research results [28]. The texture information is complementary to spectral, structural, and thermal data, thereby increasing crop trait predictions [59].
In the past, several statistical models using spectral indices have been applied to predict crop AGB, PNC, and yield [60,61], and ML methods have also been increasingly applied for the data analysis of remote sensing [62,63]. The relationships between vegetation indices and plant traits are generally nonlinear. ML models can consider both linear and nonlinear relationships and can improve the prediction of plant traits with spectral indices. So, the RF method has been applied to predict plant traits with spectral data [34,64]. More ML methods should be applied to improve plant N status prediction and diagnosis, like deep learning [65], or by combining remote sensing data with genetic, environmental, and management information [34].

4.3. Implications for Maize Management and Breeding

Nitrogen diagnosis is of great significance to crop N management. UAV remote sensing can be used for the detection of plant N deficiency and in-season N recommendation [33,60], which can improve agricultural sustainability [66]. This study determined the NNI threshold values of different hybrids based on the NNI and relative yield (Figure S5). The AONRs of these hybrids ranged from 63 kg ha−1 to 109 kg −1 in this study. That was significantly lower than the AONR based on a meta-analysis (from 146 kg ha−1 to 180 kg ha−1) [67]. This may be because of the N deposition in North China (47.1 kg N ha−1 yr−1) [68] and the maize monoculture model for consecutive years in the experimental area. Moreover, high-throughput UAV remote sensing data were used with the ML method for efficient NNI prediction and in-season N recommendation (Figure 5). This strategy can provide technical support for improving N status diagnosis and in-season N management in farm conditions.
The results of this study are also of great value to maize breeding [69]. The vegetation indices and other data based on the UAV images have great value for high-throughput phenotyping applications [70]. Canopy traits and vegetation indices have been used as predictors of LAI and the photosynthetic capacity of wheat [71]. This study demonstrated that UAV remote sensing can be used to predict maize AGB, PNC, PNU, NNI, and yield across different hybrids more efficiently. This will save time, labor, and cost in maize breeding.

5. Conclusions

The results showed that the NNI threshold values varied with years and maize hybrids, based on the linear plus plateau model analysis of relative yield and NNI. N status indicators were well estimated using UAV multi-source remote sensing data fusion with an RF regression model. Data fusion significantly improved the prediction of AGB and PNU but did not work better in the prediction of NNI and yield compared with using one source or two sources of UVA remote sensing data. The AONR values based on predicted NNI or yield for different maize hybrids using multi-source remote sensing data were similar to those based on measured NNI and yield. It is concluded that fusion data and using ML models can improve in-season maize N status diagnosis and N recommendation for different hybrids compared to only using spectral data. This method has the potential to improve N management in maize production and maize breeding.

Supplementary Materials

The following supporting information can be downloaded at: https://www.mdpi.com/article/10.3390/agronomy13081994/s1, Table S1. Basic physical and chemical properties (0–20 cm) of soil in 2018; Table S2. The hybrids information; Table S3. Definitions of the features extracted from different sensors; Table S4. ANOVA of aboveground measured traits; Table S5. The ANOVA analysis of linear and linear plus plateau model; Table S6. The AONR calculation by yield and NNI for 2018 and 2019; Figure S1. Information of experiment location. (a) The location of the experiment sites. (b) The experimental plot layout of different nitrogen rates; Figure S2. Daily precipitation information during the growing season. 2018 (a) and 2019 (b); Figure S3. Evaluation of the existing critical N dilution curve for spring maize in North China with measurement phenotype; Figure S4. Identification of the threshold of nitrogen nutrition index (NNI); Figure S5. The response of NNI to nitrogen application rate for each variety.

Author Contributions

Methodology, J.L., W.R. and H.Z.; Formal analysis, J.L. and W.R.; Investigation, J.L., X.L., X.W., C.H., J.S. and M.Z.; Data curation, J.L., W.R., X.L., H.Z. and C.H.; Writing—original draft, J.L.; Writing—review & editing, G.M., Y.M. and Q.P.; Supervision, F.C., Y.M. and Q.P.; Project administration, F.C., Y.M. and Q.P.; Funding acquisition, F.C. and Q.P. All authors have read and agreed to the published version of the manuscript.

Funding

This work was financially supported by the National Key Research and Development Program of China (2021YFD1200704, 2022YFD1900701), and the National Natural Science Foundation of China (31971948, 31972485).

Data Availability Statement

The UAV images and R codes in this study are freely available. These data may be obtained from the corresponding author.

Conflicts of Interest

The authors declare no conflict of interest.

References

  1. FAO. Free Access to Food and Agriculture Statistics. Available online: http://www.fao.org (accessed on 30 June 2019).
  2. Ju, X.-T.; Xing, G.-X.; Chen, X.-P.; Zhang, S.-L.; Zhang, L.-J.; Liu, X.-J.; Cui, Z.-L.; Yin, B.; Christie, P.; Zhu, Z.-L.; et al. Reducing environmental risk by improving N management in intensive Chinese agricultural systems. Proc. Natl. Acad. Sci. USA 2009, 106, 3041–3046. [Google Scholar] [CrossRef] [PubMed]
  3. Chen, F.; Liu, J.; Liu, Z.; Chen, Z.; Ren, W.; Gong, X.; Wang, L.; Cai, H.; Pan, Q.; Yuan, L.; et al. Breeding for high-yield and nitrogen use efficiency in maize: Lessons from comparison between Chinese and US cultivars. Adv. Agron. 2021, 166, 251–275. [Google Scholar] [CrossRef]
  4. Hartmann, T.E.; Yue, S.; Schulz, R.; He, X.; Chen, X.; Zhang, F.; Müller, T. Yield and N use efficiency of a maize–wheat cropping system as affected by different fertilizer management strategies in a farmer’s field of the North China Plain. Field Crops Res. 2015, 174, 30–39. [Google Scholar] [CrossRef]
  5. Cao, Q.; Miao, Y.; Feng, G.; Gao, X.; Liu, B.; Liu, Y.; Li, F.; Khosla, R.; Mulla, D.J.; Zhang, F. Improving nitrogen use efficiency with minimal environmental risks using an active canopy sensor in a wheat-maize cropping system. Field Crops Res. 2017, 214, 365–372. [Google Scholar] [CrossRef]
  6. Wang, S.; Yang, L.; Su, M.; Ma, X.; Sun, Y.; Yang, M.; Zhao, P.; Shen, J.; Zhang, F.; Goulding, K.; et al. Increasing the agricultural, environmental and economic benefits of farming based on suitable crop rotations and optimum fertilizer applications. Field Crops Res. 2019, 240, 78–85. [Google Scholar] [CrossRef]
  7. Quemada, M.; Gabriel, J.L.; Zarco-Tejada, P. Airborne Hyperspectral Images and Ground-Level Optical Sensors as Assessment Tools for Maize Nitrogen Fertilization. Remote Sens. 2014, 6, 2940–2962. [Google Scholar] [CrossRef]
  8. Yao, Y.; Miao, Y.; Cao, Q.; Wang, H.; Gnyp, M.L.; Bareth, G.; Khosla, R.; Yang, W.; Liu, F.; Liu, C. In-Season Estimation of Rice Nitrogen Status with an Active Crop Canopy Sensor. IEEE J. Sel. Top. Appl. Earth Obs. Remote Sens. 2014, 7, 4403–4413. [Google Scholar] [CrossRef]
  9. Lemaire, G.; Jeuffroy, M.; Gastal, F. Diagnosis tool for plant and crop N status in vegetative stage. Eur. J. Agron. 2008, 28, 614–624. [Google Scholar] [CrossRef]
  10. Xia, T.; Miao, Y.; Wu, D.; Shao, H.; Khosla, R.; Mi, G. Active Optical Sensing of Spring Maize for In-Season Diagnosis of Nitrogen Status Based on Nitrogen Nutrition Index. Remote Sens. 2016, 8, 605. [Google Scholar] [CrossRef]
  11. Zhao, B.; Duan, A.; Ata-Ul-Karim, S.T.; Liu, Z.; Chen, Z.; Gong, Z.; Zhang, J.; Xiao, J.; Liu, Z.; Qin, A.; et al. Exploring new spectral bands and vegetation indices for estimating nitrogen nutrition index of summer maize. Eur. J. Agron. 2018, 93, 113–125. [Google Scholar] [CrossRef]
  12. Dong, R.; Miao, Y.; Wang, X.; Chen, Z.; Yuan, F.; Zhang, W.; Li, H. Estimating Plant Nitrogen Concentration of Maize using a Leaf Fluorescence Sensor across Growth Stages. Remote Sens. 2020, 12, 1139. [Google Scholar] [CrossRef]
  13. Huang, S.; Miao, Y.; Zhao, G.; Yuan, F.; Ma, X.; Tan, C.; Yu, W.; Gnyp, M.L.; Lenz-Wiedemann, V.I.; Rascher, U.; et al. Satellite Remote Sensing-Based In-Season Diagnosis of Rice Nitrogen Status in Northeast China. Remote Sens. 2015, 7, 10646–10667. [Google Scholar] [CrossRef]
  14. Fabbri, C.; Mancini, M.; Marta, A.D.; Orlandini, S.; Napoli, M. Integrating satellite data with a Nitrogen Nutrition Curve for precision top-dress fertilization of durum wheat. Eur. J. Agron. 2020, 120, 126148. [Google Scholar] [CrossRef]
  15. Wan, L.; Cen, H.; Zhu, J.; Zhang, J.; Zhu, Y.; Sun, D.; Du, X.; Zhai, L.; Weng, H.; Li, Y.; et al. Grain yield prediction of rice using multi-temporal UAV-based RGB and multispectral images and model transfer—A case study of small farmlands in the South of China. Agric. For. Meteorol. 2020, 291, 108096. [Google Scholar] [CrossRef]
  16. Floreano, D.; Wood, R.J. Science, technology and the future of small autonomous drones. Nature 2015, 521, 460–466. [Google Scholar] [CrossRef]
  17. Qiao, L.; Gao, D.; Zhang, J.; Li, M.; Sun, H.; Ma, J. Dynamic Influence Elimination and Chlorophyll Content Diagnosis of Maize Using UAV Spectral Imagery. Remote Sens. 2020, 12, 2650. [Google Scholar] [CrossRef]
  18. Caturegli, L.; Corniglia, M.; Gaetani, M.; Grossi, N.; Magni, S.; Migliazzi, M.; Angelini, L.; Mazzoncini, M.; Silvestri, N.; Fontanelli, M.; et al. Unmanned Aerial Vehicle to Estimate Nitrogen Status of Turfgrasses. PLoS ONE 2016, 11, e0158268. [Google Scholar] [CrossRef]
  19. Du, M.; Noguchi, N. Monitoring of Wheat Growth Status and Mapping of Wheat Yield’s within-Field Spatial Variations Using Color Images Acquired from UAV-camera System. Remote Sens. 2017, 9, 289. [Google Scholar] [CrossRef]
  20. Bendig, J.; Bolten, A.; Bennertz, S.; Broscheit, J.; Eichfuss, S.; Bareth, G. Estimating Biomass of Barley Using Crop Surface Models (CSMs) Derived from UAV-Based RGB Imaging. Remote Sens. 2014, 6, 10395–10412. [Google Scholar] [CrossRef]
  21. Sun, B.; Wang, C.; Yang, C.; Xu, B.; Zhou, G.; Li, X.; Xie, J.; Xu, S.; Liu, B.; Xie, T.; et al. Retrieval of rapeseed leaf area index using the PROSAIL model with canopy coverage derived from UAV images as a correction parameter. Int. J. Appl. Earth Obs. Geoinf. 2021, 102, 102373. [Google Scholar] [CrossRef]
  22. Geipel, J.; Link, J.; Claupein, W. Combined Spectral and Spatial Modeling of Corn Yield Based on Aerial Images and Crop Surface Models Acquired with an Unmanned Aircraft System. Remote Sens. 2014, 6, 10335–10355. [Google Scholar] [CrossRef]
  23. Wang, F.; Yi, Q.; Hu, J.; Xie, L.; Yao, X.; Xu, T.; Zheng, J. Combining spectral and textural information in UAV hyperspectral images to estimate rice grain yield. Int. J. Appl. Earth Obs. Geoinf. 2021, 102, 102397. [Google Scholar] [CrossRef]
  24. Zheng, H.; Cheng, T.; Li, D.; Yao, X.; Tian, Y.; Cao, W.; Zhu, Y. Combining Unmanned Aerial Vehicle (UAV)-Based Multispectral Imagery and Ground-Based Hyperspectral Data for Plant Nitrogen Concentration Estimation in Rice. Front. Plant Sci. 2018, 9, 936. [Google Scholar] [CrossRef] [PubMed]
  25. Li, D.; Gu, X.; Pang, Y.; Chen, B.; Liu, L. Estimation of Forest Aboveground Biomass and Leaf Area Index Based on Digital Aerial Photograph Data in Northeast China. Forests 2018, 9, 275. [Google Scholar] [CrossRef]
  26. Lu, B.; He, Y.; Liu, H.H.T. Mapping vegetation biophysical and biochemical properties using unmanned aerial vehicles-acquired imagery. Int. J. Remote Sens. 2017, 39, 5265–5287. [Google Scholar] [CrossRef]
  27. Fu, Y.; Yang, G.; Li, Z.; Song, X.; Li, Z.; Xu, X.; Wang, P.; Zhao, C. Winter Wheat Nitrogen Status Estimation Using UAV-Based RGB Imagery and Gaussian Processes Regression. Remote Sens. 2020, 12, 3778. [Google Scholar] [CrossRef]
  28. Maimaitijiang, M.; Sagan, V.; Sidike, P.; Hartling, S.; Esposito, F.; Fritschi, F.B. Soybean yield prediction from UAV using multimodal data fusion and deep learning. Remote Sens. Environ. 2019, 237, 111599. [Google Scholar] [CrossRef]
  29. Chlingaryan, A.; Sukkarieh, S.; Whelan, B. Machine learning approaches for crop yield prediction and nitrogen status estimation in precision agriculture: A review. Comput. Electron. Agric. 2018, 151, 61–69. [Google Scholar] [CrossRef]
  30. Han, L.; Yang, G.; Dai, H.; Xu, B.; Yang, H.; Feng, H.; Li, Z.; Yang, X. Modeling maize above-ground biomass based on machine learning approaches using UAV remote-sensing data. Plant Methods 2019, 15, 10. [Google Scholar] [CrossRef]
  31. Kayad, A.; Sozzi, M.; Gatto, S.; Whelan, B.; Sartori, L.; Marinello, F. Ten years of corn yield dynamics at field scale under digital agriculture solutions: A case study from North Italy. Comput. Electron. Agric. 2021, 185, 106126. [Google Scholar] [CrossRef]
  32. Zha, H.; Miao, Y.; Wang, T.; Li, Y.; Zhang, J.; Sun, W.; Feng, Z.; Kusnierek, K. Improving Unmanned Aerial Vehicle Remote Sensing-Based Rice Nitrogen Nutrition Index Prediction with Machine Learning. Remote Sens. 2020, 12, 215. [Google Scholar] [CrossRef]
  33. Ransom, C.J.; Kitchen, N.R.; Camberato, J.J.; Carter, P.R.; Ferguson, R.B.; Fernández, F.G.; Franzen, D.W.; Laboski, C.A.; Myers, D.B.; Nafziger, E.D.; et al. Statistical and machine learning methods evaluated for incorporating soil and weather into corn nitrogen recommendations. Comput. Electron. Agric. 2019, 164, 104872. [Google Scholar] [CrossRef]
  34. Li, D.; Miao, Y.; Ransom, C.J.; Bean, G.M.; Kitchen, N.R.; Fernández, F.G.; Sawyer, J.E.; Camberato, J.J.; Carter, P.R.; Ferguson, R.B.; et al. Corn Nitrogen Nutrition Index Prediction Improved by Integrating Genetic, Environmental, and Management Factors with Active Canopy Sensing Using Machine Learning. Remote Sens. 2022, 14, 394. [Google Scholar] [CrossRef]
  35. Li, M.; He, S.; Wang, J.; Liu, Z.; Xie, G.H. An NIRS-based assay of chemical composition and biomass digestibility for rapid selection of Jerusalem artichoke clones. Biotechnol. Biofuels 2018, 11, 334. [Google Scholar] [CrossRef]
  36. Liang, X.-G.; Zhang, J.-T.; Zhou, L.-L.; Li, X.-H.; Zhou, S.-L. Critical Nitrogen Dilution Curve and Nitrogen Nutrition Index for Summer-Maize in North China Plain. Acta Agron. Sin. 2013, 39, 292. [Google Scholar] [CrossRef]
  37. Tucker, C.J. Red and photographic infrared linear combinations for monitoring vegetation. Remote Sens. Environ. 1979, 8, 127–150. [Google Scholar] [CrossRef]
  38. Gitelson, A.A.; Kaufman, Y.J.; Merzlyak, M.N. Use of a green channel in remote sensing of global vegetation from EOS-MODIS. Remote Sens. Environ. 1996, 58, 289–298. [Google Scholar] [CrossRef]
  39. Cao, Q.; Miao, Y.; Wang, H.; Huang, S.; Cheng, S.; Khosla, R.; Jiang, R. Non-destructive estimation of rice plant nitrogen status with Crop Circle multispectral active canopy sensor. Field Crops Res. 2013, 154, 133–144. [Google Scholar] [CrossRef]
  40. Lu, J.; Miao, Y.; Shi, W.; Li, J.; Yuan, F. Evaluating different approaches to non-destructive nitrogen status diagnosis of rice using portable RapidSCAN active canopy sensor. Sci. Rep. 2017, 7, 14073. [Google Scholar] [CrossRef]
  41. Rouse, J.W.J.; Haas, R.H.; Schell, J.A.; Deering, D.W. Monitoring vegetation systems in the Great Plains with ERTS. In Proceedings of the Third ERTS Symphony, Colombia, WA, USA, 1 January 1974; pp. 309–317. [Google Scholar]
  42. Roujean, J.-L.; Breon, F.-M. Estimating PAR absorbed by vegetation from bidirectional reflectance measurements. Remote Sens. Environ. 1995, 51, 375–384. [Google Scholar] [CrossRef]
  43. Gitelson, A.A.; Merzlyak, M.N. Remote estimation of chlorophyll content in higher plant leaves. Int. J. Remote Sens. 1997, 18, 2691–2697. [Google Scholar] [CrossRef]
  44. Dash, J.; Curran, P. The MERIS terrestrial chlorophyll index. Int. J. Remote Sens. 2004, 25, 5403–5413. [Google Scholar] [CrossRef]
  45. Erdle, K.; Mistele, B.; Schmidhalter, U. Comparison of active and passive spectral sensors in discriminating biomass parameters and nitrogen status in wheat cultivars. Field Crops Res. 2011, 124, 74–84. [Google Scholar] [CrossRef]
  46. Torres-Sánchez, J.; Peña, J.M.; de Castro, A.I.; López-Granados, F. Multi-temporal mapping of the vegetation fraction in early-season wheat fields using images from UAV. Comput. Electron. Agric. 2014, 103, 104–113. [Google Scholar] [CrossRef]
  47. Haralick, R.M.; Shanmugam, K.; Dinstein, I.H. Textural Features for Image Classification. IEEE Trans. Syst. Man Cybern. 1973, 6, 610–621. [Google Scholar] [CrossRef]
  48. Yu, N.; Li, L.; Schmitz, N.; Tian, L.F.; Greenberg, J.A.; Diers, B.W. Development of methods to improve soybean yield estimation and predict plant maturity with an unmanned aerial vehicle based platform. Remote Sens. Environ. 2016, 187, 91–101. [Google Scholar] [CrossRef]
  49. Liaw, A.; Wiener, M. Classification and regression by Random Forest. R News 2002, 2, 18–22. [Google Scholar]
  50. Hornung, A.; Khosla, R.; Reich, R.; Inman, D.; Westfall, D.G. Comparison of Site-Specific Management Zones: Soil-Color-Based and Yield-Based. Agron. J. 2006, 98, 407–415. [Google Scholar] [CrossRef]
  51. Ciampitti, I.A.; Fernandez, J.; Tamagno, S.; Zhao, B.; Lemaire, G.; Makowski, D. Does the critical N dilution curve for maize crop vary across genotype × environment × management scenarios? A Bayesian analysis. Eur. J. Agron. 2020, 123, 126202. [Google Scholar] [CrossRef]
  52. Chen, Z.; Miao, Y.; Lu, J.; Zhou, L.; Li, Y.; Zhang, H.; Lou, W.; Zhang, Z.; Kusnierek, K.; Liu, C. In-Season Diagnosis of Winter Wheat Nitrogen Status in Smallholder Farmer Fields Across a Village Using Unmanned Aerial Vehicle-Based Remote Sensing. Agronomy 2019, 9, 619. [Google Scholar] [CrossRef]
  53. Zhang, K.; Wang, X.; Wang, X.; Tahir Ata-Ul-Karim, S.; Tian, Y.; Zhu, Y.; Cao, W.; Liu, X. Does the Organ-Based N Dilution Curve Improve the Predictions of N Status in Winter Wheat? Agriculture 2020, 10, 500. [Google Scholar] [CrossRef]
  54. Maes, W.H.; Steppe, K. Perspectives for Remote Sensing with Unmanned Aerial Vehicles in Precision Agriculture. Trends Plant Sci. 2019, 24, 152–164. [Google Scholar] [CrossRef]
  55. Zhou, X.; Zheng, H.B.; Xu, X.Q.; He, J.Y.; Ge, X.K.; Yao, X.; Cheng, T.; Zhu, Y.; Cao, W.X.; Tian, Y.C. Predicting grain yield in rice using multi-temporal vegetation indices from UAV-based multispectral and digital imagery. ISPRS J. Photogramm. Remote Sens. 2017, 130, 246–255. [Google Scholar] [CrossRef]
  56. Maresma, Á.; Ariza, M.; Martínez, E.; Lloveras, J.; Martínez-Casasnovas, J.A. Analysis of Vegetation Indices to Determine Nitrogen Application and Yield Prediction in Maize (Zea mays L.) from a Standard UAV Service. Remote Sens. 2016, 8, 973. [Google Scholar] [CrossRef]
  57. Rischbeck, P.; Elsayed, S.; Mistele, B.; Barmeier, G.; Heil, K.; Schmidhalter, U. Data fusion of spectral, thermal and canopy height parameters for improved yield prediction of drought stressed spring barley. Eur. J. Agron. 2016, 78, 44–59. [Google Scholar] [CrossRef]
  58. Colombo, R.; Bellingeri, D.; Fasolini, D.; Marino, C.M. Retrieval of leaf area index in different vegetation types using high resolution satellite data. Remote Sens. Environ. 2003, 86, 120–131. [Google Scholar] [CrossRef]
  59. Pelizari, P.A.; Spröhnle, K.; Geiß, C.; Schoepfer, E.; Plank, S.; Taubenböck, H. Multi-sensor feature fusion for very high spatial resolution built-up area extraction in temporary settlements. Remote Sens. Environ. 2018, 209, 793–807. [Google Scholar] [CrossRef]
  60. Moghimi, A.; Pourreza, A.; Zuniga-Ramirez, G.; Williams, L.E.; Fidelibus, M.W. A Novel Machine Learning Approach to Estimate Grapevine Leaf Nitrogen Concentration Using Aerial Multispectral Imagery. Remote Sens. 2020, 12, 3515. [Google Scholar] [CrossRef]
  61. Liang, T.; Duan, B.; Luo, X.; Ma, Y.; Yuan, Z.; Zhu, R.; Peng, Y.; Gong, Y.; Fang, S.; Wu, X. Identification of High Nitrogen Use Efficiency Phenotype in Rice (Oryza sativa L.) Through Entire Growth Duration by Unmanned Aerial Vehicle Multispectral Imagery. Front. Plant Sci. 2021, 12, 740414. [Google Scholar] [CrossRef]
  62. Wieland, M.; Pittore, M. Performance Evaluation of Machine Learning Algorithms for Urban Pattern Recognition from Multi-spectral Satellite Images. Remote Sens. 2014, 6, 2912–2939. [Google Scholar] [CrossRef]
  63. Hrisko, J.; Ramamurthy, P.; Gonzalez, J.E. Estimating heat storage in urban areas using multispectral satellite data and machine learning. Remote Sens. Environ. 2020, 252, 112125. [Google Scholar] [CrossRef]
  64. Fletcher, R.S.; Reddy, K. Random forest and leaf multispectral reflectance data to differentiate three soybean varieties from two pigweeds. Comput. Electron. Agric. 2016, 128, 199–206. [Google Scholar] [CrossRef]
  65. Schwalbert, R.A.; Amado, T.; Corassa, G.; Pott, L.P.; Prasad, P.; Ciampitti, I.A. Satellite-based soybean yield forecast: Integrating machine learning and weather data for improving crop yield prediction in southern Brazil. Agric. For. Meteorol. 2020, 284, 107886. [Google Scholar] [CrossRef]
  66. Iatrou, M.; Karydas, C.; Iatrou, G.; Pitsiorlas, I.; Aschonitis, V.; Raptis, I.; Mpetas, S.; Kravvas, K.; Mourelatos, S. Topdressing Nitrogen Demand Prediction in Rice Crop Using Machine Learning Systems. Agriculture 2021, 11, 312. [Google Scholar] [CrossRef]
  67. Liu, B.-Y.; Lin, B.-J.; Li, X.-X.; Virk, A.L.; Yves, B.N.; Zhao, X.; Dang, Y.P.; Zhang, H.-L. Appropriate farming practices of summer maize in the North China Plain: Reducing nitrogen use to promote sustainable agricultural development. Resour. Conserv. Recycl. 2021, 175, 105889. [Google Scholar] [CrossRef]
  68. Wen, Z.; Xu, W.; Li, Q.; Han, M.; Tang, A.; Zhang, Y.; Luo, X.; Shen, J.; Wang, W.; Li, K.; et al. Changes of nitrogen deposition in China from 1980 to 2018. Environ. Int. 2020, 144, 106022. [Google Scholar] [CrossRef]
  69. Shu, M.; Shen, M.; Zuo, J.; Yin, P.; Wang, M.; Xie, Z.; Tang, J.; Wang, R.; Li, B.; Yang, X.; et al. The Application of UAV-Based Hyperspectral Imaging to Estimate Crop Traits in Maize Inbred Lines. Plant Phenom. 2021, 2021, 9890745. [Google Scholar] [CrossRef]
  70. Grzybowski, M.; Wijewardane, N.K.; Atefi, A.; Ge, Y.; Schnable, J.C. Hyperspectral reflectance-based phenotyping for quantitative genetics in crops: Progress and challenges. Plant Commun. 2021, 2, 100209. [Google Scholar] [CrossRef]
  71. Jiang, L.; Sun, L.; Ye, M.; Wang, J.; Wang, Y.; Bogard, M.; Lacaze, X.; Fournier, A.; Beauchêne, K.; Gouache, D.; et al. Functional mapping of N deficiency-induced response in wheat yield-component traits by implementing high-throughput phenotyping. Plant J. 2019, 97, 1105–1119. [Google Scholar] [CrossRef]
Figure 1. Measured nitrogen status indicators of different nitrogen rates and growth stages in 2018 (ad) and 2019 (eh). The mean and standard deviation are shown (n = 18). The label “N” refers to the nitrogen treatments. **, p < 0.01; ***, p < 0.001.
Agronomy 13 01994 g001
Figure 2. Measured nitrogen status indicators of different hybrids and growth stages in 2018 (ad) and 2019 (eh). The mean and standard deviation are shown (n = 18). ns, p > 0.05; **, p < 0.01; ***, p < 0.001.
Agronomy 13 01994 g002
Figure 3. Identification of different AONRs based on yield for different varieties in 2018 (a) and 2019 (b). AONR is the optimal nitrogen application rate. The inflection point of the linear plus platform equation is defined as the AONR. ***, p < 0.001.
Agronomy 13 01994 g003
Figure 4. The relationships between the agronomic optimal nitrogen rate (AONR) from measured NNI and measured yield in 2018 (a) and 2019 (b). The AONR from the measured NNI is based on the nutrition index and relative yield. The AONR from the measured yield is obtained from the linear addition platform of the yield of different nitrogen rates. Red solid line: regression line; gray solid line: 1:1 line; gray dotted lines: ±20% lines; dots of different colors: data of each hybrid.
Agronomy 13 01994 g004
Figure 5. Validation of NNI prediction based on the RF model at the V9 stage in 2018 (a) and 2019 (b). The fusion data are MS, GC, GLCM, and N rates of four feature vectors. MS is multispectral information; GC is structure information; and GLCM is texture information. The green dot represents each data point. The red solid line is the regression line. The gray dotted line is the 1:1 line. These data are based on three replicates of six nitrogen rates. Cross-validation was performed during modeling.
Agronomy 13 01994 g005
Figure 6. Validation of yield prediction based on the RF model at the V9 stage in 2018 (a) and 2019 (b). The fusion data are MS, GC, GLCM, and N rates of four feature vectors. MS is multispectral information; GC is structure information; and GLCM is texture information. The green dot represents each data point. The red solid line is the regression line. The gray dotted line is the 1:1 line. These data are based on three replicates of six nitrogen rates. Cross-validation was performed during modeling.
Agronomy 13 01994 g006
Figure 7. The N status diagnosis map at the V9 stage. The N status diagnosis map based on the measured NNI was shown in 2018 (a) and 2019 (b), respectively. The N status diagnosis map based on the remote sensing data in 2018 (c) and 2019 (d), respectively. The NNI–M and NNI–S represent the measured NNI and simulated NNI. The different colors represent different NNI values.
Agronomy 13 01994 g007
Figure 8. The relationships of the recommended agronomic optimum nitrogen rate (AONR) based on simulated and measured yield and simulated and measured nitrogen nutrition index (NNI). (a) Comparison of AONR calculated by simulated yield and measured yield in 2018 and (b) 2019. (c) Comparison of AONR calculated by simulated NNI and measured NNI in 2018 and (d) 2019. Red solid line: regression line; gray solid line: 1:1 line; gray dotted lines: ±20% lines; dots of different colors: data of each genotype. The data were calculated by the mean value of three repetitions.
Agronomy 13 01994 g008
Table 1. Validation of different models for measured traits at the V9 stage.
TraitSensor Type20182019
RMSER2RERMSER2RE
AGBMS0.110.639.60.700.526.4
MS+GLCM0.100.639.50.680.5225.8
MS+GC+GLCM0.070.856.20.490.7917.1
PNCMS1.910.648.82.090.7212.8
MS+GLCM1.950.638.92.110.7012.9
MS+GC+GLCM1.240.815.61.380.858.1
PNUMS14.110.5516.512.630.7228.1
MS+GLCM14.260.5416.712.580.7228
MS+GC+GLCM9.880.7811.69.000.8717.7
NNIMS0.110.639.60.110.8016.3
MS+GLCM0.100.639.50.110.7916.4
MS+GC+GLCM0.100.649.40.110.7916.4
YieldMS0.810.788.591.080.7310.84
MS+GLCM0.820.788.631.080.7310.83
MS+GC+GLCM0.820.778.621.080.7310.83
Note: The fusion data are MS, GC, GLCM, and N rates of four feature vectors. MS: multispectral data; GLCM: gray-level co-occurrence matrix; GC: green cover index. Aboveground biomass (AGB), plant N concentration (PNC), plant N uptake (PNU), N nutrition index (NNI).
Disclaimer/Publisher’s Note: The statements, opinions and data contained in all publications are solely those of the individual author(s) and contributor(s) and not of MDPI and/or the editor(s). MDPI and/or the editor(s) disclaim responsibility for any injury to people or property resulting from any ideas, methods, instructions or products referred to in the content.

