Abstract
The content of plant endogenous hormones could be influenced by fertilization, which play an important regulatory role in plant growth and yield formation. However, the effects of phosphate (P) application rates on the dynamical changes in the exogenous hormone content in maize plants to support high-yield production are still unclear. An experiment with six P application rates was designed (P1, 0 kg ha−1; P2, 20 kg ha−1; P3, 40 kg ha−1; P4, 60 kg ha−1; P5, 80 kg ha−1; and P6, 100 kg ha−1), aimed at determining the distribution or biosynthesis of phytohormones in maize roots and leaves, and clarifying the role of P fertilization in the formation of phytohormones. The results showed that P fertilization significantly increased the content of IAA, by 51.57%, and significantly decreased the contents of ABA and GA3, by 18.92% and 19.13% on average compared to P1. The highest increase in IAA was 99.02%, and the highest decreases in ABA and GA3 were 32.30% and 26.85%, respectively, in the P6 treatment in maize roots. Meanwhile, an increase in the IAA (41.34%), SA (27.58%), and GA3 (37.36%) contents and a decrease in the ABA (19.18%) content in maize leaves were observed. The highest increases in IAA, GA3, and SA in the P6 treatment in maize leaves were 57.5%, 62.50%, and 48.57%, respectively, and the highest decrease in ABA was 28.05%. Meanwhile, different contents of endogenous hormones in maize roots and leaves were observed at various maize growth stages. The maize phenotypes and soil available P content were increased with P application as well. A Pearson’s correlation analysis showed that endogenous hormones were significantly correlated with maize phenotypes and yield. Our results confirmed that P fertilization could change the content of endogenous hormones in maize roots and leaves; P6 was the best treatment for improving the endogenous hormone contents in maize plants, P3 was the best for improving the maize grain yield. Overall, 40 kg ha−1 is recommended as the best P application rate under the experimental conditions, considering the economic cost and environmental effects.
1. Introduction
Phosphorus (P) is one of the essential nutrient elements for maize growth and has a vital influence on maize metabolism [1,2,3], because P is not only an energy carrier but also affects hormone synthesis, transportation, and metabolism in plants [4,5,6]. At present, the low P fertilizer utilization efficiency has become a global problem for high-yield crop production [7,8]. Therefore, a study on the effect and mechanism of P fertilizer application rates on maize phenotype and yield is essential, which could provide a theoretical basis for the rational use of chemical P fertilizer.
Endogenous hormones have been proven to directly affect crop yield. Gao et al. [9] reported that endogenous hormones are closely related to maize growth and grain yield. Wang et al. [10] also found that plant endogenous hormones could increase the above-ground and root biomass of purple-fleshed sweet potato. Plant endogenous hormones are regulated by factors such as light, temperature, water, and especially nutrient input. Yu et al. [11] found that the application of optimized nitrogen fertilizer (185 kg N ha–1) could promote the endogenous hormone balance, improve grain filling characteristics, and increase maize grain yield. Meanwhile, numerous studies have reported that P stress could affect plant endogenous hormones [12,13,14,15,16]. Zhao et al. [13] reported dynamical changes in the growth characteristics and endogenous hormone content in the leaves and roots of Sophora davidii seedlings in soils with a low P content. El-D et al. [14] found that P deficiency affected the level of endogenous cytokinin in sunflower. Ding et al. [15] confirmed that low P stress influenced the contents of endogenous hormones in rice. Si et al. [16] also reported that P application rates could regulate the metabolism of endogenous hormones during the formation of potential storage roots in sweet potato.
Many physiological processes of plants are regulated by complex interactions among several hormones rather than by the concentration of specific hormones [17]. Endogenous hormones, including salicylic acid (SA), ethylene, and jasmine, play an important role in regulating plant immune responses. In addition, other phytohormones such as auxin (IAA), abscisic acid (ABA), gibberellin (GA), cytokinin, etc., have been thoroughly demonstrated to regulate plant development and growth [18]. Among them, IAA was the earliest known endogenous hormone in plants, and it is a classic hormone regulating plant growth [19,20]. GA plays an important role in the plant’s whole life cycle, including seed germination, leaf extension, cell division, and fruit maturation [21]. ABA plays an important role in regulating the whole plant’s growth and development, and affecting plants’ flowering and sex differentiation, participating in seed maturation, germination, and regulating stomatal aperture [22,23]. SA, as a plant signal molecule, participates in plant stress resistance, stimulates various defense systems in plant cells, and regulates cell membrane system stability and active oxygen metabolism [24].
Previous studies have confirmed that chemical P fertilization could influence the endogenous hormone contents in plants to act on plant growth and yields. However, previous studies on the changes in endogenous hormones were mainly focused on the condition of soil P stress [12,13,14,15]. Meanwhile, the effects of different P application rates on their dynamical changes, and the relationship between endogenous hormones and plant growth or yields were still not clear. Thus, a field experiment was conducted to determine the distribution of phytohormones (IAA, GA, ABA, and SA) in maize roots and leaves during different growth stages under various P application rates, and to explore the correction among endogenous hormone contents, maize phenotypes, and grain yield. Our hypothesis was that the endogenous hormone content could be improved by an increase in P fertilization, which plays an important role in maize phenotype and yield.
2. Materials and Methods
2.1. Experimental Site and Design
The experiment was carried out at the Laiyang Experiment Station (120.7° E, 36.9° N) of Qingdao Agricultural University in 2020 and 2021. The average seasonal precipitation and air temperature are 641.60 mm and 22.03 °C, respectively. The daily mean temperature and precipitation during the maize growing seasons are shown in Figure 1. The soil is classified as fluvo-aquic soil, developed from alluvial parent material, with the original properties as follows: soil organic matter 12.93 g kg−1, total nitrogen 0.77 g kg−1, alkali-hydrolysable nitrogen 59.85 mg kg−1, available P 30.52 mg kg−1, available potassium 112.60 mg kg−1, and pH value (w:v = 2.5:1) 6.5.
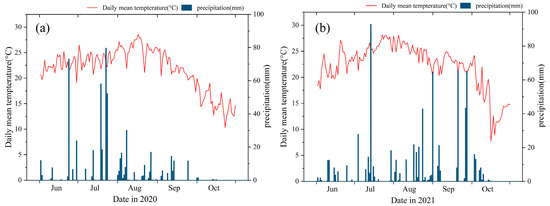
Figure 1.
Daily mean temperature and precipitation from June to October 2020 (a) and June to October 2021 (b) at the study site.
The maize variety was Ludan 818, which was cultivated by the Maize Research Institute of Shandong Academy of Agricultural Sciences. The variety is a compact plant type with high disease resistance to stem rot, black powder, and dwarf mosaic, good yield performance, and is suitable for planting in the summer maize growing area of Shandong Province. The planting date is June 28 each year, and the spacing of the maize plants is 25 cm. Rotary tillage was carried out after base fertilizer application. The management practices, such as irrigation (flooding the crops with an equal amount of water in each plot) and weeding (manual), were the same throughout the growth stages.
The experiment consisted of six treatments: P1, 0 kg P2O5 ha−1; P2, 20 kg P2O5 ha−1; P3, 40 kg P2O5 ha−1; P4, 60 kg P2O5 ha−1; P5, 80 kg P2O5 ha−1; P6, 100 kg P2O5 ha−1. Each treatment was with four replicates in a random block design, and the plots (each individual plot area was 2 m × 2 m) were separated by concrete walls (1.5 m depth). All treatments were applied with equal chemical nitrogen (urea, N 46%) of 180 kg N ha−1 and potassium fertilizer (potassium chloride, K2O 62%) of 68 kg K2O ha−1. Chemical P (superphosphate, P2O5 14%) and potassium fertilizers were applied as basal fertilizers. Nitrogen fertilizer was applied 3 times: 30%, 30%, and 40% of the total nitrogen fertilizer amount was applied at the V3 (three leaves emerged with ligule visible), V12 (twelve leaves emerged with ligule visible), and VT (tasseling) stages, respectively.
2.2. Sampling and Determination
The maize roots and fully expanded leaves (the third uppermost leaf was taken at the V12 stage, the fifth uppermost leaf was taken at the VT stage, and leaves at the panicle position were taken at the R1 and R3 stages) were taken at the V12, VT, R1 (silking), and R3 (filling) stages from 3 consecutive plants in each plot on 28 July, 14 August, 22 September, and 18 October in 2020 and 2021, respectively. The fresh samples of roots or leaves were quick-frozen in liquid nitrogen, then, brought back and stored in a refrigerator at −80 °C after removing the veins. The contents of GA3, IAA, SA, and ABA were extracted using isopropyl alcohol/water/hydrochloric acid, and then measured using high-performance liquid chromatography [25,26,27]. Briefly, the steps of high-performance liquid chromatography are as follows: (1) prepare standard sample solution and establish quantitative working curve, (2) prepare sample solution and measure the recovery rate, (3) calculate IAA, GA3, ABA, and SA contents [28]. At harvest, the plant height was measured by a meter stick [29], all the roots in each plot were washed out with water, and then the root length was scanned using a STD4800 SCANNER (Regent Instruments Inc., Québec City, QC, Canada), and the root surface area was analyzed using the WinRHIZO program, 2007 [30]. The area of the fully expanded leaf was measured using a ruler, and then calculated as per the following equation [31]:
where P is pulse length, and M is maximum width.
Leaf area = P × M × 0.75
All the ears of maize in the individual plots were harvested manually. Then, grains were oven-dried at 70 °C and adjusted to the appropriate moisture content (14%) to estimate the maize yield [32].
2.3. Statistical Analysis
All data are shown as mean ± standard error; standard error is the ratio of the standard deviation to the square root of the number of samples (n = 3). The DPS software (version 9.01, Hangzhou, China) was used for all statistical analyses. One-way analysis of variance and least significant differences were used to examine whether there were statistical differences among treatments at each maize growth stage in each year. At p < 0.05, a difference was recognized as statistically significant. Pearson’s correlation analysis was adopted to reflect the effects of endogenous hormone content on maize phenotypes and grain yield. The contents of IAA, GA3, ABA, and SA and the grain yield were mapped using OriginPro 2021 (OriginLab Corp., Northampton, MA, USA).
3. Results
3.1. IAA Content in Maize Roots and Leaves
The IAA content in maize roots and leaves was influenced by the P application rate and the maize growth stage in both 2020 and 2021 (Figure 2). The IAA content in maize roots at the R3 stage was significantly higher than in other stages in 2020, and there were no significant differences between the V12, VT, and R1 stages. There were no significant differences among all growth stages in 2021. Under different P application rates, the IAA content increased with an increase in P application rates. Compared to the P1 treatment, P6, P5, P4, P3, and P2 increased IAA in the maize roots by 127.34%, 86.40%, 69.14%, 47.07%, and 30.17%, respectively, on average in 2020. These values were 77.09%, 59.54%, 41.37%, 31.7%, and 22.13%, respectively, in 2021.
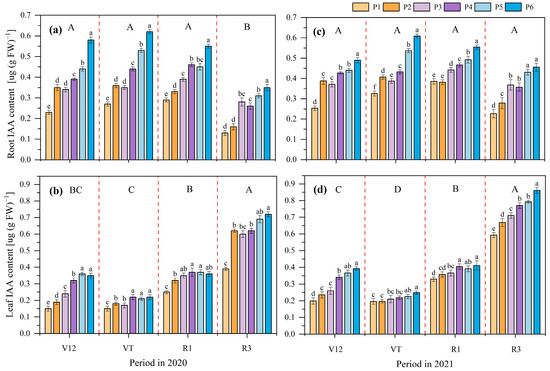
Figure 2.
Effects of different phosphate application rates on maize roots auxin (IAA) content in 2020 (a) and 2021 (b) and maize leaves’ IAA content in 2020 (c) and 2021 (d) at different growth stages. V12, twelve leaves emerged with ligule visible; VT, tasseling stage; R1, silking stage; R3, filling stage. P1, 0 kg ha−1; P2, 20 kg ha−1; P3, 40 kg ha−1; P4, 60 kg ha−1; P5, 80 kg ha−1; and P6, 100 kg ha−1. Different lowercase letters indicate significant differences among treatments in a certain growth stage at p < 0.05 level; different capital letters indicate significant differences among growth stages at p < 0.05 level.
The variation tendency of the IAA content at different growth stages in maize leaves was R3 > R1 = V12 > VT in 2020, and R3 > R1 > V12 > VT in 2021. Under different P application rates, compared to the P1 treatment, P6, P5, P4, P3, and P2 increased the IAA in the maize leaves by 74.88%, 72.52%, 62.94%, 45.01%, and 38.94%, respectively, on average in 2020. These values were 45.21%, 34.90%, 31.66%, 17.46%, and 10.71%, respectively, in 2021.
3.2. GA3 Content in Maize Roots and Leaves
The GA3 content in maize roots and leaves was influenced by the P application rate and the maize growth stage in both 2020 and 2021 (Figure 3). The GA3 content in the maize roots at the VT stage was the highest, which was significantly higher than that at the R3 stage in 2020, and there were no significant differences between the V12, VT, and R1 stages. The variation tendency was V12 = VT > R1 > R3 in 2021. Compared to the P1 treatment, P6, P5, P4, P3, and P2 showed a decreased GA3 content in the maize roots by 28.40%, 26.04%, 23.27%, 18.19%, and 6.91%, respectively, in 2020. These values were 25.01%, 20.87%, 19.53%, 13.15%, and 8.66%, respectively, in 2021.
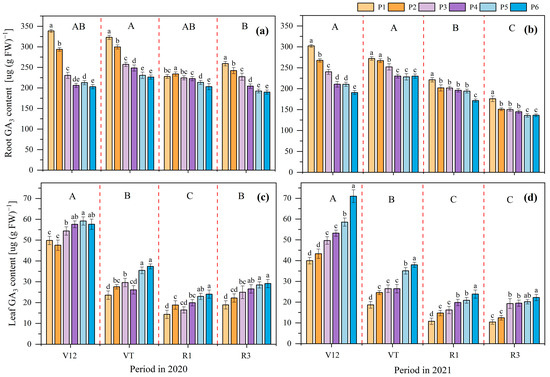
Figure 3.
Effects of different phosphate application rates on maize roots’ gibberellin (GA3) content in 2020 (a) and 2021 (b) and maize leaves’ GA3 content in 2020 (c) and 2021 (d) at different growth stages. V12, twelve leaf emerged with ligule visible; VT, tasseling stage; R1, silking stage; R3, filling stage. P1, 0 kg ha−1; P2, 20 kg ha−1; P3, 40 kg ha−1; P4, 60 kg ha−1; P5, 80 kg ha−1; and P6, 100 kg ha−1. Different lowercase letters indicate significant differences among treatments in a certain growth stage at p < 0.05 level; different capital letters indicate significant differences among growth stages at p < 0.05 level.
The variation tendency of the GA3 content at different growth stages in the maize leaves was V12 > VT = R3 > R1 in 2020, and it was V12 > VT > R1 = R3 in 2021. At a certain growth stage, the GA3 content in maize leaves showed an upward trend with the increase in the P application rate, the average GA3 content of the P6 treatment was the highest (37.05 µg (g FW)−1), followed by P5 (36.54 µg (g FW)−1), and P1 was the lowest (26.68 µg (g FW)−1) in 2020. The average content of GA3 was P1 > P2 > P3 = P4 > P5 > P6 in 2021. Compared to the P1 treatment, the GA3 content in maize leaves of the P6, P5, P4, P3, and P2 treatments was increased by 38.86%, 36.92% 22.03%, 17.58%, and 8.91%, respectively, in 2020. These values were 94.04%, 68.48% 48.94%, 39.76%, and 19.01%, respectively, in 2021.
3.3. ABA Content in Maize Roots and Leaves
The ABA content in the maize roots and leaves was influenced by the P application rate and maize growth stage in both 2020 and 2021 (Figure 4). The ABA content in maize roots of V12 stage was significantly lower than other stages in 2020, and there were no significant differences among VT, R1, and R3 stages. The variation tendency was VT = R1 > R3 > V12 in 2021. In each growth stage, the ABA content in the maize roots was gradually decreased with the increase in the P application rate. The ABA content of P6 was the lowest at 0.11 µg (g FW)−1, followed by P5 at 0.12 µg (g FW)−1, and P2 was the highest at 0.15 µg (g FW)−1 in 2020. The trend in the average content of ABA was P1 > P2 > P3 = P4 > P5 > P6 in 2021. Compared to the P1 treatment, P6, P5, P4, P3 and P2 decreased ABA in the maize roots by 33.67%, 26.30% 21.34%, 14.48%, and 9.44%, respectively, in 2020. These values were 30.61%, 20.02%, 14.48%, 10.55%, and 5.74%, respectively, in 2021.
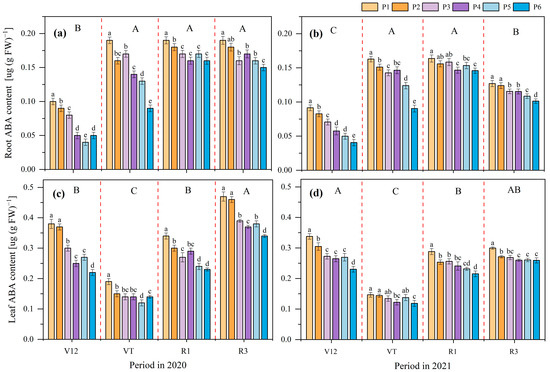
Figure 4.
Effects of different phosphate application rates on maize roots’ abscisic acid (ABA) content in 2020 (a) and 2021 (b), maize leaves’ ABA content in 2020 (c) and 2021 (d) at different growth stages. V12, twelve leaf emerged with ligule visible; VT, tasseling stage; R1, silking stage; R3, filling stage. P1, 0 kg ha−1; P2, 20 kg ha−1; P3, 40 kg ha−1; P4, 60 kg ha−1; P5, 80 kg ha−1; and P6, 100 kg ha−1. Different lowercase letters indicate significant differences among treatments in a certain growth stage at p < 0.05 level, different capital letters indicate significant differences among growth stages at p < 0.05 level.
The variation tendency of the ABA content at different growth stages in the maize leaves was R3 > V12 = R1 > VT in 2020. The highest ABA content was observed at the V12 stage, which was significantly higher than that at the R1 and VT stages in 2021. In each growth stage, the ABA content in the maize leaves showed a decreasing trend with the increase in the P application rate, and the trend in the average content was P1 > P2 > P3 > P4 > P5 > P6 in 2020, and P1 > P2 > P3 > P4 = P5 > P6 in 2021. Compared to the P1 treatment, P6, P5, P4, P3, and P2 decreased ABA in the maize leaves by 31.86%, 26.80%, 23.86%, 20.36%, and 6.38%, respectively, in 2020. These values were 23.19%, 16.11%, 17.20%, 13.09%, and 9.22%, respectively, in 2021.
3.4. SA Content in Maize Leaves
The SA content in maize leaves showed an increasing trend with the maize growth, the highest SA content was observed at the R3 stage, and the lowest was at the V12 stage in both 2020 and 2021. At each growth stage, the average SA content of P6 was the highest at 0.75 µg (g FW)−1, followed by P5 at 0.63 µg (g FW)−1, and P2 at 0.55 µg (g FW)−1 in 2020. The trend in the average content was P1 > P2 > P3 > P4 > P5 > P6 in 2021. Compared to the P1 treatment, P6, P5, P4, P3, and P2 increased the SA in the maize leaves by 57.51%, 32.16%, 32.03%, 14.93%, and 14.16%, respectively, in 2020. These values were 41.47%, 31.03%, 24.09%, 21.29%, and 9.84%, respectively, in 2021 (Figure 5).
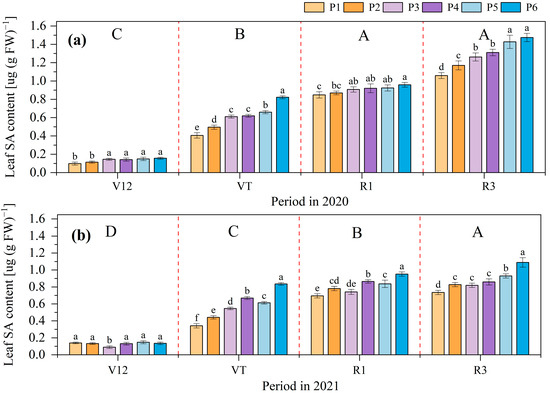
Figure 5.
Effects of different phosphate application rates on maize leaves’ salicylic acid (SA) content in 2020 (a) and 2021 (b). V12, twelve leaf emerged with ligule visible; VT, tasseling stage; R1, silking stage; R3, filling stage. P1, 0 kg ha−1; P2, 20 kg ha−1; P3, 40 kg ha−1; P4, 60 kg ha−1; P5, 80 kg ha−1; and P6, 100 kg ha−1. Different lowercase letters indicate significant differences among treatments in a certain growth stage at p < 0.05 level, different capital letters indicate significant differences among growth stages at p < 0.05 level. Note: The SA content in maize roots was not detected.
3.5. Maize Yield and Phenotypes Influenced by Phosphorus Application
The maize grain yield increased with increases in the P application rate effectively in a certain range of P application rates. Compared to P1, the grain yields of the P6 treatment in 2020 and 2021 increased by 21.68% and 22.19%, respectively. These values were 19.58% and 20.02% for P5, 17.17% and 17.39% for P4, 15.18% and 15.72% for P3, and 7.64% and 7.42% for P2 on average (Figure 6).
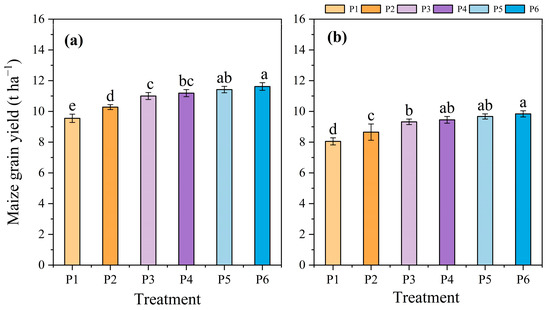
Figure 6.
Effects of different phosphate application rates on maize grain yield in 2020 (a) and 2021 (b). P1, 0 kg ha−1; P2, 20 kg ha−1; P3, 40 kg ha−1; P4, 60 kg ha−1; P5, 80 kg ha−1; and P6, 100 kg ha−1. Different lowercase letters indicate significant differences among treatments at a certain growth stage at p < 0.05 level.
The root length, root surface area, plant height, and leaf area of the maize, and the soil available P content, were influenced by the P application rate (Table 1). There were significant differences in root length and root surface area between all treatments, with the average root length and root surface area being in the order P6 > P5 > P4 > P3 > P2 > P1. Compared to the P1 treatment, plant height was significantly increased with P fertilization. Among the treatments, P6 increased the plant height the most, by 15.87%. The leaf area was also significantly increased, by 6.65% for P5 and 10.67% for P6, respectively; there were no significant differences between P1, P2, P3, and P4. The soil available P content of P6 was significantly increased, by 20.49%, compared to the P1 treatment, but no significant differences between P1, P2, P3, P4, and P5 were observed.

Table 1.
Effects of different phosphate application rates on maize phenotypes and soil available P content.
A Pearson’s correlation analysis between the endogenous hormone contents, maize phenotypes, and grain yield is shown in Figure 7. The maize yield was positively correlated with root IAA, positively correlated with leaf IAA and GA3, and negatively correlated with root GA3, root ABA, and leaf ABA. Root length, root surface area, plant height, and leaf area were significantly correlated with endogenous hormones, but soil available P content was not significantly correlated with endogenous hormones in maize plants.
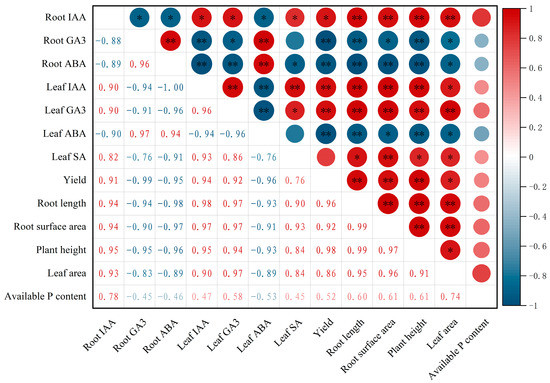
Figure 7.
Pearson’s correlation analysis of endogenous hormone contents in maize roots and leaves, maize growth indicators and grain yield. ** indicates a highly significant difference (p < 0.01), and * indicates a significant difference (p < 0.05).
4. Discussion
4.1. Phosphate Application Rates Influenced Endogenous Hormone Contents
Previous studies have confirmed that many physiological processes of plants are regulated by endogenous hormones [17,18]. Chemical P fertilization could influence the endogenous hormone contents in plants [12,13,14,15,16]. As an important endogenous hormone in the process of plant growth, IAA regulates the growth cycle of plants [33]. Vysotskaya et al. [34] reported that P deficiency led to a decrease in IAA content in barley plants, which could affect dry matter accumulation [35]. Miura et al. [36] found that the accumulation of IAA could induce the remodeling of the root system in Arabidopsis. In this study, the content of IAA in both maize roots and leaves showed an increasing trend with the increase in the P application rate and with the maize growth stage (Figure 2). This is consistent with those previous results [34,37]. The reason may be that IAA is an important factor affecting dry matter accumulation in grains, a higher IAA level is conducive to endosperm cell differentiation and dry matter transfer, promoting photosynthate transport and distribution, improving grain filling time and rate [9]. Otherwise, the increase in IAA of maize leaves under zero-P fertilization could be explained by the influence of the external environment (e.g., drought or rainfall) [38,39], that is, plants could maintain normal physiological function and growth to cope with climate change through hormone regulation.
GA3 can promote cell elongation and the growth of plants’ roots, stems, and leaves [19], and directly affects seed enrichment and controls starch synthesis [37]. Our results indicate that the GA3 content of maize roots showed a decreasing trend with an increase in the P application rate, especially when P fertilization was less than 60 kg P2O5 ha−1 (Figure 3). The explanation could be that the maize root structure was changed due to the increase in GA3 content in order to alleviate the P deficiency stress and absorb more available P from the soil [40]. However, there was little difference of the GA3 content in roots between the fertilization treatments when the P fertilization reached 60 kg P2O5 ha−1 (Figure 3). This is because the root system does not need to produce extra GA3 to cope with the low P stress [41]. However, the GA3 content in maize leaves was enhanced with the increase in the P application rate (Figure 3); similar results were obtained from another study [40]. The results indicate that increasing the P application rate could increase the GA3 content in maize leaves to support dry matter accumulation and yield improvement.
ABA plays an important physiological role in the process of plant growth, especially in the regulation of photosynthetic product transport and stomatal opening and closing, and induces the initiation and expression of stress resistance genes to resist adversity [42,43]. Radin [44] reported that ABA content in cotton leaves was increased under low P stress, and P deficient plants were more sensitive to ABA. We found that the ABA content in the maize roots and leaves without P application was significantly higher than in those with P fertilization, and there was a decreasing trend with the increase in P application (Figure 4), consistent with previous results [43,44]. These results indicate that the accumulation of photosynthetic product and grain filling rate could be increased with an increase in P fertilization [9]. Additionally, SA is a ubiquitous endogenous signal molecule in plants [45,46]. The content of the SA in the maize leaves showed an increasing trend with the increase in P fertilization and maize growth (Figure 5), which suggested that the absorption of nutrients could be enhanced by the increasing content of SA in maize leaves [45].
4.2. Phosphate Application Rates Influenced Maize Phenotype and Grain Yield
Previous studies found that plants’ growth was regulated by a variety of endogenous hormones, including IAA, GA3, and ABA [47,48], which were influenced by the chemical P application rate, maize growth stage, etc. Chemical P fertilizer application could regulate the root morphology and configuration by regulating the content of endogenous hormones and root exudates [40,41]. Our results found that chemical P fertilization significantly increased the maize grain yield at first and then the effect levelled off when the application rate of P fertilizer was more than 40 kg P2O5 ha−1 (Figure 6). Meanwhile, the maize grain yield was significantly positively correlated with leaf IAA and GA3, and root IAA contents, and significantly negatively correlated with leaf ABA and root GA3 and ABA contents. However, there was no significant correlation between leaf SA content and grain yield (Figure 7). The results indicated that an increase in P fertilization could improve the synthesis of endogenous hormones in maize plants, which would increase the maize grain yield [49]. In terms of the grain yield in two seasons, a lower grain yield (10.84 t ha−1 in 2020 vs. 9.16 t ha−1 in 2021) was obtained in the second growing season (Figure 6); the main reason was the high temperature during the VT stage and continuous rainfall during the R3 stage in 2021 (Figure 1). Moreover, excessive application of P fertilizer could not be useful in enhancing the grain yield as the optimum could be obtained with the P3 treatment (Figure 6). That is, other external factors (e.g., soil P status, climate conditions) could influence the stimulant effect of endogenous hormones on the maize yield [16,39]. Zhang et al. [50] reported that there was a linear-platform relationship between maize yield and P fertilization, and the critical amount of P was 45 kg ha−1. The increase in maize grain yield was 1.94 t ha−1 on average compared to zero-P fertilization. Additionally, limited phosphorus reserves and the contribution to the eutrophication of surface waters [51] are two main problems of P fertilization in current agricultural systems. Therefore, it is of great significance to explore the strategy of efficient utilization of P fertilizer for agricultural production.
5. Conclusions
Our results showed that an increase in phosphate application rates could significantly influence the contents of endogenous hormones in maize plants. Compared to zero-phosphate application treatment, chemical phosphate fertilization significantly increased the content of auxin and significantly decreased the abscisic acid and gibberellin contents in maize roots. Increases in auxin, salicylic acid, and gibberellin and a decrease in the abscisic acid content in maize leaves were observed, especially for the 100 kg ha−1 phosphate application treatment. Meanwhile, maize phenotype indicators and soil available phosphate content could be influenced by phosphate application rates as well. A Pearson’s correlation analysis showed that endogenous hormones were significantly correlated with maize phenotypes and grain yield. Overall, a reasonable phosphate application rate could promote the supply of various endogenous hormones to ensure high-yielding maize production. Among all the phosphate application rates, 40 kg ha−1 was the best for improving the maize grain yield and improving the endogenous hormone content in maize plants to avoid economic losses and environmental damage simultaneously. However, further studies on the effects of soil phosphate status, rainfall distribution, and temperature on the endogenous hormone contents in plants and on the crop yield are needed.
Author Contributions
Conceptualization, S.L. and W.W.; data curation, methodology, writing—original draft preparation, Y.Z., W.G., H.C. and X.X.; writing—review and editing, funding acquisition, project administration, W.W., S.L. and W.J.; investigation, visualization, formal analysis, S.L. All authors have read and agreed to the published version of the manuscript.
Funding
This research was funded by the Central Government to Guide Local Special Plans for Science and Technology Development (Grant No. 22-1-3-6-zyyd-nsh), the Major Applied Technology Innovation Projects in Agriculture of Shandong Province (Grant No. SD2019ZZ013), the Modern Agricultural Technology System Innovation Team of Maize in Shandong Province (Grant No. SDAIT-02-06), and the Action Plan of Science and Technology Commissioners of Shandong Province (Grant No. 2020KJPY075).
Data Availability Statement
The data generated and analyzed during the current study are available from the corresponding author on reasonable request.
Acknowledgments
We would like to acknowledge the anonymous reviewers for constructive comments.
Conflicts of Interest
The authors declare no conflict of interest.
References
- Sahito, J.H.; Zheng, F.; Tang, H.T.; He, X.; Luo, B.W.; Zhang, X.; Ma, P.; Ding, X.; Liu, D.; Wu, L.; et al. Identification, association, and expression analysis of ZmNAC134 gene response to phosphorus deficiency tolerance traits in maize at seedling stage. Euphytica 2020, 216, 100. [Google Scholar] [CrossRef]
- Wang, R.; Yao, Z.J.; Lei, Y.P. Modeling of soil available phosphorus surplus in an intensive wheat-maize rotation production area of the North China Plain. Agric. Ecosyst. Environ. 2019, 269, 22–29. [Google Scholar] [CrossRef]
- Sun, Y.L.; Mu, C.H.; Chen, Y.; Kong, X.P.; Xu, Y.C.; Zheng, H.X.; Zhang, H.; Wang, Q.C.; Xue, Y.F.; Li, Z.X.; et al. Comparative transcript profiling of maize inbreds in response to long-term phosphorus deficiency stress. Plant Physiol. Biochem. 2016, 109, 467–481. [Google Scholar] [CrossRef] [PubMed]
- Wu, F.K.; Liu, Z.M.; Xu, J.; Gao, S.B.; Lin, H.J.; Liu, L.; Liu, Y.X.; Lu, Y.L. Molecular evolution and association of natural variation in ZmARF31 with low phosphorus tolerance in maize. Front. Plant Sci. 2016, 7, 1076. [Google Scholar] [CrossRef]
- Kisko, M.; Bouain, N.; Rouached, A.; Choudhary, S.P.; Rouached, H. Molecular mechanisms of phosphate and zinc signaling crosstalk in plants: Phosphate and zinc loading into root xylem in Arabidopsis. Environ. Exp. Bot. 2015, 115, 57–64. [Google Scholar] [CrossRef]
- Waadt, R.; Hsu, P.K.; Schroeder, J.I. Abscisic acid and other plant hormones: Methods to visualize distribution and signaling. BioEssays 2015, 37, 1338–1349. [Google Scholar] [CrossRef]
- Xiong, R.; Tang, H.; Xu, M.; Zeng, C.B.; Peng, Y.; He, R.; Yan, Z.; Qi, Z.; Cheng, Y. Transcriptomic analysis of banana in response to phosphorus starvation stress. Agronomy 2018, 8, 141. [Google Scholar] [CrossRef]
- Johnston, A.E.; Poulton, P.R.; Fixen, P.E.; Curtin, D. Phosphorus: Its efficient use in agriculture. Adv. Agron. 2014, 123, 177–228. [Google Scholar]
- Gao, J.; Shi, J.G.; Dong, S.T.; Liu, P.; Zhao, B.; Zhang, J.W. Grain development and endogenous hormones in summer maize (Zea mays L.) submitted to different light conditions. Int. J. Biometeorol. 2018, 62, 2131–2138. [Google Scholar] [CrossRef]
- Wang, Q.M.; Hou, F.Y.; Dong, S.X.; Xie, B.T.; Li, A.X.; Zhang, H.Y.; Zhang, L.M. Effects of shading on the hotosynthetic capacity, endogenous hormones and root yield in purple-fleshed sweetpotato (Ipomoea batatas (L.) Lam). Plant Growth Regul. 2014, 72, 113–122. [Google Scholar] [CrossRef]
- Yu, N.N.; Zhang, J.W.; Liu, P.; Zhao, B.; Ren, B.Z. Integrated agronomic practices management improved grain formation and regulated endogenous hormone balance in summer maize (Zea mays L.). J. Integr. Agr. 2020, 19, 1768–1776. [Google Scholar] [CrossRef]
- Shen, J.B.; Li, C.J.; Mi, G.H.; Li, L.; Yuan, L.X.; Jiang, R.F.; Zhang, F.S. Maximizing root/rhizosphere efficiency to improve crop productivity and nutrient use efficiency in intensive agriculture of China. J. Exp. Bot. 2013, 64, 1181–1192. [Google Scholar] [CrossRef]
- Zhao, X.; Zhao, L.L.; Huang, L.J.; Sun, X.F.; Wang, P.C. Response of growth characteristics and endogenous hormones of Sophora davidii to low-phosphorus stress. Acta Physiol. Plant. 2021, 43, 118. [Google Scholar] [CrossRef]
- EI-D, A.M.S.; Salama, A.; Wareing, P.F. Effects of mineral nutrition on endogenous cytokinins in plants of sunflower (Helianthus annuus L.). J. Exp. Bot. 1979, 30, 971–981. [Google Scholar] [CrossRef]
- Ding, Y.; Wang, Z.G.; Mo, S.R.; Liu, J.; Xing, Y.; Wang, Y.P.; Ge, C.L.; Wang, Y.L. Mechanism of low phosphorus inducing the main root lengthening of rice. J. Plant Growth Regul. 2020, 40, 1032–1043. [Google Scholar] [CrossRef]
- Si, C.C.; Liang, Q.G.; Liu, H.J.; Wang, N.; Kumar, S.; Chen, Y.L.; Zhu, G.P. Response mechanism of endogenous hormones of potential storage root to phosphorus and its relationship with yield and appearance quality of sweetpotato. Front. Plant Sci. 2022, 13, 872422. [Google Scholar] [CrossRef]
- Tsukanov, K.A.; Сhеbоtаr, V.K.; Meyer, J.J.M.; Bibikova, T.N. Effect of plant growth-promoting Rhizobacteria on plant hormone homeostasis. S. Afr. J. Bot. 2017, 113, 91–102. [Google Scholar] [CrossRef]
- Denancé, N.; Sánchez-Vallet, A.; Goffner, D.; Molina, A. Disease resistance or growth: The role of plant hormones in balancing immune responses and fitness costs. Front. Plant Sci. 2013, 4, 155. [Google Scholar] [CrossRef]
- Petersson, S.V.; Johansson, A.I.; Kowalczyk, M.; Makoveychuk, A.; Wang, J.Y.; Moritz, T.; Grebe, M.; Benfey, P.N.; Sandberg, G.; Ljung, K. An auxin gradient and maximum in the arabidopsis root apex shown by high-resolution cell-specific analysis of IAA distribution and synthesis. Plant Cell 2009, 21, 1659–1668. [Google Scholar] [CrossRef]
- Blakeslee, J.J.; Peer, W.A.; Murphy, A.S. Auxin transport. Curr. Opin. Plant Biol. 2005, 8, 494–500. [Google Scholar] [CrossRef]
- Daviere, J.M.; Achard, P. Gibberellin signaling in plants. Development 2013, 140, 1147–1151. [Google Scholar] [CrossRef]
- Finkelstein, R. Abscisic acid synthesis and response. Arab. Book 2013, 11, e0166. [Google Scholar] [CrossRef]
- Cutler, S.R.; Rodriguez, P.L.; Finkelstein, R.R.; Abrams, S.R. Abscisic acid: Emergence of a core signaling network. Ann. Rev. Plant Biol. 2010, 61, 651–679. [Google Scholar] [CrossRef]
- Yan, S.P.; Dong, X.N. Perception of the plant immune signal salicylic acid. Curr. Opin. Plant Biol. 2014, 20, 64–68. [Google Scholar] [CrossRef]
- Wang, H.X.; Wang, M.L.; Wang, X.Z.; Ding, Y.L. Detection of seven phytohormones in peanut tissues by ultra-high-performance liquid chromatography-triple quadrupole tandem mass spectrometry. J. Integr. Agric. 2020, 19, 700–708. [Google Scholar] [CrossRef]
- Veselova, S.V.; Farhutdinov, R.G.; Veselov, S.Y.; Kudoyarova, G.R.; Veselov, D.S.; Hartung, W. The effect of root cooling on hormone content, leaf conductance and root hydraulic conductivity of durum wheat seedlings (Triticum durum L.). J. Plant Physiol. 2005, 162, 21–26. [Google Scholar] [CrossRef]
- Vysotskaya, L.B.; Arkhipova, T.N.; Timergalina, L.N.; Dedov, A.V.; Veselov, S.Y.; Kudoyarova, G.R. Effect of partial root excision on transpiration, root hydraulic conductance and leaf growth in wheat seedlings. Plant Physiol. Biochem. 2004, 42, 251–255. [Google Scholar] [CrossRef]
- Pan, X.Q.; Welti, R.; Wang, X.M. Simultaneous quantification of major phytohormones and related compounds in crude plant extracts by liquid chromatography–electrospray tandem mass spectrometry. Phytochemistry 2008, 69, 1773–1781. [Google Scholar] [CrossRef]
- Barmeier, G.; Mistele, B.; Schmidhalter, U. Referencing laser and ultrasonic height measurements of barleycultivars by using a herbometre as standard. Crop. Pasture Sci. 2016, 67, 1215–1222. [Google Scholar] [CrossRef]
- Guo, S.; Liu, Z.G.; Zhou, Z.J.; Lu, T.Q.; Chen, S.H.; He, M.J.; Zeng, X.Z.; Chen, K.; Yu, H.; Shangguan, Y.X.; et al. Root system architecture differences of maize cultivars affect yield and nitrogen accumulation in Southwest China. Agriculture 2022, 12, 209. [Google Scholar] [CrossRef]
- Watt, M.; Moosavi, S.; Cunningham, S.C.; Kirkegaard, J.A.; Rebetzke, G.J.; Richards, R.A. A rapid, controlled-environment seedling root screen for wheat correlates well with rooting depths at vegetative, but not reproductive, stages at two field sites. Ann. Bot. 2013, 112, 447–455. [Google Scholar] [CrossRef]
- Wei, W.L.; Yang, H.Q.; Fan, M.S.; Chen, H.Q.; Guo, D.Y.; Cao, J.; Kuzyakov, Y. Biochar effects on crop yields and nitrogen loss depending on fertilization. Sci. Total Environ. 2020, 702, 134423. [Google Scholar] [CrossRef]
- Teale, W.D.; Paponov, I.A.; Palme, K. Auxin in action: Signaling, transport and the control of plant growth and development. Nat. Rev. Mol. Cell Biol. 2006, 7, 847–859. [Google Scholar] [CrossRef]
- Vysotskaya, L.B.; Trekozova, A.W.; Kudoyarova, G.R. Effect of phosphorus starvation on hormone content and growth of barley plants. Acta Physiol. Plant. 2016, 38, 108. [Google Scholar] [CrossRef]
- Yan, X.N.; Tian, M.; Liu, F.; Wang, C.X.; Zhang, Y. Hormonal and morphological changes during seed development of Cypripedium japonicum. Protoplasma 2017, 254, 2315–2322. [Google Scholar] [CrossRef]
- Miura, K.; Lee, J.; Gong, Q.Q.; Ma, S.S.; Jin, J.B.; Yoo, C.Y.; Miura, T.; Sato, A.; Bohnert, H.J.; Hasegawa, P.M. SIZ1 regulation of phosphate starvation-induced root architecture remodeling involves the control of auxin accumulation. Plant Physiol. 2011, 155, 1000–1012. [Google Scholar] [CrossRef]
- Li, Q.F.; Zhou, Y.; Xiong, M.; Ren, X.Y.; Han, L.; Wang, J.D.; Zhang, C.Q.; Fan, X.L.; Liu, Q.Q. Gibberellin recovers seed germination in rice with impaired brassinosteroid signalling. Plant Sci. 2020, 293, 10435. [Google Scholar] [CrossRef]
- Davies, W.J.; Metcalfe, J.; Lodge, T.A.; Costa, A.R.D. Plant growth substances and the regulation of growth under drought. Funct. Plant Biol. 1986, 13, 105–125. [Google Scholar] [CrossRef]
- Panchal, S.; Chitraka, R.; Thompson, B.K.; Obulareddy, N.; Roy, D.; Hambright, W.S.; Melotto, M. Regulation of stomatal defense by air relative humidity. Plant Physiol. 2016, 172, 2021–2032. [Google Scholar] [CrossRef]
- Devaiah, B.N.; Madhavanthi, R.; Karthikeyan, A.S.; Raghothama, K.G. Phosphate starvation responses and gibberellic acid biosynthesis are gulated by the MYB62 hanecription factor in Arabidopaia. Mol. Plant. 2009, 2, 43–58. [Google Scholar] [CrossRef]
- Yan, X.L.; Liao, H.; Beebe, S.E.; Blair, M.W.; Lynch, J.P. QTL mapping of hoot hair and acid exudation traits and their relationship to phosphorus uptake in common bean. Plant Soil 2004, 265, 17–29. [Google Scholar] [CrossRef]
- Bray, E.A. Abscisic acid regulation of gene expression during water-defcit stress in the era of the Arabidopsis genome. Plant Cell Environ. 2010, 25, 153–161. [Google Scholar] [CrossRef]
- Morillon, R.; Chrispeels, M.J. The role of ABA and the transpiration stream in the regulation of the osmotic water permeability of leaf cells. Proc. Natl. Acad. Sci. USA 2001, 98, 14138–14143. [Google Scholar] [CrossRef]
- Radin, J.W. Stomatal responses to water stress and to abscisic acid in phosphorus-deficient cotton plants. Plant Physiol. 1984, 76, 392–394. [Google Scholar] [CrossRef]
- Bert, D.R.; Pekka, M.A.; Helariutta, Y.; Dolf, W. Plant vascular development: From early specification to differentiation. Nat. Rev. Mol. Cell Biol. 2016, 17, 30–40. [Google Scholar]
- Yi, S.Y.; Kwon, S.Y. How does SA signaling link the Flg22 responses? Plant Signal. Behav. 2014, 9, e972806. [Google Scholar] [CrossRef]
- Liu, Y.; Fang, X.A.; Chen, G.S.; Ye, Y.X.; Xu, J.Q.; Ouyang, G.F.; Zhu, F. Recent development in sample preparation techniques for plant hormone analysis. Trends Anal. Chem. 2019, 113, 224–233. [Google Scholar] [CrossRef]
- Cai, T.; Xu, H.C.; Peng, D.L.; Yin, Y.P.; Yang, W.B.; Ni, Y.L.; Chen, X.G.; Xu, C.L.; Yang, D.Q.; Cui, Z.Y.; et al. Exogenous hormonal application improves grain yield of wheat by optimizing tiller productivity. Field Crop. Res. 2014, 155, 172–183. [Google Scholar] [CrossRef]
- Ye, T.H.; Li, Y.W.; Zhang, J.L.; Hou, W.F.; Zhou, W.F.; Lu, J.W.; Xing, Y.Z.; Li, X.K. Nitrogen, phosphorus, and potassium fertilization affects the flowering time of rice (Oryza sativa L.). Glob. Ecol. Conserv. 2019, 20, e00753. [Google Scholar] [CrossRef]
- Zhang, W.; Liu, D.Y.; Li, C.; Chen, X.P.; Zou, C.Q. Accumulation, partitioning, and bioavailability of micronutrients in summer maize as affected by phosphorus supply. Eur. J. Agron. 2017, 86, 48–59. [Google Scholar] [CrossRef]
- Bai, Z.H.; Li, H.G.; Yang, X.Y.; Zhou, B.K.; Shi, X.J.; Wang, B.R.; Li, D.C.; Shen, J.B.; Chen, Q.; Qin, W.; et al. The critical soil P levels for crop yield, soil fertility and environmental safety in different soil types. Plant Soil 2013, 372, 27–37. [Google Scholar] [CrossRef]
Disclaimer/Publisher’s Note: The statements, opinions and data contained in all publications are solely those of the individual author(s) and contributor(s) and not of MDPI and/or the editor(s). MDPI and/or the editor(s) disclaim responsibility for any injury to people or property resulting from any ideas, methods, instructions or products referred to in the content. |
© 2023 by the authors. Licensee MDPI, Basel, Switzerland. This article is an open access article distributed under the terms and conditions of the Creative Commons Attribution (CC BY) license (https://creativecommons.org/licenses/by/4.0/).