Abstract
Knowledge of the influence of different drought durations during the terminal growth stages on net photosynthetic rate (Pn), transpiration rate (Tr), transpiration efficiency (TE), and tuber fresh weight (economic yield) is relatively limited in Jerusalem artichoke. Our aim was to examine the effect of different drought durations during the terminal growth stages on Pn, Tr, TE, and economic yield in Jerusalem artichoke genotypes with different ranges of drought tolerance. A two-year field experiment was established in the northeast of Thailand. A split-plot design replicated four times was used. Three water treatments, optimal conditions (SD0), short-drought (SD1), and long-drought (SD2) durations during the terminal growth stages, were arranged as main plots. Six genotypes (HEL256, JA37, HEL253, JA4, JA60, and JA125) are subplots. Different durations of drought in SD1 and SD2 reduced Pn, Tr, and economic yield, while drought stress during the terminal growth stages increased TE in whole genotypes over SD0 treatments. Drought-tolerant genotypes JA125 and JA4 exhibited high Pn, medium TE, and low economic yield reduction under SD2. Utilization of these superior parents in breeding could lead to the generation of new progenies with high economic yield productivity and drought tolerance during the long drought duration during the terminal growth stage. In addition, high SPAD chlorophyll meter readings (SCMR) in SD1 and SD2 and low specific leaf area (SLA) in SD1 could be used as indirect selection traits to survey high Pn genotypes in Jerusalem artichoke. Consequently, these indirect selection traits may allow for speedy breeding programs in Jerusalem artichokes.
1. Introduction
Jerusalem artichoke is a perennial tuberous crop and can be produced in a wide range of growing conditions in many countries (e.g., Serbia, the United States, France, Germany, and Canada) [1]. Its tubers are rich in inulin and are increasingly interested in producing bioethanol and replacing fat or low-calorie sweeteners [2,3]. Inulin is a polysaccharide comprised of D-fructose units linked by β (2 → 1) glycosidic bonds, and one molecule commonly ends with an α (1 ↔ 2) bonded D-glucose [4]. It is a functional food ingredient that can provide better health and reduce the risk of several diseases in humans, such as osteoporosis, colon cancer, and cardiovascular disease [5,6]. Although Jerusalem artichoke is native to temperate regions of North America, it can adapt in semiarid and sub-tropical regions with tuber yields ranging from 9.1 t ha−1 to 10.6 t ha−1 and 1.3 t ha−1 to 4.5 t ha−1, respectively [7,8].
In Northeastern Thailand, Jerusalem artichoke is planted in both the early rainy season (June to September) and the late rainy season (September to December) as an herbaceous crop for fresh tuber consumption and functional food production [9]. Nevertheless, seasonal variations result in different plant development and tuber yields [10]. Previous studies under irrigated conditions indicated that Jerusalem artichokes produced during a short photoperiod along with low temperatures (late rainy season) had a higher tuber yield (2.89 t ha−1) than those produced in an early rainy season with a long photoperiod and high temperatures [9,10]. Therefore, the late rainy season was crucial to the selection of high-yielding Jerusalem artichoke genotypes in tropical regions [10]. The majority of the Jerusalem artichoke growing areas in northeast Thailand are in rainfed environments that were planted after the first main crops were harvested. Therefore, residual soil moisture content in this area is important for vigorously establishing the first development of Jerusalem artichokes. Most Jerusalem artichokes experience different durations of drought, particularly in the terminal growth stages, which could be T3 or T4. The occurrence of different durations of terminal drought can cause decreased growth and tuber yield in Jerusalem artichokes. The report of Puangbut et al. (2015b) [11] mentioned that plants reach the T3 and T4 stages when 50% of the plants have a tuber diameter bigger than 1 cm and equal to 2.5 cm, respectively, and that these stages influence final yield.
In previous studies, the effect of drought conditions during the early and middle growth stages decreased tuber yield; in addition, drought stress can alter the physiological responses relevant to yield productivity in Jerusalem artichoke genotypes [12,13,14]. Plant physiological responses might explain how plants could retain high tuber yields under drought conditions. Regardless of the reasons for the level of water stress, the result of Puangbut et al. (2022) [12] implies that Pn declined by 10% under drought stress during the middle-growth stage in field culture, and drought-tolerant Jerusalem artichoke genotypes could retain high Pn, resulting in high tuber yield. Similar results under early drought stress stated that Pn and Tr showed lower reductions in drought-tolerant genotypes than susceptible genotypes after 30 days of drought stress [15]. Although drought-tolerant genotypes of the Jerusalem artichoke have been recognized by retaining high Pn under both drought stress and the early and middle growth stages, this has not been studied during the terminal growth stages for Jerusalem artichoke planting as the second crop in a double cropping system. Likewise, Pn of potato varieties tended to decrease under mild and medium drought stresses; moreover, higher Pn is an important physiological characteristic for drought-resistant genotypes [16]. However, the focus on the impact of different drought durations during the terminal growth stages on the physiological characteristics of Pn, Tr, and TE is rarely reported in Jerusalem artichoke genotypes. In addition, the severity of yield reduction and physiological alteration under drought stress depends on various factors such as growth stage, drought intensity, and drought tolerance mechanisms [12,17].
Alternately, the physiological traits linked to drought tolerance and tuber yield could be useful for indirect selection of superior parents under drought conditions [13]. A previous study in drought-tolerance selection was primarily focused on tuber yields and total biomass, resulting in slow progress due to the relatively high interaction between genotype and environment (G × E) [8]. Consequently, the use of physiological traits that are effective to evaluate as selection criteria for drought tolerance through breeding programs is a long-term solution to ameliorate drought stress [12,15]. Pn is positively associated with yield for many crops like potatoes [18], sugar beet [19], and radish [20]. The previous studies led us to the hypothesis that genotypes with high Pn might contribute to higher economic yield and a low reduction in economic yield when encountering different drought durations during the terminal growth stages. Hence, physiological traits related to economic yield should be used as a surrogate trait for screening drought-tolerant genotypes and help to improve economic yield under drought conditions. The focus of this study was to determine the effect of different drought durations during the terminal growth stages of Jerusalem artichoke genotypes on Pn, Tr, and TE and to investigate the association between their physiological traits and economic yield and the reduction in economic yield under three water levels. This approach may assist plant breeders in speeding up the generation of progenies for drought tolerance in Jerusalem artichokes during the terminal growth stages.
2. Materials and Methods
2.1. Experimental Design and Plant Materials
The experiment was conducted under field conditions at the Field Crop Research Station, Khon Kaen University, Khon Kaen, Thailand, during the late rainy season (ranges from October to January) in 2017/18 and 2018/19. The experimental treatments were set up as a split-plot design in four replications. The main plots consisted of three water levels, including optimal conditions (SD0), short-drought (SD1), and long-drought (SD2) durations. Within each water level, six Jerusalem artichoke genotypes (HEL256, JA37, HEL253, JA4, JA60, and JA125) were planted as subplot treatments, and they were selected based on results of a previous study [8].
2.2. Field Conditions, Irrigation System, and Crop Preparation
Standard tillage consisted of plowing twice, harrowing, and leveling. Afterward, an underground drip irrigation system (Super Typhoon®, Netafim Irrigation equipment & Drip systems, Israel) was installed in a subplot size of 6 × 5 m (72 subplots). Within each subplot, a plant spacing of 50 cm between rows and 30 cm between hills was established. Thirteen drip lines with an emitter distance of 30 cm were placed between the rows of plants and embedded 10 cm below the soil surface in each subplot. The water meters (Asahi Sanwa®, GMK 20, Bangkok Material Co., Ltd., Bangkok, Thailand) were connected at the head of each main plot. The pressure valve (Super Products®, OPG Oil Pressure Gauge, Bangkok Material Co., Ltd., Bangkok, Thailand) was also installed to ensure water application uniformity within the subplots.
The tubers of six Jerusalem artichoke genotypes were pre-sprouted for use in plant materials [12]. To prepare the pre-sprouted tubers before transplanting, as described by Ruttanaprasert et al. 2016b [14], the tubers were divided into small pieces (2 to 3 buds per piece) and soaked in a solution of carboxylic acid (10 g in 20 L of water) for 40 min. The tuber pieces were then pre-sprouted in plastic boxes containing a mixture of burnt rice husk and Trichoderma (3:1) under ambient conditions. After 7 days, these sprouted tubers with active buds and roots were moved to the germinating plug trays containing a mixture of soil, burnt rice husk, and Trichoderma (3:3:1). After 10 days, one healthy plant with two leaves was transplanted into each hole. Weeds were controlled manually beginning 20 days after transplantation (DAT). The fertilizer formula 15-15-15 of N-P2O5-K2O (Chia Tai Co., Ltd.) was applied at 30 DAT (156.25 kg ha−1). Pests and diseases were controlled by application of Sevin 85 (Carbaryl 85%WP) (Sotus International Co., Ltd., Nonthaburi, Thailand) and Mancozeb (20 g in 20 L of water) (Polycrop Industries Co., Ltd., Bangkok, Thailand), respectively, weekly.
2.3. Water Management
Prior to transplanting, water was given uniformly to all subplots to a depth of 10 cm below the soil surface. In all treatments, an underground drip irrigation system was used to supply the water to field capacity level (FC), which reached 60 cm from the soil surface after transplanting. The soil moisture levels in SD0 treatment were maintained within a 1% variance at FC until harvest. For the drought stress treatments at SD2 and SD1, water was withheld at 45 and 60 DAT until maturity, respectively. The quantity of water supplied to individual subplots was computed as the sum of crop water requirements (ETcrop) and soil evaporation (Es). The formula of ETcrop and Es was described by Puangbut et al. (2017) [15].
The ETcrop was computed using the formula below:
where ETcrop = crop water requirement (mm day−1), ETo = evapotranspiration of a reference plant under specified conditions calculated by a pan evaporation method (mm), and Kc = a coefficient of the crop at different growth stages of Jerusalem artichoke genotypes [8].
ETcrop = ETo × Kc
The Es was computed using the formula below:
where Es = soil evaporation (mm), β = light transmission coefficient measured depending on crop cover, Eo = evaporation from class A pan (mm day−1), and t = days from the last irrigation.
Es = β × (Eo/t)
2.4. Weather Parameters and Soil Conditions
Meteorological data were obtained by a weather station located on-site at the Field Crops Research Station at Khon Kaen University. The air temperatures, rainfall, solar radiation, evaporation, and relative humidity were recorded daily throughout the season.
Soil samples were randomly collected using the methods described by Carter and Gregorich (2006) [21], and samples were used for analyzing physical and chemical properties before field preparation. In 2017/18, the soil type was classified as sand (89% sand, 7% silt, and 4% clay) and was loamy sand (76% sand, 18% silt, and 6% clay) in 2018/19 (data not shown). The soils had a pH of 6.7, and organic matter content ranged from 0.3% to 0.4%. Total nitrogen contents were 0.02%; available phosphorus ranged from 35.0 mg kg−1 to 37.7 mg kg−1; exchangeable potassium and calcium ranged from 30.1 mg kg−1 to 48.7 mg kg−1 and 450.0 mg kg−1 to 754.9 mg kg−1, respectively. Electrical conductivity was 0.02 dS m−1, and the cation exchange capacity ranged from 3.2 c mol kg−1 to 5.3 c mol kg−1. In terms of soil moisture-holding capacity, in 2017/18, we had FC and permanent wilting points (PWP) values of 14.4% and 3.2%, respectively, and 14.2% and 2.6%, respectively, in 2018/19.
2.5. Soil Moisture Content and Relative Water Content
At 45, 60, and 75 DAT, soil moisture content was measured at a depth of 30 and 60 cm in all 72 subplots by a gravimetric method that was previously described by Puangbut et al. (2017) [15]. The soil samples were taken using a microauger, and soil fresh weights were weighed. Soil dry weights were obtained after oven-drying at 105 °C for 72 h or until weights were constant. Soil moisture content for each subplot was computed using the formula:
Soil moisture content = [(soil fresh weight − soil dry weight)/soil dry weight] × 100
Relative water content (RWC) was also measured at 45, 60, and 75 DAT. The estimation was conducted using the second and third fully expanded leaves from the top of the main stem between 10:00 and 12:00 A.M. on a clear day. Four plants per subplot were sampled, and two leaves were bored by a disc borer with 2.0 cm2 of leaf area. After recording the fresh weight, the leaf was immersed in water in the dark at a controlled temperature of 25 °C for 8 h, to determine the turgid weight. The leaf disks were then oven-dried at 70 °C for at least 72 h to reach a constant dry weight. The percentage (%) of RWC was then computed according to the method described by Puangbut et al. (2017) [15]:
where LFW = leaf fresh weight, LDW = leaf dry weight, and LTW = leaf turgid weight.
RWC (%) = [(LFW − LDW)/(LTW − LDW)] × 100
2.6. Net Photosynthetic Rate, Transpiration Rate, Transpiration Efficiency, SPAD Chlorophyll Meter Reading, and Specific Leaf Area
The physiological characteristics of Pn, Tr, and TE were determined using an LI-6400XT portable photosynthesis system (LICOR, Lincoln, NE, USA) equipped with a 6400-02B light-emitting diode source providing a photosynthetic photon flux density of 1500 µmol m−2 s−1. The temperature and CO2 concentration were set at 30 °C and 400 µmol m−2 s−1, respectively. The third fully expanded leaves were used for all physiological measurements collected from a sample size of four plants per subplot at 45, 60, and 75 DAT between 09:00 A.M. and 12:00 A.M. under cloudless conditions. The TE values were obtained as the ratio of Pn to Tr and expressed in mmol (CO2) and mol (H2O). The SCMR was measured with a Minolta SPAD-502 handheld portable meter (Tokyo, Japan) on the same leaf with physiological measurement by avoiding midrib area. The leaf area was measured randomly on 35 plants harvested from each sub-plot. The total leaf area was determined using a leaf area meter (LI-3100C Area meter, LI-COR, Inc., USA). Then the leaf samples were dried in an oven at 70 °C for 72 h or until reaching constant weight, and leaf dry weight could be determined. The SLA was calculated by dividing leaf area by leaf dry weight and expressed in cm2 g−1.
2.7. Tuber Fresh Weight (Economic Yield) and Reduction of Economic Yield
Thirty-five plants were harvested from each subplot, and border rows were excluded. The fresh weight of tuber was measured using a digital balance. The dry weight of tuber was obtained after oven-drying at 70 °C for 72 h and reaching a constant weight. The percentages of reduction in economic yield from different drought durations were used to evaluate the sensitivities of Jerusalem artichoke genotypes to different drought durations. Percentages of reduction were calculated for each Jerusalem artichoke genotype as described by Ruttanaprasert et al. (2016b) [14]:
Percent reduction = [1 − (weight under drought/weight under no drought)] × 100
2.8. Statistical Analysis
Analysis of variance for a split-plot design was performed for all parameters [22]. Combined analysis of variance for two-year data in all parameters was conducted when error variances for two years were homogeneous [23]. The significance of differences between means in all parameters was estimated by least significant difference (LSD) at p < 0.05. Pearson’s correlation was used to establish simple linear correlations between Pn, Tr, and TE with economic yield and reduction of economic yield under SD0, SD1, and SD2. The model is expressed as described by Zou et al. (2003) [24].
where the regression parameter Yi is economic yield and reduction in economic yield of genotype i, a is the y intercept, b is the slope of the regression line, and Xi is Pn, Tr, and TE of genotype i.
Yi = a + bXi
All calculations were established by STATISTIX 8 software program (Analytical Software, Tallahassee, FL, USA) [25].
3. Results
3.1. Weather, Soil Moisture, and Relative Water Content
In 2017/18, the maximum and minimum air temperatures ranged from 22.5 °C to 36.5 °C and 12.5 °C to 25.0 °C, respectively; in 2018/19, the ranges were 28.0 °C to 37.0 °C and 15.0 °C to 24.0 °C, respectively (Figure 1a). A total rainfall of 6.3 mm (2017/18) and 18.5 mm (2018/19) was received during the crop season. Movable rainout shelters were used for cover in drought experimental plots; thus, rainfall did not interfere with drought treatments. The average solar was 9.6 MJ m−2 day−1 and 17.5 MJ m−2 day−1 (2017/18), and 10.8 MJ m−2 day−1 and 19.9 MJ m−2 day−1 (2018/19) (Figure 1b). The relative humidity values were similar for both years, ranging from 80% to 97%. The evaporation values range from 2.1 mm to 7.0 mm in 2017/18 and from 3.2 mm to 6.7 mm in 2018/19.
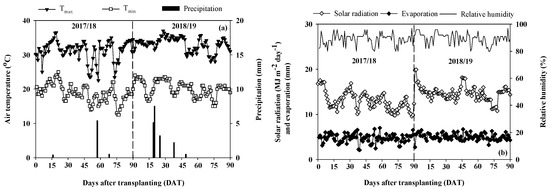
Figure 1.
(a) Daily air temperatures (maximum, Tmax, and minimum, Tmin) and total precipitation. (b) Mean daytime solar radiation, daily evaporation, and relative humidity during the crop growth period in 2017/18 and 2018/19.
There was no significant difference (LSD; p > 0.05) in soil moisture content among the three water levels at 45 DAT (30 and 60 cm) in both years because the water had not been withheld (Table 1). At 60 DAT, the soil moisture content in SD0 and SD1 did not show a significant difference (LSD; p > 0.05) between the two depths in two years, and both water levels were higher than those for SD2. At 75 DAT, the soil water contents of two depths were significantly different (LSD; p ≤ 0.05) in three water levels for two years. This indicated that the withholding of irrigation for both SD1 and SD2 was effective in imposing drought stress.

Table 1.
Comparison of soil moisture content at 30- and 60-cm and relative water content under three water levels measured at 45, 60, and 75 days after transplanting in 2017/18 and 2018/19.
At 45 DAT, RWC values showed no significant differences (LSD; p > 0.05) among the three water levels, and similar trends were observed for soil moisture content in both years (Table 1). At 60 DAT, RWC values at SD0 and SD1 were higher than in SD2. Clear significant differences (LSD; p ≤ 0.01) in RWC values under SD0 and different drought durations (SD1 and SD2) were observed at 75 DAT. The values of RWC in SD0 were higher than those in SD1, and values in SD1 were higher than those in SD2, indicating that plant response to soil moisture content was as expected.
3.2. Effect of Different Drought Durations on Net Photosynthetic Rate, Transpiration Rate, and Transpiration Efficiency
A combined analysis of variance showed that water level had the highest contribution to total variation for Pn (79.1%), Tr (73.3%), and economic yield (78.1%) (Supplementary Table S1). Likewise, genotype had the highest contribution to total variation for TE (42.2%). Meanwhile, interactions between year and water level (Y × W), year and variety (Y × V), water level and variety (W × V), and year, water level, and variety (Y × W × V) had the lowest portions of total variations for all traits. In addition, there were highly significant differences (p ≤ 0.01) in the interactions between Y × V and W × V for all traits. Thus, all parameters studied were reported for individual years and water levels.
The results clearly showed that Pn and Tr in each Jerusalem artichoke genotype are negatively affected under different drought durations in SD1 and SD2 in both years (Table 2). Meanwhile, different drought durations in SD1 and SD2 seem to affect TE increases in most genotypes but not for genotypes JA37 and HEL253, which showed the highest TE under SD0 in both years. Moreover, genotype JA125 showed no difference for TE under SD0 and SD2 in 2018/19. Pn and Tr exhibited larger decreases at SD2 than at SD1, except for Tr of genotypes HEL256 and HEL253, which showed no difference in 2017/18.
Table 2.
Net photosynthetic rate, transpiration rate, and transpiration efficiency of six Jerusalem artichoke genotypes at 75 days after transplanting under three water levels in 2017/18 and 2018/19.
Genotypes were significantly different (p ≤ 0.01) for Pn, Tr, and TE in both years and at each water level (Table 2). In both years, genotypes JA125 and JA37 exhibited high Pn in SD0. Under SD1 and SD2, JA4 and JA125 exhibited higher Pn than other genotypes. In the case of Tr, HEL256 and JA125, JA60 and JA37, and HEL253 and JA4 displayed high, medium, and low values, respectively, in SD0 in both years. Under drought stress in SD1, high Tr was observed in JA37 and JA4, medium Tr in JA60 and JA125, and low Tr in HEL256 and HEL253. High, medium, and low values of Tr were found in JA4 and JA125, HEL253 and JA60, and JA37 and HEL256, respectively, under SD2.
HEL253 and JA125 exhibited high TE in SD0 for both years (Table 2). HEL256 and HEL253 exhibited higher TE in SD1 than other genotypes. Furthermore, HEL256, HEL253, and JA60 exhibited higher TE in SD2 compared with other genotypes.
3.3. Effect of Different Drought Durations on Tuber Fresh Weight (Economic Yield)
Different drought durations in SD1 and SD2 also decreased economic yield (tuber fresh weight) in each Jerusalem artichoke genotype compared with SD0 for both years (Table 3). Genotypes were significantly different (p ≤ 0.05 and p ≤ 0.01) in economic yield and reduction of economic yield for both years and each water level. JA37 and JA125 had high tuber fresh weights in SD0. Likewise, JA125, JA37, and JA4 had high economic yields in SD1, and HEL256, HEL253, and JA125 had high economic yields in SD2.
Table 3.
Economic yield (tuber fresh weight) of six Jerusalem artichoke genotypes at harvest under three water levels in 2017/18 and 2018/19.
The decrease in economic yield was more severe in SD2 than SD1 in all genotypes except for JA4, which exhibited no difference in the decrease in economic yield in 2017/18 and 2018/19 (Table 3). Economic yield was reduced by an average of 47.2% and 68.6% in SD1 and SD2, respectively, for both years in comparison to SD0. HEL256 and JA37 had higher reductions in SD1 and SD2, respectively, than other genotypes. Whereas low reductions of economic yield in SD1 were exhibited by JA125, JA4, and JA37, and in SD2 for JA125 and HEL256 in both years.
3.4. Relationships between Net Photosynthetic Rate, Transpiration Rate, and Transpiration Efficiency with Economic Yield and Reduction of Economic Yield
The result clearly showed that a high positive correlation was found between Pn and economic yield (r = 0.76; p ≤ 0.05 in 2017/18 and r = 0.85; p ≤ 0.05 in 2018/19) in SD1 and the highest positive correlation (r = 0.93; p ≤ 0.01 in 2017/18 and r = 0.94; p ≤ 0.01 in 2018/19) in SD2, but not in SD0 (Figure 2a,b). The correlation coefficient between Pn and the reduction of economic yield in SD2 was highly significant (r = −0.76; p ≤ 0.05 in 2017/18 and r = −0.86; p ≤ 0.05 in 2018/19) and negative in SD1 in 2018/19 (Figure 2d) but not in SD1 in 2017/18 (Figure 2c). This indicates that selection of genotypes for high Pn might help to improve economic yield productivity and retain low economic yield reduction under different drought durations in SD2.
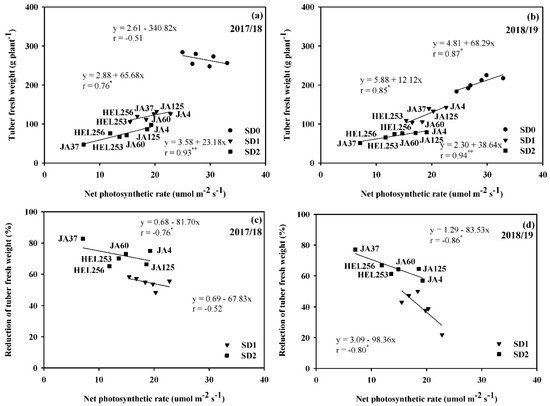
Figure 2.
Relationship between net photosynthetic rate with tuber fresh weight (a,b) and reduction of tuber fresh weight (c,d) of six Jerusalem artichoke genotypes under optimal conditions (SD0), short-drought (SD1), and long-drought (SD2) durations in 2017/18 and 2018/19. *, ** Represent significant and highly significant with t-test p ≤ 0.05 and p ≤ 0.01, respectively.
Similarly, a high positive correlation was found between TE and economic yield in SD2 (r = 0.80; p ≤ 0.05 in 2017/18 and r = 0.86; p ≤ 0.05 in 2018/19) and between TE and reduction in economic yield (r = 0.88; p ≤ 0.05 in 2017/18 and r = 0.79; p ≤ 0.05 in 2018/19) (Figure 3). The correlation between TE and economic yield was not significant in SD0 and SD1 in both years (Figure 3a,b). The correlation between TE and reduction of economic yield was also not significant in SD1 for both years (Figure 3c,d). Selection of genotypes for medium TE might contribute to improving economic yield and maintaining a low reduction in economic yield in SD2.
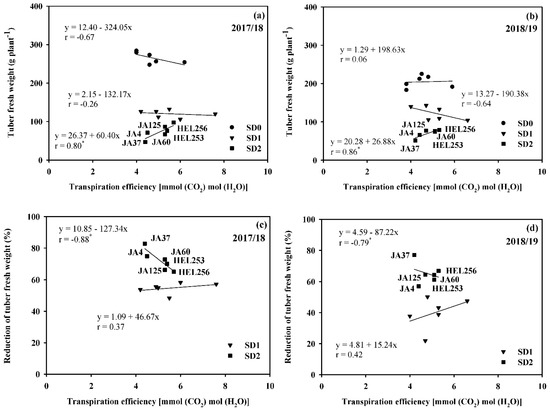
Figure 3.
Relationship between transpiration efficiency with tuber fresh weight (a,b) and reduction in tuber fresh weight (c,d) of six Jerusalem artichoke genotypes under optimal conditions (SD0), short-drought (SD1), and long-drought (SD2) durations in 2017/18 and 2018/19. * Represent significance with t-test p ≤ 0.05.
In addition, the correlation between Tr and economic yield and between Tr and reduction of economic yield was not significant under three water levels for both years (data not shown).
3.5. Relationships between Net Photosynthetic Rate, SPAD Chlorophyll Meter Reading, and Specific Leaf Area
The result demonstrated that Pn was positively associated with SCMR under different drought durations in SD1 (r = 0.81; p ≤ 0.05 in 2017/18 and r = 0.79; p ≤ 0.05 in 2018/19) and SD2 (r = 0.82; p ≤ 0.05 in 2017/18 and r = 0.83; p ≤ 0.05 in 2018/19) (Figure 4). In this case, the association between Pn and SCMR was not significant in SD0 for both years. It appears that improvements in Pn could be accomplished by selecting high SCMR under different drought durations. Furthermore, there was a high negative association (r = −0.85; p ≤ 0.05 in 2017/18 and r = −0.82; p ≤ 0.05 in 2018/19) between Pn and SLA in SD1 in both years but not in SD0 and SD2 for both years (Figure 5). This indicates that the selection of high Pn genotypes in SD1 could be achieved by screening for low SLA.
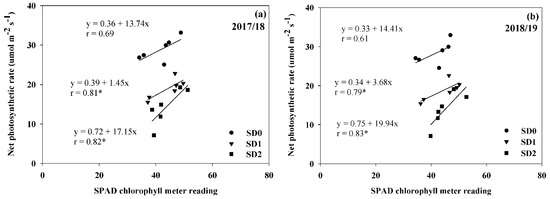
Figure 4.
Relationship between SPAD chlorophyll meter reading and net photosynthetic rate of six Jerusalem artichoke genotypes under optimal conditions (SD0), short-drought (SD1), and long-drought (SD2) durations in 2017/18 (a) and 2018/19 (b). * Represent significance with t-test p ≤ 0.05.
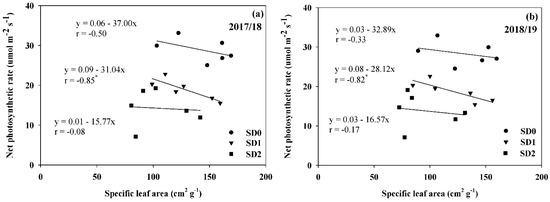
Figure 5.
Relationship between specific leaf area and net photosynthetic rate of six Jerusalem artichoke genotypes under optimal conditions (SD0), short-drought (SD1), and long-drought (SD2) durations in 2017/18 (a) and 2018/19 (b). * Represent significance with t-test p ≤ 0.05.
4. Discussion
Although the interactions for Y × W, Y × V, W × V, and Y × W × V affect variation on Pn, Tr, TE, and economic yield, the effect of water levels and genotypes accounted for the biggest proportions of total variance on all traits investigated (Supplementary Table S1). This implied that Jerusalem artichoke genotypes and irrigation management are important for gaining higher yields. A previous study stated that the genotypic rankings of Jerusalem artichokes for Pn were stable across years and water regimes [15]. Similar to the evidence reported by Puangbut et al. (2022) [12], the genotype ranking for Pn was more stable across two years. These results demonstrated the possibility of using these traits as indirect selection criteria for high yield in Jerusalem artichoke breeding programs.
Our study discovered that different drought durations during the terminal growth stages decreased Pn (33.9% to 50.9%), Tr (41.2% to 54.7%), and economic yield (47.2% to 68.6%) compared with SD0 (Table 2 and Table 3). The largest decrease in Pn and Tr was found in SD2 with a long drought compared with those in SD1 with a short drought. On the other hand, TE values were increased by drought in SD1 and SD2 over SD0 for most genotypes. A similar result has been reported in the same crop: drought stress during the early growth stage (30 days after imposing drought) reduced Pn and Tr by an overage of 62% and 46%, respectively, but increased SCMR over the irrigated control under rhizobox cultures [15]. In temperate regions, water deficit had negative effects on Pn, as the lowest dry weight of tubers was shown in water deficit treatment [26]. Drought stress during the whole growth period of sweet potatoes also reduced Tr, Pn (56.7%), and biomass (31.3%) [27]. In a case study in potatoes, higher Pn was an important physiological mechanism for drought-resistant genotypes [16]. Pn and TE have been identified as drought tolerance traits in several crops, such as sunflower [28], radish [29], sweet potato [30,31], and turnip [32]. Heerden and Laurie (2008) [31] reported that decreased Pn is a significant factor affecting biomass production during drought stress. Therefore, understanding drought stress-related physiological responses is crucial to developing screening procedures for selecting superior genotypes that can better tolerate drought conditions [33].
Any increase or decrease in physiological traits caused by drought stress conditions could lead to variable responses in yield productivity [19]. The current study showed that Pn was positively correlated with economic yield in SD1 and SD2 and reduced economic yield in SD2 (Figure 2). These findings indicated that the genotypes with high Pn could promote high economic yield production under both SD1 and SD2 and maintain a lower reduction of economic yield under drought stress in SD2. JA125 and JA4 were highly tolerant to drought, especially in SD2, owing to their high Pn, resulting in a low reduction of economic yield. This was a new finding in Jerusalem artichokes. The use of physiological criteria as surrogate traits for drought tolerance screening could accelerate the pace of plant breeding for drought tolerance. In contrast, Puangbut et al. (2022) [12] reported that Pn had a smaller contribution (3.7%) to tuber yield under drought conditions at 50% ETcrop during the middle growth stage, while leaf area had a high contribution under fully irrigated conditions at 100% ETcrop (80.1%) and drought (85.5%) conditions. The differences in the investigations could be due to differences in the duration and severity of drought and the period of the growing season during which drought occurred. It is generally believed that increased Pn leads to improvements in plant growth and yield [27]. Mthembu et al. (2022) [18] stated that tuber yield correlated with Pn (r = 0.94; p = 0.01) under deficit irrigation conditions. As a result, improved Pn could contribute to higher tuber yield production in Jerusalem artichoke genotypes under drought conditions [15]. Drought stress during the early, middle, and late growth stages decreased Pn and resulted in a significant reduction in sweet potato yield [27]. Selection of Jerusalem artichoke genotypes for high Pn could improve tuber yield under drought conditions.
Our study demonstrated that TE was associated with both economic yield and a reduction of economic yield in SD2 (Figure 3). This clearly showed that genotypes that maintain medium TE under drought in SD2 could contribute to developing economic yield and low reduction. Hence, we concluded that genotypes with high economic yield production under drought conditions resulted from high Pn and medium TE. Based on the correlation between Pn and economic yield and the reduction of economic yield, it was concluded that JA125 and JA4 could be high-potential parental sources for drought tolerance. These findings are similar to previous studies that found that drought-tolerant genotypes of Jerusalem artichoke have been identified to possess a low reduction of tuber yield, Pn, and TE to drought stress during the early [15] and middle [12] growth stages. Retaining a high Pn and TE leads to higher yields during water deficit conditions in potato [27], sugar beet [19], and Jerusalem artichoke [15]. Additionally, the Jerusalem artichoke with a low reduction in Pn and high potential for Pn under drought at 50% ETcrop during the middle growth stage was JA125 [12], and the results were similar to our study. Drought-tolerant genotypes with a high ability to maintain high Pn may contribute to high tuber yields under drought conditions. Consequently, JA125 could be used as a parental source for developing high-yield productivity and a high tolerance to drought stress during the early [15], middle [12], and terminal (present study) growth stages.
Surrogate traits that can be used as an indirect selection criterion and are rapid, easy, low-cost, and accurate tools to identify promising genotypes with high Pn are required for accelerating routine plant breeding programs [12,14,20,34]. Our study revealed that an increased Pn under drought conditions in SD1 and SD2 was correlated with a higher SCMR (Figure 4). Furthermore, greater Pn under drought conditions in SD1 was also related to low SLA (Figure 5). Thus, the present study highlighted that SCMR and SLA could be used as surrogate tools for rapid screening of high Pn genotypes in Jerusalem artichokes under drought stress. These two parameters, SCMR and SLA, have been demonstrated to be the best representative with regard to clarifying high Pn and drought-tolerant genotypes in radish [20], potato [34,35], and Jerusalem artichoke [12,14]. The increase in SCMR was associated with high chlorophyll density under drought conditions, and it was strongly correlated to Pn in Jerusalem artichokes [15,26,36]. Maintenance of leaf greenness under drought stress is generally considered a positive contribution to higher yield and tolerance to drought in potatoes [35]. Nasir and Toth (2021) [37] showed that tuber yield was positively correlated with chlorophyll concentration, and drought-tolerant genotypes produce higher chlorophyll and maintain their chlorophyll concentration under drought stress. These pieces of evidence [12,14,15] indicate that Jerusalem artichoke genotypes with high Pn could result in high SCMR and lead to greater tuber yield productivity under drought conditions. SLA is an indicator of leaf thickness in Jerusalem artichoke, which is negatively related to SCMR and Pn under drought conditions [13]. It is well known that thicker leaves usually have a higher density of chlorophyll than thinner leaves, and decreases in SLA occur in response to drought, allowing increased tolerance to drought conditions [26,38]. This result suggested that SCMR and SLA could be used as physiological traits for indirect selection for high Pn under terminal drought stress in future Jerusalem artichoke breeding efforts.
5. Conclusions
Different drought durations in SD1 and SD2 significantly reduced Pn, Tr, and economic yield in all Jerusalem artichoke genotypes. All traits studied declined more at SD2 compared with SD1. By contrast, the values of TE increased in SD1 and SD2. Significant differences in each Jerusalem artichoke genotype for all traits were observed under both optimal conditions (SD0) and different drought durations (SD1 and SD2). In our study, JA125 and JA4 exhibited high Pn and economic yield under different drought durations in SD1 and SD2. High correlations between Pn, economic yield, and the reduction of economic yield were obtained under different drought durations. The result concluded that drought-tolerant genotypes JA125 and JA4 could be promoted as good parental sources for generating new progenies with high tuber yield productivity under drought stress. Importantly, SCMR and SLA could be used as physiological traits for indirect selection to improve Pn and drought tolerance in breeding programs for Jerusalem artichokes.
Supplementary Materials
The following supporting information can be downloaded at: https://www.mdpi.com/article/10.3390/agronomy13071882/s1, Table S1: Mean squares from the combined analysis of variance for net photosynthetic rate, transpiration rate, transpiration efficiency, and tuber fresh weight of six Jerusalem artichoke genotypes under three water levels in 2017/18 and 2018/19.
Author Contributions
A.C.; conceptualization, data curation, methodology, validation, investigation, formal analysis, and writing—original draft preparation, S.J.; conceptualization, methodology, validation, investigation, writing—review and editing, supervision, and funding acquisition, N.V.; conceptualization, methodology, validation, and investigation, C.C.H.; methodology, investigation, and writing—review and editing, C.K.K.; methodology, investigation, and writing—review and editing. All authors have read and agreed to the published version of the manuscript.
Funding
This work was financially supported by the Royal Golden Jubilee Ph.D. Programs (Grant No. PHD/0035/2558) and the Thailand Research Fund through the Senior Research Scholar Project of Professor Dr. Sanun Jogloy (Project No. RTA6180002).
Data Availability Statement
Data sharing is not applicable.
Acknowledgments
The authors would like to thank the Leibniz Institute of Plant Genetics and Crop Plant Research (IPK), Stadt, Seeland, Germany, and the Plant Gene Resources of Canada (PGRC), Agriculture and Agri-Food Canada, Saskatoon, Saskatchewan, Canada, for the donation of Jerusalem artichoke germplasm.
Conflicts of Interest
The authors declare that they have no known competing financial interest or personal relationship that could have appeared to influence the work reported in this paper.
References
- Kays, S.J.; Nottingham, S.F. Biology and Chemistry of Jerusalem Artichoke: Helianthus tuberosus L., 1st ed.; Taylor & Francis Group: Boca Raton, FL, USA, 2008; pp. 1–496. [Google Scholar]
- Mensink, M.A.; Frijlink, H.W.; Maarschalk, K.V.; Hinrichs, W.L.J. Inulin, a flexible oligosaccharide I: Review of its physicochemical characteristics. Carbohydr. Polym. 2015, 130, 405–419. [Google Scholar] [CrossRef] [PubMed]
- Rossini, F.; Provenzano, M.E.; Kuzmanović, L.; Ruggeri, R. Jerusalem artichoke (Helianthus tuberosus L.): A versatile and sustainable crop for renewable energy production in Europe. Agronomy 2019, 9, 528. [Google Scholar] [CrossRef]
- Kelly, G. Inulin-type prebiotics—A review: Part 1. Altern. Med. Rev. 2008, 13, 315–329. [Google Scholar] [PubMed]
- Aliasgharzadeh, A.; Khalili, M.; Mirtaheri, E.; Gargari, B.P.; Tavakoli, F.; Farhangi, M.A.; Babaei, H.; Dehghan, P. A combination of prebiotic inulin and oligofructose improve some of cardiovascular disease risk factors in women with type 2 diabetes: A randomized controlled clinical trial. Adv. Pharm. Bull. 2015, 5, 507–514. [Google Scholar] [CrossRef]
- Nair, K.K.; Kharb, S.; Thompkinson, D.K. Inulin dietary fiber with functional and health attributes: A review. Food Rev. Int. 2010, 26, 189–203. [Google Scholar] [CrossRef]
- Liu, Z.X.; Han, L.P.; Yosef, S.; Xie, G.H. Genetic variation and yield performance of Jerusalem artichoke germplasm collected in China. Agric. Sci. China. 2011, 10, 668–678. [Google Scholar] [CrossRef]
- Ruttanaprasert, R.; Banterng, P.; Jogloy, S.; Vorasoot, N.; Kesmala, T.; Kanwar, R.S.; Holbrook, C.C.; Patanothai, A. Genotypic variability for tuber yield, biomass and drought tolerance in Jerusalem artichoke germplasm. Turk. J. Agric. For. 2014, 38, 570–580. [Google Scholar] [CrossRef]
- Ruttanaprasert, R.; Jogloy, S.; Vorasoot, N.; Kesmala, T.; Kanwar, R.S.; Holbrook, C.C.; Patanothai, A. Photoperiod and growing degree days effect on dry matter partitioning in Jerusalem artichoke. Int. J. Plant Prod. 2013, 7, 393–416. [Google Scholar]
- Puangbut, D.; Jogloy, S.; Vorasoot, N.; Patanothai, A. Responses of growth, physiological traits and tuber yield in Helianthus tuberosus to seasonal variations under tropical area. Sci. Hortic. 2015, 195, 108–115. [Google Scholar] [CrossRef]
- Puangbut, D.; Jogloy, S.; Vorasoot, N.; Patanothai, A. Growth and phenology of Jerusalem artichoke (Helianthus tuberosus L.). Pak. J. Bot. 2015, 47, 2207–2214. [Google Scholar]
- Puangbut, D.; Jogloy, S.; Vorasoot, N.; Songsri, P. Photosynthetic and physiological responses to drought of Jerusalem artichoke genotypes differing in drought resistance. Agric. Water Manag. 2022, 259, 107252. [Google Scholar] [CrossRef]
- Ruttanaprasert, R.; Banterng, P.; Jogloy, S.; Vorasoot, N.; Kesmala, T.; Patanothai, A. Diversity of physiological traits in Jerusalem artichoke genotypes under non-stress and drought stress. Pak. J. Bot. 2016, 48, 11–20. [Google Scholar]
- Ruttanaprasert, R.; Jogloy, S.; Vorasoot, N.; Kesmala, T.; Kanwar, R.S.; Holbrook, C.C.; Patanothai, A. Effects of water stress on total biomass, tuber yield, harvest index and water use efficiency in Jerusalem artichoke. Agric. Water Manag. 2016, 166, 130–138. [Google Scholar] [CrossRef]
- Puangbut, D.; Jogloy, S.; Vorasoot, N. Association of photosynthetic traits with water use efficiency and SPAD chlorophyll meter reading of Jerusalem artichoke under drought conditions. Agric. Water Manag. 2017, 188, 29–35. [Google Scholar] [CrossRef]
- Li, J.; Cang, Z.; Jiao, F.; Bai, X.; Zhang, D.; Zhai, R. Influence of drought stress on photosynthetic characteristics and protective enzymes of potato at seedling stage. J. Saudi Soc. Agric. Sci. 2017, 16, 82–88. [Google Scholar] [CrossRef]
- Yordanov, I.; Velikova, V.; Tsonev, T. Plant responses to drought, acclimation, and stress tolerance. Photosynthetica 2000, 38, 171–186. [Google Scholar] [CrossRef]
- Mthembu, S.G.; Magwaza, L.S.; Mashilo, J.; Mditshwa, A.; Odindo, A. Drought tolerance assessment of potato (Solanum tuberosum L.) genotypes at different growth stages, based on morphological and physiological traits. Agric. Water Manag. 2022, 261, 107361. [Google Scholar] [CrossRef]
- Ober, E.S.; Bloa, M.L.; Clark, C.J.A.; Royal, A.; Jaggard, K.W.; Pidgeon, J.D. Evaluation of physiological traits as indirect selection criteria for drought tolerance in sugar beet. Field Crops Res. 2005, 91, 231–249. [Google Scholar] [CrossRef]
- Stagnari, F.; Galieni, A.; Egidio, S.D.; Pagnani, G.; Pisante, M. Responses of radish (Raphanus sativus) to drought stress. Ann. Appl. Biol. 2018, 172, 170–186. [Google Scholar] [CrossRef]
- Carter, M.R.; Gregorich, E.G. Soil Sampling and Methods of Analysis, 2nd ed.; Taylor & Francis Group: Boca Raton, FL, USA, 2006; pp. 1–198. [Google Scholar]
- Gomez, K.A.; Gomez, A.A. Statistical Procedures for Agriculture Research, 2nd ed.; John Wiley and Sons: New York, NY, USA, 1984; pp. 1–657. [Google Scholar]
- Hoshmand, A.R. Design of Experiments for Agriculture and the Natural Science; Chapman & Hall Press: Boca Raton, FL, USA, 2006. [Google Scholar]
- Zou, K.H.; Tuncali, K.; Silverman, S.G. Correlation and simple linear regression. Radiology 2003, 227, 617–628. [Google Scholar] [CrossRef]
- Statistix 8. Statistix 8: Analytical Software User’s Manual; Statistix 8: Tallahassee, FL, USA, 2003. [Google Scholar]
- Monti, A.; Amaducci, M.T.; Venturi, G. Growth response, leaf gas exchange and fructans accumulation of Jerusalem artichoke (Helianthus tuberosus L.) as affected by different water regimes. Eur. J. Agron. 2005, 23, 136–145. [Google Scholar] [CrossRef]
- Zhang, H.Y.; Xie, B.T.; Duan, W.X.; Dong, S.X.; Wang, B.Q.; Zhang, L.M.; Shi, C.Y. Effects of drought stress at different growth stages on photosynthetic efficiency and water consumption characteristics in sweet potato. J. Appl. Ecol. 2018, 29, 1850–1943. [Google Scholar] [CrossRef]
- Kosar, F.; Akram, N.A.; Ashraf, M.; Sadiq, M.; Qurainy, F.A. Trehalose-induced improvement in growth, photosynthetic characteristics and levels of some key osmoprotectants in sunflower (Helianthus annuus L.) under drought stress. Pak. J. Bot. 2018, 50, 955–961. [Google Scholar]
- Henschel, J.M.; De Azevedo, S.V.; Figueiredo, M.C.; Dos Santos, S.K.; Dias, T.J.; Batista, D.S. Radish (Raphanus sativus L.) growth and gas exchange responses to exogenous ascorbic acid and irrigation levels. Vegetos 2023, 36, 566–574. [Google Scholar] [CrossRef]
- Laurie, R.N.; Du Plooy, C.P.; Laurie, S.M. Effect of moisture stress on growth and performance of orange fleshed sweet potato varieties. Afr. Crop Sci. J. 2009, 9, 235–239. [Google Scholar]
- Van Heerden, P.D.R.; Laurie, R. Effects of prolonged restriction in water supply on photosynthesis, shoot development and storage root yield in sweet potato. Physiol. Plant 2008, 134, 99–109. [Google Scholar] [CrossRef] [PubMed]
- Jalal, R.S.; Abulfaraj, A.A. Exogenous application of agmatine improves water stress and salinity stress tolerance in turnip (Brassica rapa L.). Not. Bot. Hortic. Agrobo. 2022, 50, 12601. [Google Scholar] [CrossRef]
- Dahal, K.; Li, X.Q.; Tai, H.; Creelman, A.; Bizimungu, B. Improving potato stress tolerance and tuber yield under a climate change scenario–a current overview. Front. Plant Sci. 2019, 10, 563. [Google Scholar] [CrossRef] [PubMed]
- Qin, J.; Bian, C.; Liu, J.; Zhang, J.; Jin, L. An efficient greenhouse method to screen potato genotypes for drought tolerance. Sci. Hortic. 2019, 256, 61–69. [Google Scholar] [CrossRef]
- Rolando, J.L.; Ramírez, D.A.; Yactayo, W.; Monneveux, P.; Quiroz, R. Leaf greenness as a drought tolerance related trait in potato (Solanum tuberosum L.). Environ. Exp. Bot. 2015, 110, 27–35. [Google Scholar] [CrossRef]
- Ruttanaprasert, R.; Jogloy, S.; Vorasoot, N.; Kesmala, T.; Kanwar, R.S.; Holbrook, C.C.; Patanothai, A. Relationship between chlorophyll density and SPAD chlorophyll meter reading for Jerusalem artichoke (Helianthus tuberosus L.). SABRAO J. Breed. Genet. 2012, 44, 149–162. [Google Scholar]
- Nasir, M.W.; Toth, Z. Effect of drought stress on morphology, yield, and chlorophyll concentration of hungarian potato genotypes. J. Environ. Agric. Sci. 2021, 23, 8–16. [Google Scholar]
- Deblonde, P.M.K.; Ledent, J.F. Effects of moderate drought conditions on green leaf number, stem height, leaf length and tuber yield of potato cultivars. Eur. J. Agron. 2001, 14, 31–41. [Google Scholar] [CrossRef]
Disclaimer/Publisher’s Note: The statements, opinions and data contained in all publications are solely those of the individual author(s) and contributor(s) and not of MDPI and/or the editor(s). MDPI and/or the editor(s) disclaim responsibility for any injury to people or property resulting from any ideas, methods, instructions or products referred to in the content. |
© 2023 by the authors. Licensee MDPI, Basel, Switzerland. This article is an open access article distributed under the terms and conditions of the Creative Commons Attribution (CC BY) license (https://creativecommons.org/licenses/by/4.0/).