Article

Growth, Yield, and Agronomic Use Efficiency of Delayed Sown Wheat under Slow-Release Nitrogen Fertilizer and Seeding Rate

by
Muhammad Rizwan Shoukat
1,2,†,
Yves N’Dri Bohoussou
3,†,
Naeem Ahmad
4,
Ibrahim A. Saleh
5,
Mohammad K. Okla
6,
Mohamed S. Elshikh
6,
Adeel Ahmad
7,
Fasih Ullah Haider
8,
Khuram Shehzad Khan
9,
Muhammad Adnan
10,
Quaid Hussain
11,* and
Muhammad Waheed Riaz
12,*
1
College of Water Resources and Civil Engineering, China Agricultural University, Beijing 100083, China
2
Department of Irrigation and Drainage, Faculty of Agricultural Engineering and Technology, University of Agriculture, Faisalabad 38040, Pakistan
3
College of Agronomy and Biotechnology, China Agricultural University, Beijing 100193, China
4
Key Laboratory of Crop Physi-Ecology and Tillage Science in Northwestern Loess Plateau, Ministry of Agriculture, College of Agronomy, Northwest A&F University, Yangling 712100, China
5
Faculty of Science, Zarqa University, Zarqa 13110, Jordan
6
Department of Botany and Microbiology, College of Science, King Saud University, P.O. Box 2455, Riyadh 11451, Saudi Arabia
7
Department of Agronomy, University of Agriculture, Faisalabad 38040, Pakistan
8
Key Laboratory of Vegetation Restoration and Management of Degraded Ecosystems, South China Botanical Garden, Chinese Academy of Sciences, Guangzhou 510650, China
9
College of Resources and Environmental Sciences, National Academy of Agriculture Green Development, China Agricultural University, Beijing 100083, China
10
Shenzhen Key Laboratory of Microbial Genetic Engineering, College of Life Sciences and Oceanography, Shenzhen University, Shenzhen 518060, China
11
Shenzhen Key Laboratory of Marine Bioresource and Eco-Environmental Science, College of Life Sciences and Oceanography, Shenzhen University, Shenzhen 518060, China
12
State Key Laboratory of Subtropical Silviculture, Zhejiang A&F University, Hangzhou 311300, China
*
Authors to whom correspondence should be addressed.
These authors contributed equally to this work.
Agronomy 2023, 13(7), 1830; https://doi.org/10.3390/agronomy13071830
Submission received: 8 June 2023 / Revised: 5 July 2023 / Accepted: 6 July 2023 / Published: 10 July 2023

Abstract

:
Delayed sowing of wheat is a common problem in Punjab that exacerbates serious yield loss. However, individual or combined applications of seed rate and slow-release nitrogen fertilizer significantly impacted their efficacy in improving crop growth and productivity. In this regard, the present study explored the potential of slow-release nitrogen fertilizers (control (CK), simple urea (SU), neem-coated urea (NCU), and sulfur-coated urea (SCU)) to improve the growth, yield, and physiological and biochemical attributes of delayed sown wheat with three seed rate [(100 kg ha−1 (S1), 125 kg ha−1 (S2), and 150 kg ha−1 (S3)]. The study was carried out at the Postgraduate Agricultural Research Station of the University of Agriculture Faisalabad in 2018–19 and 2019–20. The study findings revealed that the sulfur-coated urea performed better under S3 seed rate. Combining SCU with S3 significantly increased leaf area index by 0.99 cm2 and plant height by 8.24% compared to simple urea, maximum spikelets, and spike length by 3.9 and 3.8 cm, respectively. The SCU with S3 treatment also increased the biological yield by 43% and 41% and the grain yield by 46% in 2018–2019 and 2019–2020, respectively, compared to CK. Similarly, higher N contents in straw and grain were recorded in the interaction of SCU with S3 treatment. Likewise, the SCU with S3 treatment enhanced the physiological attributes, i.e., chlorophyll contents and transpiration rate, by 18% and 25%, respectively, and decreased internal CO2 by 25.5%, compared to CK. In conclusion, applying sulfur-coated urea with a seed rate of 150 kg ha−1 could be considered a potential strategy for improving the growth and productivity of delayed sown wheat.

1. Introduction

Wheat (Triticum aestivum L.) is Pakistan’s most significant and commonly grown grain crop [1]. It is the country’s primary source of nutrition, and its need grows every year as the country’s population grows and the yield per unit area remains unchanged [2]. This crop covers 70% of the winter in Pakistan and 37% of the overall planted area. Growing world population, urbanization, climate change, and natural resource degradation are only a few of the key difficulties affecting wheat production, particularly in developing nations [3]. Although new cultivars with increased yield potential are available, ineffective agricultural management techniques prevent them from reaching their full potential [4]. Increasing the efficiency and productivity of various types of farming is critical for meeting future food demands while maintaining environmental integrity [5]. As a result, farmers must use appropriate crop production technologies that provide cost-effective and long-term crop production prospects and conserve natural resources [6]. The utilization of improved seeding rates and nitrogen (N) application has become a vital component of agricultural growth to save natural resources [7].
In winter wheat, growing the seeding rate appropriately is thought to be the key to enhancing grain production and N accumulation [8]. According to Dai et al. (2014) [8], proper seeding rate can result in increased grain yield and nitrogen use efficiency (NUE) by boosting nitrogen uptake efficiency (UPE) and above-ground nitrogen uptake (AGN). Wheat grain yield was found to have a positive quadratic relationship with the N application rate [9]. However, NUE, UPE, UTE, and NHI were found to decrease with an increased N application rate [10]. Because stems are weaker under high-input circumstances, high seeding rates and high N levels have been demonstrated to increase the risk of lodging [11]. Furthermore, decreasing the N application and increasing seeding rate allow for efficient N absorption at deep soil levels, resulting in high grain yield, NUE, UPE, and UTE in winter wheat [8]. Because of the low N uptake owing to the tiny numbers of roots in winter wheat, an erroneous N application date (during the early vegetative stage) frequently results in poor N fertilizer utilization [12]. Extensive research has shown that synchronizing N supply and crop demand by adjusting N application date and rate can result in high grain yield and N efficiency [13]. In general, delayed sowing of wheat improves stem strength by increasing stem diameter and wall thickness, resulting in significantly improved lodging resistance; however, delayed sowing shortens the vegetative stage, reducing spikes and decreasing grain yield [14]. As a result, the seeding rate should be increased to compensate for the negative consequences of the delayed sowing by increasing the number of main stem spikes per unit area. Grain nitrogen concentration (GNC) is unchanged, increased, or decreased when planting time is delayed [15]. Grain yield and NUE could be maintained by seeding late and raising UTE because of a lower GNC [16].
Warming temperatures in recent decades have resulted in longer growing seasons before wheat winters, encouraging farmers to postpone sowing winter wheat [17]. It’s unknown how the seeding delay will influence wheat yields. Winter wheat grain yields have been proven to increase, sustain, or decrease [18]. Late sowing decreases N uptake and buildup in wheat crops in general [19]. Excess N fertilizer can negatively affect wheat crop production and the environment due to nitrate leaching and N2O emissions [20]. Improving NUE is one of the most efficient ways to boost crop output while reducing environmental damage and farmer expenses [21]. Grain yield per unit of N available (from the soil and fertilizer) is defined as nutrient use efficiency, which is further separated into N uptake efficiency (crop N uptake/N available, or UPE) and N utilization efficiency (grain yield/crop N uptake, or UTE) [19]. The crop N utilization efficiency (UTE) is calculated as a function of the grain yield of the plant [22]. Improving UTE reduces nitrogen consumption while maintaining or even increasing yield and potentially reducing excess nitrogen fertilizer input. Slow-release fertilizers comprise semi-permeable layers of essential oils and secondary and primary nutrients that control granular water solubility by slowing the hydrolysis of water-soluble fertilizers [23]. Compared to monotypic urea, sulfur-coated urea (SCU) has boosted wheat growth and development. The elements S and N have a positive association with wheat [24]. The S element is a secondary element utilized as a fungicide and has acidic qualities that help to counteract soil alkalinity [25]. As a result, excessive N application without the use of the coating substance S results in maximal N leaching and a reduction in NUE [26]. The slow-release neem-coated urea (NCU) nitrification inhibitor properties increase NUE and yield. In general, neem oil contains azadirachtin, de-acetyl, epilimnion, melicians, and salanin components, which have been shown to suppress nitrification in a treatment-based technique [27]. As a result, the judicious application of nitrogen fertilizers and sources reduces crop losses, increases NUE, and increases crop production. The environmentally friendly fertilizer products are made from a degradable microorganism’s material coating that extends the diffusion time of fertilizer granules through a gradual release technique [28]. Nitrogen use for grain crop productivity in developing countries is expected to triple by 2050 [29]. There need to be more studies on the effects of coated urea on wheat in arid climates.
A previous study has suggested that delaying winter wheat sowing may improve crop productivity as a function of plant nitrogen use. However, only a few studies have investigated how crop N status, NUE, UPE, and UTE are affected by delayed sowing of wheat, slow-release nitrogen fertilizer, and seeding rate. It also needs to be clarified how the delayed sowing date affects the NNI, NUE, UPE, and UTE. Crop management and breeding techniques that enhance productivity in low-nitrogen situations with slow-release nitrogen fertilizer will benefit from a better understanding of UTE variation-related plant physiological processes. As a result, the goal of this study was to assess (i) the effects of varying crop N status by slow-release nitrogen fertilizer and seeding rate on physiological and biochemical attributes of wheat under delayed sowing, and (ii) the potential for improving NUE by slow-release nitrogen fertilizer and seeding rate under late sowing without compromising grain yield.

2. Materials and Methods

2.1. Experimental Site

This field research was conducted at the Post-graduate Agricultural Research Station, University of Agriculture Faisalabad, Pakistan (31°25′ N, 73°05′ E, and 213 m altitude) during 2018–19 and 2019–20. The experimental site has a sandy loam soil texture, and the physicochemical parameters of the soil were assessed from a 0–20 cm soil layer following the approach of Estefan et al. (2013) [30], and the soil contained pH 7.8, electrical conductivity 1.86 dS m−1, organic carbon 1.3 g kg−1, total N 0.42 g kg−1, available P 4.6 mg kg−1, and extractable K 275 mg kg−1. Soil organic carbon, total N, and available P were measured by following [31,32,33], and extractable K was determined by extraction with ammonium acetate [34]. The climatic data were acquired during the experiment at the UAF meteorological observatory (Figure 1).

2.2. Experimental Details

Treatments were arranged in triplicate using a randomized complete block design (RCBD) with split plot arrangements. The experimental treatments comprised three seeding rates (100 kg ha−1 (S1), 125 kg ha−1 (S2), and 150 kg ha−1 (S3)) and four types of nitrogen fertilizers: control (CK), simple urea (SU), neem-coated urea (NCU), sulfur-coated urea (SCU).

2.3. Experimental Material

Good-quality seeds of wheat (cv Ujala-2016) were used in this experiment, and the seed material was obtained from the Ayub Agricultural Research Institute, Faisalabad, Pakistan. Seed moisture content was <12%, and germination percentage was ~95%.

2.4. Crop Husbandry

Seeds were sown with a manual hand-sowing drill into a prepared seedbed (three plowings and two plankings) by maintaining a row-to-row distance of 23 cm. The wheat crop was sown on 10 December 2018–19 and 2019–20. Based on soil analysis, fertilizers including nitrogen, phosphorus, and potassium were applied at 100, 65, and 65 kg ha−1, respectively. The whole amount of phosphorus, potassium, and one-third of nitrogen was applied at basal; the remaining nitrogen was supplemented in two equal splits at tillering (25 days after sowing) and booting (55 days after sowing) stages using DAP (Di Ammonium Phosphate) and SOP (Sulphate of Potash) and urea sources (simple urea and neem-coated urea) provided by Engro Fertilizer Limited, Pakistan, whereas sulfur-coated urea was provided by Adfert, UAE. The crop was harvested on 27 and 28 April 2019 and 2020, respectively.

2.5. Observations and Measurements

2.5.1. Growth and Yield-Related Traits

Leaf area was measured using a leaf area meter (CI-203, CID Bioscience, Camas, WA, USA). The leaf area was measured at the booting stage. The leaf area index was estimated based on leaf area/land area. At crop maturity, plant height and spike length were measured from 10 randomly selected plants in each plot with the help of a measuring tape and then averaged. To determine the number of grains and spikelets per spike, ten randomly selected spikes from each plot were taken, the number of grains and spikelets was manually counted, and then averaged. 1000-grain weight was recorded using an electronic weight machine, and three samples were taken from each plot within each replication and averaged. Grain yield was recorded (approximately at 14% moisture content) from each experimental plot.

2.5.2. Physiological Attributes

Plant chlorophyll contents were recorded in at least six leaf spaces using a SPAD-502 [35]. The second leaf from the apex was used for chlorophyll measurement at the vegetative stage. The plant’s physiological attributes, i.e., intercellular CO2 concentration (Ci), net photosynthetic rate (Pn), stomatal conductance (Gs), and transpiration rate (Tr), were assessed by a Portable Gas Exchange Fluorescence System model GFS3000 (Walz Heinz GmbH, Eichenring, Efeltrich, Germany) at the booting stage 75 days after sowing. Three readings from each experimental plot were taken and then averaged.

2.5.3. Biochemical Attributes

Straw and grain samples for nitrogen (N) analysis were collected at the final harvest. N contents in straw and grain were determined using the Kjeldahl method [36]. Additionally, agronomic N efficiency (AEN) and N partial factor productivity (PFPN) were computed by using Equations (1) and (2).
A E N = Grain   yield   in   N   fertilized     Grain   yield   without   N   fertilization N   application   rate
P F P N = Grain   yield N   application   rate

2.5.4. Statistical Analysis

Microsoft Excel 2013 was used for data processing. The collected data regarding various growth, yield, and physiological and biochemical attributes were analyzed through analysis of variance using the M STAT C Package. In addition, a two-way ANOVA was used by assuming the year as a second factor. The mean values were assessed for the statistical differences using the least significant difference (LSD) test at a 5% probability level.

3. Results

3.1. Growth and Yield

Different slow-release fertilizers and seeding rate significantly affected the morphological growth, grain yield, and yield-related attributes in two wheat growing seasons. Compared with the control, combined SCU+S3 and NCU+S3 significantly increased the productive tillers, spikelets, grain weight, biological yield, and grain yield of two growing seasons of the wheat cultivar (Table 1). However, compared to 2018–2019, the plant harvest and yield index remained unaffected in the wheat growing seasons of 2019–2020 (Table 1). At the individual level, the effects of seeding rate (S3) and fertilizer application (SCU) were more beneficial for plant growth and yield. Under SU treatments, the wheat cultivar’s growth and yield performance at the S3 seed rate were lower than SCU (Table 1).
The number of productive tillers was higher under slow-release fertilizer and different fertilizers applied during both wheat seasons. During 2018–2019, the significantly higher number of productive tillers was observed (~74), and almost the same numbers of tillers were observed in 2019–2020 under seed rate S3 and SCU application compared to control (Table 1). Compared to the control, the number of grains per spike with the mean value was approximately 8.76 under SCU with seed rate S3 application in both wheat seasons 2018–2019 and 2019–2020. In the SU application, the grains per spike had a mean value of about 4, which was lower than that in the SCU application (Table 1). The data in Table 1 showed a higher increase in grain weight when combined SCU and S3 were applied to wheat crops in both seasons. Particularly, the maximum grain weight was 9.4 g with inputs of SCU and S3, and the same trend was noticed. The biological yield of wheat plants was significantly affected in both seasons (2018–2019 and 2019–2020). Under the application of SU with a seed rate of S3, the biological yield was 10.6, which was lower than the SCU application of 11.8 in 2018–2019 and 2019–2020. Compared to the control, the increase in biological yield was 43% and 41% in 2018–2019 and 2019–2020, respectively (Table 1). Similarly, compared to the control, the wheat grain yield significantly increased by 46% under the SCU and S3 applications in 2018–2019 and 2019–2020. In the case of the SU application, there was a lower grain yield of about 26.68% in both seasons.
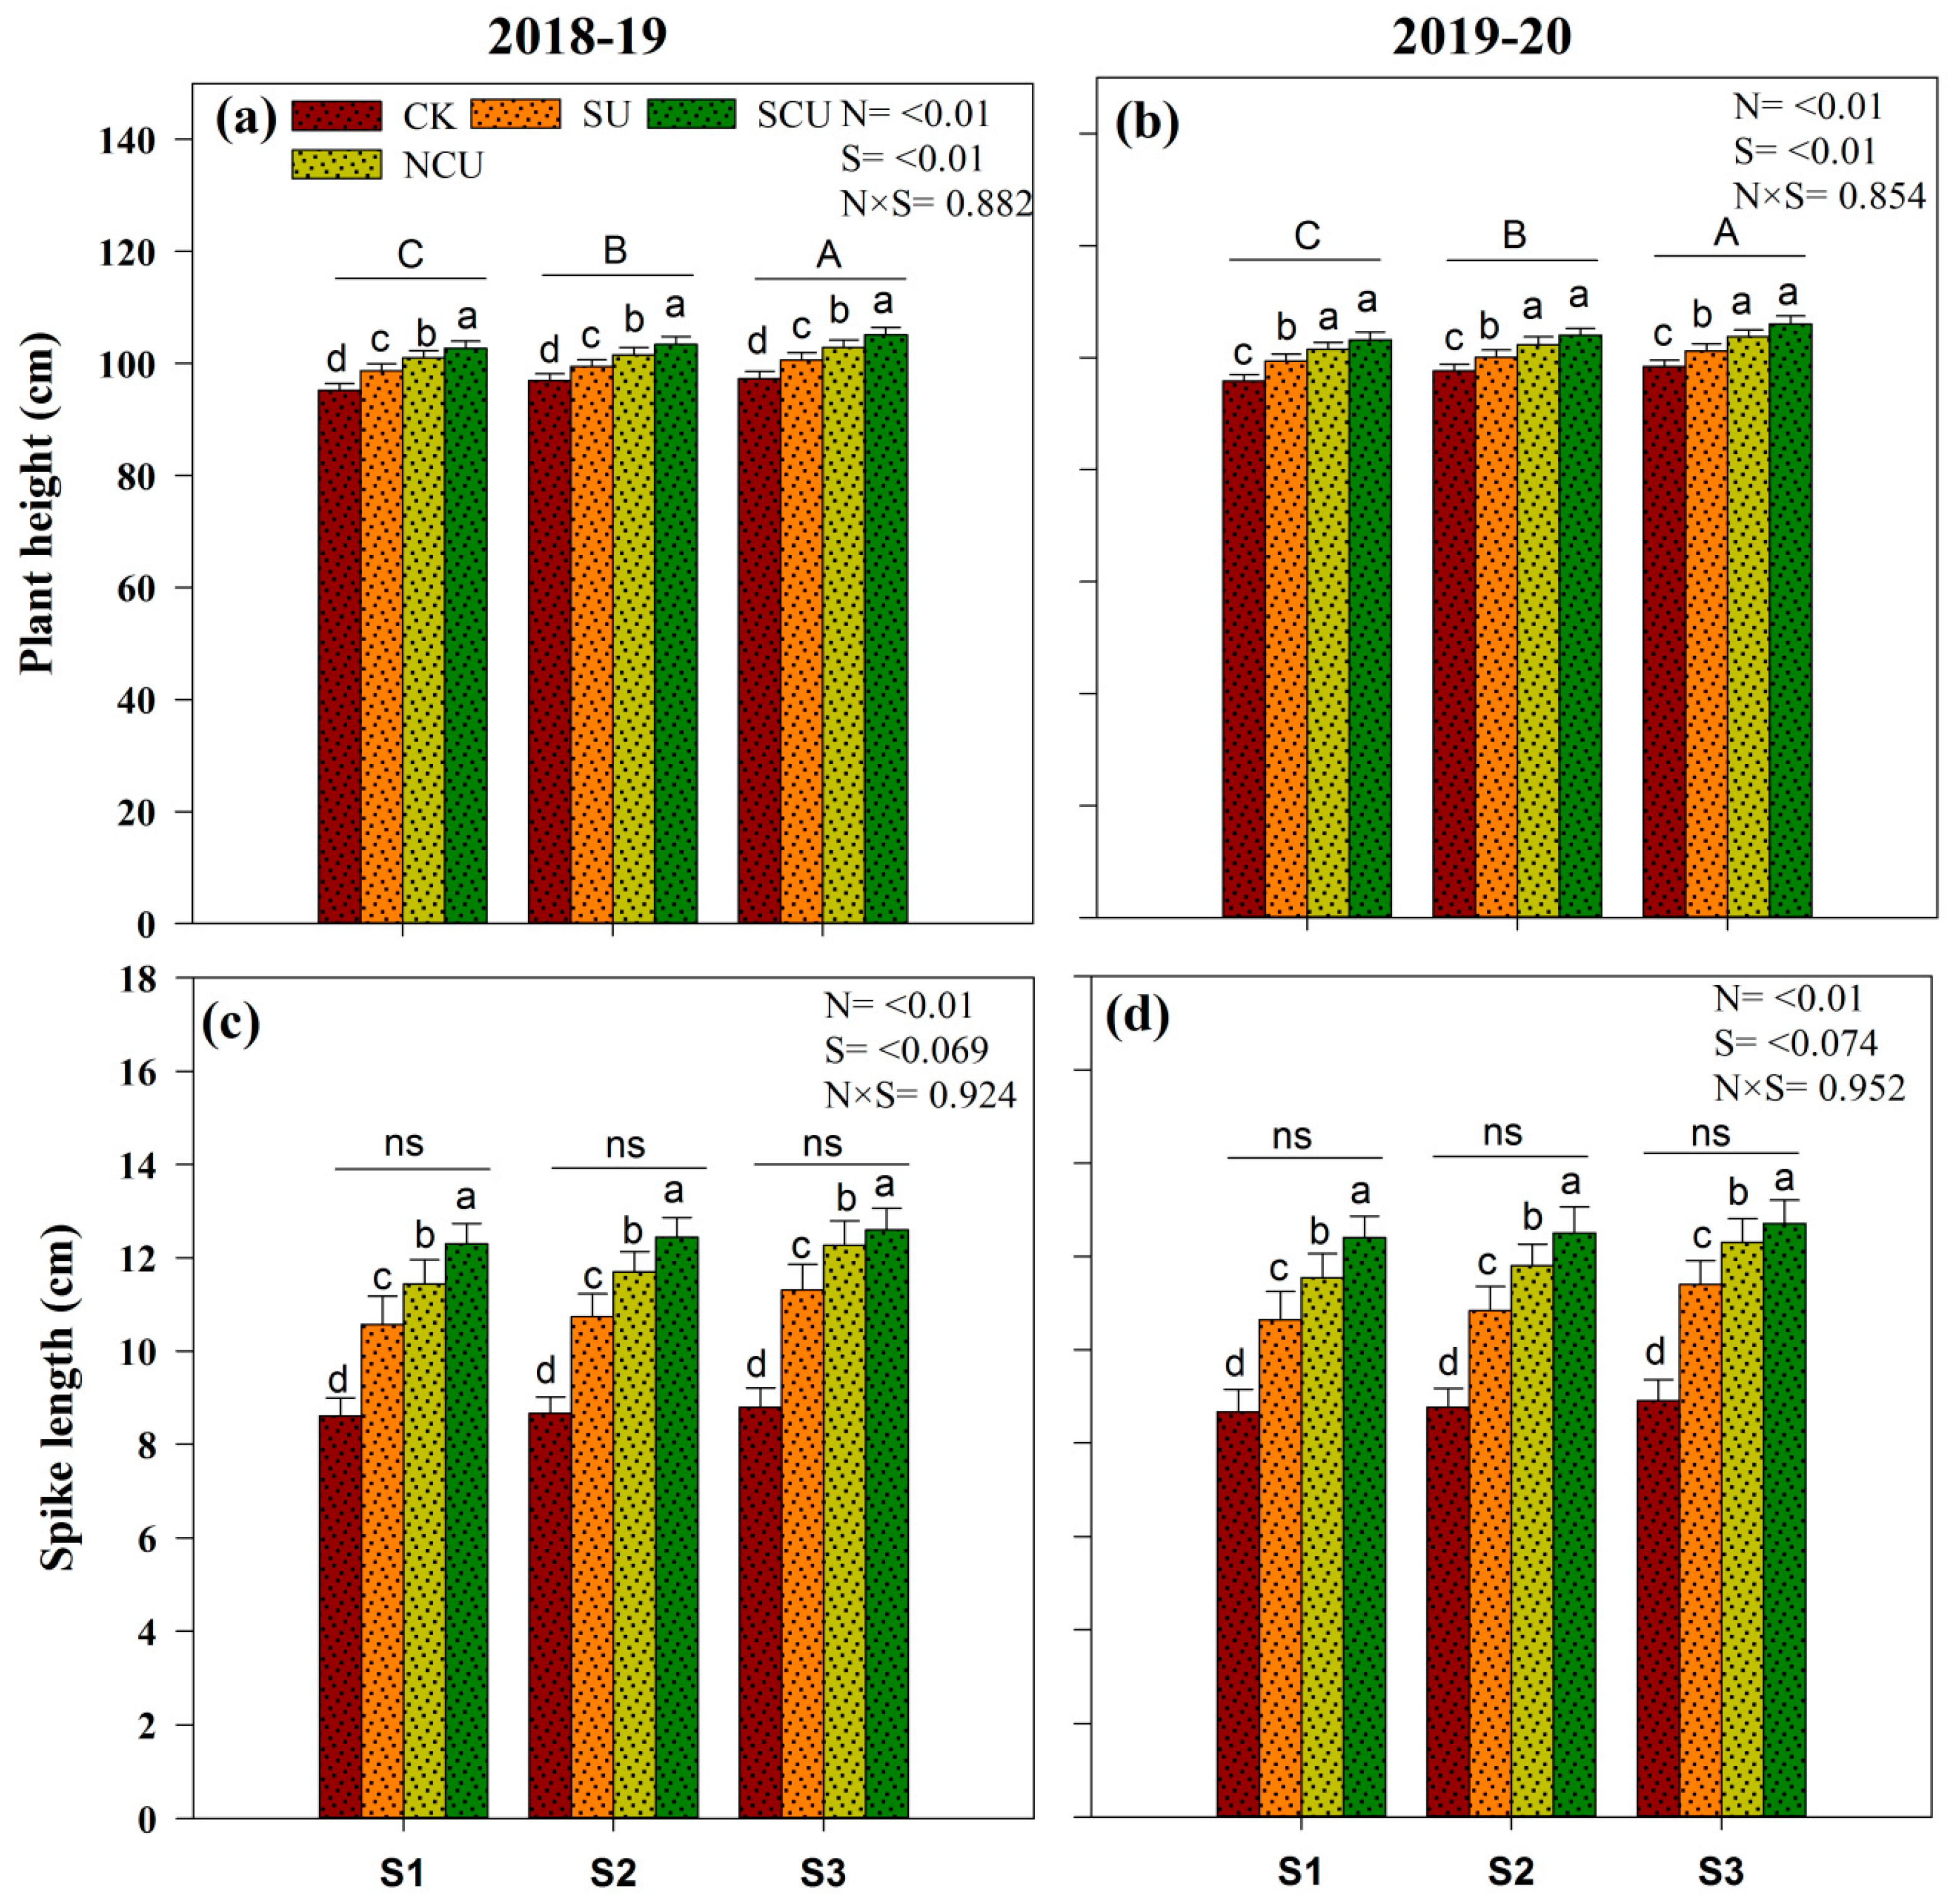
Similarly, the plant height was markedly higher, almost 8.24% under the seed rate of S3 with SCU compared to simple urea in both wheat seasons, 2018–2019 and 2019–2020 (Figure 2a,b). In the 2018–2019 and 2019–2020 wheat growing seasons, the maximum spikelets and spike length were observed when SCU was applied at a seed rate of S3. The mean values of spikelets and spike length were nearly 3.9 and 3.8 cm, respectively, while the increased spikelets had a minimum mean value of ~1.4 and a spike length of about 1.96 cm with SU treatment (Figure 2c,d).

3.2. Physiological and Photosynthetic Activities

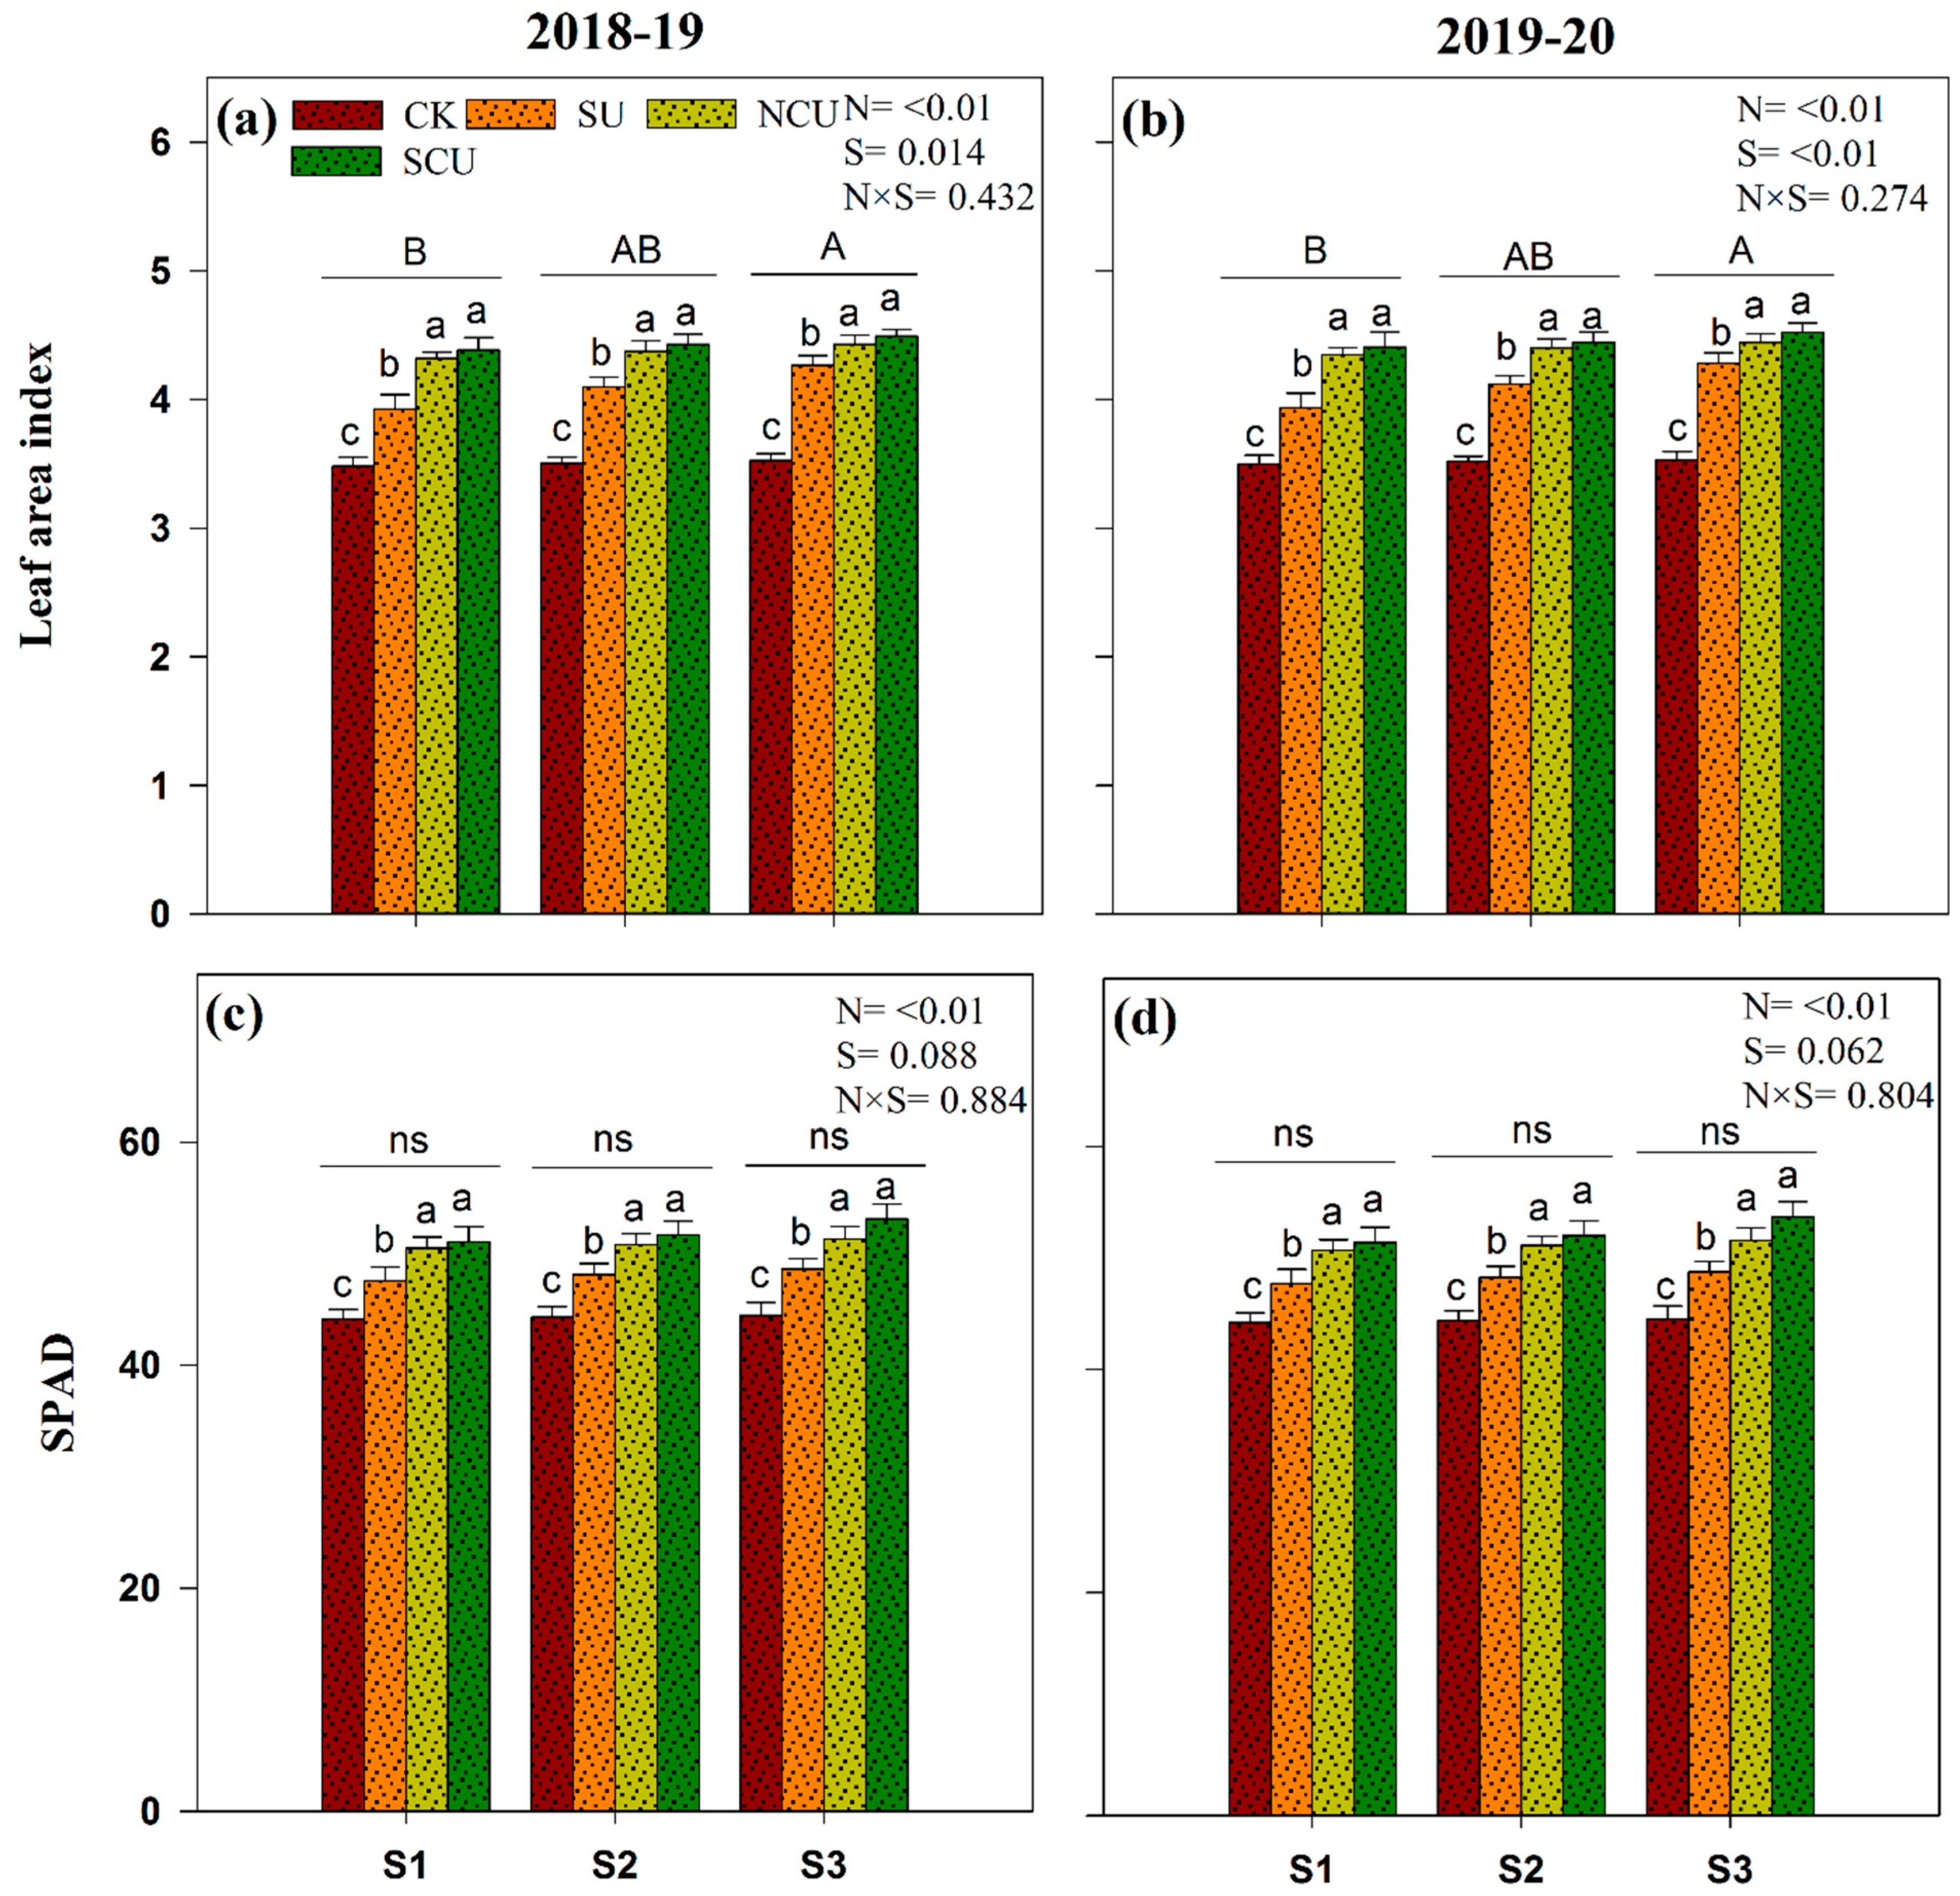
Simple fertilizer (urea) application or coated fertilizers increased the leaf area, plant height, and spike length of both seasons of the wheat cultivar. Compared with the control, SCU at the S3 rate significantly increased the leaf area by about 0.99 cm2, but under the SU application, the leaf area index was around 0.74 cm2 in both seasons, 2018–2019 and 2019–2020 (Figure 3a,b).
The leaf chlorophyll contents of wheat apex tissues were significantly (p < 0.05) increased under the slow-release fertilizer SCU with seed rate S3 in both seasons. In both seasons of wheat sowing, 2018–2019 and 2019–2020, the SPAD value of plant tissue was approximately 18% higher than the control, while in the case of SU application, the SPAD value was about 9.3% (Figure 3c,d).
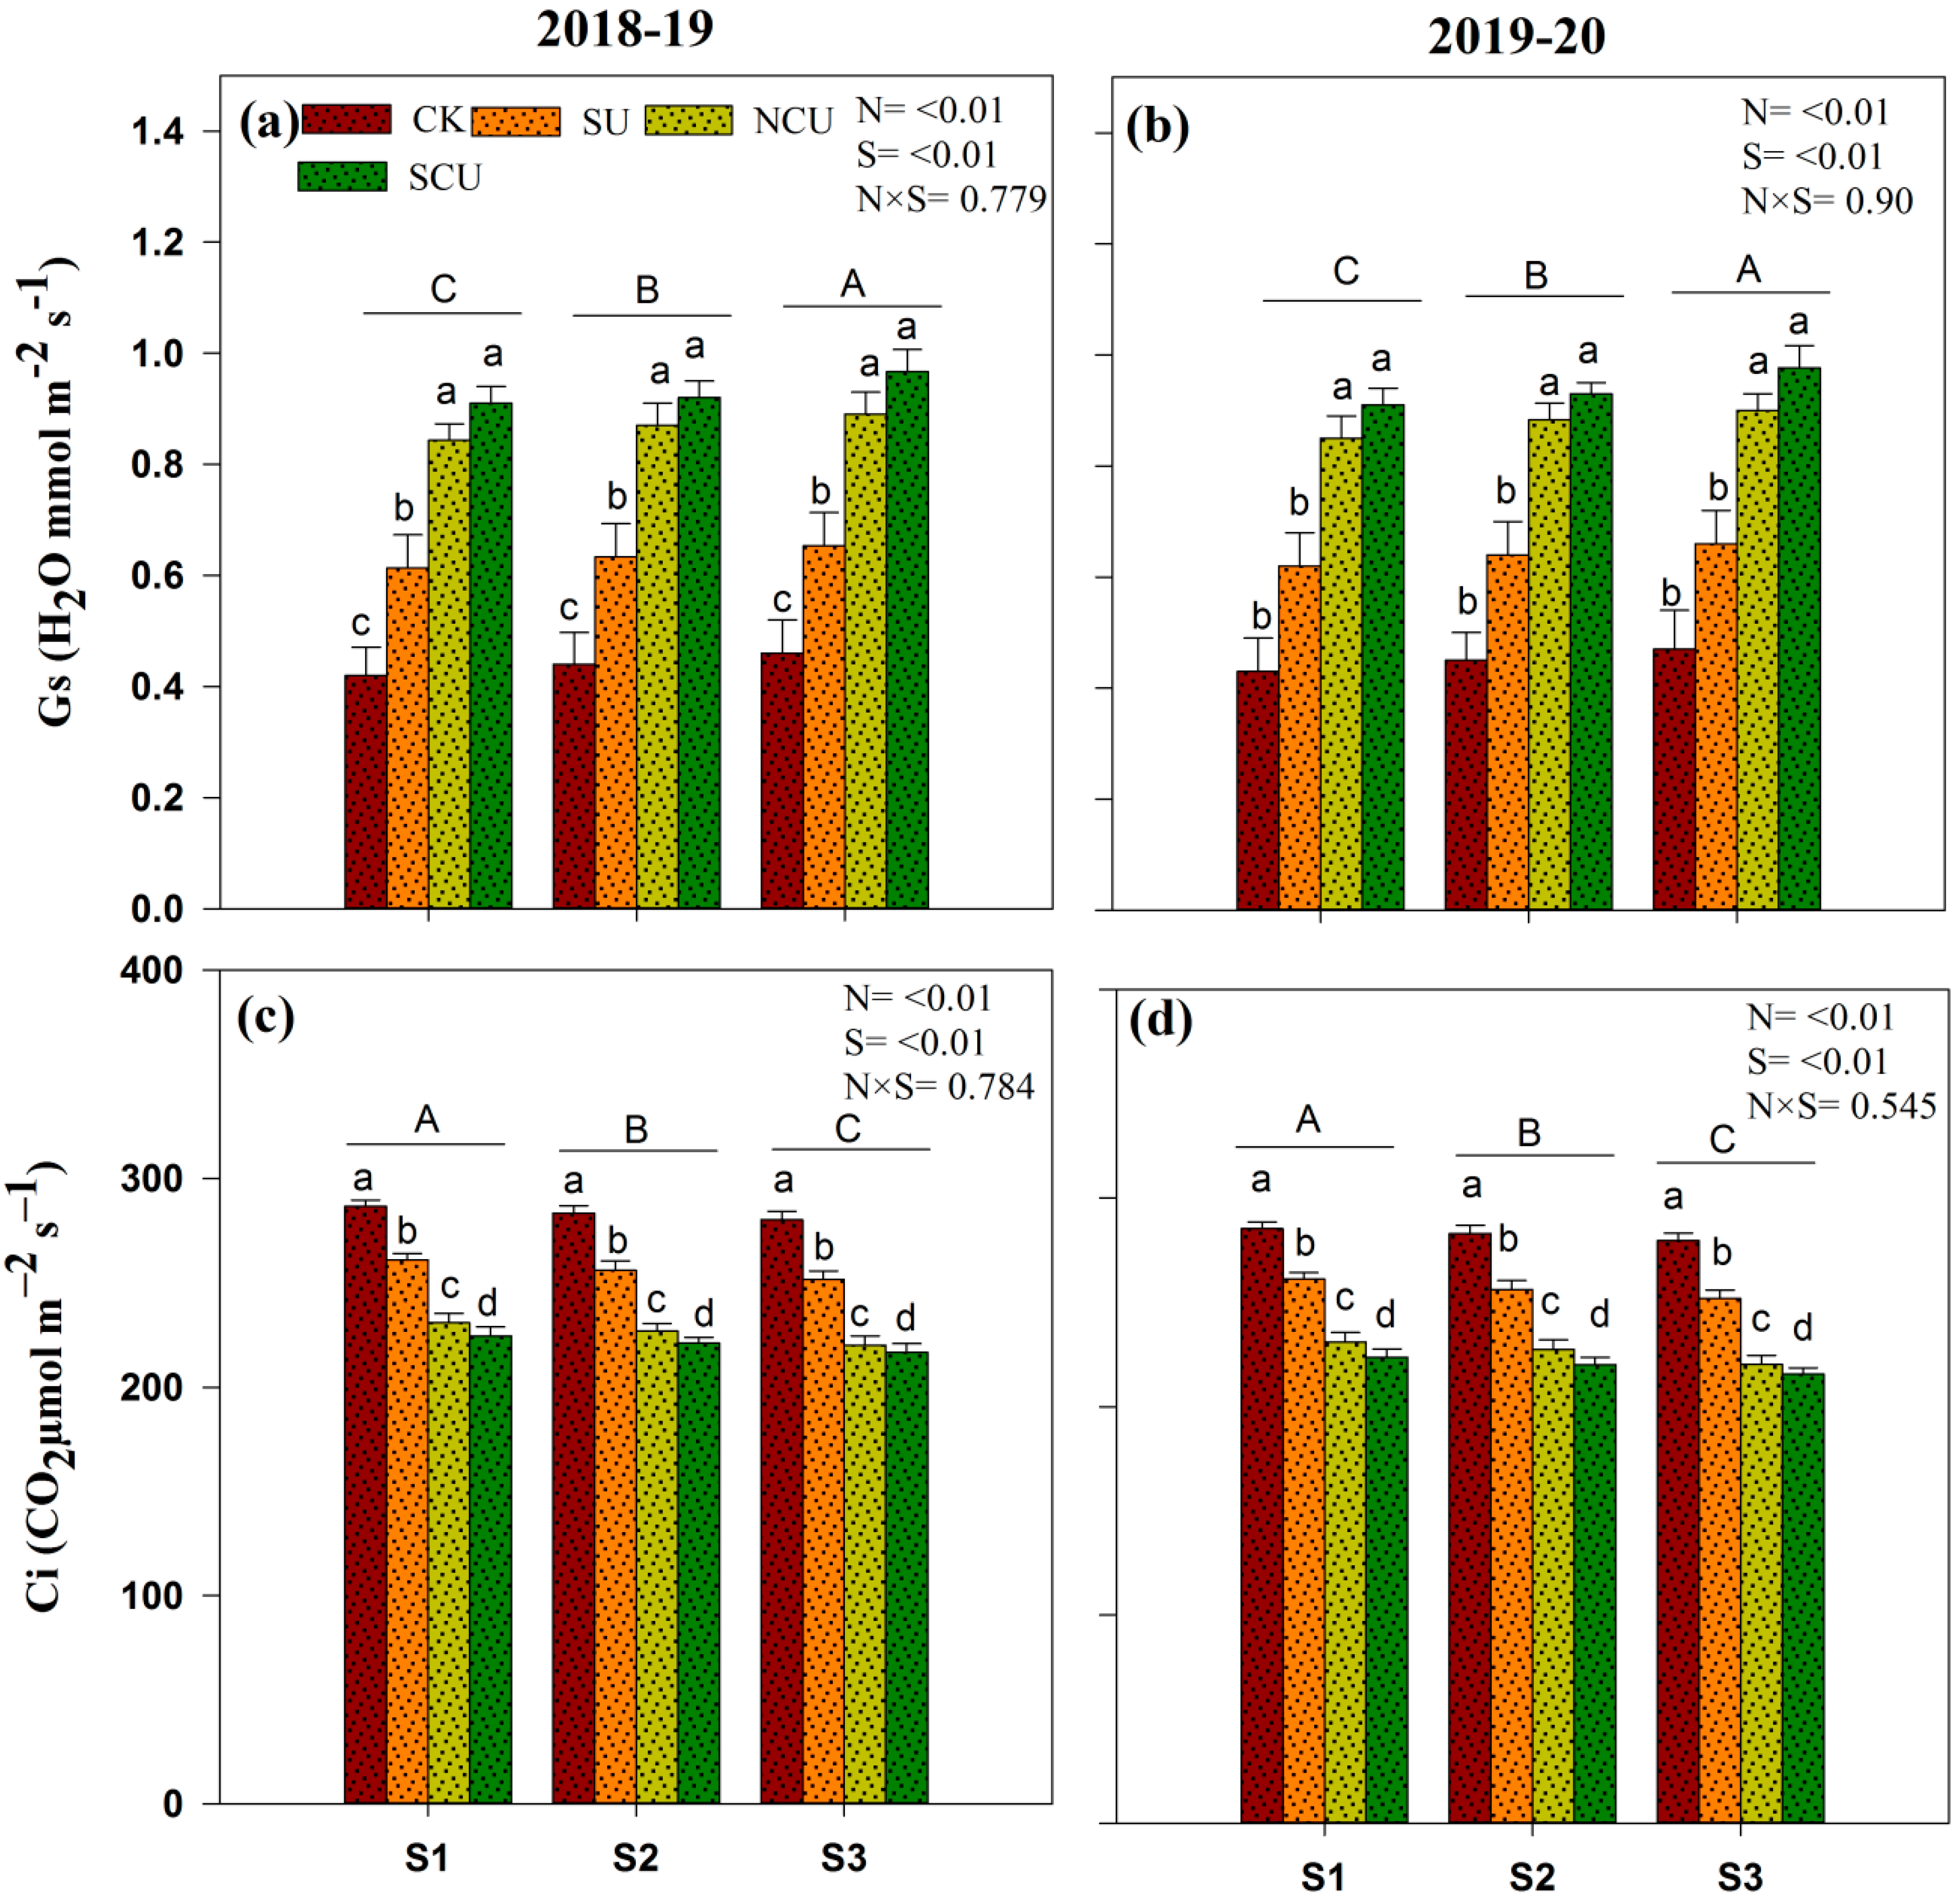
Combined seed rate S3 and SCU treatment, the range of photosynthetic rate (Pn) was 21.18–21.44 (CO2 μmol m−2 s–1), while the SU amendments showed lower results than SCU (Figure 4a,b). Data in Figure 4c,d showed that the plant transpiration rate (Tr) was significantly higher, approximately 25% higher, compared to the control, under the inputs of SCU along with seed rate S3. The present study results demonstrated that with the SU application, the plant stomatal conductance (Gs) rate was lower than that of SCU inputs. However, when SCU was appliedto wheat, the mean difference in Gs rate in plant tissues was about 0.44 (Figure 5a,b). The study showed that SU input affected the Gs rate slightly compared to SCU application and seed rate S3 (Figure 5a,b). During 2018–2019 and 2019–2020, the intercellular CO2 concentration (Ci) of plant tissues also followed the opposite trend with Pn, Tr, and Cs concentrations under the seed rate S3 and the addition of SCU (Figure 5c,d). Moreover, study results revealed that during both sowing seasons of the wheat crop, the maximum Ci concentration under the control condition was almost 280.06 (CO2 μmol m−2 s–1) (Figure 5c,d). In contrast, the minimum mean value was about 216 under combined SCU and S3 (Figure 5c,d).

3.3. Grain and Straw Nitrogen Content/Nutrient Uptake

Compared with the control treatment, slow-release fertilizer and seed rate affected nitrogen (N) concentrations in grain and straw in both wheat seasons. In contrast, combined SCU with seed rate S3 significantly increased grain and straw N concentrations in both seasons, 2018–2019 and 2019–2020 (Table 2). The N concentrations in grain and straw of the 2018–2019 wheat season under SCU and S3 applications were statistically similar to those in 2019–2020. Under these fertilizer and seed rate treatments, N concentrations in plant parts in both wheat seasons were in the order of grain N > straw N, which shows that grains are the main drain for this nutrient. Exposure to different fertilizers and seed rate individually did not significantly alter the N concentrations in the grain and straw of both wheat seasons concerning control. However, SCU with seed rate S3 application increased grain N and straw N concentrations in 2018–2019 and 2019–2020 (Table 2). The concentrations of N in the grain and straw of the wheat cultivar were 63% and 61.5%, respectively, higher than the control in 2018–2019, while in 2019–2020, grain N and straw N concentrations were 65% and 48.27%, respectively, which indicates that wheat sown in 2019–2020 accumulated fewer N nutrients than wheat sown in 2018–2019, under SCU and S3 rate (Table 2). Whereas in 2018–2019 and 2019–2020, SU application with seed rate S3, the concentration of N in plant parts such as grain and straw was almost similar, at 24% and 16%, respectively, which indicates a lower N concentration in both grain and straw than in the SCU application (Table 2).

3.4. Agronomic Efficiency and Nitrogen Partial Factor Productivity

The agronomic efficiency and nitrogen partial factor productivity were significantly (p < 0.05) affected under different fertilizer and seed rate in both wheat growing seasons 2018–2019 and 2019–2020 (Table 2). Study results depicted that agronomic efficiency varied between treatments, but overall results of the SCU with S3 treatment were significant in both wheat seasons. Compared to SU, the maximum mean value of agronomic efficiency of approximately 8.6 was found under SCU and seed rate of S3 in 2018–2019, and the same trend was observed in 2019–2020 (Table 2). Similarly, all treatments’ partial nitrogen factor productivity varied compared to the control. During 2018–2019 and 2019–2020, significantly higher partial nitrogen factor productivity was observed under the SCU and S3, which was about 26.3% compared to the SU application. This indicates that using slow-release fertilizer and S3 seed rate resulted in optimum agronomic efficiency and nitrogen partial factor productivity (Table 2).

4. Discussion

Nitrogen fertilizer has become essential for agricultural production as it is involved in many growth and development processes. Nitrogenous fertilizers improve crop yields, but on the other hand, they are deteriorating nature and increasing pollution. Wheat has the highest nitrogen loss in crops due to poor irrigation and fertilization. Good agronomic practices can reduce nitrogen losses and enrich them by increasing yields. Urea coating is a friendly and inexpensive method. The deficiency of micronutrients such as sulfur can also be reduced by their incorporation into primary fertilizers.
Slow-release fertilizers can improve crop root development and nutrient uptake capacity [37]. In this experiment, plants responded differently to urea-coated fertilizers at various seeding rate. We investigated the relationship between seed rate and nitrogen-coated and non-coated fertilizers. Poor irrigation results in N loss through leaching, volatilization, and denitrification in simple fertilizers [38], leading to low nitrogen recovery in the soil and insufficient nitrogen supply at a later growth stage, which declines dry matter synthesis in plants. However, the release of ammonia can be slowed down by coating, reducing the rate at which the N fertilizer is released, configuring nitrogen supply with the demand of the plant, and maintaining a constant supply of nutrients during the growth period, thereby enhancing the ability to produce more dry matter and yield [27]. Wheat showed an excellent response to coated fertilization with S3 level of 150 kg ha−1 compared to urea alone (Table 1 and Table 2).
Experiments show that different seeding rate and coating N fertilizer (SCU and NCU) can attain higher LAI, which aligns with Dimkpa et al. (2020) [39]. The neem-coated urea and sulfur-coated urea improved LAI because of less volatilization and nitrogen leaching [1]. Gudge et al. (2019) [36] reported that SCU and NCU enhanced the LAI of maize when compared to simple urea. Shivay et al. (2016) [26] reported that 5% SCU application on wheat increased the LAI to 4.85. The SCU fertilizer at the S3 seeding rate showed higher number of seeds per spike and greater spike length. The effect of different seeding rate fertilized by SCU and NCU on wheat crop is consistent with the results presented by other researchers [26,36]. Ahmad et al. (2022) [38] also showed a significant increment in spikelets per spike and spike length with increasing seeding density (150 kg ha−1). Ghafoor et al. (2021) [1] also found improvements in yield components (number of panicles per hill and grains per panicle) with the application of coated fertilizers.
Productive tillers are one of the main attributes determining yield, which results in more spikelets per spike and ultimately contributes towards grain formation. During 2018–2019, a significantly higher number of productive tillers was observed (~340), and almost the same number (344) was observed in 2019–2020 under seed rate S3 and SCU application compared to control. The increment in seed rate had a significant impact on tiller production. Similarly, Gupta et al. (2022) [40] found that the 125% NCU significantly affected agronomic parameters compared to other treatments. Ghafoor et al. (2021) [1] also noted that NCU performed significantly in tiller production. Gupta et al. (2022) [40] also found that the coated fertilizers improved the yield and yield components of the wheat crop. Similarly, the plant height was markedly higher, almost 8.24%, under the seed rate of S3 with an amended source of SCU compared to simple urea in both wheat seasons, 2018–2019 and 2019–2020. Ahmad et al. (2022) [38] observed the tallest plant (104.1 cm) at a 150 kg ha−1 seed rate. It was also observed that coated urea significantly affected plant height, and the highest plant height was noted in SCU compared to simple urea [10,41]. The number of tillers increases with the increase in seed rate [42] and coated urea fertilizers [43].
According to our findings, SCU at S3 levels increased grain yield. Similarly, Iqbal et al. (2012) [41] observed maximum grain yield at a 150 kg ha−1 seed rate. These results are confirmed by Suganya et al. (2007) [42] and Zheng et al. (2016) [10], who reported maximum grain yield when coated urea fertilizer was applied to wheat. The SCU effectively increased grain yield by lowering rhizosphere pH, and these findings correlated with those previously observed [44,45,46]. Grain yield and weight were significantly higher in NCU than in simple urea [47,48]. The 4–5% SCU indicates a higher grain yield for wheat at 9.58–11.21% [26].
Our results are in line with those of Zheng et al. (2016) [10], who indicated that the coated fertilizer significantly increased the thousand-grain weight of wheat. Compared with other nitrogen sources, slow-release nitrogen fertilizers have the highest thousand-grain weight of wheat. Haseeb-ur-Rehman et al. (2022) [45] indicated that a maximum thousand-grain weight was recorded in sulfur-coated urea compared to granular urea.
The biological yield of wheat plants was significantly affected during both seasons, 2018–2019 and 2019–2020. Compared to the control, the increase in biological yield was 43 and 41% in 2018–2019 and 2019–2020, respectively. The findings showed that the S3 seeding level, NCU, and SCU improved the total dry matter of crops and confirmed the findings of researchers The slow-release urea fertilizer enhanced the fertility of the soil. It improved yield and associated attributes (tillers, grain numbers, and weight) and total dry weight [1]. Ghafoor et al. (2022) [39] also reported a positive relationship between seed rate with coated urea and growth parameters like LAI, total dry weight, and grain weight for wheat. Haseeb-ur-Rehman et al. (2022) [45] presented that sulfur-coated urea has a higher biological yield than simple urea.
Sulfur is essential for the physiological functions of plants, including the production of chlorophyll, which aids in synthesizing other components, including carbohydrates, lipids, and oils. In both seasons of wheat sowing, 2018–2019 and 2019–2020, the SPAD value of plant tissue was approximately 18% higher than the control, while in the case of SU application, the SPAD value was about 9.3% higher. Joshi et al. (2014) [48] reported that coated nitrogen fertilizer enhanced chlorophyll concentration to 42.05 (SPAD) in maize. These findings are also confirmed by Mustafa et al. (2022) [49], who noted that sulfur-coated urea increased the chlorophyll contents and grain yield in maize. Similarly, under the combined seed rate of 150 kg ha−1 and SCU treatment, the photosynthetic rate (Pn) range was 21.18–21.44 (CO2 μmol m−2 s–1), while the SU amendments showed lower results than SCU. Our findings align with Mohsin et al. (2020) [50], who reported that NCU applied at a rate of 75 and 100% improved the photosynthetic rate in maize by 39.01 and 14.82%, respectively, compared to simple urea.
Nitrogen contents in grain and straw in both wheat seasons was impacted by slow-release fertilizers and seed rates compared to control treatments. The sequence of greater N concentrations in plant components in both wheat seasons was grain N > straw N under SCU and S3 treatments [50,51]. Exposure to different fertilizers and seed rates individually did not significantly alter the N concentrations in the straw and grain of both wheat seasons concerning control. The grain and straw nitrogen percentages improved significantly due to the long-term availability of nitrogen by using coated materials. Our results align with Mohsin et al. (2020) [50], who reported that NCU decreased nitrogen losses due to neem nitrification inhibitors and higher nitrate contents indicated by commercial urea fertilizer. These results are in accord with Gangurde et al. (2018) [51], who found that applying coated N fertilizer significantly enhanced the availability of N content (188.40 kg ha−1). Compared to urea coated in neem oil, SCU fertilizer increased plant nitrogen content. The results showed that urea coated with sulfur functioned better than urea coated with neem oil or simple urea. Urea fertilizer, coated with secondary minerals such as sulfur, improves the nitrogen release from urea to meet nitrogen requirements and dry matter accumulation. It reduces nitrogen release from urea, which helps improve nitrogen availability for a longer duration. SCU also reduced the leaching of nitrogen [49,52,53].
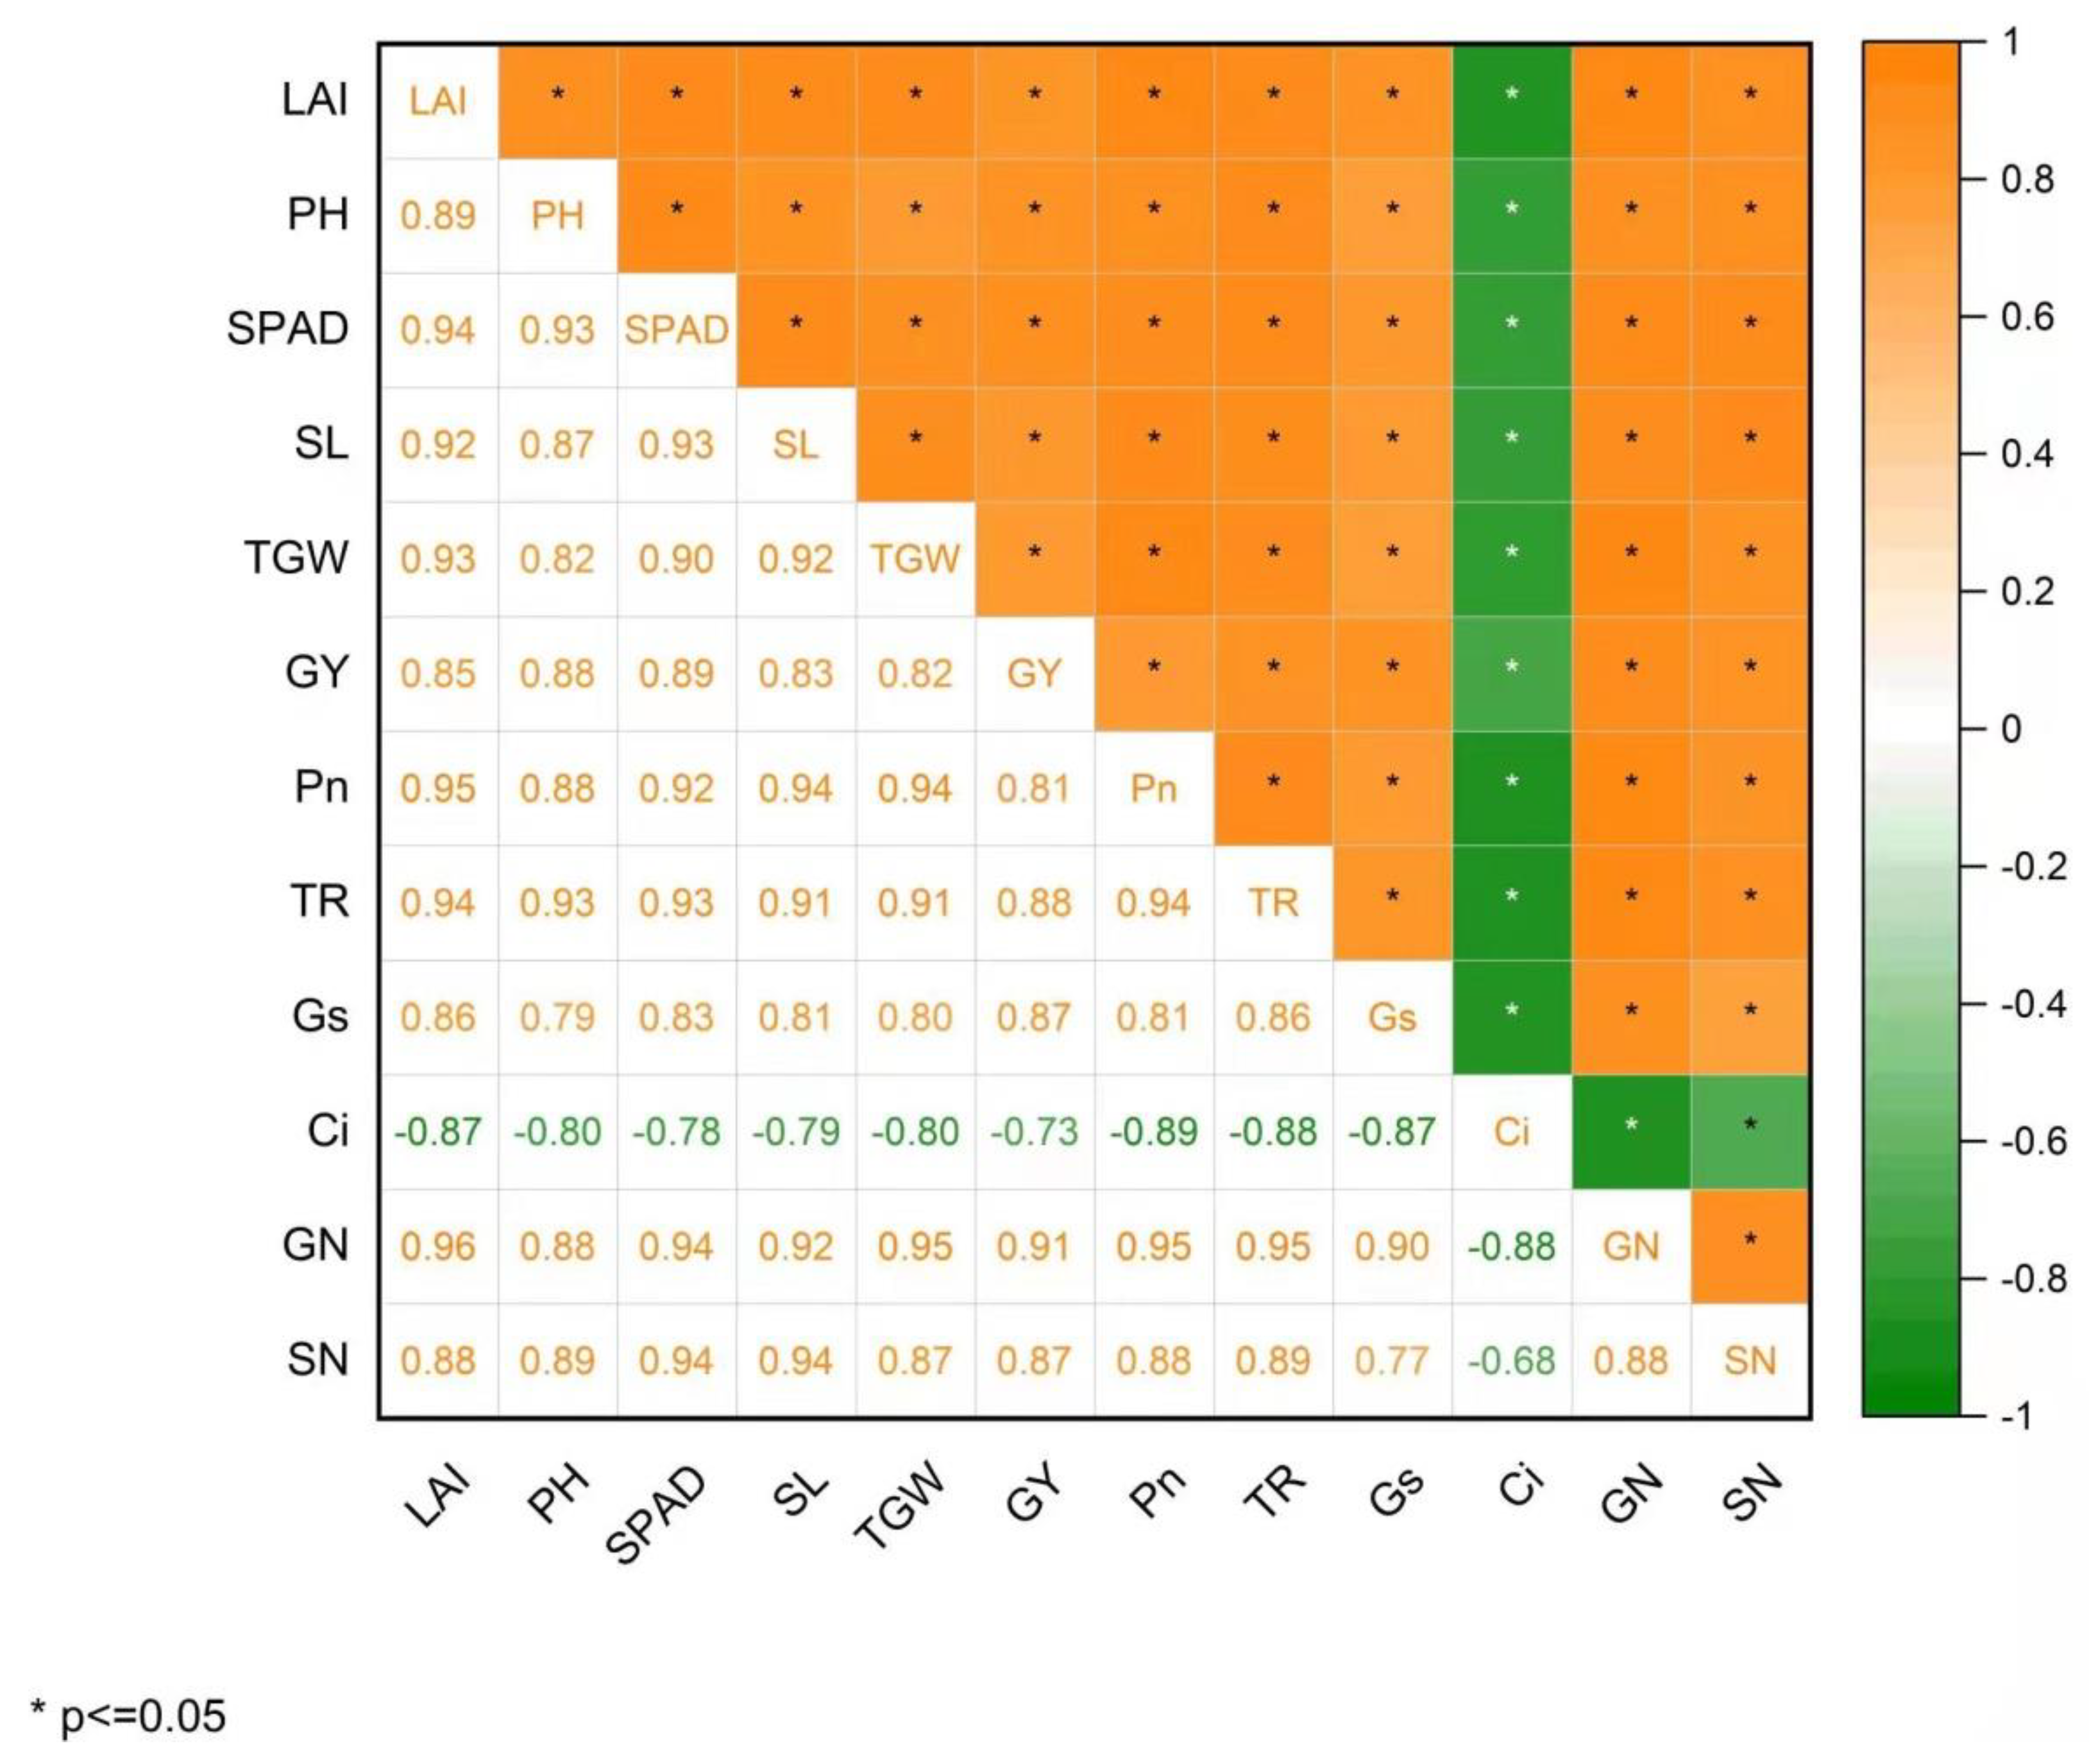
The significant effect of slow-release fertilizers on nitrogen agronomic efficiency and partial factor productivity was noted in the present study and confirmed by experiments [54,55,56]. SCU boosted wheat crop NPFP by 36.6 (kg kg−1) and NHI by 73.3% compared to non-coated urea [26]. These findings were confirmed by Zheng et al. (2016) [10], who found that coated urea has benefits over simple urea, and enhances the nitrogen use efficiency and nitrogen uptake of plants. The coated fertilizer SCU with the S3 seed rate showed the highest NAE and NPFP. Lu et al. (2015) [13], reported a positive correlation between grain nitrogen concentrations and yield (Figure 6). The NAE and NPFP of nitrogen-based fertilizers are increased using various techniques, including slow-release fertilizers. Moreover, the environmental risks of ammonia volatilization and nitrate leaching were significantly reduced by employing coated urea fertilizers. The current experiment demonstrated the beneficial impacts of coated fertilizers and planting rates on wheat growth and development’s physiological, yield, NAE, and NPFP characteristics. Therefore, SCU with a seed rate of 150 kg ha−1 can also be recommended for delayed sowing of wheat to reduce N deficiency and maintain the growth and sustainability of the ecosystem. Future research studies on the importance of slow-release fertilizers and nitrogen losses, modeling of nutrient ecosystem regimes, and climate change scenarios will suggest the sustainability of the agricultural system.

5. Conclusions

The obtained results verified our hypothesis that the combined application of slow-release urea and high seed rate improves, productive tillers, plant growth, and photosynthetic activities in delayed sown wheat. Specifically, results showed that the combined application of sulfur-coated urea with a 150 kg ha−1 seed rate increased leaf area index, wheat spike length, 1000-grain weight, grain yield, agronomic efficiency, nitrogen contents, and nitrogen partial factor productivity as compared to other treatments. Regarding physiological attributes, decreased intercellular CO2 concentration (Ci) significantly decreased grain and straw nitrogen uptake, which could enormously decrease plant growth and yield. In conclusion, sulfur-coated urea with a 150 kg ha−1 seed rate could be recommended as a feasible agronomic practice to improve plant growth and grain yield in delayed sown wheat.

Author Contributions

Conceptualization, M.R.S., Q.H. and M.W.R.; Data curation, K.S.K. and M.A.; Formal analysis, Y.N.B. and I.A.S.; Funding acquisition, M.K.O. and M.S.E.; Investigation, N.A., F.U.H. and A.A., Project administration, M.W.R.; Supervision, Q.H. and M.W.R.; Writing—original draft, M.R.S.; Writing—review and editing, M.K.O. and M.S.E. The authors read and approved the final manuscript. All authors have read and agreed to the published version of the manuscript.

Funding

The authors extend their appreciation to the Researchers Supporting Project number (RSP2023R374) King Saud University, Riyadh, Saud Arabia.

Institutional Review Board Statement

Not applicable.

Informed Consent Statement

Not applicable.

Data Availability Statement

Not applicable.

Conflicts of Interest

There is no conflict of interest in publishing the article.

References

  1. Ghafoor, I.; Habib-ur-Rahman, M.; Ali, M.; Afzal, M.; Ahmed, W.; Gaiser, T.; Ghaffar, A. Slow-release nitrogen fertilizers enhance growth, yield, NUE in wheat crop and reduce nitrogen losses under an arid environment. Environ. Sci. Pollut. Res. 2021, 28, 43528–43543. [Google Scholar] [CrossRef] [PubMed]
  2. Ramzan, Y.; Hafeez, M.B.; Khan, S.; Nadeem, M.; Saleem-ur-Rahman; Batool, S.; Ahmad, J. Biofortification with Zinc and Iron Improves the Grain Quality and Yield of Wheat Crop. Int. J. Plant Prod. 2020, 14, 501–510. [Google Scholar] [CrossRef]
  3. Rehman, A.; Farooq, M.; Ullah, A.; Nadeem, F.; Im, S.Y.; Park, S.K.; Lee, D.J. Agronomic Biofortification of Zinc in Pakistan: Status, Benefits, and Constraints. Front. Sustain. Food Syst. 2020, 4, 276. [Google Scholar] [CrossRef]
  4. Peake, A.S.; Bell, K.L.; Fischer, R.A.; Gardner, M.; Das, B.T.; Poole, N.; Mumford, M. Cultivar × Management Interaction to Reduce Lodging and Improve Grain Yield of Irrigated Spring Wheat: Optimising Plant Growth Regulator Use, N Application Timing, Row Spacing and Sowing Date. Front. Plant Sci. 2020, 11, 401. [Google Scholar] [CrossRef] [PubMed]
  5. Farooq, M.; Rehman, A.; Pisante, M. Sustainable Agriculture and Food Security. In Innovations in Sustainable Agriculture; Springer: Cham, Switzerland, 2019; pp. 3–24. [Google Scholar] [CrossRef]
  6. Haider, F.U.; Virk, A.L.; Rehmani, M.I.A.; Skalicky, M.; Ata-ul-Karim, S.T.; Ahmad, N.; Soufan, W.; Brestic, M.; Sabagh, A.E.L.; Liqun, C. Integrated Application of Thiourea and Biochar Improves Maize Growth, Antioxidant Activity and Reduces Cadmium Bioavailability in Cadmium-Contaminated Soil. Front. Plant Sci. 2022, 12, 3194. [Google Scholar] [CrossRef]
  7. Wang, F.; He, Z.; Sayre, K.; Li, S.; Si, J.; Feng, B.; Kong, L. Wheat cropping systems and technologies in China. Field Crop. Res. 2009, 111, 181–188. [Google Scholar] [CrossRef]
  8. Dai, X.; Xiao, L.; Jia, D.; Kong, H.; Wang, Y.; Li, C.; Zhang, Y.; He, M. Increased plant density of winter wheat can enhance nitrogen–uptake from deep soil. Plant Soil 2014, 384, 141–152. [Google Scholar] [CrossRef]
  9. Hawkesford, M.J. Reducing the reliance on nitrogen fertilizer for wheat production. J. Cereal Sci. 2014, 59, 276–283. [Google Scholar] [CrossRef] [Green Version]
  10. Zheng, W.; Zhang, M.; Liu, Z.; Zhou, H.; Lu, H.; Zhang, W.; Yang, Y.; Li, C.; Chen, B. Combining controlled-release urea and normal urea to improve the nitrogen use efficiency and yield under wheat-maize double cropping system. Field Crop. Res. 2016, 197, 52–62. [Google Scholar] [CrossRef]
  11. Loyce, C.; Meynard, J.M.; Bouchard, C.; Rolland, B.; Lonnet, P.; Bataillon, P.; Bernicot, M.H.; Bonnefoy, M.; Charrier, X.; Debote, B.; et al. Interaction between cultivar and crop management effects on winter wheat diseases, lodging, and yield. Crop. Prot. 2008, 27, 1131–1142. [Google Scholar] [CrossRef]
  12. Fageria, N.K.; Baligar, V.C. Enhancing Nitrogen Use Efficiency in Crop Plants. Adv. Agron. 2005, 88, 97–185. [Google Scholar] [CrossRef]
  13. Lu, D.; Lu, F.; Pan, J.; Cui, Z.; Zou, C.; Chen, X.; He, M.; Wang, Z. The effects of cultivar and nitrogen management on wheat yield and nitrogen use efficiency in the North China Plain. Field Crop. Res. 2015, 171, 157–164. [Google Scholar] [CrossRef]
  14. Shah, F.; Coulter, J.A.; Ye, C.; Wu, W. Yield penalty due to delayed sowing of winter wheat and the mitigatory role of increased seeding rate. Eur. J. Agron. 2020, 119, 126120. [Google Scholar] [CrossRef]
  15. Suarez-Tapia, A.; Kucheryavskiy, S.V.; Christensen, B.T.; Thomsen, I.K.; Rasmussen, J. Limitation of multi-elemental fingerprinting of wheat grains: Effect of cultivar, sowing date, and nutrient management. J. Cereal Sci. 2017, 76, 76–84. [Google Scholar] [CrossRef] [Green Version]
  16. Dai, X.; Wang, Y.; Dong, X.; Qian, T.; Yin, L.; Dong, S.; Chu, J.; He, M. Delayed sowing can increase lodging resistance while maintaining grain yield and nitrogen use efficiency in winter wheat. Crop. J. 2017, 5, 541–552. [Google Scholar] [CrossRef]
  17. Xiao, D.; Moiwo, J.P.; Tao, F.; Yang, Y.; Shen, Y.; Xu, Q.; Liu, J.; Zhang, H.; Liu, F. Spatiotemporal variability of winter wheat phenology in response to weather and climate variability in China. Mitig. Adapt. Strateg. Glob. Change 2015, 20, 1191–1202. [Google Scholar] [CrossRef]
  18. Rasmussen, I.S.; Thorup-Kristensen, K. Does earlier sowing of winter wheat improve root growth and N uptake? Field Crop. Res. 2016, 196, 10–21. [Google Scholar] [CrossRef]
  19. Yin, L.; Dai, X.; He, M. Delayed sowing improves nitrogen utilization efficiency in winter wheat without impacting yield. Field Crop. Res. 2018, 221, 90–97. [Google Scholar] [CrossRef]
  20. Maharjan, B.; Venterea, R.T.; Rosen, C. Fertilizer and Irrigation Management Effects on Nitrous Oxide Emissions and Nitrate Leaching. Agron. J. 2014, 106, 703–714. [Google Scholar] [CrossRef] [Green Version]
  21. Yao, H.; Zhang, Y.; Yi, X.; Hu, Y.; Luo, H.; Gou, L.; Zhang, W. Plant density alters nitrogen partitioning among photosynthetic components, leaf photosynthetic capacity and photosynthetic nitrogen use efficiency in field-grown cotton. Field Crop. Res. 2015, 184, 39–49. [Google Scholar] [CrossRef]
  22. Foulkes, M.J.; Hawkesford, M.J.; Barraclough, P.B.; Holdsworth, M.J.; Kerr, S.; Kightley, S.; Shewry, P.R. Identifying traits to improve the nitrogen economy of wheat: Recent advances and future prospects. Field Crop. Res. 2009, 114, 329–342. [Google Scholar] [CrossRef]
  23. Naz, M.Y.; Sulaiman, S.A. Slow release coating remedy for nitrogen loss from conventional urea: A review. J. Control. Release 2016, 225, 109–120. [Google Scholar] [CrossRef] [PubMed]
  24. Altaf, A.; Zhu, X.; Zhu, M.; Quan, M.; Irshad, S.; Xu, D.; Aleem, M.; Zhang, X.; Gull, S.; Li, F.; et al. Effects of Environmental Stresses (Heat, Salt, Waterlogging) on Grain Yield and Associated Traits of Wheat under Application of Sulfur-Coated Urea. Agronomy 2021, 11, 2340. [Google Scholar] [CrossRef]
  25. Azeem, B.; Kushaari, K.; Man, Z.B.; Basit, A.; Thanh, T.H. Review on materials & methods to produce controlled release coated urea fertilizer. J. Control. Release 2014, 181, 11–21. [Google Scholar] [CrossRef]
  26. Shivay, Y.S.; Prasad, R.; Pal, M. Effect of nitrogen levels and coated urea on growth, yields and nitrogen use efficiency in aromatic rice. J. Plant Nutr. 2016, 39, 875–882. [Google Scholar] [CrossRef]
  27. Beig, B.; Niazi, M.B.K.; Jahan, Z.; Hussain, A.; Zia, M.H.; Mehran, M.T. Coating materials for slow release of nitrogen from urea fertilizer: A review. J. Plant Nutr. 2020, 43, 1510–1533. [Google Scholar] [CrossRef]
  28. Chen, J.; Lü, S.; Zhang, Z.; Zhao, X.; Li, X.; Ning, P.; Liu, M. Environmentally friendly fertilizers: A review of materials used and their effects on the environment. Sci. Total Environ. 2018, 613–614, 829–839. [Google Scholar] [CrossRef]
  29. Manzoor, S.; Habib-Ur-Rahman, M.; Haider, G.; Ghafoor, I.; Ahmad, S.; Afzal, M.; Nawaz, F.; Iqbal, R.; Yasin, M.; Haq, T.U.; et al. Biochar and slow-releasing nitrogen fertilizers improved growth, nitrogen use, yield, and fiber quality of cotton under arid climatic conditions. Environ. Sci. Pollut. Res. 2022, 29, 13742–13755. [Google Scholar] [CrossRef]
  30. Estefan, G.; Sommer, R.; Ryan, J. Methods of soil, plant, and water analysis. In A Manual for the West Asia and North Africa Region; International Center for Agricultural Research in the Dry Areas (ICARDA): Beirut, Lebanon, 2013; pp. 1–244. [Google Scholar]
  31. Walkley, A.; Black, I. An examination of the Degtjareff method for determining soil organic matter, and a proposed modification of the chromic acid titration method. Soil Sci. 1934, 37, 29–38. [Google Scholar] [CrossRef]
  32. Bremner, J.M.; Mulvaney, C.S. Total nitrogen. In Methods of Soil Analysis; Page, A.L., Miller, R.H., Keeny, D.R., Eds.; American Society of Agronomy and Soil Science Society of America: Madison, WI, USA, 1982. [Google Scholar]
  33. Olsen, S.R.; Cole, C.V.; Watanabe, F.S.; Dean, L.A. Estimation of Available Phosphorus in Soils by Extraction with Sodium. In U.S. Department of Agriculture Circular No. 939; Banderis, A.D., Barter, D.H., Anderson, K., Eds.; Agricultural and Advisor; U.S. Department of Agriculture: Washington, DC, USA, 1954. [Google Scholar]
  34. Richards, L.A. Diagnosis and Improvement of Saline Sodic and Alkali Soils; US Department of Agriculture: Washington, DC, USA, 1954. [Google Scholar]
  35. Markwell, J.; Osterman, J.C.; Mitchell, J.L. Calibration of the Minolta SPAD-502 leaf chlorophyll meter. Photosynth. Res. 1995, 46, 467–472. [Google Scholar] [CrossRef]
  36. Sáez-Plaza, P.; Navas, M.J.; Wybraniec, S.; Michałowski, T.; Asuero, A.G. An Overview of the Kjeldahl Method of Nitrogen Determination. Part II. Sample Preparation, Working Scale, Instrumental Finish, and Quality Control. Crit. Rev. Anal. Chem. 2013, 43, 224–272. [Google Scholar] [CrossRef]
  37. Wang, C.; Lv, J.; Coulter, J.A.; Xie, J.; Yu, J.; Li, J.; Zhang, J.; Tang, C.; Niu, T.; Gan, Y. Slow-Release Fertilizer Improves the Growth, Quality, and Nutrient Utilization of Wintering Chinese Chives (Allium tuberosum Rottler ex Spreng.). Agronomy 2020, 10, 381. [Google Scholar] [CrossRef] [Green Version]
  38. Wang, Q.; Li, F.; Zhao, L.; Zhang, E.; Shi, S.; Zhao, W.; Song, W.; Vance, M.M. Effects of irrigation and nitrogen application rates on nitrate nitrogen distribution and fertilizer nitrogen loss, wheat yield and nitrogen uptake on a recently reclaimed sandy farmland. Plant Soil 2010, 337, 325–339. [Google Scholar] [CrossRef]
  39. Dimkpa, C.O.; Fugice, J.; Singh, U.; Lewis, T.D. Development of fertilizers for enhanced nitrogen use efficiency—Trends and perspectives. Sci. Total Environ. 2020, 731, 139113. [Google Scholar] [CrossRef]
  40. Gudge, A.; Rawat, G.S.; Jat, S.L.; Tiwari, S. Impact of nitrogen management on physiological parameter of maize under conservation agriculture (Zea mays L.). J. Pharmacogn. Phytochem. 2019, 8, 2123–2128. [Google Scholar]
  41. Thind, H.S.; Singh, B.; Pannu, R.P.S.; Singh, Y.; Singh, V.; Gupta, R.K.; Vashistha, M.; Singh, J.; Kumar, A. Relative performance of neem (Azadirachta indica) coated urea vis-à-vis ordinary urea applied to rice on the basis of soil test or following need based nitrogen management using leaf colour chart. Nutr. Cycl. Agroecosyst. 2010, 87, 1–8. [Google Scholar] [CrossRef]
  42. Ahmad, N.; Virk, A.L.; Hussain, S.; Hafeez, M.B.; Haider, F.U.; Rehmani, M.I.A.; Yasir, T.A.; Asif, A. Integrated application of plant bioregulator and micronutrients improves crop physiology, productivity and grain biofortification of delayed sown wheat. Environ. Sci. Pollut. Res. 2022, 29, 52534–52543. [Google Scholar] [CrossRef]
  43. Ghafoor, I.; ur Rahman, M.H.; Hasnain, M.U.; Ikram, R.M.; Khan, M.A.; Iqbal, R.; Hussain, M.I.; Sabagh, A. El Effect of slow-release nitrogenous fertilizers on dry matter accumulation, grain nutritional quality, water productivity and wheat yield under an arid environment. Sci. Rep. 2022, 12, 14783. [Google Scholar] [CrossRef]
  44. Gupta, M.; Attri, M.; Sharma, B.C.; Thakur, N.P.; Sharma, R.; Kour, S. Efficacy of neem and zinc coated urea on productivity and economics of wheat (Triticum aestivum). J. Plant Nutr. 2022, 46, 1270–1282. [Google Scholar] [CrossRef]
  45. Iqbal, J.; Hayat, K.; Hussain, S.; Ali, A.; Ahmad, M.; Haji, A.; Bakhsh, A.; Khan, G. Effect of Seeding Rates and Nitrogen Levels on Yield and Yield Components of Wheat (Triticum aestivum L.). Pak. J. Nutr. 2012, 11, 531–536. [Google Scholar] [CrossRef] [Green Version]
  46. Suganya, S.; Appavu, K.; Vadivel, A. Relative efficiency of neem coated urea products for rice grown in different soils. Asian J. Soil Sci. 2007, 2, 29–34. [Google Scholar]
  47. Yuan, L.; Zhang, Z.; Cao, X.; Wu, L. Polyester sulfur-coated urea (PSCU) application enhances brown rice iron concentrations in two alkaline soils. J. Sci. Food Agric. 2022, 102, 1040–1046. [Google Scholar] [CrossRef] [PubMed]
  48. Rehman, A.; Nawaz, M.; Chattha, M.U.; Khan, I.; Chattha, M.B.; Hussain, F.; Ayub, M.A. Neem Coated Urea Improves the Productivity, Nitrogen Use Efficiency and Economic Return of Wheat Crop Crop reporting services View project Individual and Concurrent Environmental Stresses in Plants: Consequences, Tolerance Mechanisms and Mitigation Strategies View projec. Int. J. Agric. Biol. 2021, 26, 450–460. [Google Scholar] [CrossRef]
  49. Rehman, H.U.; Asghar, M.G.; Ikram, R.M.; Hashim, S.; Hussain, S.; Irfan, M.; Mubeen, K.; Ali, M.; Alam, M.; Ali, M.; et al. Sulphur coated urea improves morphological and yield characteristics of transplanted rice (Oryza sativa L.) through enhanced nitrogen uptake. J. King Saud Univ.—Sci. 2022, 34, 101664. [Google Scholar] [CrossRef]
  50. Liao, Z.; Zeng, H.; Fan, J.; Lai, Z.; Zhang, C.; Zhang, F.; Wang, H.; Cheng, M.; Guo, J.; Li, Z.; et al. Effects of plant density, nitrogen rate and supplemental irrigation on photosynthesis, root growth, seed yield and water-nitrogen use efficiency of soybean under ridge-furrow plastic mulching. Agric. Water Manag. 2022, 268, 107688. [Google Scholar] [CrossRef]
  51. Geng, J.; Liu, Z.; Zhang, M.; Shi, Y.; Zhu, Q.; Sun, Y.; Zhou, H.; Li, C.; Yang, Y.; Geng, J. Improving crop yields, nitrogen use efficiencies, and profits by using mixtures of coated controlled-released and uncoated urea in a wheat-maize system. Field Crop. Res. 2017, 205, 106–115. [Google Scholar] [CrossRef]
  52. Joshi, A.; Gupta, J.K.; Choudhary, S.K.; Paliwal, D.K. Efficiency of different Nitrogen Source, doses and Split application on growth and yield of maize (Zea mays L.) in the Malwa region of Madhya Pradesh. IOSR J. Agric. Vet. Sci. 2014, 7, 39–42. [Google Scholar] [CrossRef]
  53. Mustafa, A.; Athar, F.; Khan, I.; Chattha, M.U.; Nawaz, M.; Shah, A.N.; Mahmood, A.; Batool, M.; Aslam, M.T.; Jaremko, M.; et al. Improving crop productivity and nitrogen use efficiency using sulfur and zinc-coated urea: A review. Front. Plant Sci. 2022, 13, 942384. [Google Scholar] [CrossRef]
  54. Ali, M.; Maqsood, M.A.; Azizl, T.; Awan, M.I. Neem (Azadirachta indica) oil coated urea improves nitrogen use efficiency and maize growth in an alkaline calcareous soil. Pak. J. Agric. Sci. 2020, 57, 675–684. [Google Scholar]
  55. Gangurde, A.B.; Thakare, R.; Ashwini Gangurde, C.B.; Patil, T.; Chaudhari, R. Effect of neem coated urea on nutrient availability, yield attributing characters and yield of pearl millet on vertisol. J. Pharmacogn. Phytochem. 2018, 7, 2146–2149. [Google Scholar]
  56. Bana, R.; Shivay, Y. Productivity of summer forage crops and their effect on succeeding basmati rice (Oryza sativa) in conjunction with phosphogypsum-enriched urea. Indian J. Agron. 2012, 57, 24–31. [Google Scholar]
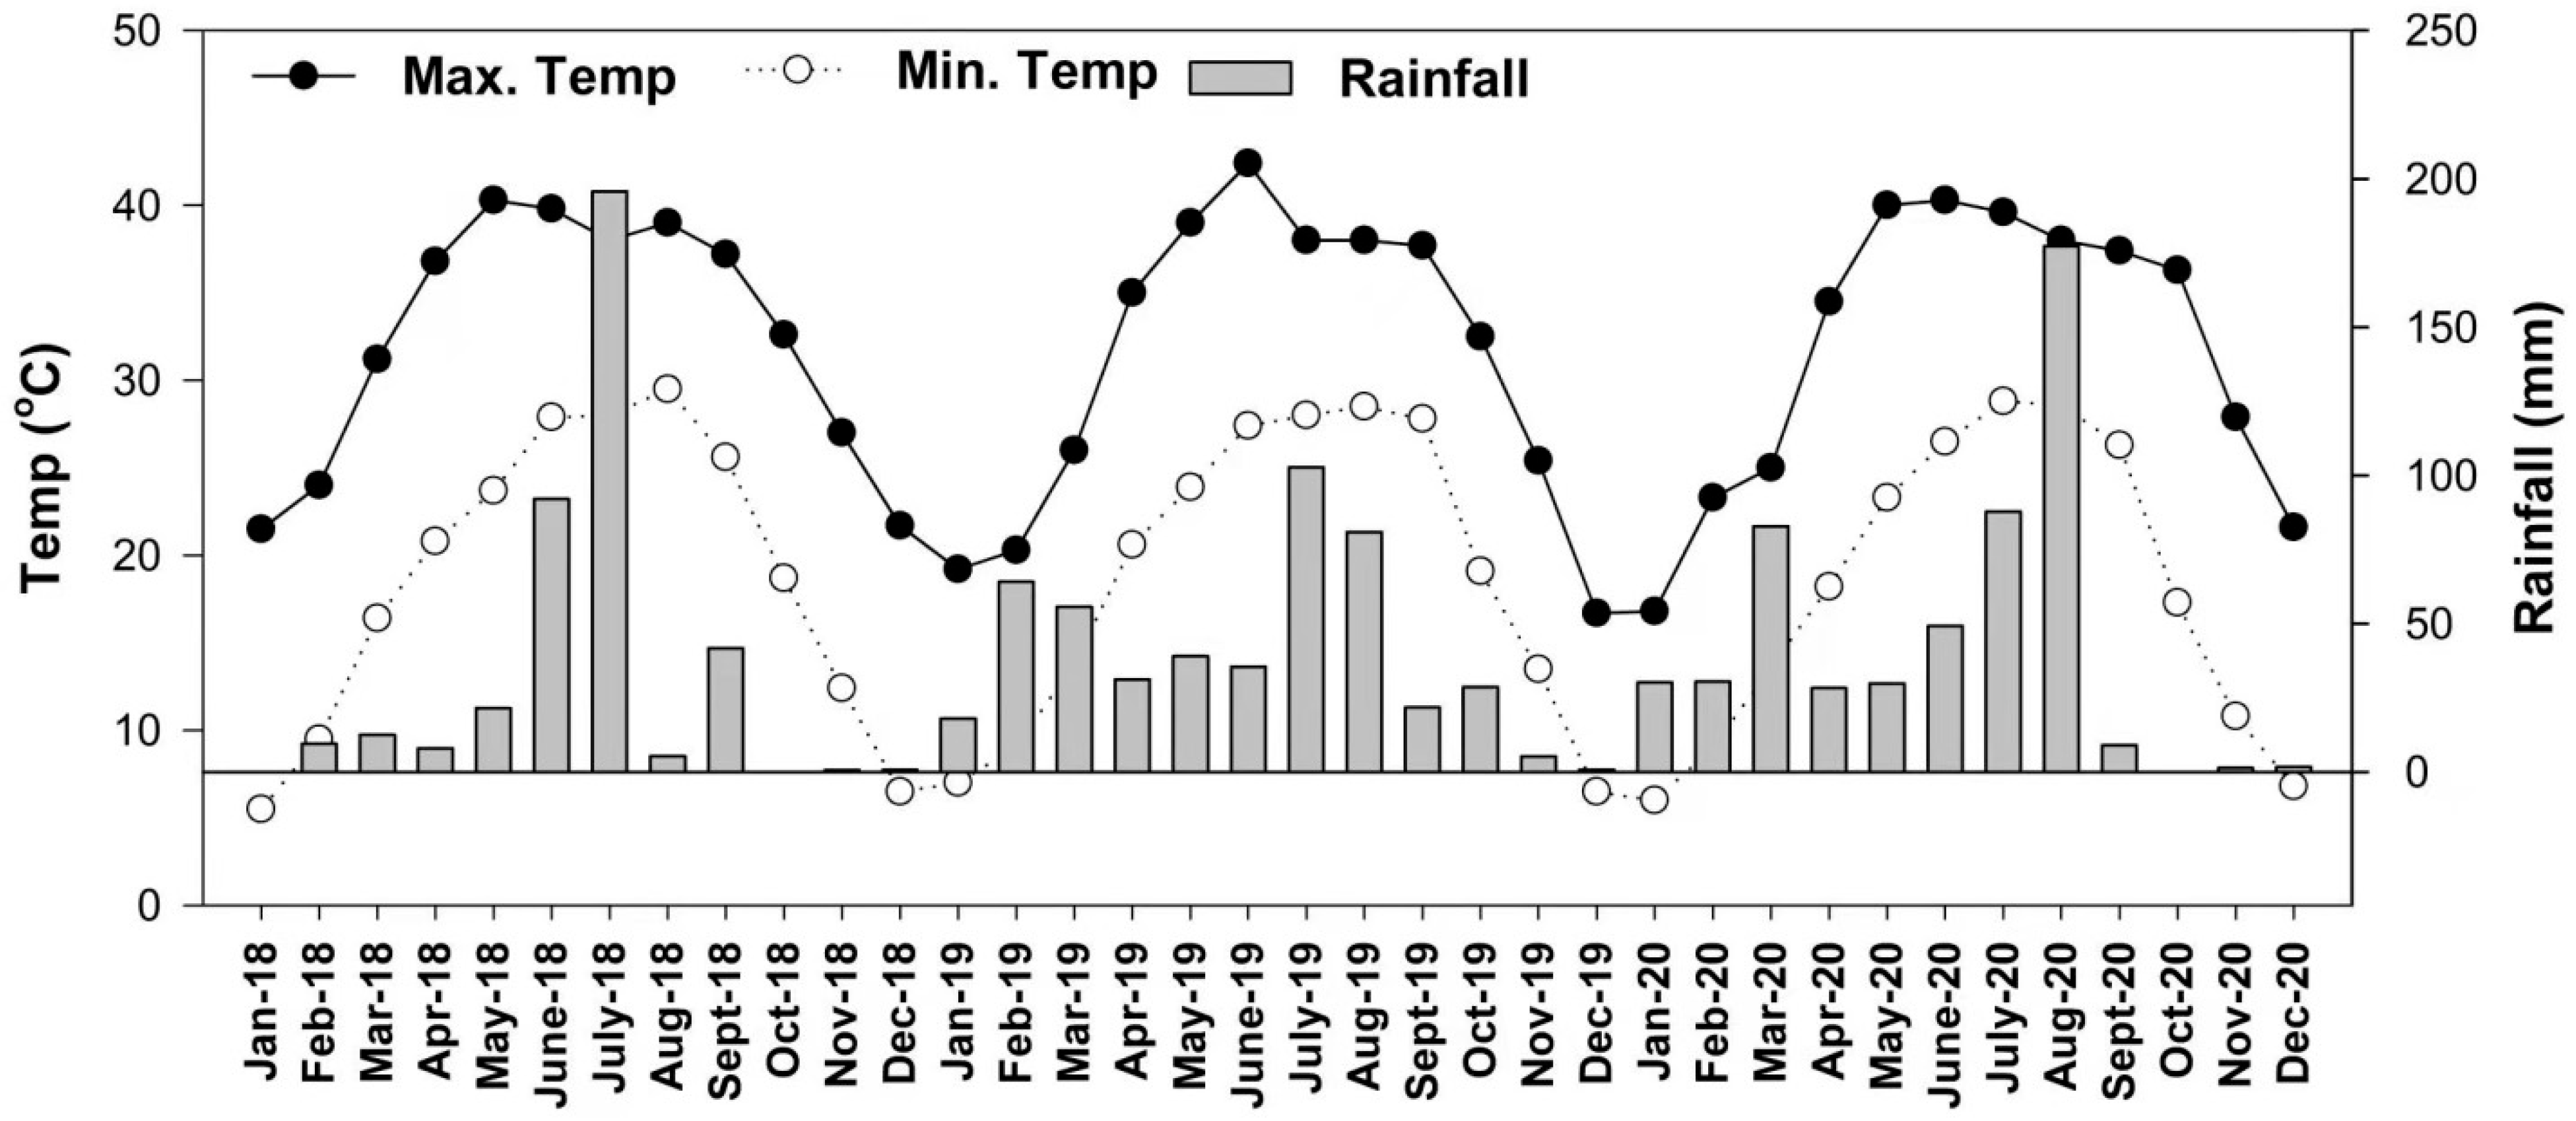
Figure 1. Metrological attributes of the experimental area during the two years (2018–2020).
Agronomy 13 01830 g001
Figure 2. Effect of different slow-release nitrogen fertilizers and seeding rates on plant height (a,b) and spike length (c,d) of delayed sown wheat in two consecutive wheat-growing seasons, 2018–19 and 2019–20. Means within a column followed by the same letter(s) are not significantly different (ns) at p > 0.05 based on the Least Significance Difference (LSD) test. p-value indicates a significance level based on two-way ANOVA. CK, control; SU, simple urea; NCU, neem-coated urea; SCU, sulfur-coated urea; S1, 100 kg ha−1; S2, 125 kg ha−1; S3, 150 kg ha−1. N × S indicates interaction between slow release fertilizers and seed rate.
Agronomy 13 01830 g002
Figure 3. Effect of different slow-release nitrogen fertilizers and seeding rate on leaf area index (a,b) and chlorophyll SPAD values (c,d) of delayed sown wheat in two consecutive wheat-growing seasons, 2018–19 and 2019–20. Means within a column followed by the same letter(s) are not significantly different (ns) at p > 0.05 based on the Least Significance Difference (LSD) test. p-value indicates a significance level based on two-way ANOVA. CK, control; SU, simple urea; NCU, neem-coated urea; SCU, sulfur-coated urea; S1, 100 kg ha−1; S2, 125 kg ha−1; S3, 150 kg ha−1. N × S indicates interaction between slow release fertilizers and seed rate.
Agronomy 13 01830 g003
Figure 4. Effect of different slow-release nitrogen fertilizers and seeding rate on the net photosynthetic rate (Pn) (a,b) and transpiration rate (Tr) (c,d) of delayed sown wheat in two consecutive wheat-growing seasons, 2018–19 and 2019–20. Means within a column followed by the same letter(s) are not significantly different (ns) at p > 0.05 based on the Least Significance Difference (LSD) test. p-value indicates a significance level based on two-way ANOVA. CK, control; SU, simple urea; NCU, neem-coated urea; SCU, sulfur-coated urea; S1, 100 kg ha−1; S2, 125 kg ha−1; S3, 150 kg ha−1. N × S indicates interaction between slow release fertilizers and seed rate.
Agronomy 13 01830 g004
Figure 5. Effect of different slow-release nitrogen fertilizers and seeding rate on stomatal conductance (Gs) (a,b) and intercellular CO2 concentration (Ci) (c,d) of delayed sown wheat in two consecutive wheat-growing seasons, 2018–19 and 2019–20. Means within a column followed by the same letter(s) are not significantly different (ns) at p > 0.05 based on the Least Significance Difference (LSD) test. p-value indicates a significant level based on two-way ANOVA. CK, control; SU, simple urea; NCU, neem-coated urea; SCU, sulfur-coated urea: S1, 100 kg ha−1; S2, 125 kg ha−1; S3, 150 kg ha−1. N × S indicates interaction between slow release fertilizers and seed rate.
Agronomy 13 01830 g005
Figure 6. Pearson correlation of growth and physiological traits of wheat during the two growing seasons (2018–2020) (p ≤ 0.05). LAI, leaf area index; PH, plant height; SPAD, chlorophyll contents; SL, spikelets; TGW, 1000-grain weight; GY, grain yield; Pn, net photosynthetic rate; TR, transpiration rate; Gs, stomatal conductance; Ci, intercellular CO2 concentration; GN, grain N content; SN, straw N content.
Agronomy 13 01830 g006
Table 1. Effect of different slow-release nitrogen fertilizers and seeding rate on productive tillers, spikelets per spike, 1000-grain weight, and grain yield of delayed sown wheat in two consecutive wheat-growing seasons, 2018–19 and 2019–20.
YearTreatmentsProductive TillersSpikelet’s1000-Grains Weight (g)Biological Yield (kg ha−1)Grain Yield
(kg ha−1)
2018–19
CK262.2 d9.54 c34.4 d7967 d3248.9 c
SU303.6 c10.9 b40.9 c9989 c3743.3 bc
NCU328.7 b12.8 a42.4 b10,656 b4311.1 ab
SCU334.2 a13.3 a42.8 a11,333 a4555.6 a
S1300.6 c11.5 ns40.5 a9625 c3844.2 b
S2306.9 b11.6 ns40.1 b9975 b4000.8 a
S3314.0 a11.8 ns39.7 c10,358 a4049.2 a
CK*S1257.09.434.877333213.3
CK*S2262.39.534.479673246.6
CK*S3267.39.734.182003286.6
SU*S1296.010.741.498003663.3
SU*S2303.610.940.810,0003856.6
SU*S3311.311.140.410,1673710.0
NCU*S1322.012.742.810,1004100.0
NCU*S2328.012.942.410,6004333.3
NCU*S3336.31343.111,2674500.0
SCU*S1327.613.142.910,8674400.0
SCU*S2333.613.243.211,3334566.6
SCU*S3341.313.542.511,8004700.0
ANOVANitrogen (N)<0.001<0.001<0.001<0.0010.0067
Seed rate (S)<0.0010.226<0.001<0.001<0.001
N*S0.2710.9990.5950.2900.0765
2019–20
CK264.0 d9.5 c34.5 d8100 d3261.1 c
SU305.7 c10.9 b41.0 c10,056 c3757.8 bc
NCU332.5 b12.9 a42.6 b10,711 b4350.0 ab
SCU337.1 a13.3 a43.1 a11,411 a4590.0 a
S1303.6 c11.5 ns40.7 a9692 c3870.8 b
S2309.4 b11.7 ns40.3 b10,067 b4030.8 a
S3316.6 a11.9 ns39.9 c10,450 a4067.5 a
CK*S1259.09.434.978003230.0
CK*S2263.69.534.581003256.6
CK*S3269.39.734.284003296.6
SU*S1299.010.741.598673676.6
SU*S2305.310.941.010,1003866.6
SU*S3313.011.140.610,2003730.0
NCU*S1326.012.843.010,1674130.0
NCU*S2331.61342.510,6664400.0
NCU*S3340.013.142.311,3004520.0
SCU*S1330.313.243.510,9334446.6
SCU*S2337.013.343.111,4004600.0
SCU*S3344.013.642.711,9004723.3
ANOVANitrogen (N)<0.001<0.001<0.001<0.0010.0083
Seed rate (S)<0.0010.235<0.001<0.0010.0017
N*S0.6840.9990.7780.3420.1343
Means within a column followed by the same letter(s) are not significantly different (ns) at p > 0.05 based on the Least Significance Difference (LSD) test. p-value indicates a significance level based on a two-way ANOVA. CK, control; SU, simple urea; NCU, neem-coated urea; SCU, sulfur-coated urea. S1, 100 kg ha−1; S2, 125 kg ha−1; S3, 150 kg ha−1; N*S, interaction of nitrogen and seed rate; ns, non-significant. * indicates interaction between slow release fertilizer and seed rate.
Table 2. Effect of different slow-release nitrogen fertilizers and seeding rate on grain N content, straw N content, agronomic nitrogen efficiency (AEN), and nitrogen partial factor productivity (PFPN) of delayed sown wheat in two consecutive wheat-growing seasons, 2018–19 and 2019–20.
YearTreatmentsGrain N
%
Straw N
%
AEN
(kg ha−1)
PFPN
(kg kg−1)
2018–19
CK1.19 c0.28 d--
SU1.70 b0.34 c4.3 ns32.5 ns
NCU2.09 a0.37 b9.2 ns37.4 ns
SCU2.12 a0.40 a11.3 ns39.6 ns
S11.76 c0.34 c7.3 b35.2 b
S21.77 b0.35 b8.7 a36.9 a
S31.79 a0.36 a8.8 a37.4 a
CK*S11.190.28 i--
CK*S21.190.28 i--
CK*S31.200.29 h--
SU*S11.690.33 g3.931.8
SU*S21.700.34 f5.333.5
SU*S31.720.36 e3.632.2
NCU*S12.080.36 e7.735.6
NCU*S22.100.38 d9.437.6
NCU*S32.110.39 cd10.539.1
SCU*S12.110.40 bc10.338.2
SCU*S22.120.41 b11.439.7
SCU*S32.140.42 a12.240.8
ANOVANitrogen (N)<0.001<0.0010.0910.091
Seed rate (S)<0.001<0.001<0.05<0.05
N*S0.5810.0390.1660.157
2019–20
CK1.20 c0.29 d--
SU1.71 b0.36 c4.3 ns32.6 ns
NCU2.11 a0.38 b9.4 ns37.8 ns
SCU2.13 a0.42 a11.5 ns39.9 ns
S11.77 b0.35 c7.4 b35.5 b
S21.79 a0.35 b8.9 a37.3 a
S31.80 a0.38 a8.9 a37.6 a
CK*S11.200.28 e--
CK*S21.210.29 e--
CK*S31.200.29 e--
SU*S11.700.34 d3.831.9
SU*S21.710.35 d5.333.6
SU*S31.730.38 c3.732.4
NCU*S12.090.37 c7.835.9
NCU*S22.120.37 c9.938.2
NCU*S32.120.40 b10.639.3
SCU*S12.110.41 b10.538.6
SCU*S22.130.41 b11.640.0
SCU*S32.150.43 a12.441.0
ANOVANitrogen (N)<0.001<0.0010.0990.099
Seed rate (S)0.002<0.001<0.05<0.005
N*S0.2660.0070.2560.251
Means within a column followed by the same letter(s) are not significantly different (ns) at p > 0.05 based on the Least Significance Difference (LSD) test. p-value indicates a significant level based on two-way ANOVA. CK, control; SU, simple urea; NCU, neem-coated urea; SCU, sulfur-coated urea; S1, 100 kg ha−1; S2, 125 kg ha−1; S3, 150 kg ha−1; AEN, agronomic nitrogen efficiency; PFPN, nitrogen partial factor productivity; N*S, interaction of nitrogen and seed rate; ns, non-significant. * indicates interaction between slow release fertilizers and seed rate.
Disclaimer/Publisher’s Note: The statements, opinions and data contained in all publications are solely those of the individual author(s) and contributor(s) and not of MDPI and/or the editor(s). MDPI and/or the editor(s) disclaim responsibility for any injury to people or property resulting from any ideas, methods, instructions or products referred to in the content.