Abstract
Leymus chinensis is a widely distributed species of Eurasian grasslands that is well adapted to a range of environmental conditions. In this study, we measured soil and plant chemical elements to examine the basis of the ecological adaptations of L. chinensis to temperate steppe. We sampled leaves of L. chinensis and soil layers at different latitudes in temperate steppe for three consecutive years from 2012 to 2014. One-way analysis of variance and linear regression were used to analyze the variation in foliar nitrogen (N) and phosphorus (P) contents and the N:P ratio in L. chinensis. The correlations between the foliar N:P ratio and the variation in soil total nitrogen (TN) and total P contents with latitudinal gradient were measured to explore the homeostasis stoichiometry of foliar N and P in L. chinensis. With increasing latitude, both the foliar N and P contents of L. chinensis showed parabolic trends with significant negative correlations. The population of L. chinensis was limited by N, and the soil TN content showed a significant increasing trend with the increase in the foliar N:P ratio. The variation in the foliar N:P ratio of L. chinensis was determined through the variation in the soil N content. In different latitude intervals, the foliar N, P, and N:P ratio of L. chinensis showed absolute stability and strong internal stability, and the values of HN:P were high and similar in different latitudes. In conclusion, the population of L. chinensis in the temperate steppe is highly adaptable; and, thus, can maintain a dominant position in the variable environment and has a wide distribution range.
1. Introduction
Leymus chinensis (Trin.) Tzvel. is a perennial rhizome grass with high reproductive capacity and nutritional value (mainly containing crude protein, crude fat, crude fiber, calcium, phosphate, and vitamin E), making it an important forage favored by large livestock in the grasslands of Inner Mongolia [1,2]. As an important constructive or dominant species of grasslands in the northern temperate zone, L. chinensis has strong adaptability and a wide ecological range, whose native range is from Siberia to North Korea, with the result that it is often distributed as a single dominant community in natural grasslands such as the Northeast grassland and the Inner Mongolia grassland [3]. L. chinensis can not only form colonies in the same or similar habitats in various areas but can also become dominant in different habitats [4,5]. Therefore, the adaptive viability of L. chinensis has become a focus of grassland ecologists. The literature indicates that researchers have used mechanistic models, regression models, and MaxEnt models to evaluate the habitat suitability of target species [6,7,8], but there are a lack of studies on the adaptive capacity of plant populations in large-scale regions from the perspective of ecological stoichiometry.
Ecological stoichiometry is a theoretical framework that is used to study the balance and interaction between various chemical elements (e.g., carbon, nitrogen (N), and phosphorus (P) and the energy of biological systems) [9], including stoichiometric homeostasis hypothesis and growth rate hypothesis. Stoichiometric homeostasis, as one of the core concepts in ecological stoichiometry, can reflect the pattern of living and how organisms adapt to the environment. In addition, stoichiometric homeostasis of dominant species plays a crucial role in the stability of ecosystems [10]. In grassland ecosystems, N and P are involved in plant physiological and biochemical processes [11]. These are the essential nutrients that have the strongest influence on the growth of grassland plants. Therefore, studying the stoichiometric homeostasis of foliar N and P of plant populations in a grassland has not only theoretical significance for clarifying the nutrient supply in the environment and how this affects the population [12] but also has important practical significance for understanding the adaptations of plant populations in grassland ecosystems [13].
To better understand the stability and characteristics of L. chinensis populations in temperate steppe ecosystems, this study examined an L. chinensis population in a temperate steppe with a latitudinal temperature gradient [14]. By measuring the N and P contents of L. chinensis leaves and the soil in plots at different latitudes, the changes in foliar N, P, and their ratio (N:P) were measured along a latitudinal gradient, and the relationships with soil total nitrogen (TN), total phosphorus (TP), and the N and P ratio were analyzed. We examined whether the characteristics of stoichiometric homeostasis of L. chinensis in the temperate steppe of Inner Mongolia have relationships with the latitudinal gradient. Furthermore, the following question was considered: Do changes in soil chemical elements and a latitudinal temperature gradient affect the stoichiometric homeostasis of L. chinensis?
2. Materials and Methods
2.1. Site Description
This study was conducted for three consecutive years from 2012 to 2014 in the temperate steppe of Xilin Gol League in Inner Mongolia, northern China (42°00′00″ N–45°19′1.2″ N, 114°34′19.2″ E–116°58′4.8″ E). The elevation at the study site is 833–1467 m. The average annual minimum temperature is 1.2 °C (corresponding to the high latitude), and the average annual maximum temperature is 2.4 °C (corresponding to the low latitude). The degree of aridity is relatively constant, ranging from 21 to 30 [14]. The soil type is primarily haplic kastanozem (FAO). The dominant species include L. chinensis, Stipa grandis, and Cleistogenes squarrosa, while the companion species include Allium ramosum, Plantago asiatica, Heteropappus altaicus, Artemisia frigida, Serratula centauroides, Chenopodium glaucum, Potentilla bifurca, Carex duriuscula, and Convolvulus ammannii.
2.2. Experimental Design
Taking the temperate steppe margin transect of Inner Mongolia as the research object, the temperature change in latitude was used instead of a warming treatment. In the study area, 68 plots (340 quadrats) were set along four transects with a relatively consistent temperature gradient and dryness. The spline method was used to divide the area (50 km in length and 50 km in width). One plot was set in each area, and five quadrats were set in each plot. The entire plot survey adopted the spline grid method, and the plot area was 30 m × 30 m. Five 1 m × 1 m quadrats were randomly selected from the 30 m × 30 m sample plot. The latitude and longitude were measured through GPS positioning (Trimble GEOXT-3000 GPS By KOREC), and the elevation was measured by altitude. The vegetation types and land use status of the points were recorded. A total of 68 plots were obtained in three years. Four latitudinal intervals (indicated by L) of the L. chinensis population distributed in China were L1 ≤ 43°0′00″, 43°0′00″< L2 ≤ 44°0′00″, 44°0′00″< L3 ≤ 45°0′00″ and 45°0′00″ < L4 ≤ 46°0′00″ (Table 1).

Table 1.
The distribution of sampling sites under different latitudial gradients.
2.3. Sample Collection and Element Analyses
In the quadrats, leaves of the dominant species L. chinensis were sampled (approximately 50 g) and placed in a cloth bag before being brought back to the laboratory. The leaves were dried to a constant weight at a temperature of 65 °C for 24 h [15], crushed using a pulverizer, and weighed. After sampling the leaves of L. chinensis, the ground litter was removed in five 1 m × 1 m plots, and a soil drill with an inner diameter of 5 cm was used to sample from three layers, 0 to 10 cm, 10 to 20 cm, and 20 to 30 cm. Three drillings were made per square meter, and soil samples from the same sample plot were evenly mixed in a Ziplock bag, marked, and brought back to the laboratory for analysis of soil N and P contents.
The samples of foliar N and P contents of L. chinensis were determined after crushing, and TN and TP components of soil samples were determined after grinding. The determination methods of N and P content in soil and plant samples were the same, the semi-micro Kjeldahl method [16] and the molybdenum antimony colorimetric method [17], respectively. The average values of soil TP and TN in the 0–30 cm layer of each quadrat were used as soil TP and TN contents. The average values of soil TP and TN in five quadrats represented the levels of soil TP and TN in the plot.
2.4. Statistical Analyses
The Kolmogorov–Smirnov method [18] was used to analyze the distribution of data for normality, and Levene’s method [19] was used to test the homogeneity of variance. A logarithmic or arctangent transformation was used for data that were not normally distributed. One-way analysis of variance (ANOVA) was used to analyze the difference in foliar N and P contents and the N:P ratio in L. chinensis along the latitudinal gradient [20] and to analyze the differences in N and P contents and the N:P ratio in different soil layers at the same location. Regression analysis was used to match foliar N and P contents, the N:P ratio in L. chinensis [21], and the relationship between the stoichiometric homeostasis index and the latitude. The relationships between the foliar N:P ratio of L. chinensis and the TN and TP contents and the N:P ratio in different soil layers were analyzed using linear and quadratic regression. p < 0.01 was considered a highly significant difference, and p < 0.05 was considered a significant difference. SAS 9.4 was used for one-way ANOVA and regression analysis.
To estimate the homoeostatic regulation capacity of L. chinensis in different latitudinal gradients, we calculated the homoeostatic regulation coefficient (H) according to the following model [22]:
where Y is the N or P concentration or the N:P ratio in leaves of L. chinensis; X is the concentration of TN or TP or the N:P ratio in the soil, and C is a constant. According to Persson [23], when the equation is properly integrated, 0 < 1/H < 0.25 is the steady state type; 0.25 < 1/H < 0.50 is the weak steady state type; 0.50 < 1/H < 0.75 is the weak sensitive type, and 1/H > 0.75 is the sensitive type. However, when the fitting of the equation is not significant, the type is considered stable.
3. Results
3.1. Variation in Foliar Stoichiometric Characteristics of L. chinensis along a Latitudinal Gradient
At different latitudes, the content of foliar N and P of L. chinensis together showed quadratic trends with increasing latitude (Figure 1). The foliar N content of L. chinensis at different latitudes ranged from 1.34 to 1.71, increasing initially and then decreasing with the increase in latitude. The trend of foliar N content was best fitted by a quadratic curve equation (R2 = 0.997, p < 0.05). The foliar P content ranged from 0.11 to 0.15, increasing initially and then decreasing with increased latitude (R² = 0.959, p < 0.01). The foliar N:P ratio of L. chinensis ranged from 11.46 to 12.94, decreasing initially and then increasing with the latitude, but the regression equation was not significant (R² = 0.804, p > 0.05). This showed that the foliar N and P contents of L. chinensis had significant relationships with the increase in latitude.
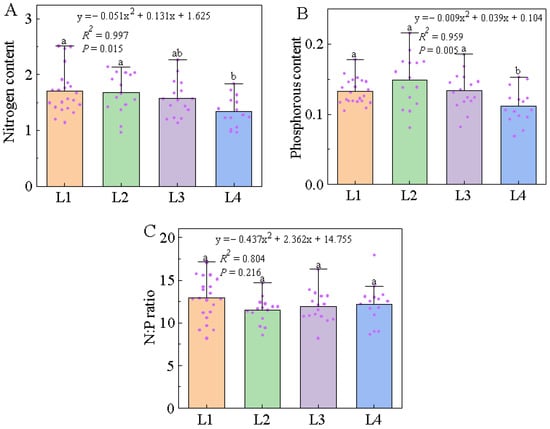
Figure 1.
Trends in ecological stoichiometry characteristics of nitrogen content, phosphorous content, and N:P ratio in L. chinensis along a latitudinal gradient. Note: The x-axis in (A–C) represents different latitudinal gradients. The y-axis in (A–C) represents nitrogen content, phosphorous content, and N:P ratio in L. chinensis, respectively, including the values of chemical contents for all plots and average values at different latitudinal gradients. The purple dots represent plots distributed along different latitudinal gradients.
3.2. Relationships between the Foliar N:P Ratio and Soil Stoichiometry in Different Soil Layers
There was a significant positive correlation between the foliar N:P ratio and TN in the 10–20 cm (R2 = 0.9211, p < 0.05), 20–30 cm (R2 = 0.9307, p < 0.05) and 0–30 cm (R2 = 0.9252, p < 0.05) soil layers (Table 2). In the 0–10 cm soil layer, although soil TN content also showed an increasing trend with the increase in the foliar N:P ratio, the relationship was not significant (p > 0.05). The TN contents in the 10–20 cm and 20–30 cm soil layers had significant effects that further led to the significant effect of TN content in the 0–30 cm soil layer on the foliar N:P ratio. The relationships between the foliar N:P ratio of L. chinensis and TP contents in the 0–10 cm, 10–20 cm, 20–30 cm, and 0–30 cm soil layers were not significant (Table 2). The foliar N:P ratio in L. chinensis was not significantly affected by soil TP content in the study area. There was a significant correlation between the soil N:P ratio in the 0–30 cm soil layer and the foliar N:P ratio of L. chinensis, with an increasing trend with the increase in the foliar N:P ratio (Table 2). There were no significant correlations between the N:P ratio in other soil layers and the foliar N:P ratio in L. chinensis (p > 0.05). In the study area, the soil N:P ratio in the 0–30 cm soil layer had a significant effect on the foliar N:P ratio of L. chinensis and displayed a positive correlation.
Table 2.
Variation in phosphorus content in different soil layers with the nitrogen and phosphorus ratio of L. chinensis.
3.3. Stoichiometric Homeostasis among Different Latitudes
During three consecutive years of sampling, the foliar HN, HP, and HN:P of L. chinensis showed absolute stability at different latitudes (Table 3). The stoichiometric homeostasis of foliar N and P contents of L. chinensis along the latitudinal gradient showed downward and upward trends, respectively, and the degree of fit was high (Figure 2A–C). The foliar HN and HP of L. chinensis had both high stoichiometric homeostasis indices and a certain trend of variation along the latitudinal gradient. The foliar HN:P of L. chinensis was highly consistent among the four latitude intervals, and the stoichiometric homeostasis index was higher than HN and HP (Figure 2D). This showed that the N:P ratio of the population of L. chinensis in the temperate steppe of Inner Mongolia was highly stable.
Table 3.
Stoichiometric homeostasis index of foliar chemical elements of L. chinensis at different latitudinal gradients.
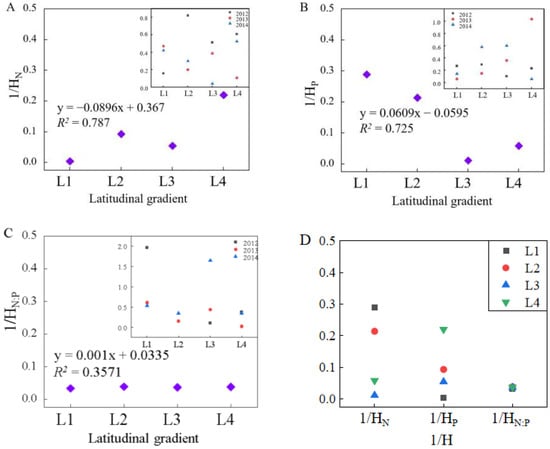
Figure 2.
The variations of stoichiometric homeostasis index of 1/HN, 1/HP, 1/HN:P in L. chinensis population under different latitudinal gradients. Note: The x-axis in (A–C) represents different latitudinal gradients. The x-axis in (D) represents 1/HN, 1/HP, 1/HN:P in L. chinensis at different latitudinal gradients.The y-axis in (A–D) represents the value of 1/HN, 1/HP, 1/HN:P in L. chinensis at different latitudinal gradients, respectively.
4. Discussion
4.1. Variation in Nitrogen and Phosphorus in Leymus chinensis
On a large scale, the characteristics of N and P in plants are the result of long-term adaptation to environmental conditions. Relevant studies have found that foliar N and P contents of terrestrial plants are regulated by many factors, including temperature, water, and soil nutrient conditions [24]. The results of this study showed that along a latitudinal gradient, the foliar N and P contents of L. chinensis showed downward parabolic trends. This conclusion supported the T-Biogeochemical hypothesis [25] but did not support the T-plant physiology hypothesis “N and P should decline monotonically with increasing temperature.” The pattern differed from Reich and Oleksyn’s report that “at the global scale, the distribution patterns of foliar nitrogen and phosphorus contents in plants generally show a trend of decreasing with the increase of annual mean temperature and precipitation” [26,27]. The results also differed from the conclusions of Ren and Han, who showed that the foliar N and P contents in terrestrial ecosystems increased with the increase in latitude and the decrease in the annual average temperature [28,29]. This difference in results may have been caused by the difference in species composition within communities in different ecosystems, resulting in different laws of N and P dynamics in the grass ecosystem compared with other ecosystems.
Liebig’s law of the minimum [30] was the first suggestion that the least available element in relation to demand among the elements that make up an organism would be the main factor limiting the growth of that organism, i.e., the organism is limited by the least available element in relation to demand. In grassland ecosystems, N and P together participate in the physiological and biochemical processes of plants. N and P are basic essential elements that have the strongest influence on plant growth. Koerselman and Meuleman have shown that on a global scale when the plant N:P ratio is >16, plant growth is limited by P; when the N:P ratio is <14, plant growth is limited by N, and when the N:P ratio is between 14 and 16, plant growth is limited by both N and P [31]. Braakhekke and Hooftman found that the N or P restriction of plant leaves in grassland ecosystems was not only related to the critical value of the N and P ratio but was also affected by the contents of N and P [32]. The results of this study showed that the foliar N:P ratio of L. chinensis was greater than 10 and less than 14, with P > 1.0 mg·g−1 and N < 20.0 mg·g−1. Therefore, combining the two thresholds of N and P, we conclude that the population of L. chinensis in this study area is limited by N. This is consistent with the findings of Bai Xue that in normal precipitation years, the growth of L. chinensis is limited by N [33]. At the same time, this also confirms the conclusion that N is the major limiting element in younger and higher latitudinal soils, supporting the hypothesis that the nutrient conditions of soil parent material determine N and P limits.
4.2. Stoichiometric Homeostasis and Determinants of the N:P Ratio in Leymus chinensis
The Homeostatic Mechanism posits that when nutrient supply and surrounding environmental conditions change [34], organisms can maintain the basic stability of their chemical composition through specific adaptations and regulation mechanisms. As a universal measure reflecting the adaptation of organisms to environmental changes, stoichiometric homeostasis is considered to be the theoretical premise for the existence of ecological stoichiometry and an essential characteristic of life [22], significant for the stability of ecosystem structure and function. Yu Qiang has pointed out that stoichiometric homeostasis indicators can reflect the adaptation of plants to an ecological environment and that species with high levels of stoichiometric homeostasis have greater dominance and stability [35]. The results of this study showed that the stoichiometric homeostasis of the foliar N, P, and N:P ratio of L. chinensis was characterized as absolute homeostasis across a latitudinal gradient. This indicates that L. chinensis can maintain the stability of elements in the leaves by regulating the acquisition of nutrients by underground parts. At the same time, the stoichiometric homeostasis index of the foliar N:P ratio of L. chinensis was high and similar in four latitude intervals. This indicates that the stoichiometric homeostasis index of the foliar N:P ratio of L. chinensis in the study area was consistent and higher than those of N and P, a pattern that may be caused by the changes in N and P in plant tissues being synergistic. That is, variation in N content in plant tissues is usually accompanied by variation in P content. In addition, this situation may be more closely related to L. chinensis itself, suggesting that the adjustment of the population to its internal stability is reflected in the N:P value rather than the content of each element [36]. Therefore, the internal stability of the L. chinensis population is not easily affected by changes in soil chemical elements or temperature. Compared with other species, L. chinensis is more widely distributed and can survive in the entire study area [37].
In an ecosystem, soil and plants can be regarded as an organic whole. Nutrient elements in plants come from the soil, and plants also affect the chemical composition of soil through metabolism and other processes. The results of this study showed that the foliar N content of L. chinensis decreased significantly with the increase in latitude, but there was a significant positive correlation between soil N content and the foliar N:P ratio. The foliar P content of L. chinensis decreased significantly, but there was no significant relationship between soil P content and the foliar N:P ratio of L. chinensis. These results indicated that the change in foliar N and P ratio of L. chinensis was determined by the change in soil N content and was less affected by the soil P content. Some studies have demonstrated that the root N content of grassland plants in Inner Mongolia is significantly related to latitude [38]; according to the nutrient cycle theory, the N content of L. chinensis comes from the soil N supply. Therefore, nutrient cycling is an important process for maintaining the organic matter cycle in grassland ecosystems. At the same time, the TN content in the 10–30 cm soil layer had a significant effect on the foliar element content of the plants. Related studies have found that the rhizome of L. chinensis is an important vegetative reproductive organ of the perennial and that its rooting depth is greater than the 10 cm soil layer [39]; thus, this result may be affected by the rhizome characteristics of L. chinensis [40].
5. Conclusions
In the study area, the population of L. chinensis was limited by N, and there was a positive correlation between soil TN content and the foliar N:P ratio of L. chinensis. Along a latitudinal gradient, the foliar N, P, and N:P ratio of L. chinensis showed an absolute steady state, with strong internal stability as a whole, and the value of HN:P was high and similar in different latitude intervals. In conclusion, L. chinensis has strong adaptability in the study area and is not susceptible to stoichiometric soil conditions or a latitudinal temperature gradient; thus, the species is significant for maintaining the stability of the temperate steppe ecosystem and promoting the healthy development of grassland husbandry in China.
Author Contributions
Conceptualization, J.W.; methodology, X.Y. (Xiangjun Yun) and X.Y. (Xia Yang); software, M.L. and S.L.; validation, S.L., H.L., X.Y. (Xiangjun Yun) and X.Y. (Xia Yang); formal analysis, J.W.; investigation, J.W., M.L. and Y.Y.; resources, M.L. and J.Y.; data curation, J.W.; writing—original draft preparation, J.W.; writing—review and editing, Y.Y., S.L., H.L., S.T., J.Y. and X.Y. (Xiangjun Yun); visualization, J.W. and M.L.; supervision, X.Y. (Xia Yang); project administration, X.Y. (Xiangjun Yun); funding acquisition, X.Y. (Xiangjun Yun) All authors have read and agreed to the published version of the manuscript.
Funding
This work was supported by Department of Science and Technology of Inner Mongolia Autonomous Region of China (No. 2023MS03012), National International Science and Technology Cooperation Special Project of the Ministry of Science and Technology (No. 2013DFR36760), Science and Technology Planning Project of Inner Mongolia Autonomous Region of China (No. 2020GG0130), Special topic of the National Key R&D Program (No. 2021YFD1300501-0) and Special Basic Scientific Research Business Expenses For Central-level Public Welfare Scientific Research Institutes Project (No. 1610332012201).
Data Availability Statement
The datasets used and/or analyzed during the current study are available from the corresponding author upon reasonable request.
Conflicts of Interest
The authors declare no conflict of interest.
References
- Liu, H.M.; Wu, Y.L.; Li, Y.X.; Lv, S.J.; Wei, Z.J.; Chen, B.R.; Xu, L.J.; Yang, G.X.; Xin, X.P.; Yan, R.R. Free-Grazing versus enclosure lead to an increase in the germination of the Leymus chinensis seed bank in the Hulunbuir grassland. Agronomy 2023, 13, 22. [Google Scholar] [CrossRef]
- Liu, G.S.; Li, X.X.; Zhang, Q.F. Sheepgrass (Leymus chinensis): An Environmentally Friendly Native Grass for Animals; Springer: Berlin/Heidelberg, Germany, 2019; pp. 1–51. [Google Scholar] [CrossRef]
- Li, J.D. A study on the basic life style of herbaceous plant in the northeast China grassland. J. Northeast Norm. Univ. 1979, 2, 143–155. [Google Scholar]
- Drake, J.E.; Aspinwall, M.J.; Pfautsch, S.; Rymer, P.D.; Reich, P.B.; Smith, R.A.; Crous, K.Y.; Tissue, D.T.; Ghannoum, O.; Tjoelker, M.G. The capacity to cope with climate warming declines from temperate to tropical latitudes in two widely distributed Eucalyptusspecies. Glob. Chang. Biol. 2014, 21, 459–472. [Google Scholar] [CrossRef] [PubMed]
- Simonsen, A.K. Environmental stress leads to genome streamlining in a widely distributed species of soil bacteria. ISME J. 2021, 2, 16. [Google Scholar] [CrossRef]
- Darren, W. Modelling the potential geographic distribution of invasive ant species in New Zealand. Biol. Invasions 2007, 9, 723–735. [Google Scholar] [CrossRef]
- Steven, J.P.; Miroslav, D.; Robert, E.S. A maximum entropy approach to species distribution modeling. In Proceedings of the Twenty-First International Conference on Machine Learning (ICML ‘04), Banff, AB, Canada, 4–8 July 2004; Association for Computing Machinery: New York, NY, USA, 2004; p. 83. [Google Scholar]
- Chen, J.S.; Liu, J.L.; Zhu, R.F.; Li, J.K.; Di, G.L.; Zhang, Q.; Mao, D.J.; Kong, X.L. Analysis of Suitable Biolimatic Characteristics of Leymus chinensis Using MaxEnt Model. Acta Ecol. Sin. 2019, 27, 35–42. [Google Scholar] [CrossRef]
- Zeng, D.H.; Chen, G.S. Ecologycal stoichiometry: A science to explore the complexity of living systems. Acta Phytoecol. Sin. 2005, 29, 1007–1019. [Google Scholar] [CrossRef]
- Yu, Q.; Wilcox, K.; Pierre, K.L.; Knapp, A.K.; Han, X.G.; Smith, M.D. Stoichiometric homeostasis predicts species dominance, stability and response to global change. Ecology 2015, 96, 2328–2335. [Google Scholar] [CrossRef]
- Sabine, G. N:P ratios in terrestrial plants: Variation and functional significance. New Phytol. 2010, 164, 243–266. [Google Scholar] [CrossRef]
- Harris, G. Ecological Stoichiometry: Biology of Elements from Molecules to the Biosphere. Sterner, R. W. and Elser, J. J. (2002) Princeton University Press, Princeton, NJ, USA. J. Plankton Res. 2003, 25, 1183. [Google Scholar] [CrossRef]
- Zhang, L.X.; Bai, Y.F.; Han, X.G. Differential responses of N:P stoichiometry of Leymus chinensis and Carex korshinskyi to N additions in a steppe ecosystem in Nei Mongol. Acta Bot. Sin. 2004, 46, 12. [Google Scholar] [CrossRef]
- Gao, L. Soil Carbon and Nitrogenmineralization in the Eastern Eurasia Steppe Transect and Its Response to Grazing. Ph.D. Thesis, Chinese Academy of Agricultural Sciences, Beijing, China, 2020. [Google Scholar] [CrossRef]
- Zhao, N.X.; Gao, Y.B.; Wang, J.L.; Ren, A.Z.; Ruan, W.B.; Chen, L.; Liu, H.F. An analysis of genetic differentiation between Stipa grandis populations in middle and eastern Inner Mongolia stepper. Acta Ecol. Sin. 2004, 19, 2178–2185. [Google Scholar] [CrossRef]
- Konrad, H. Das Halbmikro-Kjeldahl-Verfahren als Standard-Bezugsmethode für die Eiweißbestimmung in Milch. Nahrung 1969, 13, 143–149. [Google Scholar] [CrossRef]
- Jordan, L.P.; John, B.B. An antimony-phosphomolybdate microassay of ATPase activity through the detection of inorganic phosphate. Anal. Biochem. 2021, 623, 0003–2697. [Google Scholar] [CrossRef]
- Stagge, J.H.; Tallaksen, L.M.; Gudmundsson, L.; Van Loon, A.F.; Stahl, K. Candidate Distributions for Climatological Drought Indices (SPI and SPEI). Int. J. Climatol. 2015, 35, 4027–4040. [Google Scholar] [CrossRef]
- Delacre, M.; Lakens, D.; Leys, C. Why Psychologists Should by Default Use Welch’s t-test Instead of Student’s t-test. Int. Rev. Soc. Psychol. 2017, 30, 92–101. [Google Scholar] [CrossRef]
- Aleksandrova, O.; Zhmykhova, T.; Värnik, R.; Viira, A.H. The One-Way Analysis of Variance of Heat-Storage Materials Used in Building of Poultry Houses. Processes 2023, 11, 104. [Google Scholar] [CrossRef]
- Syafrudin, S.; Ramadan, B.S.; Budihardjo, M.A.; Munawir, M.; Khair, H.; Rosmalina, R.T.; Ardiansyah, S.Y. Analysis of Factors Influencing Illegal Waste Dumping Generation Using GIS Spatial Regression Methods. Sustainability 2023, 15, 1926. [Google Scholar] [CrossRef]
- Sterner, R.W.; Elser, J.J. Ecological Stoichiometry: The Biology of Elements from Molecules to the Biosphere; Princeton University Press: Princeton, NJ, USA, 2002. [Google Scholar] [CrossRef]
- Persson, J.; Fink, P.; Goto, A.; Hood, J.M.; Jonas, J.; Kato, S. To be or not to be what you eat: Regulation of stoichiometric homeostasis among autotrophs and heterotrophs. Oikos 2010, 119, 741–751. [Google Scholar] [CrossRef]
- Tian, D.; Yan, Z.B.; Fang, Z.B. Review on characteristics and main hypotheses of plant ecological stoichiometry. Chin. J. Plant Ecol. 2021, 45, 682–713. [Google Scholar] [CrossRef]
- Peñuelas, J.; Sardans, J.; Llusià, J.; Owen, S.M.; Carnicer, J.; Giambelluca, T.W.; Rezende, E.L.; Waite, M.N. Faster returns on “leaf economics” and different biogeochemical niche in invasive compared with native plant species. Glob. Chang. Biol. 2010, 16, 2171–2185. [Google Scholar] [CrossRef]
- Reich, P.B.; Oleksyn, J. Global patterns of plant leaf N and P in relation to temperature and latitude. Proc. Natl. Acad. Sci. USA 2004, 101, 11001–11006. [Google Scholar] [CrossRef]
- Tang, Z.Y.; Xu, W.T.; Zhou, G.Y.; Bai, Y.F.; Li, J.X.; Tang, X.L.; Chen, D.M.; Liu, Q.; Ma, W.H.; Xiong, G.M.; et al. Patterns of plant carbon, nitrogen, and phosphorus concentration in relation to productivity in China’s terrestrial ecosystems. Proc. Natl. Acad. Sci. USA 2018, 115, 4033–4038. [Google Scholar] [CrossRef]
- Ren, S.J.; Yu, G.R.; Tao, B.; Wang, S.Q. Leaf nitrogen and phosphorus stoichiometry across 654 terrestrial plant species in NSTEC. Environ. Sci. 2007, 28, 2665–2673. [Google Scholar] [CrossRef]
- Han, W.X.; Wu, Y.; Tang, L.Y.; Chen, Y.H.; Li, L.P.; He, J.S.; Fang, J.S. Leaf carbon, nitrogen and phosphorus stoichiometry across plant species in Beijing and its periphery. Acta Sci. Nat. Univ. Pekin. 2009, 45, 855–860. [Google Scholar] [CrossRef]
- Von Liebig, J.F.; Playfair, L.P. Organic Chemistry in Its Application to Agriculture and Physiology; Verlag Viehweg: Braunschweig, Germany, 1843. [Google Scholar] [CrossRef]
- Koerselman, W.; Meuleman, A.F.M. The vegetation N:P ratio: A new tool to detect the nature of nutrient limitation. J. Appl. Ecol. 1996, 33, 1441–1450. [Google Scholar] [CrossRef]
- Braakhekke, W.G.; Hooftman, D.A.P.; Braakhekke, W.G.; Hooftman, D.A.P. The resource balance hypothesis of plant species diversity in grassland. J. Veg. Sci. 1999, 10, 187–200. [Google Scholar] [CrossRef]
- Bai, X.; Cheng, J.H.; Zheng, S.X.; Zhan, S.X.; Bai, Y.F. Ecophysiological responses of Leymus chinensis to nitrogen and phosphorus additions in a typical steppe. Chin. J. Plant Ecol. 2014, 38, 103–115. [Google Scholar] [CrossRef]
- Koojiman, S.A.L.M. The stoichiometry of animal energetics. J. Theor. Biol. 1995, 177, 139–149. [Google Scholar] [CrossRef]
- Yu, Q.; Elser, J.J.; He, N.P.; Wu, H.H.; Chen, Q.S.; Zhang, G.M.; Han, X.G. Stoichiometric homeostasis of vascular plants in the Inner Mongolia grassland. Oecologia 2011, 166, 1–10. [Google Scholar] [CrossRef]
- Zhao, J. Nitrogen-Phosphorus Stoichiometry in Potentilla fruticose Linn. In Gannan Sub-Alpine Meadow; Lanzhou University: Lanzhou, China, 2011. [Google Scholar]
- Yu, Q.; Chen, Q.; Elser, J.J.; He, N.; Wu, H.; Zhang, G.; Wu, J.; Bai, Y.; Han, X. Linking stoichiometric homoeostasis with ecosystem structure, functioning and stability. Ecol. Lett. 2010, 13, 1390–1399. [Google Scholar] [CrossRef] [PubMed]
- Fan, J.W.; Zhang, L.X.; Zhang, W.Y.; Zhong, H.P. Plant root N and P leves and their relationship to geographical and climate factors in a Chinese grassland transect. Acta Prataculturae Sci. 2014, 23, 69–76. [Google Scholar] [CrossRef]
- Bao, Y.J.; Cao, M.; Li, Z.H.; Guo, P.; Zhang, J.; Qin, J. A comparative study of the response of Leymus chinensis and Stipa grandis root characteristics to moisture gradients. Acta Ecol. Sin. 2004, 39, 1063–1070. [Google Scholar] [CrossRef]
- Bai, W.Y. Intraspecific Differentiation of Clonal Growth Characteristics of Leymus chinensis Rhizome and Its Relationship with Geographical and Climatic Factors of Original Habitat. Ph.D. Thesis, Chinese Academy of Agricultural Sciences, Beijing, China, 2021. [Google Scholar] [CrossRef]
Disclaimer/Publisher’s Note: The statements, opinions and data contained in all publications are solely those of the individual author(s) and contributor(s) and not of MDPI and/or the editor(s). MDPI and/or the editor(s) disclaim responsibility for any injury to people or property resulting from any ideas, methods, instructions or products referred to in the content. |
© 2023 by the authors. Licensee MDPI, Basel, Switzerland. This article is an open access article distributed under the terms and conditions of the Creative Commons Attribution (CC BY) license (https://creativecommons.org/licenses/by/4.0/).