Abstract
To investigate the effects of salinity stress on durum wheat cultivars at the critical stages of germination and seedling establishment under salinity stress, a study was conducted on eight durum wheat cultivars (Karim, Khiar, Inrat100, Maali, Monastir, Portodur, Razeg, and Salim) subjected to an increasing salinity concentration by using sodium chloride (NaC) (0, 2, 4, 6, and 10 g L−1). Germination and seedling physiological parameters were measured and thoroughly analyzed. Salinity stress significantly decreased germination capacity (GC), germination rate (GR), final germination capacity (FGC), germination index (GI), mean daily germination (MDG), and velocity coefficient (Vc), whereas mean germination time (MGT) and the stress index (SI) increased. Plantlet growth and initial vigor (IV) were also significantly hampered. Regarding all these traits, the cultivars’ differences were revealed: Karim and Salim were the least affected, whereas Razeg and Maali were the most affected, and the other cultivars occupied an intermediate position. Depending on cultivar, salinity stress decreased the germination capacity and delayed its initiation. At low salinity stress (2–4 g L−1 NaCl), the osmotic effect (OE) was the main cause of germination inhibition, whereas at high salinity stress (6–10 g L−1 NaCl), the toxic effect (TE) dominated and irreversibly inhibited the germination process. The initial vigor and the stress index that clearly discriminate among the studied cultivars are useful traits for screening tolerant genotypes. Otherwise, durum wheat showed a higher plasticity with salinity at the germination stage, allowing it to develop better tolerance at this stage, as compared to early stage plantlet growth.
Keywords:
durum wheat; germination; initial vigor; osmotic effect; stress index; toxic effect; salinity 1. Introduction
Soil salinity, whether natural or anthropogenic, affects more than 20% of cultivable land in the world. A soil is considered saline when its sodium chloride (NaCl) concentration exceeds 40 mM. Spotted as marginal, these soils continue to increase and occupy new areas because of the scarcity of conventional water and the use of more saline water, unsustainable irrigation, and the introduction of saline soils into agricultural cropping systems [1]. Adding to these factors the actual perturbations related to climate change, the problem of salinity will represent in the near future a real handicap for world agriculture. Tunisia is no longer immune to this threat, especially since it is, for the most part, in an arid and semi-arid climate. Munns and Tester [2] reported that salinity deprives 1.5 million hectares from the production systems yearly. Thus, 50% of arable land will be lost by 2050 [3].
Cereal crops, especially durum wheat, are exposed to many environmental factors that limit their yield. Soil salinity is one of the major constraints that strongly affects plant growth, especially in arid and semi-arid areas. These regions are characterized by a high irregularity of precipitation associated with significant evaporation, favoring the accumulation of salts in the soil. This phenomenon affects nearly 7% of the world’s land surface [4]. The effects of salinity are manifested by direct toxicity due to the excessive accumulation of ions (Na+ and Cl−) in tissues and an imbalance of mineral nutrition mainly due to competition between minerals: sodium with potassium and calcium, chloride with nitrate, phosphate, and sulfate [5,6]. The negative effect of salinity can be observed at the level of seeds during their germination and at the level of the plant, either by its senescence or the death of certain organs or by the loss of yield.
Seed germination is the first stage of the plant’s cycle, known to be the most sensitive to stress [7] and determining crop yield [8]. However, this stage is known to be sensitive to salt stress in diverse plant species such as pepper [9], Atriplex halimus [10], oregano [11], and Sulla carnosa [12]. Liu et al. [13] reported that the germination and initiation of juvenile plants are critical stages for crop establishment. Soil salinity is a major stress responsible for reduced, delayed, and sometimes inhibited seed germination and early stage plantlet establishment. The seed germination and seedling growth of durum wheat, such as other crops, are negatively affected by salinity stress [14]. Poor germination and decreased seedling initiation result in poor crop establishment that, in turn, causes decreased crop plasticity with diverse biotic and abiotic stresses and subsequently higher losses of plant growth and yield. High rhizosphere salinity leads to a decrease in the osmotic potential of the soil solution, resulting in a reduced water uptake by dry seeds (inhibited seed imbibition). Otherwise, the absorption of excess toxic ions (Na+ and Cl−) from the rhizosphere creates ionic stress and causes toxicity—which disrupts key biochemical processes (such as nucleic acids, lipids, carbohydrates, and protein metabolism), energy production, and respiration—damages the nutrient and hormone balances during germination, disturbs the equilibrium between the generation and scavenging of reactive oxygen species (ROS), and induces cellular structure injury, resulting in inhibited seed germination [14,15,16]. Previous studies by Bouzidi et al. [17] have shown that salinity affects the Sulla carnosa seed germination process through osmotic and/or toxic stresses (depending on NaCl concentration), as shown by a decreased germination rate and an extended germination time. The osmotic effect is explained by the increase in external osmotic potential that reduces water uptake during imbibition, whereas the toxic effect is explained by the excess of sodium and chloride accumulation that causes threats to embryo viability. At the vegetative stage, the deleterious effect of salinity regarding its toxic effects was explained by the disruption of enzyme and macromolecule structure, respiration, photosynthesis, protein synthesis, and damage to the cell membrane [18,19,20].
In Tunisia, salty soils occupy an area of 1.5 million hectares, about 25% of the country’s total arable land area [21]. Several solutions have been put forward to mitigate the risks to agronomic production. However, such solutions are costly and difficult to implement. Alternatively, the adverse effects of salinity on crop yields can be minimized by screening species, genotypes, and cultivars that are better suited to salinity conditions. Durum wheat, the most cultivated cereal in the Mediterranean basin and a major component of the daily diet, is a strategic crop in Tunisia. It is usually subjected to soil and water salinity, particularly at the germinating stage. However, this stage arouses a primordial interest in the subsequent tolerance of crops. Mrani Alaoui et al. [22] reported the importance of the germination phase for the subsequent stages of plant development and growth, particularly in arid and semi-arid areas. In saline agrosystems, Mbarki et al. [23] highlighted that plant tolerance to salinity is important during germination and early seedling establishment. Nevertheless, differences in the germination and early stage establishment behavior of species and cultivars have been identified under salinity and other abiotic stresses. The exploration of this variability to screen cultivars with good germination and plantlet initiation under salinity stress represents a rapid, safe, and ecofriendly approach. Otherwise, the right start of the plant’s cycle under saline conditions can guarantee its subsequent success. Durum wheat, even in an irrigated perimeter, was usually subjected to salinity stress at the germinating and early vegetative stages due to salinized soil and water. Of the global salt-affected land, 7700 hm2 is secondary saline soil, of which 58% occurs in irrigated agricultural areas [24]. With the expansion of saline lands in a stressful climate, the exploitation of salt-tolerant crops would be an efficient strategy for using saline soils and water. The present study does not escape this approach and consists of studying the effect of salinity stress on durum wheat seed germination and juvenile plantlet establishment. A specific point of focus will be the genotypic differences in response to this abiotic constraint in order to identify tolerant cultivars, highlight useful traits of tolerance, and locate the most sensitive stage of the plant cycle (germination or the early vegetative stage) in order to propose the appropriate intervention to alleviate the effect of salinity stress.
2. Materials and Methods
2.1. Biological Material and Germination Experiments
This work was conducted on the strategic main crop in Tunisia, durum wheat. Eight cultivars, known to grow in different bioclimatic stages in Tunisia with significant differences in yield and precocity, provided for us by the High Institute of Field Crops of Kef (Inrat100, Karim, Khiar, Maali, Monastir, Portodur, Razek, and Salim), were used in this study. They were subjected to an increasing salinity stress during germination and early stage plant establishment. Seeds of each cultivar were prescreened for their health and homogeneity. A hundred seeds for each cultivar were used per treatment at the rate of twenty seeds per Petri dish, containing filter paper (five dishes per treatment and genotype) imbibed with distilled water (control—0 salt), and saline solution containing 0, 2, 4, 6, and 10 g L−1 sodium chloride (NaCl). Germination percentage (GP) was recorded daily, and the experiment ended after three successively stable GPs that were retained as the germination capacity (GC). The presented results are the mean of 100 seeds. The seed germination recovery allows us to discriminate between the toxic and the osmotic effects. For this purpose, the non-germinating seeds were transferred to deionized water for an additional three days and the germination percentage was also recorded as previously performed.
2.2. Potted Experiments
The germinated seeds from each treatment were transferred for an extra four weeks in 1 kg plastic pots equipped with recovery plates containing inert, clean quartz sand, washed with concentrated sulfuric acid, and rinsed several times with deionized water [25]. Five pots containing three germinated seeds each, per genotype and per treatment, were placed in a greenhouse at the Faculty of Sciences and Techniques of Sidi Bouzid (35°2′7.58″ N 9°29′2.18″ E) under natural light and at a temperature of 25 °C/17 °C (±2 °C, day/night), relative humidity of about 75%, and using the following nutrient solutions [26] (Farzadfar et al., 2017): Ca(NO3)2, 4H2O (3.5 mM), KNO3 (3 mM), NH4NO3 (2 mM), K2SO4 (1.5 mM), KH2PO4 (1.6 mM), K2HPO4 (0.3 mM), H3BO3 (4 μM), MnSO4 (4 μM), ZnSO4 (1 μM), CuSO4 (1 μM), CoCl2 (0.12 μM), (Na)6(Mo)7O24 (0.12 μM) and Fe-K-EDTA (45 μM), with the same NaCl concentration that was added for germination (0, 2, 4, 6, and 10 g L−1 NaCl). Because the field capacity of the used sand was very low (7%), plants were over-irrigated every two days. The excess solution recovered in the plate was returned into the pots the next day. Seedling growth was evaluated after four weeks of treatment. Plantlets’ heights were measured before harvest, then shoot, root, and total biomass were quantified.
2.3. Experimental Design and Germination Indicators
The experimental design was 2 factorials (genotype × NaCl concentration), arranged in a completely randomized design with 5 replications of 20 seeds in the germination stage (results presented as means of 100 seeds) and 5 replications in the seedling stage (5 pots containing three plantlets each, and results were presented as means of 15 plantlets). The following traits were determined based on the various experiments:
- Germination capacity (GC, %): This parameter allows the identification of the saline concentration that constitutes the physiological limit of durum wheat seed germination, expressed as the ratio of maximum germinated seeds to the total number of seeds:
where a = total number of seeds, b = maximum number of germinated seeds.
- Germination percentage (GP, %): Expressed as the ratio of germinated seeds at day n to the total number of seeds:
where a = total number of seeds, c = number of cumulative germinated seeds at day n, n = day 1, 2, …n.
- Germination rate (GR): This parameter constitutes an important tool for monitoring germination as a function of time, expressed as the evolution of GP in time.
- Germination index (GI): Expressed as the ratio of GC under salt stress (GCS) to GC in control (0 NaCl, GCC). It is calculated as follows:
- Velocity coefficient (Vc): Calculated as follows:
where Nn the number of germinated seeds between time Tn − 1 and Tn.
- Mean germination time (MGT, days): This parameter is determined according to the following formula [27]:
where n is the number of seeds germinated on day i, d is the incubation period in days, and b the total number of seeds germinated upon treatment.
- Mean daily germination (MDG, %): According to Osborne and Mercer [28], the MDG is calculated as the ratio of the germination percentage to the total number of germination days at the end of the experiment:
where b = maximum number of germinated seeds upon treatment, and n = number of germination days at the end of the experiment.
- Germination recovery (GRec, %): Expressed as the capacity to recover the germination capacity lost on NaCl treatment, calculated using the following equation:
where d = number of seeds germinated after transfer in deionized water, b = maximum number of germinated seeds under salt, and a = total number of seeds [29].
- Final germination capacity (FGC, %): This parameter allows us to calculate the maximum germination capacity, considering the recovery potentiality, expressed as the sum of GC and GRec at each treatment:
where a = number of total seeds, b = maximum number of germinated seeds under salt, and d = number of seeds germinated after transfer in deionized water.
- -
- Initial vigor (IV): This indicator is a good parameter that relates the germination capacity to plant growth. It is calculated as follows:
where GC = germination capacity, DW = plant dry weight.
Stres index (SI): This parameter is the indicator of stress degree in each cultivar. It is calculated as follows:
- (a)
- based on GC:
- (b)
- based on plant growth:
where GCs = germination capacity under salt stress, GCc = germination capacity in control treatment, DWs = dry weight in salt-stressed plants, and DWc = dry weight in control plants.
2.4. Statistical Analysis
Treatments were arranged in a completely randomized design in factorial experiment. They are presented as mean ± standard error. Analysis of variance (ANOVA) was performed to determine whether the different experimental factors affect germination and/or plant growth. The significance of differences among treatments was determined by Fisher’s least significant difference test (LSD) (p < 0.05). Treatment means were declared significant when the difference between any two treatments was greater than the LSD value generated from the ANOVA. They are marked by different letters in the figures and tables.
3. Results
Salinity stress decreased germination capacity (GC) in durum wheat, depending on NaCl concentration and genotype (Figure 1). At low salinity stress (2 g L−1 NaCl), we highlighted a non-significant decrease in GC in all cultivars except for Razeg and Maali, where GC decreased by 10%. At moderate stress (4 g L−1 NaCl), the genotypic differences were even more expressed. The GC decrease continued to be weak in Karim, Inrat, and Salim (−4% in Karim, −6% in Inrat and Salim), but exceeded by 10% in Khiar, Monastir, and Portodur, and continued to be more significant in Maali (−16%) and Razeg (−13%). At high salinity stress (6–10 g L−1 NaCl), GC significantly decreased in all cultivars that combined into three groups according to their degree of tolerance: Karim and Salim were the less affected group (GC decreased by 11% in Karim and by 10% in Salim at 6 g L−1 NaCl; and by 15% in Karim and by 19% in Salim at 10 g L−1 NaCl), Inrat, Khiar, Monastir, and Portodur were moderately affected (GC decreased by 13% in Inrat and Khiar, by 15% in Monastir and by 17% in Portodur, at 6 g L−1 NaCl; and by 21% in Inrat, by 19% in Khiar, by 28% in Monastir and by 25% in Portodur, at 10 g L−1 NaCl), and Maali and Razeg were the most sensitive group (GC decreased by 22% in Maali and Razeg at 6 g L−1 NaCl; and by 31% in Maali and by 29% in Razeg at 10 g L−1 NaCl).
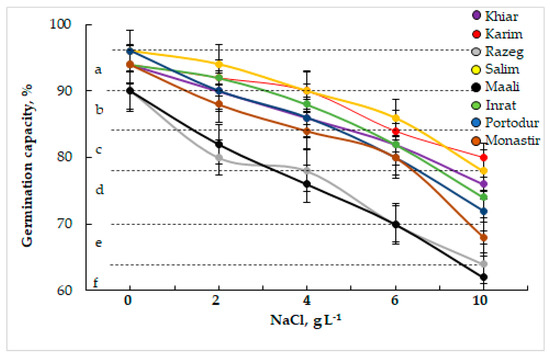
Figure 1.
Germination capacity (GC, %, a) of durum wheat grains subjected to different sodium chloride (NaCl) concentrations. The letters in the figure indicate the significance of differences. According to Fisher’s Least Significant Difference, means with the same letter are not significantly different at α = 0.05. Bars on the columns represent the standard error of the mean (n = 100, 5 replicates of 20 grains).
The daily monitoring of germination percentage (GP) showed a significant increase with time and reached its maximum earlier at low NaCl concentrations (after 2–3 days at 0–4 g. L−1 NaCl) than at high NaCl concentrations (after 4 days at 6–10 g L−1 NaCl) (Figure 2). However, increasing salinity stress significantly decreased germination rate (GR) in all cultivars, independently of NaCl concentration.
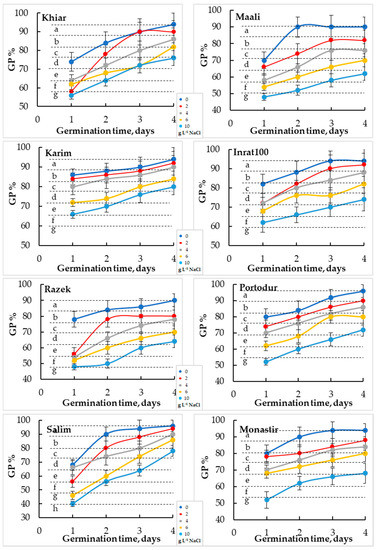
Figure 2.
Germination rates, which represent the evolution of germination percentage (GP) as a function of time, of durum wheat seeds subjected to different sodium chloride (NaCl) concentrations. The letters in the figure indicate the significance of differences. Means ± standard error of means of 100 grains (n = 100, 5 replicates of 20 grains) with the same letter are not significantly different at α = 0.05, according to Fisher’s least significant difference).
To distinguish the studied cultivars, we calculated the germination index (GI). Table 1 shows that increasing salinity stress decreased the GI in all cultivars, suggesting that the loss of germination faculty is completely dependent on NaCl concentration. Our results also show a clear genotypic difference in response to salinity stress in durum wheat. Maali and Karim had the lowest GI values under both low and high salinity stress.

Table 1.
Germination index (GI) in durum wheat cultivars subjected to an increasing NaCl concentration. Within rows, means ± standard error with the same letter are not significantly different at α = 0.05, according to Fisher’s least significant difference (n = 100, 5 replicates of 20 grains).
The calculation of the Vc, MGT, and MDG shows an inverse relationship with NaCl concentration for the Vc and MDG and a linear relationship for the MGT (Table 2). Increasing NaCl concentration decreased Vc and MDG, and increased MGT, meaning that sodium chloride delays seed germination and inhibits the germination capacity. The previously observed genotypic differences were also maintained. Independently of NaCl concentration, Karim and Salim remained the least affected, followed by Inrat, Khiar, Monastir, and Portodur, whereas Razeg and Maali were the most affected.
Table 2.
Velocity coefficient (Vc), mean germination time (MGT), and mean daily germination (MDG) in durum wheat cultivars subjected to an increasing NaCl concentration. Within rows, means ± standard error with the same letter are not significantly different at α = 0.05, according to Fisher’s least significant difference (n = 100, 5 replicates of 20 grains).
When transferring non-germinated seeds in deionized water, the germination recovery (GRec) reached 100% until 4 g L−1 of NaCl in all cultivars was obtained, except for Razeg (GRec declined to 82%) and Maali (GRec declined to 83%). This ability to regain germination faculties was gradually lost after 6 g L−1 NaCl (GRec extended between 64 and 75% and reached its lowest values in Maali, 50%, and Razeg, 43%), and accentuated even more at 10 g L−1 NaCl (GRec did not exceed 50% and reached its lowest values, 28%, in Razeg, Figure 3).
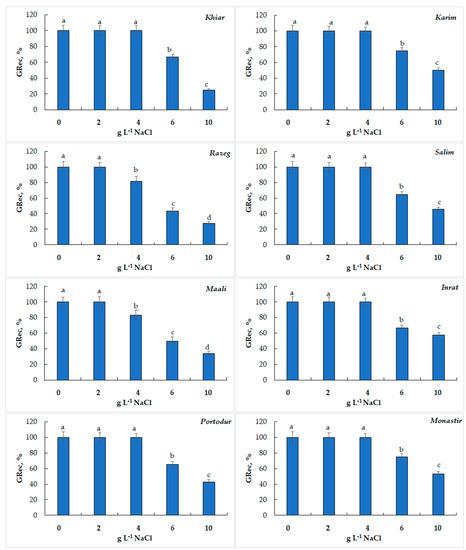
Figure 3.
Germination recovery (GRec, %) of durum wheat seeds subjected to salinity stress. Within histogram, means ± standard error with the same letter are not significantly different at α = 0.05, according to Fisher’s least significant difference.
Regarding these results, we can suggest that the main limiting factor of durum wheat seed germination under moderate salinity stress is the osmotic effect. The toxic effect, which represents an irreversible inhibition of seed germination, appeared at 4 g L−1 NaCl only in Razeg (18%) and Maali (17%) and increased gradually with NaCl concentration. It became significant only at 10 g L−1 NaCl and dominated the osmotic effect in Razeg and Maali (Figure 4).
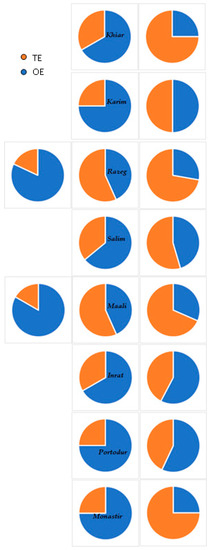
Figure 4.
Evolution of the osmotic (OE) and toxic effects (TE) affecting durum wheat germination in relation to sodium chloride (NaCl) concentration.
When adding the germination recovery to the initial germination capacity, i.e., eliminating the osmotic effect, the final germination capacity became very important until 10 g L−1 NaCl (Figure 5) was obtained. Until 4 g L−1 NaCl was achieved, GC reached its maximum (100%) in all cultivars, except for Razeg and Maali (82%). At severe salinity stress, the GC exceeded 80% at 6 g L−1 NaCl and 75% at 10 g L−1 NaCl in all cultivars, with respect to the previously observed genotypic differences.

Figure 5.
Final germination capacity (FGC, %) of durum wheat subjected to salinity stress. The letters in the figure indicate the significance of differences. Means ± standard error of means of 100 grains (n = 100, 5 replicates of 20 grains) with the same letter are not significantly different at α = 0.05, according to Fisher’s least significant difference.
The germinated seeds were transferred to a pot culture, irrigated with nutrient solution, and maintained at the same NaCl concentration as for germination. Figure 6 illustrates the biomass production after 30 days. Increasing NaCl concentration in the medium significantly decreased plant growth in all cultivars. However, Karim and Salim maintained their superiority over the other cultivars, whereas Razeg and Maali remained the most affected cultivars, independently of salt stress severity (Figure 6). The biomass decrease started to be significant in the latter cultivars even at low salinity stress (−14% to −22% at 2 g L−1 NaCl and −41% to −49% at 2 g L−1 NaCl, respectively, in Razeg and Maali) and reached its highest levels at high salinity stress (−51% to −5% at 6 g L−1 NaCl and −63% to −73% at 10 g L−1 NaCl, respectively, in Razeg and Maali). The biomass decrease in Karim and Salim were not highly significant at high salinity stress only (−39% to −37% at 6 g L−1 NaCl and −50% to −58% at 10 g L−1 NaCl, respectively, in Karim and Salim).
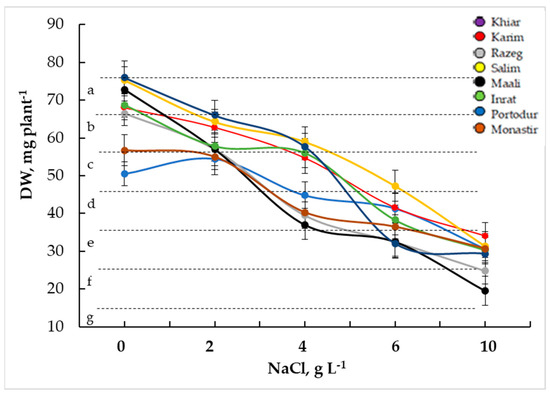
Figure 6.
Plant growth estimated by dry weight (DW) production in durum wheat plants subjected to salinity stress. The letters in the figure indicate the significance of differences. Means ± standard error of means of 15 plants (n = 15, 5 replicates of 3 plants) with the same letter are not significantly different at α = 0.05, according to Fisher’s least significant difference.
In order to progress in the elucidation of the genotypic variability in response to salinity stress at germination and early stage plant establishment, we calculated the initial vigor (IV). This parameter related the germination capacity to the plant growth (Table 3). Increasing NaCl concentration in the medium decreased IV in all cultivars. However, this parameter clearly distinguishes between the studied cultivars and confirms the sensitivity of Razeg and Maali as compared to the other cultivars, particularly Karim and Salim. Razeg lost 24% to 49% of its vigor, respectively, at 2 and 4 g L−1 NaCl, whereas Maali lost 29% to 57% of its vigor, respectively, at 2 and 4 g L−1 NaCl. At high salinity stress, Razeg lost 62% to 74% of its vigor, respectively, at 6 and 10 g L−1 NaCl, whereas Maali lost 65% to 82% of its vigor, respectively, at 6 and 10 g L−1 NaCl. In the other cultivars, the IV loss remained below 20% at 2 g L−1 NaCl, fluctuated between 20% and 30% at 4 g L−1 NaCl, and became significant at high NaCl concentrations (IV loss reached 60% at 6 g L−1 NaCl in some cultivars and 70% at 10 g L−1 NaCl). Karim and Salim remained the least IV losers, even at high salinity stress.
Table 3.
Initial vigor (IV) of durum wheat cultivars subjected to increased salinity stress. Within rows, means with the same letter are not significantly different at α = 0.05, according to Fisher’s least significant difference. Standard errors of means of five replicates (each replicate is the mean of twenty seeds for GC and three plants for DW).
For a second experiment, we calculated the stress index based on germination capacity (SI-GC) and plant growth (SI-DW). Table 4 shows that SI-GC increased with increasing salinity stress in wheat cultivars. Nevertheless, Razeeg and Maali showed the highest increase in their SI-GC, independently of NaCl concentration, whereas Karim and Salim, even if they increased their SI-GC with salinity stress, remained the least sensitive. For SI-DW, the same behavior was observed as for SI-GC, with the same genotypic differences. However, the values of SI-DW were clearly higher than those of SI-GC, particularly at high salinity stress.
Table 4.
Stress index calculated based on germination capacity (SI-GC) and plant growth (SI-DW) in eight durum wheat cultivars subjected to increased salinity stress. Within rows, means with the same letter are not significantly different at α = 0.05, according to Fisher’s least significant difference. Standard errors of means of 100 seeds for SI-GC and 15 plants for SI-DW.
4. Discussion
It is well established that crop plants are routinely affected by a broad range of abiotic stresses under natural growth conditions. The early stages of the plant cycle are no exception to this rule and even determine the subsequent response to stress. In this study, we subjected eight Tunisian wheat cultivars to an increasing salinity stress during germination and early stage plant establishment to understand their physiological responses and the cultivars’ differences in response to this abiotic stress. Our hypothesis was that a cultivar that shows some tolerance during germination and the early stages of development would certainly be tolerant at later stages of the plant cycle. We also tried to identify the most critical stage (germination or seedling establishment) in order to propose the appropriate improvement approach, such as priming if germination is more sensitive. The findings of this study can provide useful physiological indicators or traits for screening wheat cultivars for salt tolerance in future screening programs. Depending on cultivars, salinity stress significantly decreases GC, GR, GI, Vc, and MDG against an increase in MTG and SI. Karim and Salim have been shown to be the most tolerant, whereas Razeg and Maali are the most sensitive. The other cultivars occupy an intermediate position. In agreement with our results, several authors have reported that the increase in salt concentration in the rhizosphere decreased the germination percentage and increased the germination time by delaying its initiation [7,30,31]. In the current study, these effects were more pronounced in the sensitive cultivars (Razeg and Maali) than in the intermediate and tolerant cultivars (Karim and Salim). This is confirmed by the gradual decrease in salt of the Vc and MDG noted in all cultivars. The germination index decreases with increasing NaCl concentration (Table 1). However, the values recorded in Karim and Salim are still the highest, while those recorded in Razeg and Maali are the lowest, indicating some genotypic difference in the response of durum wheat to salinity at the germinating stage. Kandil et al. [32] observed a delay in sorghum seed germination that was more pronounced in salt-sensitive accessions than in the intermediate and salt-tolerant ones. Sima et al. [33] suggested that the high sensitivity of germination to salinity is attributed to damaged and delayed enzyme activity. At this level, Bouzidi et al. [17] suggested that low saline concentrations in the medium induced a state of dormancy and decreased the germination rate without acting as a toxic compound. On the contrary, a high saline concentration inhibits seed germination and decreases germination capacity due to the toxic effect of sodium ions. Severe saline stress delays seed germination and induces a reduction in the final germination percentage in cowpea [34]. Maas and Poss [35] explained that this delay in seed germination and the decrease in MDG with increased salt concentration are due to the time required for the seed to set up mechanisms to adjust its internal osmotic potential. The reduction in germination observed in this study due to severe stress (6 and 10 g L−1 NaCl) may be due to osmotic or toxic effects [36], which may disrupt certain enzymatic or hormonal activities of the seed [37]. The reduction in germination percentage and the slowdown in germination rate observed in this study could be due to the high uptake of Na+ and Cl− during germination, which results in cell toxicity and, therefore, in the inhibition or slowing of the germination rate and hence, germination percentage [38].
When transferred to deionized water, the germination recovery reached its maximum (100%) at low NaCl concentration in all cultivars, signaling that the main cause of germination inhibition is the OE, even if the TE appeared in Razeg and Maali at 4 g L−1 NaCl (did not exceed 20%). At high salinity stress (6–10 g L−1 NaCl), all cultivars start to lose their GRec, signaling the installation of the TE, which dominates in Razeg and Maali (TE > OE) at 6 g L−1 NaCl and in all cultivars at 10 g L−1 NaCl. These results allow us to suggest that we can overcome the inhibitory effect of salinity by dilution at the germination stage using fresh water. This technique allows us to reach a FGC of 95% at 6 g L−1 NaCl and 90% at 10 g L−1 NaCl in the most tolerant cultivars (Karim and Salim) and 84% at 6 g L−1 NaCl and 75% at 10 g L−1 NaCl in the most sensitive cultivars (Razeg and Maali). Previously, Bouzidi et al. [17] observed that Sulla carnosa suffers from difficulties with seed germination due to osmotic stress until 15 g L−1 NaCl is reached, which can be overcome by dilution. Beyond this concentration, the toxic effect dominates and irreversibly inhibits seed germination. They suggest that high accumulations of Na+ inhibit the activity of many enzymes and proteins, leading to cellular dysfunction. Tahjib-Ul-Arif et al. [39] reported that salinity disrupts the absorption of mineral ions and induces oxidative stress due to toxic ions. Patade et al. [7] demonstrated that germination is one of the most sensitive stages of the plant’s life cycle to salinity, whereas Hubbard et al. [13] added that seed germination and young seedling growth are the two most critical stages of the plant cycle.
As previously mentioned [7,13], seedling establishment is also a critical stage of plant development. In line with these results, our findings showed that salinity stress significantly decreased plant growth in the studied cultivars, with respect to the previously observed genotypic differences at the germinating stage (Karim and Salim were the least affected, Razeg and Maali were the most affected, and the other cultivars occupied an intermediate position). Liu et al. [13] explained the inhibited seedling growth under salinity by the restricted absorption of water and nutrients in high-salinity soils, which damages cells, organs, and tissues, slows metabolism, and inhibits growth. The stability of the genotypic differences despite the transition from seed germination to the seedling growth stage allows us to suggest the interdependence of these early stages of the developmental plant cycle. In fact, the calculation of the initial vigor that lies between these two stages (DW × GC, Table 3) supported this suggestion and confirmed the genotypic differences previously observed. The gradual decrease in IV with increasing NaCl concentration demonstrated the harmful effect of salinity on the initial vigor of plants, which will certainly have an adverse effect on the subsequent stages. Otherwise, this trait confirms the relative tolerance of Karim and Salim, particularly as compared to Razeg and Maali. At severe salinity stress (10 g L−1 NaCl), Karim develops an initial vigor 1.7 and 2.3 times higher than that of Razeg and Maali, respectively, whereas Salim develops an initial vigor 1.5 and 2.0 times higher than that of Razeg and Maali, respectively. We can thus suggest that IV is a useful trait of wheat tolerance to salinity stress that can be used for subsequent screening programs. In line with these results, Kandil et al. [32] reported that salt stress adversely affects plants at all stages of their life cycle. Bhattarai et al. [40] demonstrated that the seed vigor and seedling length of salt-tolerant alfalfa cultivars were greater as compared to other cultivars in 16 dS m−1. According to Chauhan et al. [41], an increase in salt concentration decreases the seedling performance of sorghum cultivars at EC ≥ 10 dS m−1 and the performance depends on genotypes. Mbarki et al. [23] reported that germination and seedling traits are the most appropriate aspects upon which a plant’s final yield depends.
In the present study, the observed genotypic differences were explained by the differences in the uptake of the toxic ions, particularly Na+, at the germinating stage that influence the seedling growth. Thus, the relative tolerance of Karim and Salim can be explained by their lesser ion toxicities, which are supported by the dominance of the osmotic effect, whereas the sensitivities of Razeg and Maali are explained by the high Na+ and Cl− accumulation, which create a situation of toxicity. This explanation is supported by the dominance of the TE over the OE in these cultivars. In fact, the presence of broad intraspecific genetic variation among wheat cultivars was previously observed in sorghum accessions for salt tolerance [42]. Salinity reduced germination parameters as the salt level increased. Kandil et al. [32] outlined that the toxic effects of Na+ and Cl− ions on germinating seeds affect germination percentage, germination rate, the energy of germination, and seedling vigor. In line with our findings, Munns et al. [43] demonstrated that salinity exerts its undesirable effects through osmotic inhibition and ionic toxicity. Accordingly, Taghvaei et al. [44] explained the reduced seedling growth under salinity stress by the induced high osmotic potential, due to the accumulation of salt and the specific toxicity of the Na+ and Cl− ions in the germination phase. High Na+ concentrations in the soil decrease water osmotic potential, which, in consequence, reduces water uptake by seeds (weak seed imbibition) and by the roots of newly established seedlings. The Na+ and Cl− ions exert a toxic effect on plants and induce osmotic and ionic stress, which limits the uptake of other vital elements (K+, Ca2+, Mg2+, and NO3−) and disturbs plant functioning [14,44,45]. A high concentration of Na+ in the soil complex can lead to many permanent disorders at every stage of plant development [14].
The calculated SI based on germination capacity and plant growth (Table 4) confirms the previously observed genotypic differences. The cultivars Karim and Salim remain usually the least stressed, independently of salinity stress, whereas Razeg and Maali are the most stressed cultivars. Nevertheless, the comparison of SI in all cultivars with regard to the plant cycle stage demonstrated that SI-DW remains usually higher than SI-GC (Table 4). This result caused us to perceive that durum wheat is more tolerant at the germination than vegetative stage, even in the tolerant cultivars. Accordingly, Zulfiqar et al. [46] indicated that sorghum is more tolerant to salinity at germination than at the subsequent growth stage. However, Ayers and Hayward [47] suggested that salt tolerance at germination and other phases of the plant life cycle are not necessarily correlated. In some plants, germination is a more resistant process, whereas in others, the growth phase is more tolerant to salinity. In sea lavender (Limonium meyeri), seeds cannot germinate in salt solutions above 1.5%, yet the mature plant can grow even in the presence of a 10% salt solution in soil [48]. Otherwise, Ungar [49] has reported that seed germination in Hordeum jubatum is more resistant to salinity than the later growth of the seedling, whereas Mahmood and Malik [50] had observed in Atriplex undulata a greater salt tolerance at the growth stage than at the germination stage.
Altogether, our results demonstrated that salinity stress has adverse effects on all physiological parameters related to the germination and juvenile plant stages. Salinity delayed the wheat germination and significantly decreased the germination capacity. At a low NaCl concentration, the osmotic effect dominates, whereas toxic effect dominates at severe salinity stress. In the sensitive cultivars (Razeg and Maali), the TE installs even at moderate salinity (4 g L−1 NaCl) and dominates at 6 g L−1 NaCl, while in the other cultivars, particularly the tolerant ones (Karim and Salim), the TE dominates only at 10 g L−1 NaCl. The deleterious effects of salinity are also expressed at the vegetative stage with a significant decrease in plant growth. Figure 7 represents the inhibitory effect of salinity on grain germination and seedling growth. It also illustrates the genotypic differences highlighted in this study.
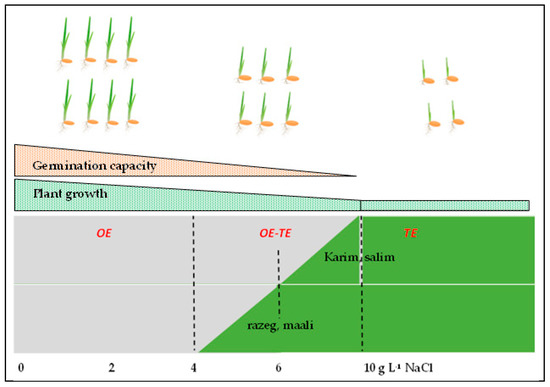
Figure 7.
Schematic representation of the effect of salinity stress on seed germination (represented by number of germinated seeds) and seedling growth (represented by seedling height) in durum wheat, depending on cultivars and NaCl concentration. OE: osmotic effect, TE: toxic effect.
5. Conclusions
It could be concluded that increasing salinity is associated with decreases in all the studied characters, germination or seedling parameters. Some genotypic differences were spotted among the eight studied cultivars. Although most of them develop comparable behaviors, Karim and Salim have been identified as tolerant, whereas Razeg and Maali have been identified as sensitive. Durum wheat has shown a greater ability to tolerate salinity at the germination stage than at the establishment and early growth stages. These results allows us to suggest that plant growth is more sensitive to salinity stress than seed germination.
IV and SI distinguished the studied cultivars. They are useful traits for screening salinity-tolerant cultivars.
Author Contributions
Conceptualization, M.C. and A.K.; methodology, A.K. and M.C.; software, A.K.; validation, M.H. and A.K.; formal analysis, M.H.; investigation, M.H.; resources, A.K.; data curation, A.K.; writing—original draft preparation, M.H.; writing—review and editing, A.K.; visualization, A.K.; supervision, A.K. and M.C.; project administration, A.K.; funding acquisition, A.K. All authors have read and agreed to the published version of the manuscript.
Funding
This study was supported by the Ministry of Higher Education and Scientific Research of Tunisia through the research Project DiVicia: Use and management of Vicia species for sustainability and resilience in biodiversity-based farming systems funded by PRIMA (Partnership for Research and Innovation in the Mediterranean Area).
Data Availability Statement
Not applicable.
Conflicts of Interest
The authors declare no conflict of interest.
References
- Kopittke, P.M.; Menzies, N.W.; Wang, P.; Mckenna, B.A.; Lombi, E. Soil and the intensification of agriculture for global food security. Environ. Int. 2019, 132, 105078. [Google Scholar] [CrossRef] [PubMed]
- Munns, R.; Tester, M. Mechanisms of salinity tolerance. Annu. Rev. Plant Biol. 2008, 59, 651–681. [Google Scholar] [CrossRef]
- Alzahrani, O.; Abouseadaa, H.; Abdelmoneim, T.K.; Alshehri, M.A.; Elmogy, M.M.; El-Beltagi, H.S.; Atia, M.A.M. Agronomical, physiological and molecular evaluation reveals superior salt-tolerance in bread wheat through salt-induced priming approach. Not. Bot. Horti Agrobot. Cluj-Napoca 2021, 49, 12310. [Google Scholar] [CrossRef]
- Lachhab, I.; Louahlia, S.; Laamarti, M.; Hammani, K. Effect of salt stress on germination and enzyme activity in two genotypes of Medicago sativa. Int. J. Appl. Psychoanal. Stud. 2013, 3, 511–516. [Google Scholar]
- Qadir, M.; Qureshi, A.S.; Cheraghi, S.A.M. Extent and Characterisation of Salt-Affected Soils in Iran and Strategies for Their Amelioration and Management. Land Degrad. Dev. 2008, 19, 214–227. [Google Scholar] [CrossRef]
- Yang, F.; An, F.; Ma, H.; Wang, Z.; Zhou, X.; Liu, Z. Variations on Soil Salinity and Sodicity and Its Driving Factors Analysis under Microtopography in Different Hydrological Conditions. Water 2016, 8, 227. [Google Scholar] [CrossRef]
- Patade, V.Y.; Bhargava, S.; Suprasanna, P. Salt and drought tolerance of sugarcane under iso-osmotic salt and water stress: Growth, osmolytes accumulation, and antioxidant defense. J. Plant Interact. 2011, 6, 275–282. [Google Scholar] [CrossRef]
- Rajjou, L.; Duval, M.; Gallardo, K.; Catusse, J.; Bally, J.; Job, C.; Job, D. Seed germination and vigor. Ann. Rev. Plant Biol. 2012, 63, 507–533. [Google Scholar] [CrossRef]
- Baath, G.S.; Shuklaa, M.K.; Boslanda, P.W.; Steinerb, R.L.; Walker, S.J. Irrigation water salinity influences at various growth stages of Capsicum annum. Agric. Water Manag. 2017, 179, 246–253. [Google Scholar] [CrossRef]
- Kachout, S.S.; Ennajah, A.; Mechergui, R.; Mansoura, A.B.; Ouerghi, Z.; Bouraoui, N.K. Effect of Seed Weight and Salinity on the Germination of Garden Orache (Atriplex hortensis L.). Acad. J. Agric. Res. 2016, 4, 404–410. [Google Scholar] [CrossRef]
- Laghmouchi, Y.; Belmehdi, O.; Bouyahiya, A.; Senhaji, N.S.; Abrini, J. Effect of temperature, salt stress and pH on seed germination of medicinal plant Origanum compactum. Biocatal. Agric. Biotechnol. 2017, 10, 156–160. [Google Scholar] [CrossRef]
- Bouzidi, A.; Chaieb, M.; Krouma, A. Physiological Studies on Sulla carnosa Growth, Ionic Compartmentation and Oxidative Stress under Salt Stress. Russ. J. Plant Physiol. 2022, 69, 34. [Google Scholar] [CrossRef]
- Liu, J.; Wu, Y.; Dong, G.; Zhu, G.; Zhou, G. Progress of Research on the Physiology and Molecular Regulation of Sorghum Growth under Salt Stress by Gibberellin. Int. J. Mol. Sci. 2023, 24, 6777. [Google Scholar] [CrossRef] [PubMed]
- Pastuszak, J.; Dziurka, M.; Hornyák, M.; Szczerba, A.; Kopec, P.; Płazek, A. Physiological and Biochemical Parameters of Salinity Resistance of Three Durum Wheat Genotypes. Int. J. Mol. Sci. 2022, 23, 8397. [Google Scholar] [CrossRef] [PubMed]
- Mwando, E.; Han, Y.; Angessa, T.T.; Zhou, G.; Hill, C.B.; Zhang, X.Q.; Li, C. Genome-wide association study of salinity tolerance during germination in barley (Hordeum vulgare L.). Front. Plant Sci. 2020, 11, 118. [Google Scholar] [CrossRef] [PubMed]
- Ibrahim, E.A. Seed priming to alleviate salinity stress in germinating seeds. J. Plant Physiol. 2016, 192, 38–46. [Google Scholar] [CrossRef]
- Bouzidi, A.; Krouma, A.; Chaieb, M. Chemical seed priming alleviates salinity stress and improves Sulla carnosa germination in the saline depression of Tunisia. Plant Direct 2021, 5, e357. [Google Scholar] [CrossRef]
- Daszkowska-Golec, A. Arabidopsis seed germination under abiotic stress as a concert of action of phytohormones. OMICS J. Integr. Biol. 2011, 15, 763–774. [Google Scholar] [CrossRef]
- Yadav, T.; Kumar, A.; Yadav, R.; Yadav, G.; Kumar, R.; Kushwaha, M. Salicylic acid and thiourea mitigate the salinity and drought stress on physiological traits governing yield in pearl millet-wheat. Saudi J. Biol. Sci. 2020, 27, 2010–2017. [Google Scholar] [CrossRef]
- Parida, A.K.; Das, A.B. Salt tolerance and salinity effects on plants: A review. Ecotoxicol. Environ. Saf. 2005, 60, 324–349. [Google Scholar] [CrossRef]
- Hachicha, M. Les sols salés et leur mise en valeur en Tunisie. Sécheresse 2007, 18, 45–50. [Google Scholar]
- Mrani Alaoui, M.; El Jourmi, L.; Ouarzane, A.Z.; Lazar, S.; El Antri, S.; Zahouily, M.; Hmyene, A. Effet du stress salin sur la germination et la croissance de six variétés marocaines de blé (Effect of salt stress on germination and growth of six Moroccan wheat varieties). J. Mater. Environ. Sci. 2013, 4, 997–1004. [Google Scholar]
- Mbarki, S.; Skalicky, M.; Vachova, P.; Hajihashemi, S.; Jouini, L.; Zivcak, M.; Tlustos, P.; Brestic, M.; Hejnak, V.; Khelil, A.Z. Comparing Salt Tolerance at Seedling and Germination Stages in Local Populations of Medicago ciliaris L. to Medicago intertexta L. and Medicago scutellata L. Plants 2020, 9, 526. [Google Scholar] [CrossRef]
- Amundson, R.; Berhe, A.A.; Hopmans, J.W.; Olson, C.; Sztein, A.E.; Sparks, D.L. Soil and human security in the 21st century. Science 2015, 348, 1261071. [Google Scholar] [CrossRef] [PubMed]
- Hamrouni, L.; Hanana, M.; Abdelly, C.; Ghorbel, A. Exclusion du chlorure et inclusion du sodium: Deux mécanismes concomitants de toléranceà la salinité chez la vigne sauvage Vitis vinifera subsp. Sylvestris (var. ‘Séjnène’). Biotechnol. Agron. Soc. Environ. 2011, 15, 387–400. [Google Scholar]
- Farzadfar, S.; Zarinkamar, F.; Hojati, M. Magnesium and manganese affect photosynthesis, essential oil composition and phenolic compounds of Tanacetum parthenium. Plant Physiol. Biochem. 2017, 112, 207–217. [Google Scholar] [CrossRef]
- Brenchley, J.L.; Probert, R.J. Seed germination responses to some environmental factors in the seagrass Zostera capricorni from eastern Australia. Aquat. Bot. 1998, 62, 177–188. [Google Scholar] [CrossRef]
- Osborne, J.M.; Fox, J.E.D.; Mercer, S. Germination response under elevated salinities of six semi-arid blue bush species (Western Australia). In Towards the Rational Use of High Salinity Plants; Lieth, H., Al Masoom, A., Eds.; Springer: Berlin/Heidelberg, Germany, 1993; Volume 1, pp. 323–338. [Google Scholar]
- Gulzar, S.; Khan, M.A. Seed germination of a halophytic grass Aeluropus lagopoides. Ann. Bot. 2001, 87, 319–324. [Google Scholar] [CrossRef]
- Ansari, S.A.; Hussain, Q. Potential applications of enzymes immobilized on/in nano materials: A review. Biotechnol. Adv. 2012, 30, 512–523. [Google Scholar] [CrossRef]
- Thiam, M.; Champion, A.; Diouf, D.; Ourèye Sy, M. NaCl effects on in vitro germination and growth of some Senegalese cowpea (Vigna unguiculata L.) Walp. Cultivars. ISRN Biotechnol. 2013, 2013, 382417. [Google Scholar] [CrossRef]
- Kandil, A.A.; Sharief, A.E.; Abido, W.A.E.; Ibrahim, M.M. Effect of salinity on seed germination and seedling characters of some forage sorghum cultivars. Int. J. Agric. Sci. 2012, 4, 306–311. [Google Scholar]
- Sima, N.; Ahmad, S.T.; Pessarakli, M. Comparative study of different salts (sodium chloride, sodium sulfate, potassium chloride, and potassium sulfate) on growth of forage species. J. Plant Nutr. 2013, 36, 214–230. [Google Scholar] [CrossRef]
- Murillo-Amador, B.; Troyo-Dieguez, E. Effect of salinity on the germination and seedling growth of cowpea. J. Agric. Crop Res. 2000, 188, 235–247. [Google Scholar] [CrossRef]
- Maas, E.V.; Poss, J.A. Salt sensitivity of cowpea at various growth stages. Irrig. Sci. 1989, 10, 313–320. [Google Scholar] [CrossRef]
- Neamatollahi, E.; Bannayan, M. Does Hydro and Osmo-Priming Improve Fennel (Foeniculum vulgare) Seeds Germination and Seedlings Growth. Not. Bot. Horti Agrobot. Cluj-Napoca 2009, 37, 190–194. [Google Scholar]
- Yildirim, E.; Guvenc, I. Salt Tolerance of Pepper Cultivars during Germination and Seedling Growth. Turk. J. Agric. For. 2006, 30, 347–353. [Google Scholar]
- Grattan, S.R.; Grieve, C.M. Salinity-mineral nutrient relations in horticultural crop. Sci. Hortic. 1999, 78, 127–157. [Google Scholar] [CrossRef]
- Tahjib-Ul-Arif, M.; Siddique, M.N.; Sohag, A.A.M.; Sakil, M.A.; Rahman, M.M.; Polash, M.A.S.; Tran, L.S.P. Salicylic acid-mediated enhancement of photosynthesis attributes and antioxidant capacity contributes to yield improvement of maize plants under salt stress. J. Plant Growth Regul. 2018, 37, 1318–1330. [Google Scholar] [CrossRef]
- Bhattarai, S.; Lundell, S.; Biligetu, B. Effect of Sodium Chloride Salt on Germination, Growth, and Elemental Composition of Alfalfa Cultivars with Different Tolerances to Salinity. Agronomy 2022, 12, 2516. [Google Scholar] [CrossRef]
- Chauhan, R.R.; Chaudhry, R.; Singh, A.; Singh, P.K. Salt tolerance of Sorghum bicolor cultivars during germination and seedling growth. Res. J. Recent Sci. 2012, 2277, 2502. [Google Scholar]
- Krishnamurthy, L.; Serraj, R.; Tom Hash, C.; Dakheel, A.J.; Reddy, B.V.S. Screening sorghum genotypes for salinity tolerant biomass production. Euphytica 2007, 156, 15–24. [Google Scholar] [CrossRef]
- Munns, R.; James, R.A.; Lauchli, A. Approaches to increasing the salt tolerance of wheat and other cereals. J. Exp. Bot. 2006, 57, 1025–1043. [Google Scholar] [CrossRef]
- Taghvaei, M.; Nasrolahizadehi, A.; Mastinu, A. Effect of Light, Temperature, Salinity, and Halopriming on Seed Germination and Seedling Growth of Hibiscus sabdariffa under Salinity Stress. Agronomy 2022, 12, 2491. [Google Scholar] [CrossRef]
- Salim, N.; Raza, A. Nutrient use efficiency (NUE) for sustainable wheat production: A review. J. Plant Nutr. 2020, 43, 297–315. [Google Scholar] [CrossRef]
- Zulfiqar, A.; Khan, D.; Ahmed, N. Salt tolerance of three sorghum cultivars during germination and early seedling growth. Int. J. Biol. Biotech. 2013, 10, 193–202. [Google Scholar]
- Ayers, A.D.; Hayward, H.E. A method for measuring the effects of soil salinity on seed germination with observations on several crop plants. Soil Sci. Soc. Am. J. 1948, 13, 224–226. [Google Scholar] [CrossRef]
- Azizov, A.A. Effect of salt concentration on germination of Meyer-sea-lavender seeds. Uzb. Biol. Zh. 1974, 18, 22–24. [Google Scholar]
- Ungar, I.A. Salinity, temperature, and growth regulator effects on seed germination of Salicornia europaea L. Aquat. Bot. 1977, 3, 329–335. [Google Scholar] [CrossRef]
- Mahmood, K.; Malik, K.I. Studies on salt tolerance of Atriplex undulata. In Prospects of Biosaline Research, Proceedings of the US-Pakistan Biosaline Research Workshop; Qureshi, R.H. (University of Agriculture, Faisalabad (Pakistan)); Ahmad, R., Pietro, A.S., Eds.; Department of Botany, University of Karachi: Karachi, Pakistan, 1986. [Google Scholar]
Disclaimer/Publisher’s Note: The statements, opinions and data contained in all publications are solely those of the individual author(s) and contributor(s) and not of MDPI and/or the editor(s). MDPI and/or the editor(s) disclaim responsibility for any injury to people or property resulting from any ideas, methods, instructions or products referred to in the content. |
© 2023 by the authors. Licensee MDPI, Basel, Switzerland. This article is an open access article distributed under the terms and conditions of the Creative Commons Attribution (CC BY) license (https://creativecommons.org/licenses/by/4.0/).