Article

Influence of Structure and Texture Feature on Retrieval of Ramie Leaf Area Index

College of Agriculture, Hunan Agricultural University, Changsha 410128, China
*
Author to whom correspondence should be addressed.
Agronomy 2023, 13(7), 1690; https://doi.org/10.3390/agronomy13071690
Submission received: 17 May 2023 / Revised: 13 June 2023 / Accepted: 21 June 2023 / Published: 23 June 2023
(This article belongs to the Section Precision and Digital Agriculture)

Abstract

:
Leaf area index (LAI), as one of the important crop field phenotypes, plays a crucial role in evaluating crop growth and yield. The remote sensing method for crop parameters monitoring makes it possible to obtain crop LAI in a large area, efficiently and non-destructively. Fusion of spectral features, structure features, and texture features obtained by remote sensing images can effectively improve LAI estimation performance, but the impact of crop structure and texture feature differences on LAI remote sensing monitoring remains unclear. In this study, ramie was classified according to the differences of canopy structure, and then the LAI inversion performance of ramie was evaluated under different datasets to determine the contribution of structure features (canopy coverage, plant height) and texture features derived from remote sensing images to LAI estimation. Finally, multi-feature remote sensing indexes were integrated to construct the optimal ramie LAI estimation model. The results showed that structure features and texture features had an effect on ramie LAI inversion performance, and there were significant differences in LAI estimation accuracy among different data sets. A single structure feature or texture feature could not significantly optimize LAI inversion performance, while multi-feature fusion could effectively improve LAI estimation accuracy (R2 = 0.776, RMSE = 0.740). This study provides a robust, practical, and low-cost method for ramie LAI estimation, and provides a reference for crop LAI inversion research based on structural features and texture features.

1. Introduction

As a fiber crop, ramie plays an important role in many fields, such as textile [1], medicine [2], ecology [3], and food [4]. In addition, ramie is also a high-protein-quality forage grass; its green stems, leaves, and other nutrients have high feeding value. Ramie growth monitoring in the field is required for large-scale production management activities and breeding programs to aid in better management and decision-making. Leaf area index (LAI) is an important phenotypic index to characterize crop growth, nutritional status, and photosynthetic capacity, which is also closely related to the final yield [5,6,7,8]. Therefore, dynamic monitoring of ramie LAI in the field is of great importance.
At present, the widely used LAI measurement methods include direct methods and indirect methods [9]. The direct methods require destructive sampling and returning the sample to the laboratory for measurement. Although this method is accurate and objective, it has the disadvantages of being both time and labor consuming [10]. Indirect methods using optical measurements, such as the LAI-2200C plant canopy analyzer(LI-COR, Lincoln, NE, USA), can provide non-destructive measurements, but this instrument is expensive and does not meet the needs of large-scale, high-frequency LAI measurements. The development of remote sensing technology provides a low-cost, efficient, and accurate solution for the LAI acquisition of crops; moreover, the remote sensing method has the advantages of being time-saving, effort-saving, non-destructive, and objective, and has been gradually applied in the LAI monitoring of many crops such as wheat [11], soybean [12], rice [13,14], and rape [15].
At present, there are two main methods for crop LAI estimation based on remote sensing technology: the empirical statistical model (ESMs) and radiative transfer models (RTMs). ESM approaches obtain spectral characteristics of the crop canopy through a variety of remote sensing platforms, such as unmanned aerial vehicle (UAV) and satellites, and then retrieves LAI by constructing the relationship model between spectral bands, vegetation index (VIs), spectral transform values, and LAI [16,17,18]. ESM approaches are simple and widely used. For example, Shao et al. [19] found that the multispectral VIs collected by the UAV remote sensing system can be used to monitor maize LAI during the whole growth period, with an accuracy of 0.74. Sun et al. [20] found that the improved VIs based on multispectral red-edge channel had a great correlation with winter wheat LAI, and the R2 between the estimated LAI and the observed LAI was 0.82. RTM approaches establish the relationship between leaf optical properties (reflectance and transmittance) and crop LAI by simulating the photon radiation transfer process at leaf scale. Common RTMs include PROSPECT [21] and LIBERTY. Compared with ESMs, RTM approaches are more complex, the model construction requires a large number of parameters, and the calculation time is longer. Mananze et al. [22] tested the applicability of ESMs and RETs, and the results showed that both methods had good performance in the maize LAI estimation research.
Machine learning (ML) has been widely used in crop physical and chemical index estimation because of its ability to deal with the strong nonlinear relationship between crop index and remote sensing characteristics. Common ML algorithms include support vector machines (SVM), partial least squares regression (PLSR), random forests (RF), etc. For example, Tunrayo et al. [23] found that RF could better estimate soybean yield, and Amarasingam et al. [24] believed that an ML algorithm was a feasible means to estimate the chlorophyll content of sugarcane. In crop LAI estimation based on remote sensing technology, spectral characteristic is an important parameter for crop LAI inversion in both ESMs and RTMs. However, when the crop canopy coverage is large, VIs are prone to saturation, leading to lower accuracy in LAI estimation [25]. To solve this problem, many scholars introduced additional information such as plant height (PH) [26,27], canopy coverage (CC), and texture features (TF) [28] to weaken the effect of spectral saturation and to improve the accuracy of crop LAI estimation. Hang et al. [29] built a rice LAI estimation model by combining spectral index, TF, and CC. After combining multiple indexes, the accuracy of rice LAI estimation was significantly improved, and the R2 of the model reached 0.87. Tao et al. [30] used VIs and PH as independent variables to estimate LAI, and the accuracy was 0.73. Bo et al. [31] introduced CC correction parameters to improve the performance of a rapeseed LAI inversion model. The above studies indicate that multi-feature fusion can effectively improve the accuracy of LAI estimation, but the existing studies do not discuss the specific contributions of different types of features to crop LAI estimation, and the impact of structure and texture differences on LAI remote sensing monitoring remains unclear.
This study takes ramie as the research object and uses UAV remote sensing to obtain ramie multispectral images. We classified the ramie samples according to the difference of canopy structure derived from remote sensing images, and evaluated the influence of CC, PH, and TF on ramie LAI inversion through different classification datasets. The contribution of structural features and texture features to the estimation of ramie LAI was determined, and the optimal ramie LAI estimation model was constructed by multi-feature data fusion.

2. Materials and Methods

2.1. Study Area

The experiment was conducted from March to May 2023 at the Hunan Agricultural University located in Changsha, Hunan Province, China (28°11′01″ N, 113°04′10″ E). This area has a typical subtropical monsoon humid climate. With abundant precipitation, sufficient light, and heat conditions, the study site is one of the main ramie production areas. In this experiment, 36 ramie varieties were planted with two replicates (a total of 72 plots), and each plot area was about 1.5 m × 1 m, with 2 rows × 3 columns. The material was transplanted in March 2022 and broken at the end of May (Figure 1).

2.2. Data Acquisition and Processing

Data acquisition was carried out five times on 13 March, 26 March, 8 April, 21 April, and 7 May 2023. The ground LAI and UAV multispectral images were collected on the same day.

2.2.1. Ground LAI Acquisition

Ground LAI was obtained using the LAI-2200 canopy analyzer (LI-COR, Lincoln, NE, USA). When used, one sky light in the open space above the crop canopy was measured in each plot, and four target values below the crop canopy were uniformly measured. Finally, the instrument will automatically calculate the average LAI value of each plot, and 72 LAI samples were collected in each collection task. LAI was measured from 8:00 to 11:00 a.m. and after sunset in the afternoon.

2.2.2. UAV Multispectral Data Acquisition and Processing

In this study, the DJI Phantom 4 pro multispectral UAV (DJI Innovation Technology Co., Ltd., Shenzhen, China) was used to acquire multispectral images of the ramie canopy. The Phantom 4 pro integrates one visible light camera and five multispectral cameras, which are responsible for visible light imaging and multispectral imaging in 5 channels (blue light, green light, red light, red edge and near infra-red). In addition, this UAV has a built-in RTK positioning system with a horizontal accuracy of 1 cm + 1 ppm and a vertical accuracy of 1.5 cm + 1 ppm. In order to ensure stable and sufficient solar radiation, each flight operation was selected at 12:00–14:00 local time.
DJI GS Pro (DJI Innovation Technology Co., Ltd., China) was used to automatically generate routes, automatically fly, and automatically shoot and complete relevant data sending and receiving in the designated area. During the planning route and navigation point, we set the overlapping rate on the main course at 80% and the image overlap rate between the main routes at 75%. In the process of aerial photography, the UAV flew 20 m from the ground and the pitch angle of the head was −90°.
The remote sensing image of ramie canopy obtained by UAV requires a series of image preprocessing, including 3D reconstruction, radiometric calibration, geometric correction, etc., which was completed by Pix4dmapper v4.4.12 (Pix4D, Lausanne, Switzerland) software. Two calibration plates with reflectance of 5% and 30% were used for radiometric correction.
PhenoAI air (AgriBrain Co., Ltd., Nanjing, China) was used to extract the multispectral data of each plot, which can automate noise removal and background segmentation of remote sensing images. Then, 48 spectral eigenvalues and 9 texture eigenvalues of the ramie were calculated.

2.3. Model Construction and Evaluation

By mixing all ground LAI obtained from 5 collection tasks, a ramie LAI dataset containing 360 samples was constructed, which was then randomly divided into modeling set and verification set in a ratio of 7:3. For each model, the modeling set and the validation set are consistent.
Linear regression (LR), random forest (RF), supports vector regression (SVR), and partial least squares regression (PLSR) were used to construct ramie LAI estimation models, respectively. Among them, LR is a simple model that combines the concept of naive machine learning modeling and serves as the basis for highly complex linear models. Based on bagging and decision tree, RF further introduces random attribute into decision tree training, which is an improved algorithm for both. RF has the advantages of high prediction accuracy, fast speed, less overfitting, and better anti-noise ability. SVR is a small sample learning method with solid theoretical basis. Based on the principle of maximum interval, SVR can select different kernel functions according to different problems, which has good robustness and generalization ability. PLSR inherits the ideas of multiple linear regression analysis, canonical correlation analysis, and principal component analysis. PLSR finds the best function matching of a set of data by minimizing the sum of squares of errors and has many advantages such as less variable constraints and less noise interference.
In the modeling process, the GridSearch method was used to find the best parameters of different models, the 5-fold cross-validation method was used to evaluate the models, and the recursive feature elimination (RFE) method was used to screen the eigenvalues related to the target variables. RFE runs through the whole process of model training and can constantly remove features with small weight coefficients based on the training effect of each round of the model, so as to screen out the best feature set. R2 and root mean square error (RMSE) were used as regression model evaluation indexes to analyze the accuracy of different algorithm models. The higher R2, the lower RMSE, indicating a higher model fitting accuracy.

3. Results

3.1. Effect of Canopy Coverage on Ramie LAI Inversion

3.1.1. Difference Analysis of LAI in Different Canopy Coverage Datasets

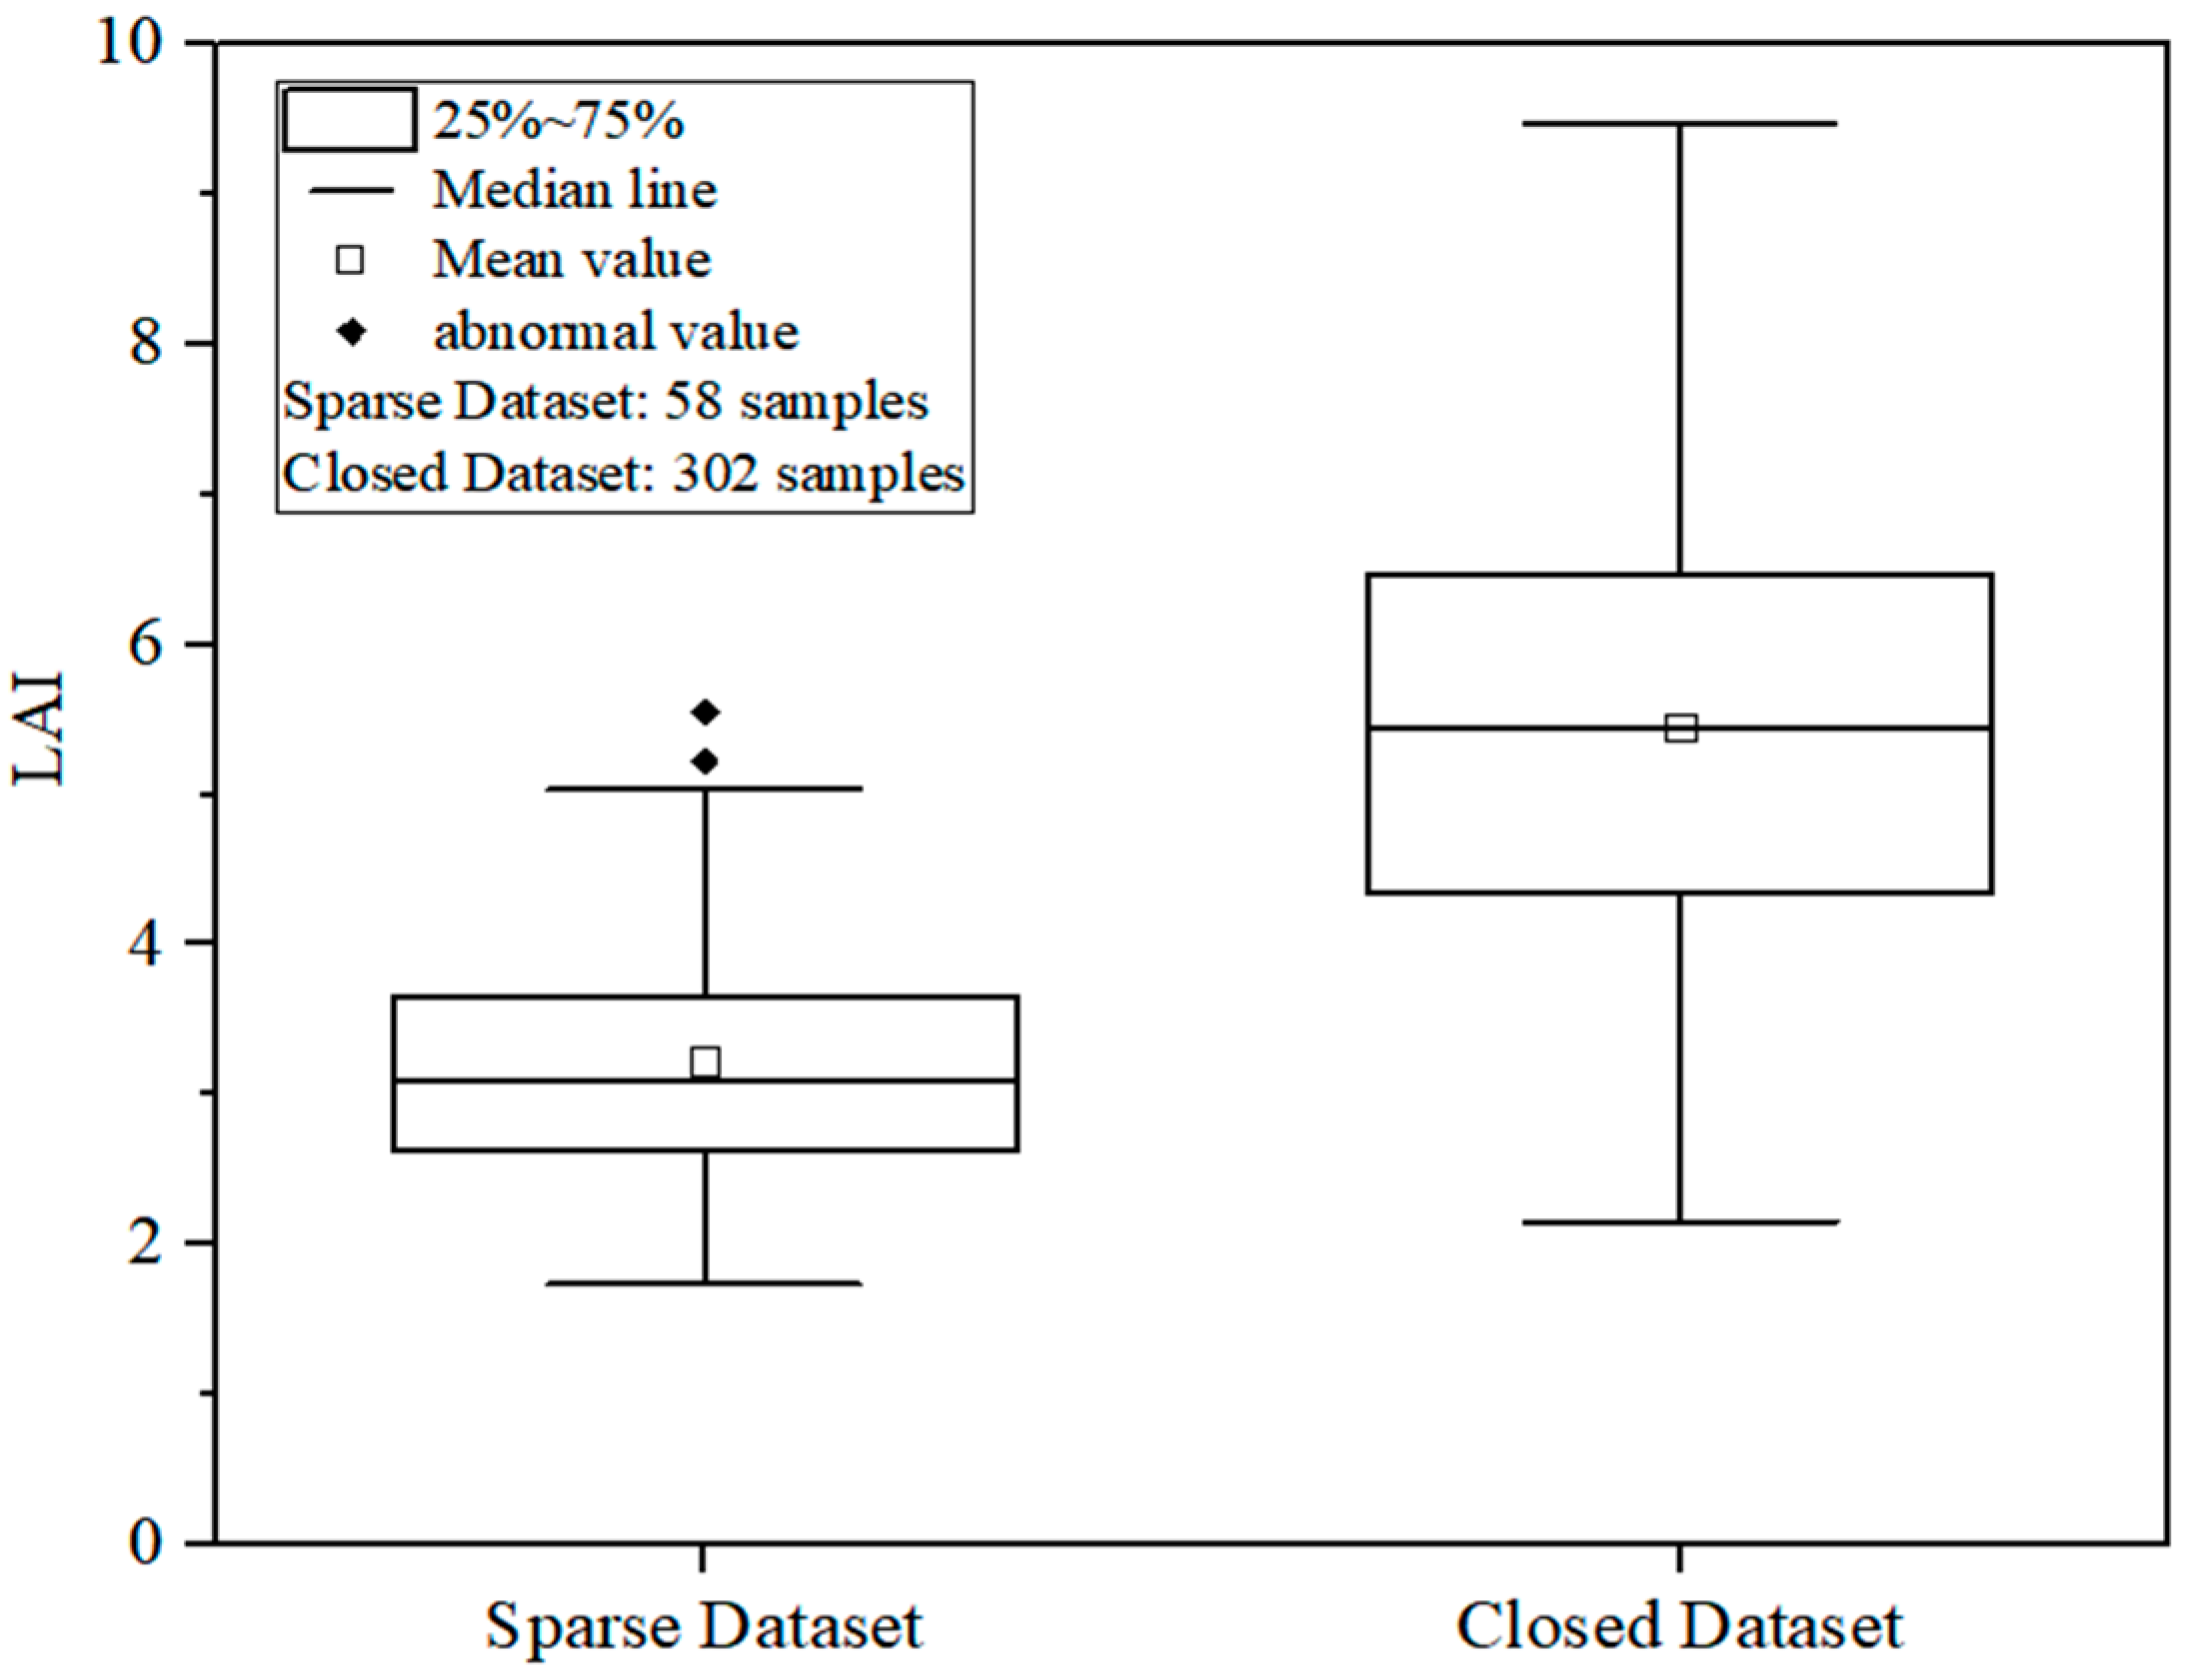
The 360 ramie samples were divided into sparse canopy structure dataset (“Sparse Dataset”) and closed canopy structure dataset (“Closed Dataset”) according to canopy coverage (CC) to investigate the effects of different CC on the ramie LAI inversion performance. Samples with CC less than 80% were assigned to the sparse dataset, which contained 58 samples. Samples with CC more than 80% belong to the closed dataset, which contained 302 samples. Figure 2 analyzed the differences of ramie LAI in different CC datasets. With the increase of CC, ramie LAI increased significantly. The mean LAI increased from 3.227 to 5.448. Pearson correlation analysis results of CC and LAI in different datasets showed that there was a good correlation between ramie LAI and CC (Figure 3). In the sparse dataset, the correlation coefficient reached 0.4, and in the closed dataset, the correlation coefficient was 0.418.

3.1.2. LAI Inversion Performance in Different Canopy Coverage Dataset

To explain the influence of CC on ramie LAI inversion, two datasets were separately used to test the performance of the LAI estimation model. We randomly selected 58 samples from two datasets for modeling to avoid errors caused by inconsistent sample amounts, where CV represents the coefficient of variation. CV can reflect the degree of difference of a series of data (Table 1). As can be seen from Figure 4, LAI estimation accuracy was different in two CC datasets. The effect of LAI inversion using the “Sparse Dataset” was poor (R2 = 0.444, RMSE = 0.711), and LAI was underestimated. Compared with the results of the “Sparse Dataset”, the inversion performance of the “Closed Dataset” was higher, R2 was improved by 32.658%, and RMSE was reduced by 15.612%. The difference between the two datasets indicated that CC affects LAI inversion performance.
We introduced CC as a model variable to further determine whether CC would have a positive effect on ramie LAI inversion (Figure 4). In all datasets, the introduction of CC improved the accuracy of LAI estimation, but the correction effect was not significant. In summary, CC is an important index affecting the accuracy of LAI estimation. When the canopy coverage is low, LAI is more likely to be affected by soil reflectance, resulting in low accuracy of LAI estimation. However, the introduction of CC alone cannot offset the effect of removing soil background on average reflectance.

3.2. Effect of Plant Height on Ramie LAI Inversion

3.2.1. Difference Analysis of LAI in Different Plant Height Datasets

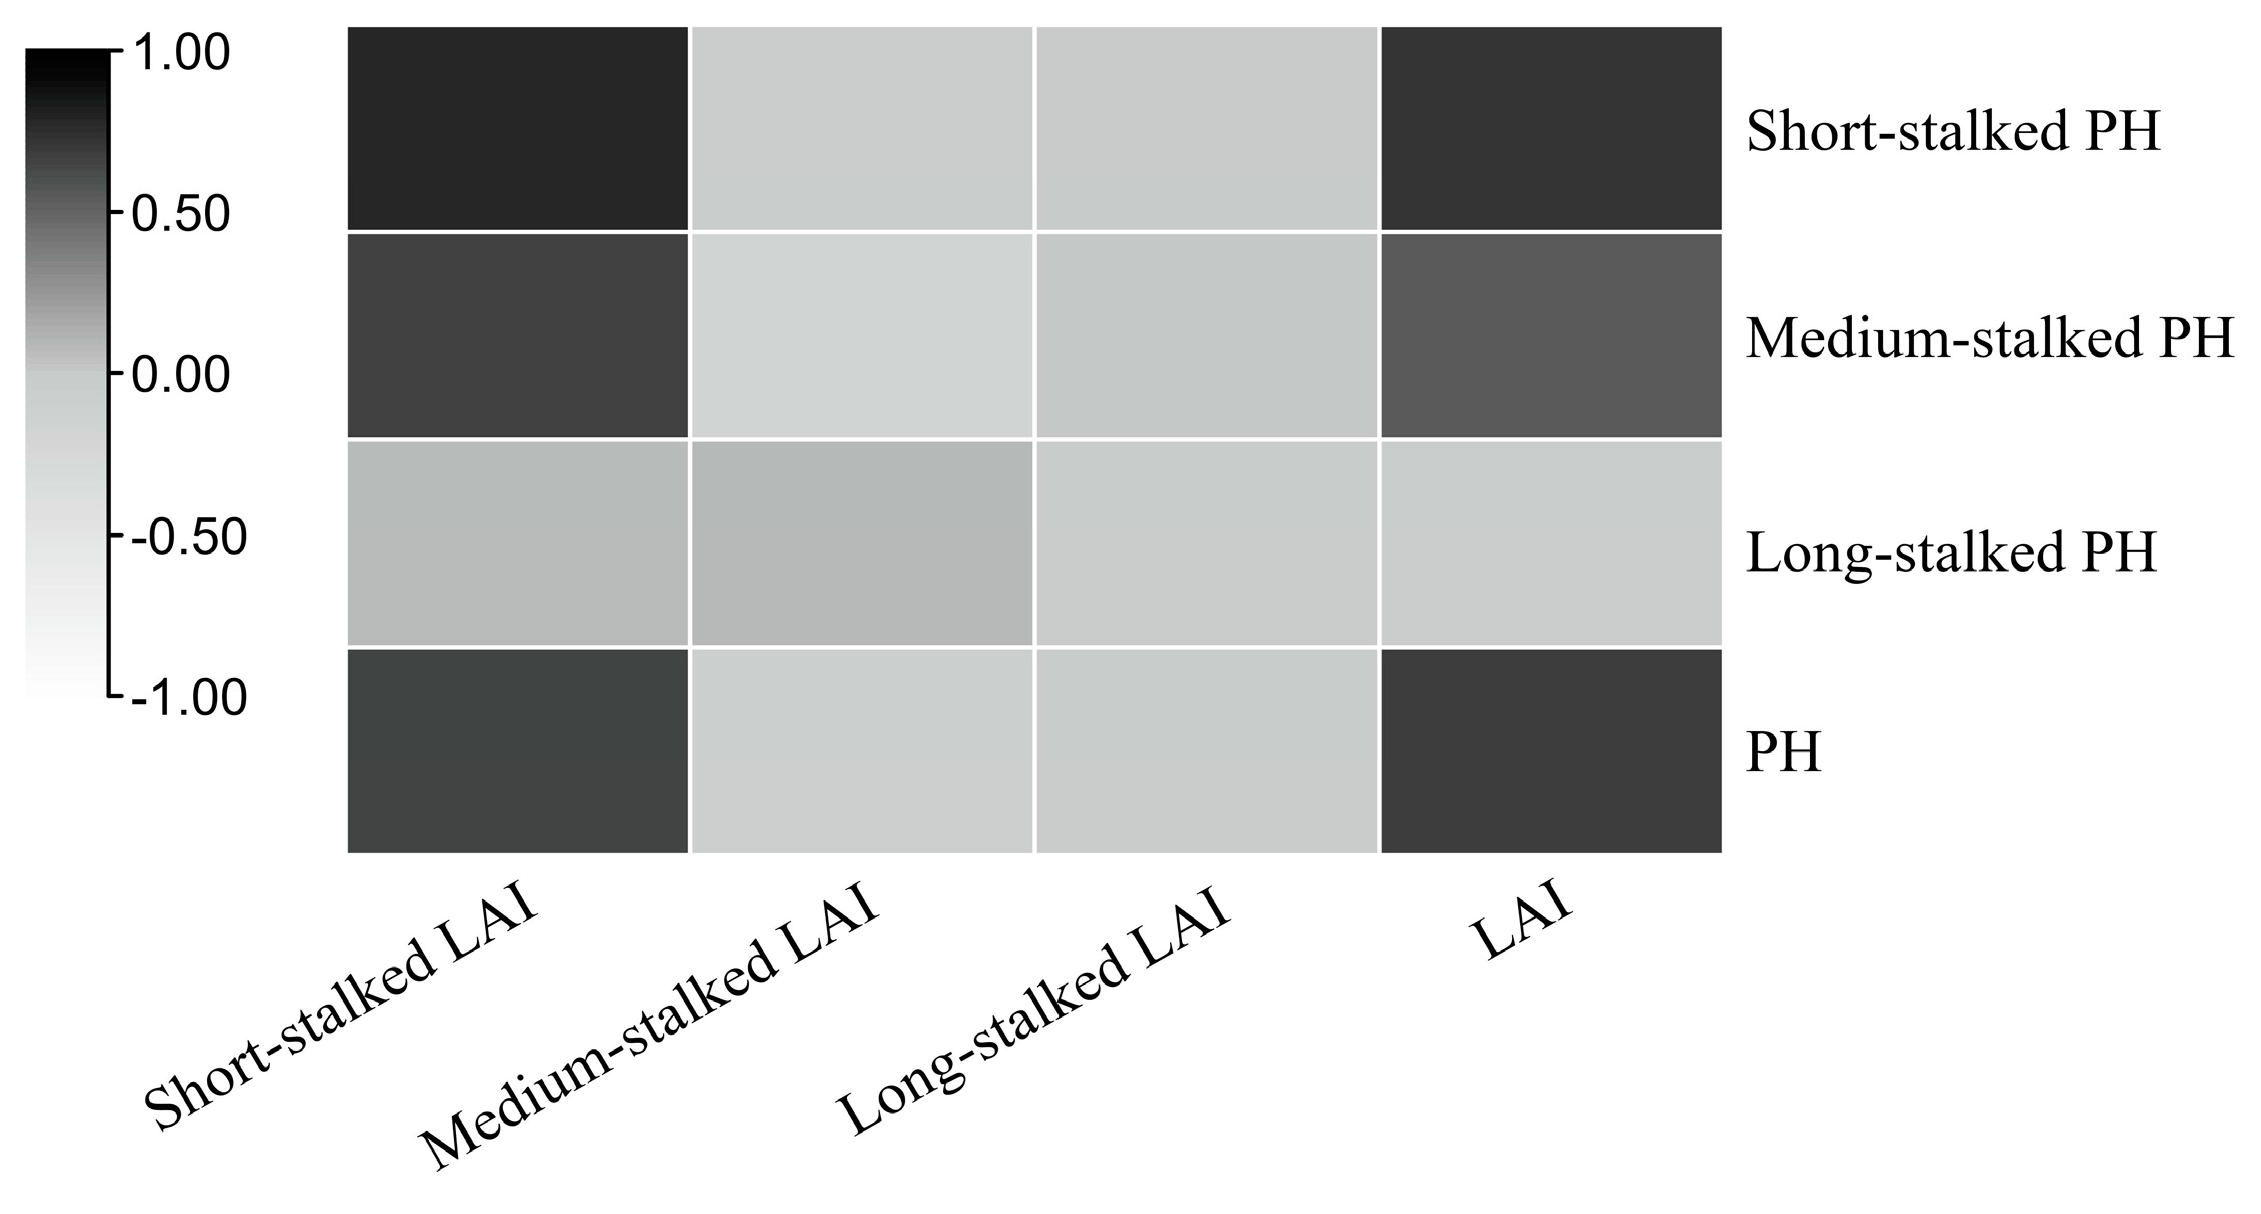
The ramie samples were classified according to plant height (PH). Ramie height below 100 cm, between 100~200 cm, and above 200 cm were defined as “Short-stalked”, “Medium-stalked”, and “Long-stalked”, and the sample number of each dataset were 168, 152, and 40, respectively. Figure 5 shows the statistics of ramie LAI in different PH datasets. With the increase of PH, ramie LAI increased significantly, and the mean values were 4.012, 5.959, and 6.312, respectively. There were significant differences in LAI between short-stalked ramie and medium-long-stalked ramie, indicating that PH was one of the key components of ramie LAI, especially in the ramie early growth stage or when ramie height is below 100 cm. When ramie plants grew to a certain height, the influence of PH on LAI was reduced; the LAI range of long-stalked ramie was consistent with that of medium-stalked ramie. The correlation between PH and LAI in different datasets was analyzed (Figure 6). The correlation between PH and LAI was very significant for short-stalked ramie, with a correlation coefficient of 0.789. However, the correlation between PH and medium-long-stalked ramie LAI was weak.

3.2.2. LAI Inversion Performance in Different Plant Height Dataset

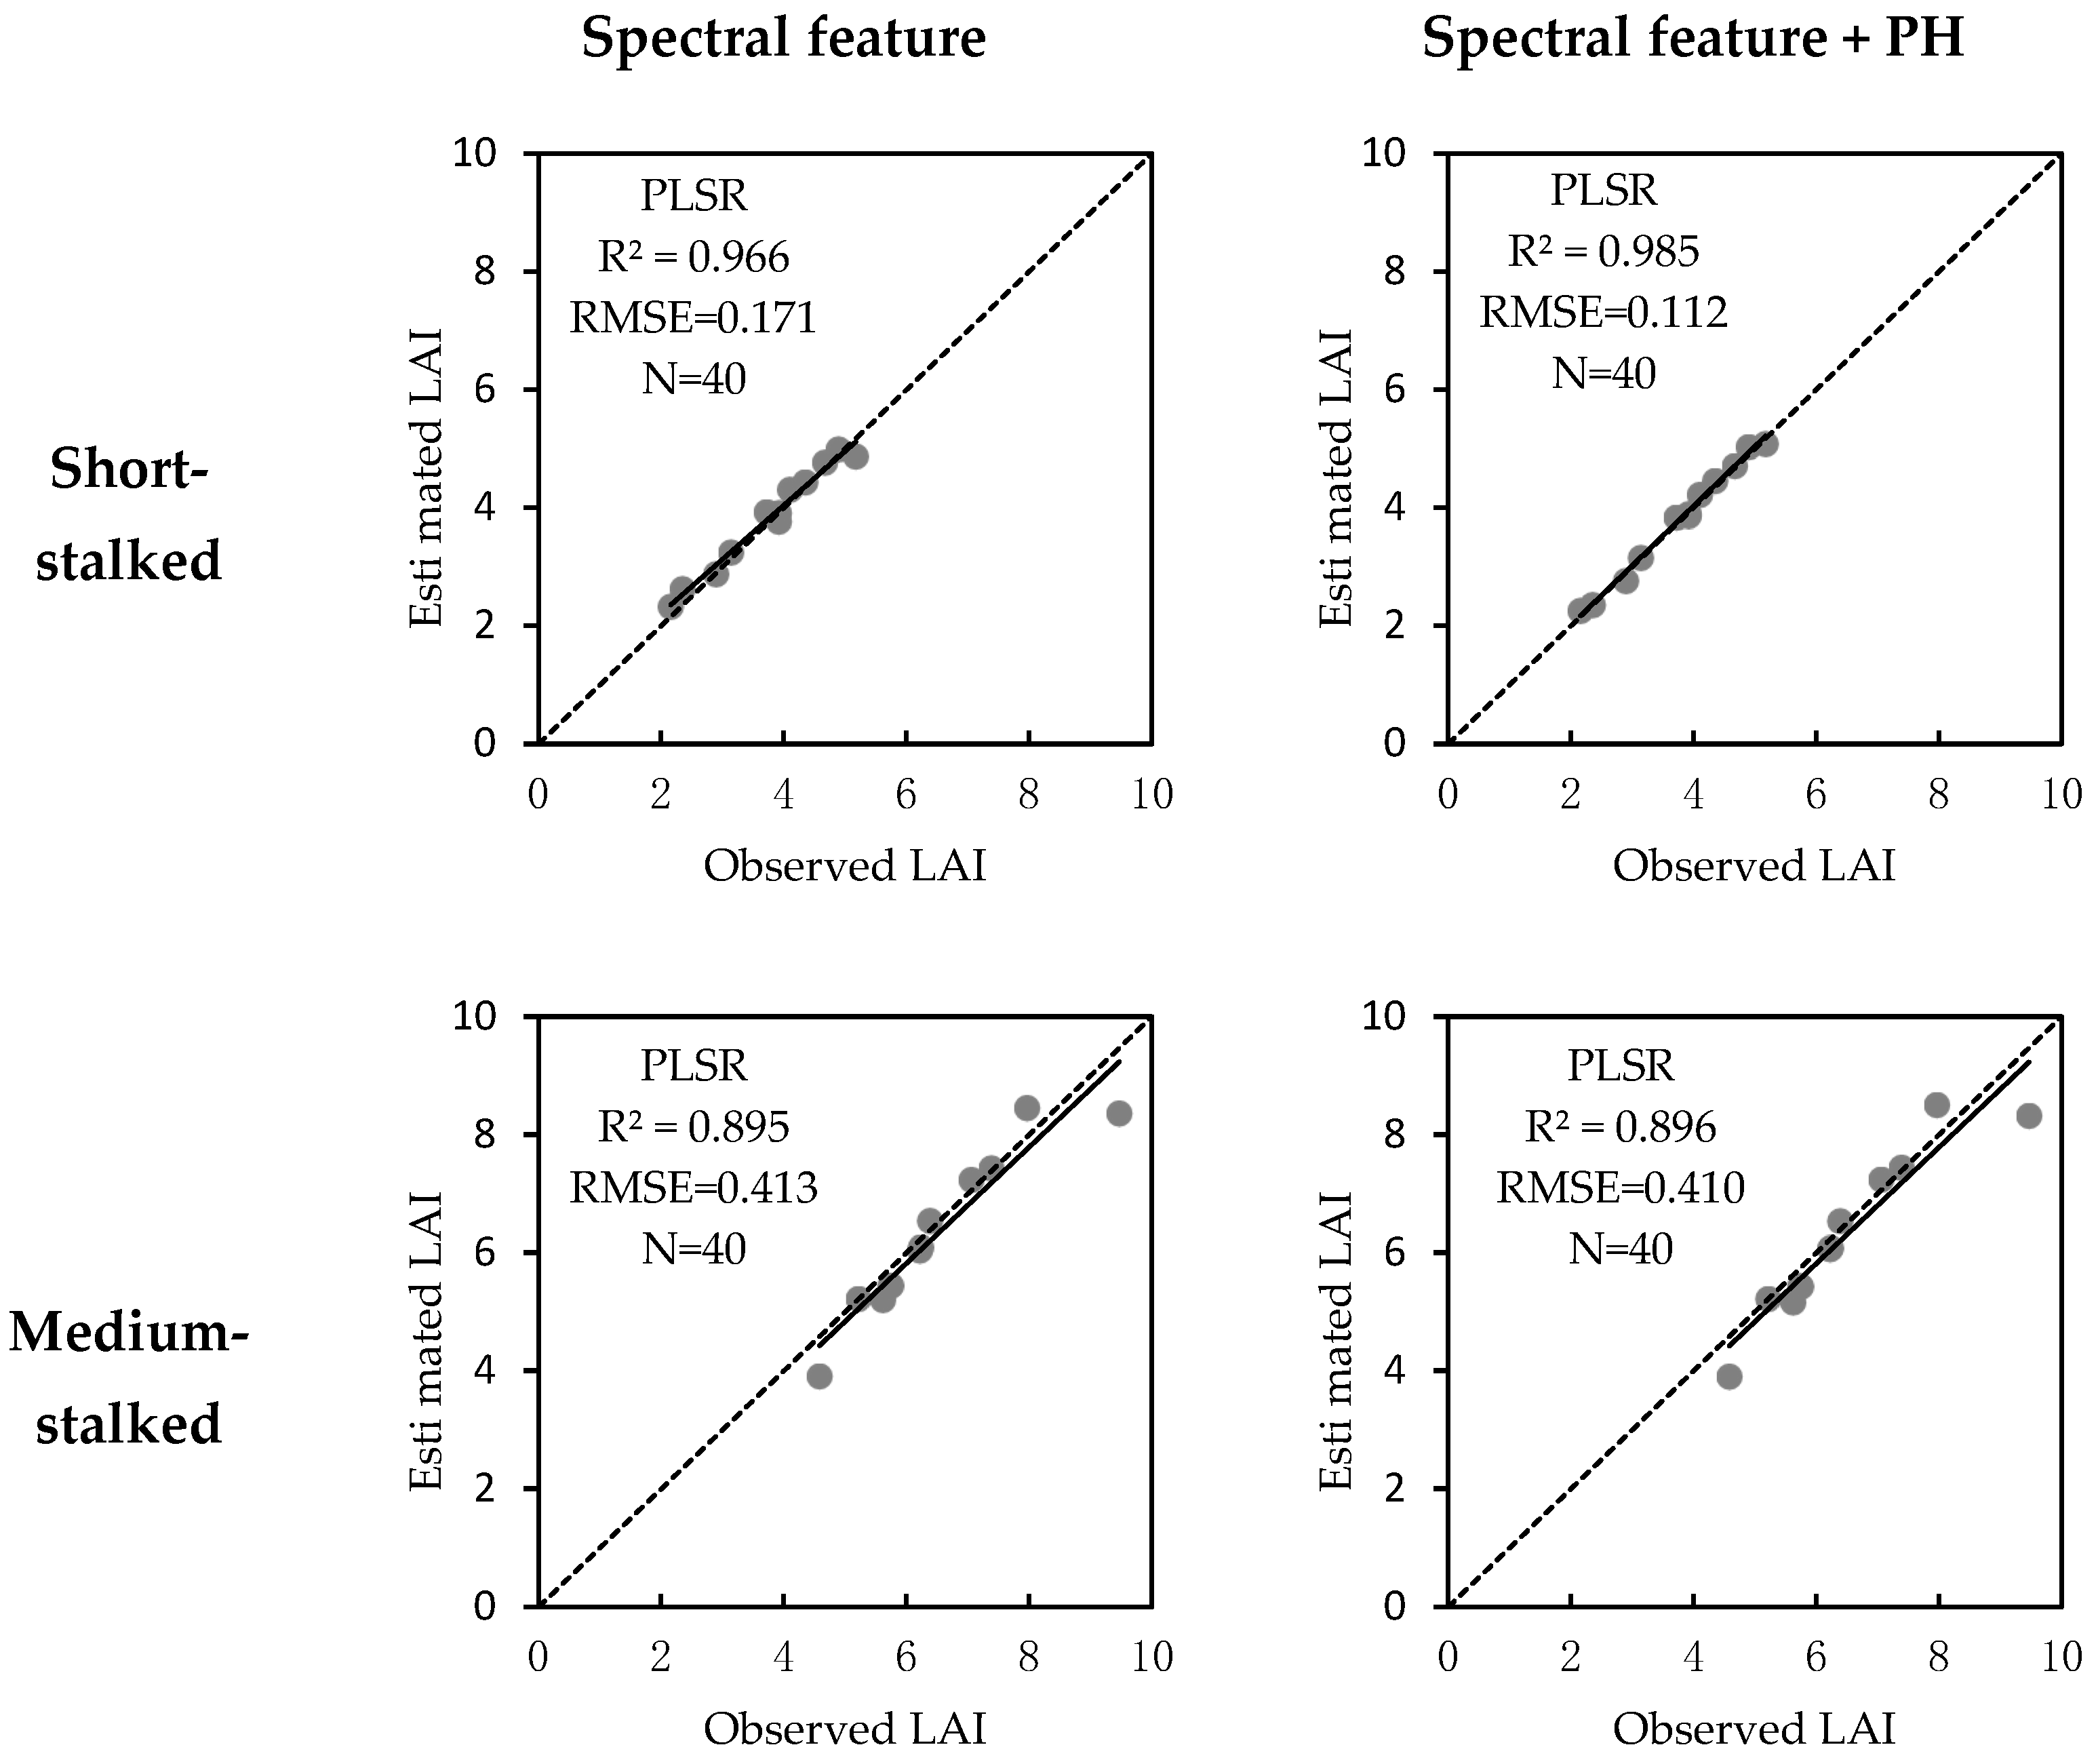
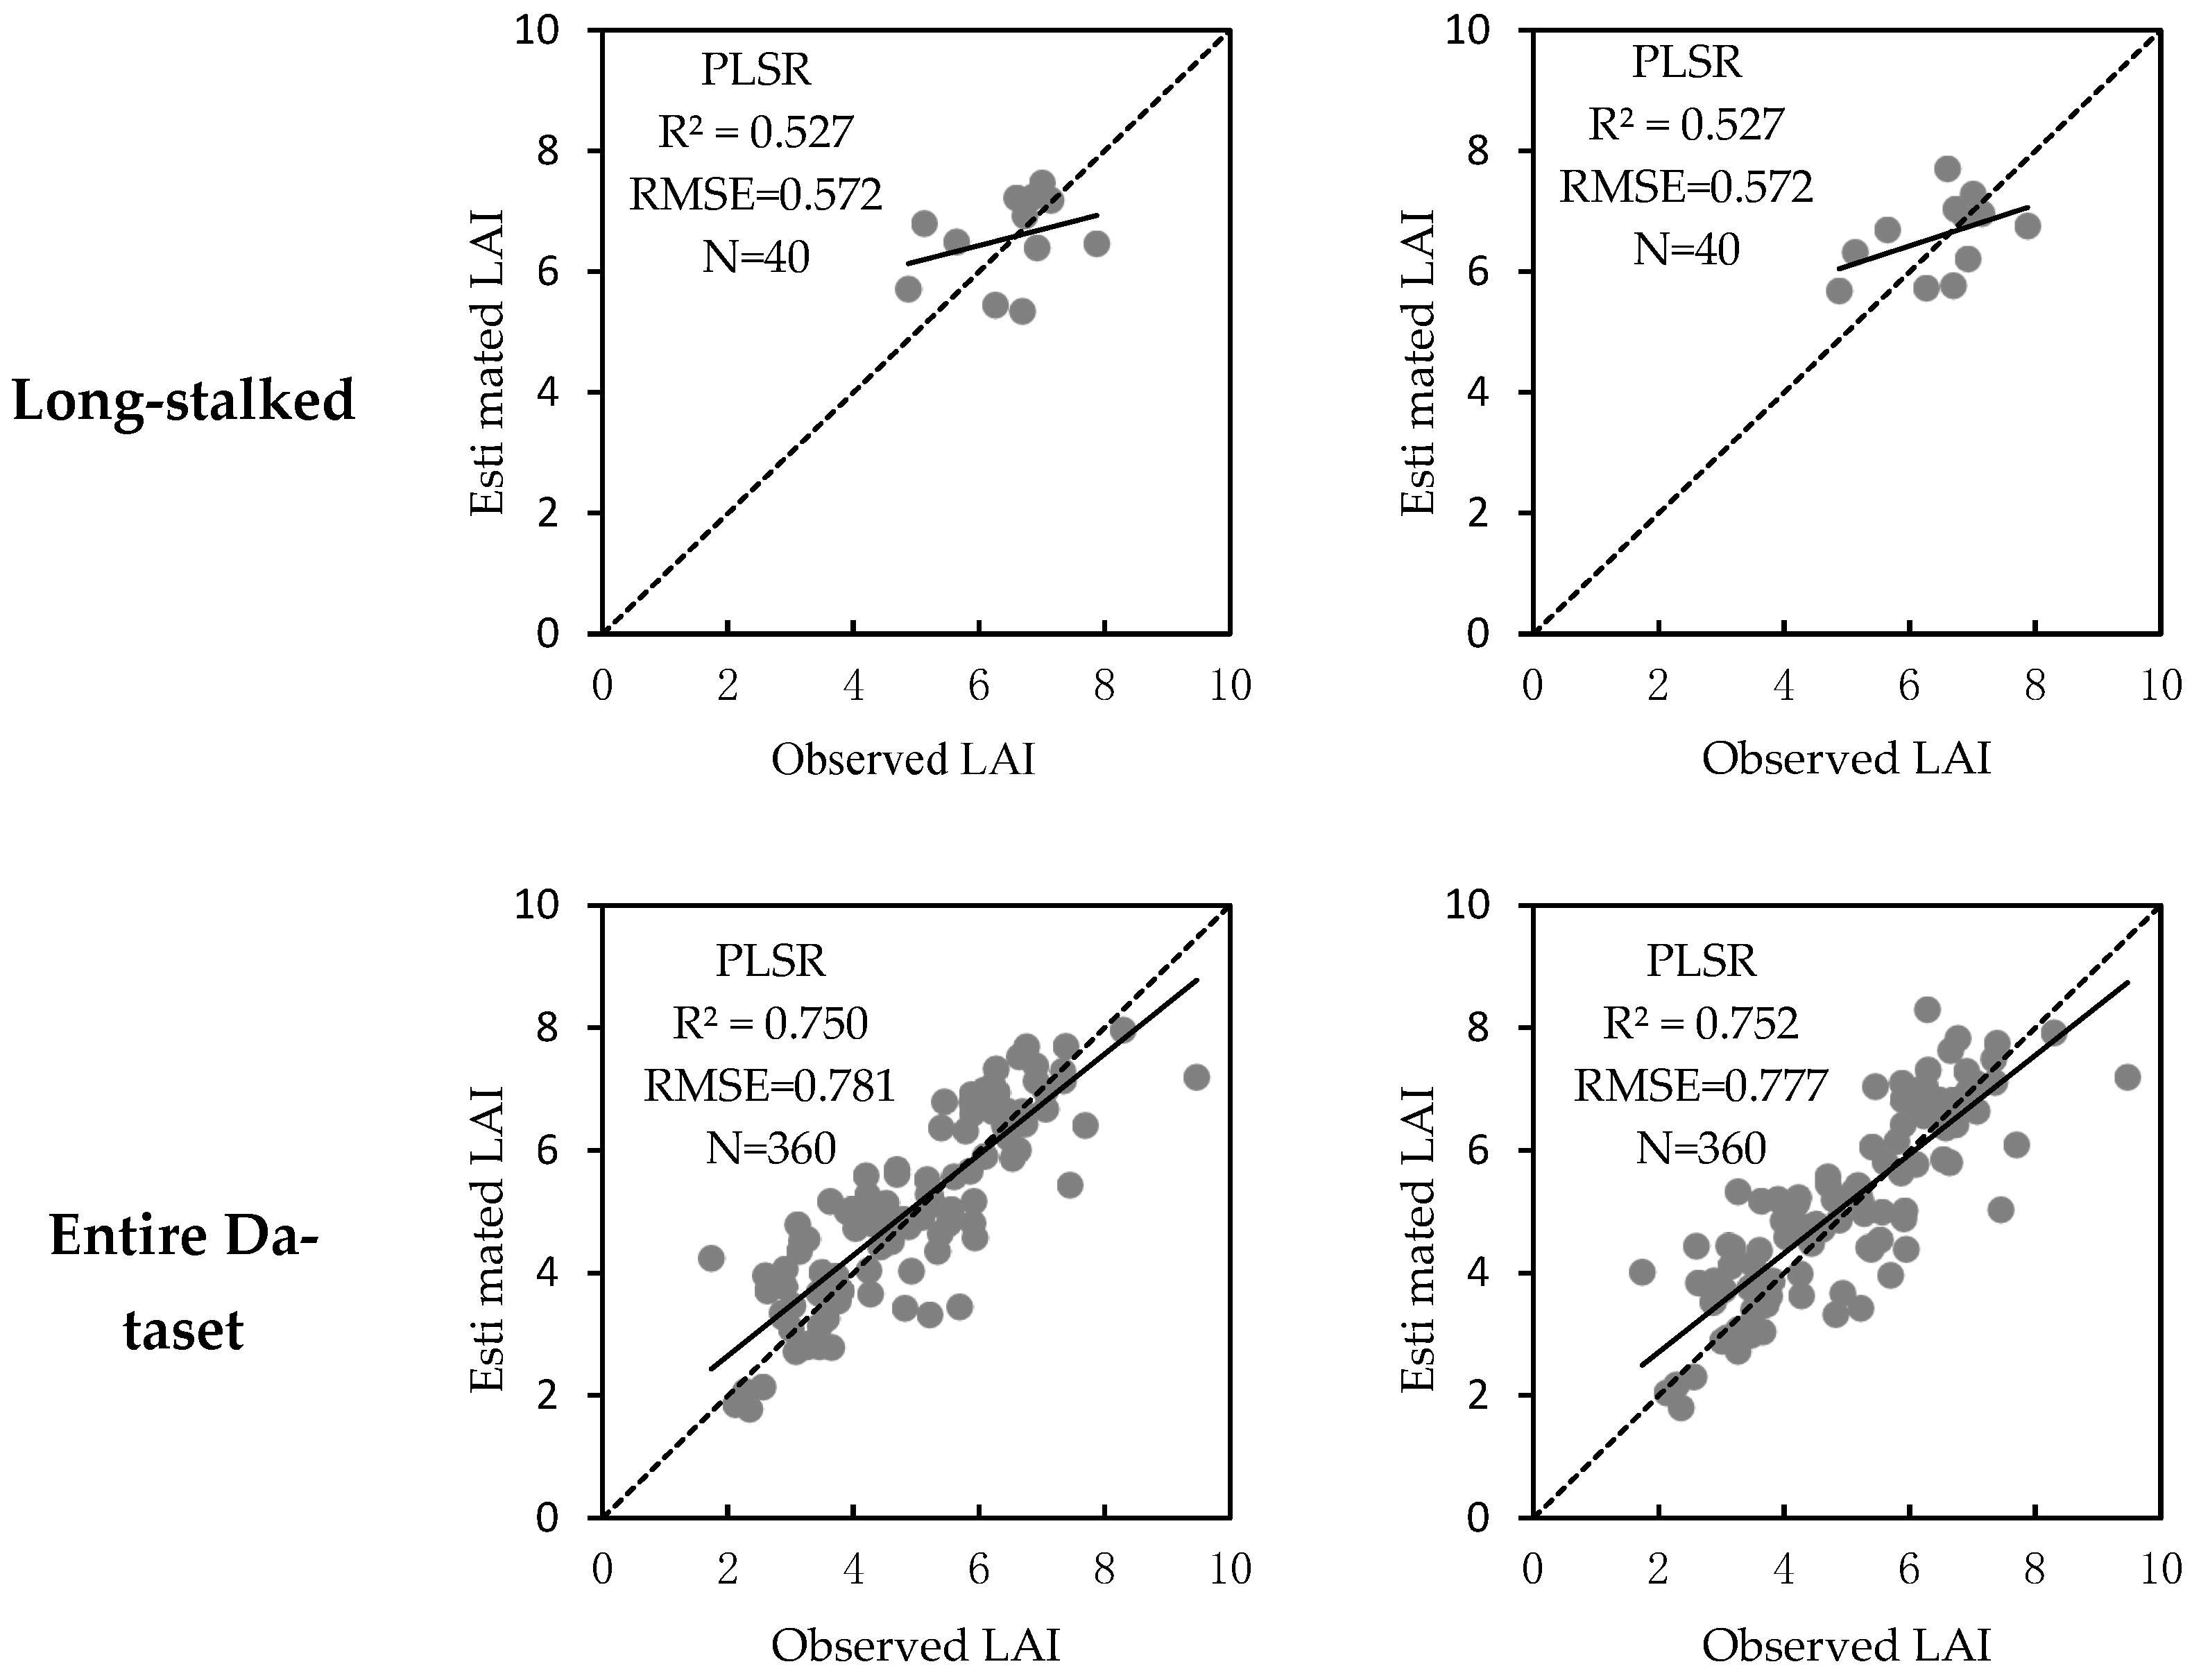
To avoid model errors caused by inconsistent sample amounts, 40 samples were randomly selected from each dataset for modeling (Table 2). LAI inversion performance was significantly different in different PH datasets (Figure 7). Compared with the inversion results of the entire dataset (R2 = 0.750, RMSE = 0.781), the LAI inversion performance of the “Long-stalked” dataset was significantly reduced, with an R2 of 0.527 and RMSE of 0.572. However, LAI estimation models performed better in “Short-stalked” and “Medium-stalked” datasets, with R2 reaching above 0.8. Therefore, in the research of crop LAI inversion, it is necessary to perform segmental inversion according to plant height distribution.
We introduced PH as a model variable to further determine whether plant height would have a positive effect on ramie LAI inversion. The introduction of PH had the most significant effect on LAI inversion of short-stalked ramie, with the R2 increasing by 1.967% and the RMSE decreasing by 34.503%. However, in other datasets, the introduction of PH did not significantly improve the accuracy of LAI estimation, which was consistent with the results of correlation analysis. In summary, PH was an important index affecting the ramie LAI inversion performance, and the sectional study on PH played an important role in monitoring ramie LAI. The introduction of PH alone cannot significantly optimize LAI inversion performance.

3.3. Effect of Texture Feature on Ramie LAI Inversion

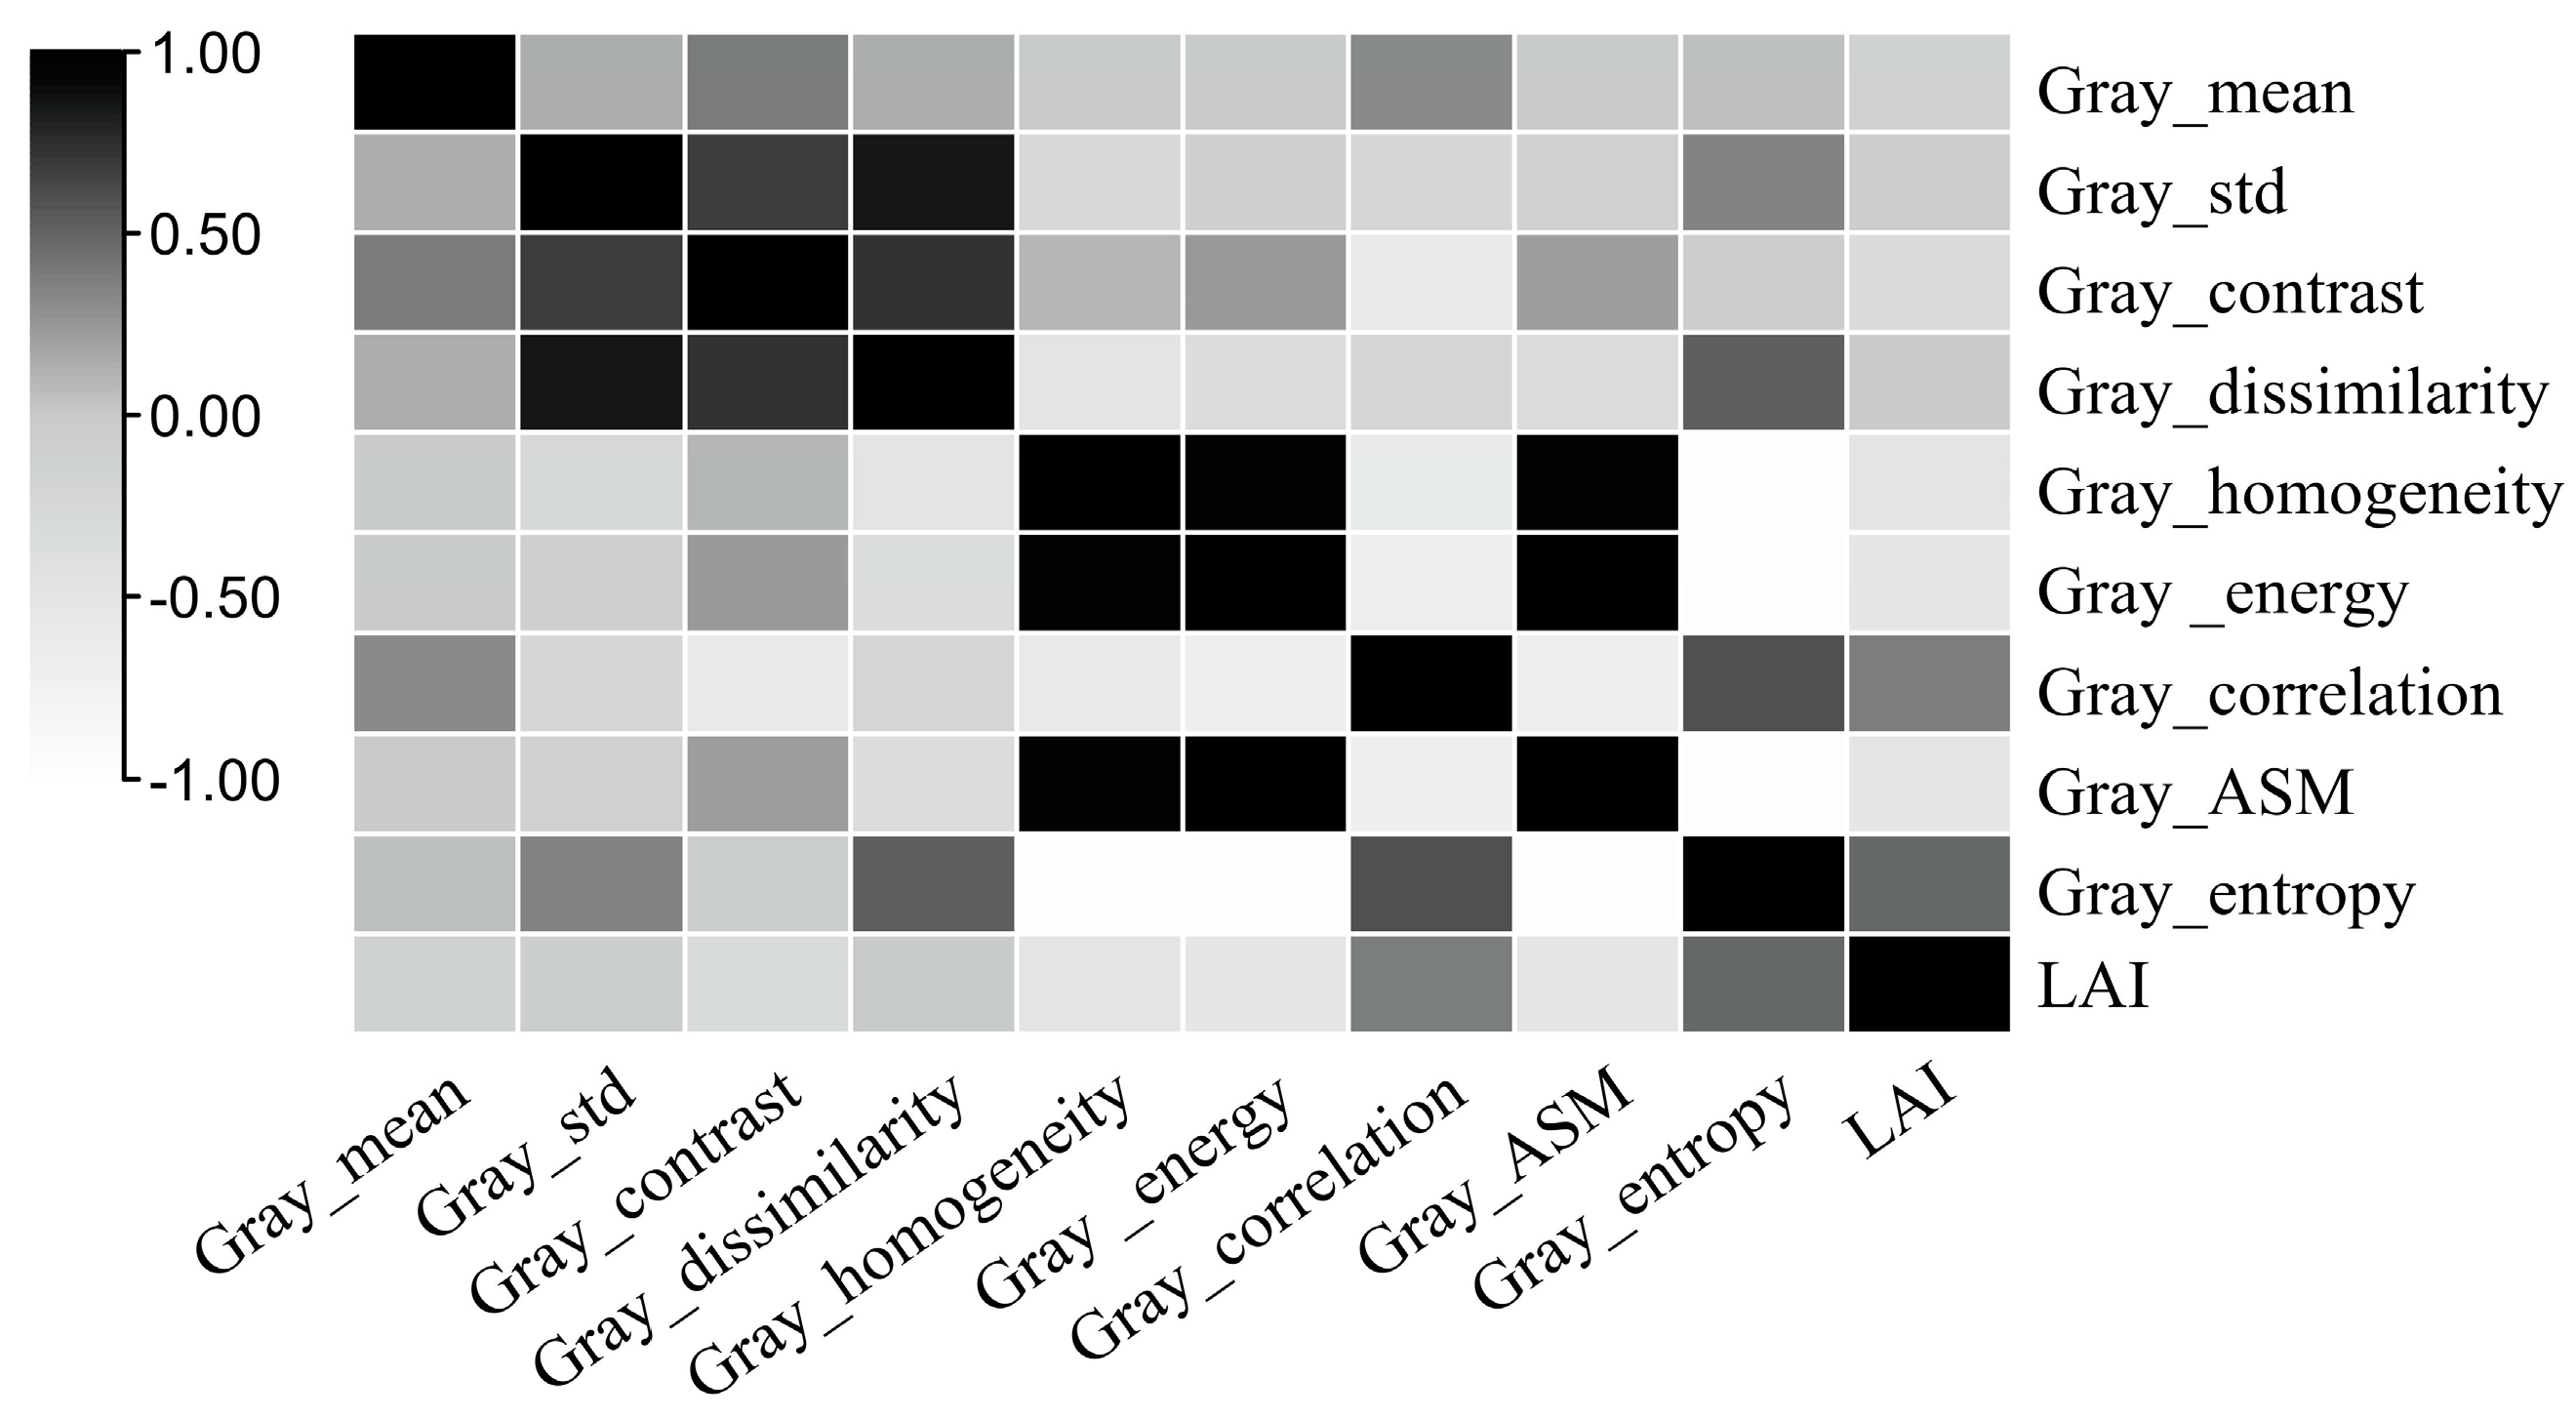
To explore the influence of texture feature (TF) on ramie LAI inversion, nine texture eigenvalues were extracted. Correlation analysis between LAI and ramie TF is shown in Figure 8. LAI was significantly or extremely significantly correlated with seven texture eigenvalues, with the correlation coefficient ranging from −0.135 to −0.534, indicating that TF was helpful to explain ramie LAI changes.
LAI inversion was performed by integrating spectral features and TF (Figure 9). The introduction of TF had a positive impact on LAI inversion. Compared with the inversion effect of spectral features, the performance of the SVR inversion model integrating spectral and TF improved a little bit, with R2 reaching 0.763 and RMSE reaching 0.760.

3.4. Multi-Feature Fusion to Improve LAI Estimation Accuracy

Four machine learning methods were used to construct ramie LAI estimation models by integrating spectral features and three types of structural texture features (CC, PH, and TF). As can be seen from Table 3, after combining multi-features, the accuracy of the LAI estimation model (R2 = 0.776, RMSE = 0.740) was significantly improved compared with that of the LAI model constructed with a single spectral feature (R2 = 0.759, RMSE = 0.766). Compared with the input of only one kind of structural texture feature, the inversion effect was improved by introducing three kinds of structural texture features. These results indicated that LAI inversion combined with spectral features, structural features, and texture features was an effective method to improve the accuracy of LAI estimation.

4. Discussion

4.1. Effect of Structural and Texture Features on Crop LAI Inversion

In most previous studies, spectral information extracted from UAV remote sensing image was used to estimate crop LAI. However, LAI estimation based on spectral information alone has certain limitations. When the spectral index tends to be saturated, the estimation result of LAI will have errors [32]. Therefore, it is of great significance to extract other LAI-related indicators to improve the accuracy of LAI estimation.
LAI is an important index reflecting the leaf structure of crop canopy. Changes in plant structure, such as the number and area of crop leaves, result in continuous and dynamic changes in LAI [33,34]. It can be seen that the structural index is closely related to LAI, and there may be a certain response rule between them. Although some studies have combined the spectral index and structural index to improve the accuracy of LAI estimation, proving that structural index is effective in estimating crop LAI [35], it is still unclear whether the structural index is as limited as the spectral index is. Therefore, clarifying the effects of structural feature differences on crop LAI inversion studies can provide guidance for further improving the accuracy of LAI estimation. In this study, ramie LAI remote sensing inversion performance was analyzed under different canopy structures. The results showed that CC and PH were the key parameters affecting LAI, and there were significant differences in ramie LAI inversion accuracy under different canopy structures. In the “Sparse Dataset”, although soil background has been removed from the image, there may still be heterogeneity in the edge pixels, leading to serious underestimation of LAI. In the “Closed Dataset”, the vegetation coverage is as high as 0.8, and the influence of soil reflection can be ignored with high canopy coverage. Different PH datasets also produced differences in LAI inversion performance. The inversion performance of the “Long-stalked” dataset was significantly lower than that of the “Medium-low stalked” dataset. Therefore, it is necessary to consider the distribution of crop canopy structure in LAI inversion research.
Texture is an intrinsic property of the object surface, which varies independently of color and brightness. Many studies have found that the fusion of spectral features and texture features can effectively improve the accuracy of crop parameter estimation [36,37], but there are few studies on crop LAI estimation. In this study, the performance of TF in ramie LAI estimation was analyzed based on obtained UAV multispectral images. The results showed that the TF was significantly correlated with ramie LAI (the correlation coefficient ranged from −0.135 to −0.534). The accuracy of the ramie LAI estimation model constructed by combining the spectral features and texture features was higher, with an R2 of 0.763 and RMSE of 0.760. TF can magnify the subtle differences between the spectral features of ground objects, reduce the influence of soil background, solar angle, and sensor perspective, and effectively inhibit the occurrence of foreign bodies in the same spectrum and different spectral phenomena of the same object [38]. In conclusion, texture information derived from remote sensing is beneficial to improve the accuracy of crop LAI estimation theoretically.

4.2. Multi-Feature Fusion Can Improve LAI Estimation Accuracy

The effects of the fusion of spectral features and three types of structural texture features on ramie LAI inversion performance were respectively compared. The results showed that the LAI estimation model based on the fusion of spectral features and a single type of structural feature could not significantly optimize the inversion performance, but the fusion of spectral features and three types of structural texture features at the same time could achieve better LAI inversion effect (R2 = 0.776, RMSE = 0.740). This is mainly because the multi-feature model integrated the joint contribution of crop spectral features, structural features, and texture features to LAI estimation, providing more information for the LAI estimation model. Among them, the spectral index is sensitive to crop plant, and the higher the chlorophyll content of plants, the greater the dry matter accumulation and the increase of LAI. Ramie LAI increased with the increase of CC and PH, so CC and PH could directly reflect LAI extracted from remote sensing images.

4.3. Machine Learning Technology Can Improve the Accuracy of LAI Estimation

ML has been recognized as a promising tool for solving different types of problems in agriculture. In this study, four ML models performed well in estimating ramie LAI (R2 = 0.562~0.776), among which SVR was considered to be the best algorithm for estimating ramie LAI. SVR has low requirements on the size of datasets, low computational complexity, and high interpretation of high-dimensional nonlinear data, so it has good performance in the estimation of LAI with small samples. In general, the accuracy of the model will increase with the increase of the richness of the modeling sample, which requires more sample size to build a more stable model. When faced with large sample data, deep learning with stronger learning ability can be developed to make up for the deficiency of ML.

5. Conclusions

This study realized the combination of UAV remote sensing technology and machine learning technology. In this study, the accuracy of ramie LAI estimation was improved by integrating a variety of feature parameters extracted from remote sensing images, and the effects of differences in structural texture features (vegetation coverage, plant height, texture) on crop LAI estimation were clarified. The results showed that ramie LAI inversion accuracy was different under different canopy structures. The fusion of multiple feature parameters can effectively improve the LAI estimation performance. After combining the spectral features with the three types of structural texture features, the accuracy of the LAI estimation model was significantly improved, and the R2, RMSE of the best model was 0.776, 0.740. Therefore, multi-feature data fusion provides a robust, practical, and low-cost method for estimating ramie LAI using UAV data, which provides technical support for non-destructive, accurate, and rapid monitoring of large-scale ramie LAI.

Author Contributions

H.F. conceived and designed the experiments, analyzed the data, and wrote the manuscript. H.F. and J.L. performed the experiments. J.C. and W.W. analyzed the data. G.C. and W.S. made critical comments and revisions. All authors have read and agreed to the published version of the manuscript.

Funding

This work was funded by the National Key Research and Development Program Project (2018YFD0201106); Ministry of Finance and Ministry of Agriculture and Rural Affairs: National Modern Agricultural Industry Technology System (CARS-16-E11); National Natural Science Foundation of China (31471543); Natural Science Foundation of Hunan Province (2021JJ60011).

Institutional Review Board Statement

Not applicable.

Informed Consent Statement

Not applicable.

Data Availability Statement

Not applicable.

Acknowledgments

The authors thank Hunan Agricultural University (Hunan, China) for technical support and the material used for the experiment.

Conflicts of Interest

The authors declare no conflict of interest.

References

  1. Li, Z.H. Research on the Development of Ramie Industry in China (1860–1958). Doctoral Thesis, Central China Normal University, Wuhan, China, 2013. [Google Scholar]
  2. Li, H.J.; Bai, Y.L.; Wang, F. Research progress of bioactive constituents of ramie leaves and their application. Biochemistry 2022, 8, 180–182. [Google Scholar]
  3. Su, X.H.; She, W.; Yang, R.F. Cloning and expression analysis of heavy metal ATPase BnHMA1 gene in ramie. Plant Physiol. J. 2020, 56, 1531–1540. [Google Scholar]
  4. Gao, G.; Xiong, H.P.; Chen, P. Effects of feeding ramie tender stem and leaf silage on fattening effect and muscle quality of Goats. Feed. Ind. 2016, 37, 20–23. [Google Scholar]
  5. Xue, X.X.; Lu, J.W.; Li, X.K. Effects of potassium deficiency on nutrition and physiological characters of rice leaves under different nitrogen application rates. J. Plant Nutr. Fertil. 2016, 22, 1494. [Google Scholar]
  6. Liu, K.; Zhou, Q.; Wu, W.; Chen, Z.; Tang, H. Comparison between multispectral and hyperspectral remote sensing for LAI estimation. Trans. CSAE 2016, 32, 155–162. [Google Scholar]
  7. Alexandridis, T.K.; Ovakoglou, G.; Clevers, J.G. Relationship between MODIS EVI and LAI across time and space. Geocarto Int. 2020, 35, 1385–1399. [Google Scholar] [CrossRef]
  8. Zhang, H.M.; Liu, W.; Han, W.T.; Liu, Q.Z.; Song, R.J.; Hou, G.H. Inversion of summer maize leaf area index based on gradient boosting decision tree algorithm. Trans. Chin. Soc. Agric. Mach. 2019, 50, 258–266. [Google Scholar]
  9. Olivas, P.C.; Oberbauer, S.F.; Clark, D.B.; Clark, D.A.; Ryan, M.G.; O’Brien, J.J.; Ordoñez, H. Comparison of direct and indirect methods for assessing leaf area index across a tropical rain forest landscape. Agric. For. Meteorol. 2013, 177, 110–116. [Google Scholar] [CrossRef]
  10. Castro-Valdecantos, P.; Apolo-Apolo, O.E.; Pérez-Ruiz, M.; Egea, G. Leaf area index estimations by deep learning models using RGB images and data fusion in maize. Precis. Agric. 2022, 23, 1949–1966. [Google Scholar] [CrossRef]
  11. Zhu, W.; Sun, Z.; Huang, Y.; Lai, J.; Li, J.; Zhang, J.; Yang, B.; Li, B.; Li, S.; Zhu, K.; et al. Improving field-scale wheat LAI retrieval based on UAV remote sensing observations and optimized VI-LUTs. Remote Sens. 2019, 11, 2456. [Google Scholar] [CrossRef] [Green Version]
  12. Wang, J.; Jiang, Y. Inversion of soybean leaf area index based on UAV multispectral remote sensing. Chin. Agric. Sci. Bull. 2021, 37, 134–142. [Google Scholar]
  13. Shao, P.P. Estimation of Rice Leaf Area Index by Hyperspectral and Multispectral Remote Sensing; Wuhan University: Wuhan, China, 2019. [Google Scholar]
  14. Zhou, X.; Zheng, H.B.; Xu, X.Q.; He, J.Y.; Ge, X.K.; Yao, X.; Cheng, T.; Zhu, Y.; Cao, W.X.; Tian, Y.C. Predicting grain yield in rice using multi-temporal vegetation indices from UAV-based multispectral and digital imagery. ISPRS J. Photogramm. Remote Sens. 2017, 130, 246–255. [Google Scholar] [CrossRef]
  15. Zhang, J.; Wang, C.; Yang, C.; Xie, T.; Jiang, Z.; Hu, T.; Luo, Z.; Zhou, G.; Xie, J. Assessing the Effect of Real Spatial Resolution of In Situ UAV Multispectral Images on Seedling Rapeseed Growth Monitoring. Remote Sens. 2020, 12, 1207. [Google Scholar] [CrossRef] [Green Version]
  16. Campos-Taberner, M.; García-Haro, F.J.; Camps-Valls, G.; Grau-Muedra, G.; Nutini, F.; Crema, A.; Boschetti, M. Multitemporal and multiresolution leaf area index retrieval for operational local rice crop monitoring. Remote Sens. Environ. 2016, 187, 102–118. [Google Scholar] [CrossRef]
  17. Liang, D.; Guan, Q.; Huang, W.; Huang, L.; Yang, G. Remote sensing inversion of leaf area index based on support vector machine regression in winter wheat. Trans. Chin. Soc. Agric. Eng. 2013, 29, 117–123. [Google Scholar]
  18. Liang, L.; Huang, T.; Di, L.; Geng, D.; Yan, J.; Wang, S.; Wang, L.; Li, L.; Chen, B.; Kang, J. Influence of different bandwidths on LAI estimation using vegetation indices. IEEE J. Sel. Top. Appl. Earth Obs. Remote Sens. 2020, 13, 101. [Google Scholar] [CrossRef]
  19. Shao, G.M.; Wang, Y.J.; Han, W.T. Estimation method of leaf area index for summer maize using UAV-based on multispectral remote sensing. Smart Agric. 2020, 2, 118–128. [Google Scholar]
  20. Sun, S.R.; Zhao, Y.L.; Wang, Y.J. Leaf area index inversion of winter wheat based on UAV multi-spectral remote sensing. J. China Agric. Univ. 2019, 24, 51–58. (In Chinese) [Google Scholar]
  21. Jacquemoud, S.; Baret, F. PROSPECT–a model of leaf ptical-properties spectra. Remote Sens. Environ. 1990, 34, 75–91. [Google Scholar] [CrossRef]
  22. Mananze, S.; Pôças, I.; Cunha, M. Retrieval of Maize Leaf Area Index Using Hyperspectral and Multispectral Data. Remote Sens. 2018, 10, 1942. [Google Scholar] [CrossRef] [Green Version]
  23. Alabi, T.R.; Abebe, A.T.; Chigeza, G.; Fowobaje, K.R. Estimation of soybean grain yield from multispectral high-resolution UAV data with machine learning models in West Africa. Remote Sens. Appl. Soc. Environ. 2022, 27, 100782. [Google Scholar] [CrossRef]
  24. Narmilan, A.; Gonzalez, F.; Salgadoe, A.S.A.; Kumarasiri, U.W.L.M.; Weerasinghe, H.A.S.; Kulasekara, B.R. Predicting canopy chlorophyll content in sugarcane crops using machine learning algorithms and spectral vegetation indices derived from UAV multispectral imagery. Remote Sens. 2022, 14, 1140. [Google Scholar] [CrossRef]
  25. Liu, C.; Yang, G.; Li, Z.; Tang, F.; Wang, J.; Zhang, C.; Zhang, L. Biomass estimation in winter wheat by UAV spectral information and texture information fusion. Sci. Agric. Sinica. 2018, 51, 3060–3073. [Google Scholar]
  26. Gao, M.Y.; Zhang, J.S.; Pan, Y.Z. Inversion of leaf area index of winter wheat based on vegetation index and crop height. Chin. J. Agric. Resour. Reg. Plan. 2020, 41, 49–57. [Google Scholar]
  27. Niu, Y.J.; Li, X.P.; Zhang, J.B. Inversion of leaf area index in winter wheat by merging UAV Lidar with multispectral remote sensing data. Acta Pedol. Sinica. 2022, 59, 161–171. [Google Scholar]
  28. Cai, W.J.; Sha, J.M. Quantitative inversion of leaf area index by remote sensing based on geographical environment factors. J. Subtrop. Resour. Environ. 2019, 14, 55–64. [Google Scholar]
  29. Hang, Y.H.; Su, H.; Yu, Z.Y. Estimation of rice leaf area index combining UAV spectrum, texture features and vegetation coverage. Trans. Chin. Soc. Agric. Eng. 2021, 37, 64–71. [Google Scholar]
  30. Tao, H.; Xu, L.; Feng, H.; Yang, G.; Dai, Y.; Niu, Y. Estimation of plant height and leaf area index of winter wheat based on UAV hyperspectral Remote sensing. Trans. Chin. Soc. Agric. Mach. 2020, 51, 193–201. [Google Scholar]
  31. Sun, B.; Wang, C.; Yang, C.; Xu, B.; Zhou, G.; Li, X.; Xie, J.; Xu, S.; Liu, B.; Xie, T.; et al. Retrieval of rapeseed leaf area index using the PROSAIL model with canopy coverage derived from UAV images as a correction parameter. Int. J. Appl. Earth Obs. Geoinf. 2021, 102, 102373. [Google Scholar] [CrossRef]
  32. Yang, K.; Gong, Y.; Fang, S.; Duan, B.; Yuan, N.; Peng, Y.; Wu, X.; Zhu, R. Combining Spectral and Texture Features of UAV Images for the Remote Estimation of Rice LAI throughout the Entire Growing Season. Remote Sens. 2021, 13, 3001. [Google Scholar] [CrossRef]
  33. Qiao, K.; Zhu, W.; Xie, Z.; Li, P. Estimating the seasonal dynamics of the leaf area index using piecewise LAI-VI relationships based on phenophases. Remote Sens. 2019, 11, 689. [Google Scholar] [CrossRef] [Green Version]
  34. Sakamoto, T.; Shibayama, M.; Kimura, A.; Takada, E. Assessment of digital camera-derived vegetation indices in quantitative monitoring of seasonal rice growth. ISPRS J. Photogramm. Remote Sens. 2011, 66, 872–882. [Google Scholar] [CrossRef]
  35. Li, S.; Yuan, F.; Ata-UI-Karim, S.T.; Zheng, H.; Cheng, T.; Liu, X.; Tian, Y.; Zhu, Y.; Cao, W.; Cao, Q. Combining color indices and textures of UAV-based digital imagery for rice lai estimation. Remote Sens. 2019, 11, 1793. [Google Scholar] [CrossRef] [Green Version]
  36. Yang, F.Q.; Feng, H.K.; Xiao, T.H. Estimation of nitrogen nutrition index of winter wheat by combining UAV image spectral and texture features. Res. Agric. Mod. 2020, 41, 718–726, (In Chinese with English Abstract). [Google Scholar]
  37. Chen, P.; Feng, H.K.; Li, C.C. UAV image spectrum and texture fusion information to estimate potato leaf chlorophyll content. Trans. Chin. Soc. Agric. Eng. (Trans. CSAE) 2019, 35, 63–74, (In Chinese with English Abstract). [Google Scholar]
  38. Huete, A.R.; Jackson, R.D.; Post, D.F. Spectral response of a plant canopy with different soil backgrounds. Remote Sens. Environ. 1985, 17, 37–53. [Google Scholar] [CrossRef]
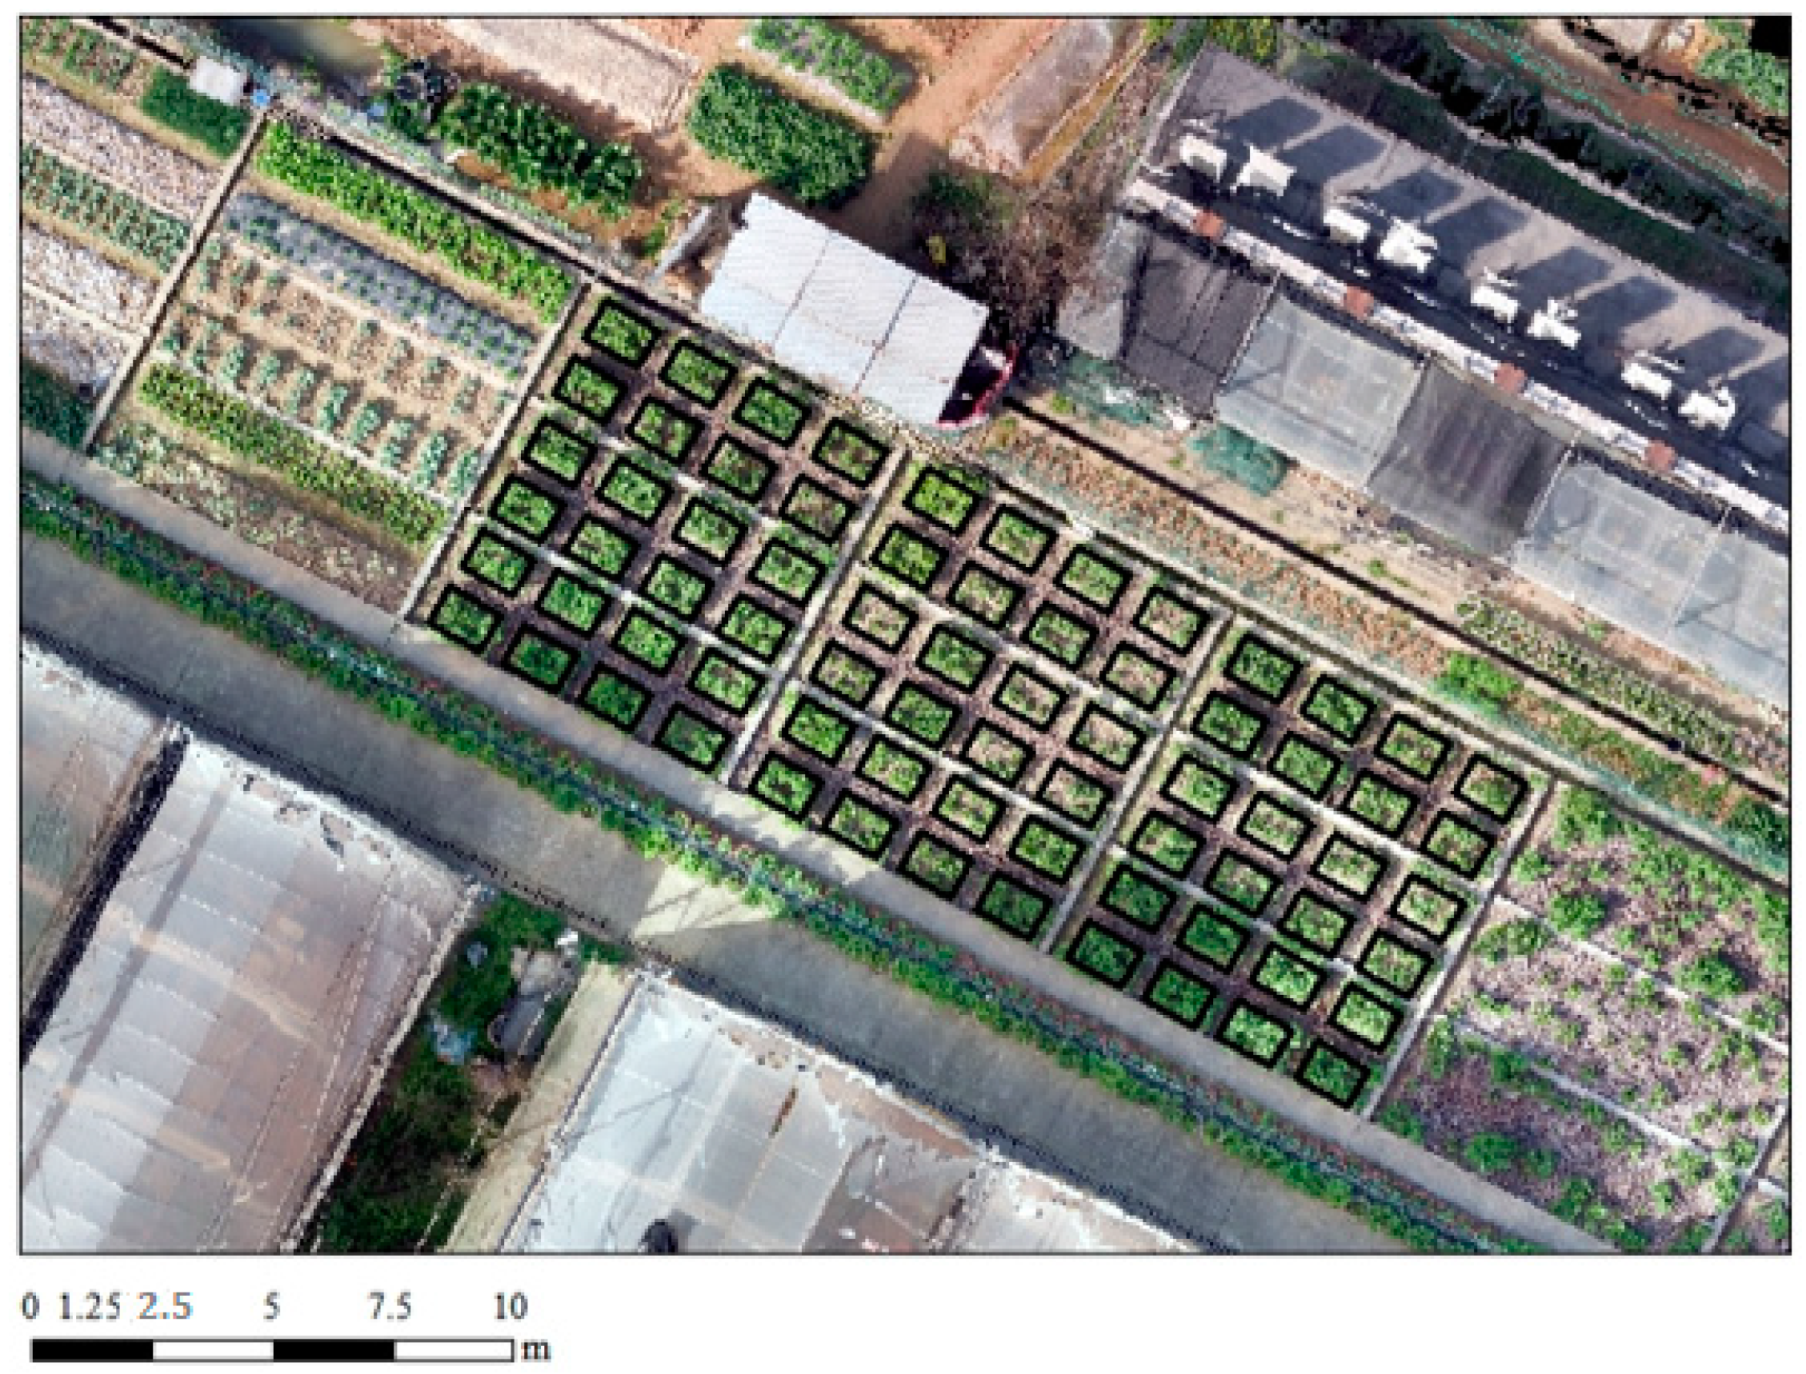
Figure 1. Overview of study areas.
Agronomy 13 01690 g001
Figure 2. Differences of ramie LAI in different canopy coverage datasets.
Agronomy 13 01690 g002
Figure 3. Pearson correlation coefficient between CC and LAI in different datasets.
Agronomy 13 01690 g003
Figure 4. Inversion performance of the full dataset, closed dataset, and sparse dataset.
Agronomy 13 01690 g004
Figure 5. Ramie LAI differences in different plant height datasets.
Agronomy 13 01690 g005
Figure 6. Pearson correlation between plant height and LAI in different datasets.
Agronomy 13 01690 g006
Figure 7. Inversion performance of entire dataset, short-stalked, medium-stalked, and long-stalked dataset.
Agronomy 13 01690 g007aAgronomy 13 01690 g007b
Figure 8. Pearson correlation between texture features and LAI.
Agronomy 13 01690 g008
Figure 9. Ramie LAI inversion by integrating spectral features and texture features.
Agronomy 13 01690 g009
Table 1. Statistical analysis of ramie LAI in different canopy coverage datasets.
DatasetCC RangeNumberMinMaxMeanStdCV (%)
Sparse Dataset0.294–0.898581.7345.5483.2270.8260.682
Closed Dataset0.900–1582.1556.4514.7860.9670.935
Entire Dataset0.294–13601.7349.4675.0901.4972.241
Table 2. Statistical analysis of ramie LAI in different plant height datasets.
DatasetPH RangeNumberMinMaxMeanStdCV (%)
Short-stalked14.500–78.125401.9836.4513.9921.03831.078
Medium-stalked100–199.800403.8409.4705.7821.2461.553
Long-stalked200–232403.9007.8806.3120.8090.655
Entire Dataset14.330–2323601.7309.4705.0891.4972.241
Table 3. Ramie LAI inversion with multi-feature fusion.
ModelSpectral FeatureMulti-Feature
R2RMSER2RMSE
LR0.7060.8470.5621.034
RF0.7600.7650.7600.765
PLSR0.7500.7810.7590.766
SVR0.7590.7660.7760.740
Disclaimer/Publisher’s Note: The statements, opinions and data contained in all publications are solely those of the individual author(s) and contributor(s) and not of MDPI and/or the editor(s). MDPI and/or the editor(s) disclaim responsibility for any injury to people or property resulting from any ideas, methods, instructions or products referred to in the content.