Article

Nitrogen Fertilization Improves the Agro-Morphological and Yield Attributes of Sinapis alba L.

1
Department of Agronomy, Faculty of Crop and Food Sciences, PMAS-Arid Agriculture University, Rawalpindi 46000, Pakistan
2
Department of Food Science and Nutrition, College of Biosystems Engineering and Food Science, Zhejiang University, Hangzhou 310058, China
3
Key Laboratory of State Forestry and Grassland Administration on Highly Efficient Utilization of Forestry Biomass Resources in Southwest China, College of Material and Chemical Engineering, Southwest Forestry University, Kunming 650224, China
4
Baoshan College of Traditional Chinese Medicine, School of Basic Medicine, Baoshan 678000, China
5
Department of Plant Breeding and Genetics, Faculty of Crop and Food Sciences, PMAS-Arid Agriculture University, Rawalpindi 46000, Pakistan
6
Institute of Ecosystem Science Borneo, University Putra Malaysia, Bintulu 97000, Malaysia
7
Faculty of Agricultural and Forestry Sciences, University Putra Malaysia, Bintulu 97000, Malaysia
8
Zhejiang Key Laboratory of Crop Germplasm Resource, Department of Agronomy, College of Agriculture and Biotechnology, Zhejiang University, Hangzhou 310058, China
*
Authors to whom correspondence should be addressed.
Agronomy 2023, 13(6), 1621; https://doi.org/10.3390/agronomy13061621
Submission received: 5 May 2023 / Revised: 13 June 2023 / Accepted: 14 June 2023 / Published: 16 June 2023

Abstract

:
Oilseed crops play a vital role in the economy of Pakistan, yet the production of oilseeds is far less than the demand for them. White mustard (Sinapis alba L.) is an emerging crop, that belongs to the Brassicaceae family. It is considered to be an alternative to all other oilseed crops for dry temperate climates. White mustard develops rapidly, and has a large canopy and deep rooting system; hence, it can draw up nutrients from deeper layers. This study aimed to evaluate the influence of nitrogen on S. alba agro-morphological attributes and enhance nutrient use efficiencies. During the Rabi seasons of 2019-20 and 2020-21, an experiment was conducted at the University Research Farm, Chakwal Road, Rawalpindi. The study included seven treatments, i.e., T1-Control, T2-20, T3-40, T4-60, T5-80, T6-100, and T7-120 kg·ha−1. Each treatment was replicated three times, and the study utilized a randomized complete block design (RCBD). The results revealed that nitrogen at 100 kg·ha−1 was the optimal concentration and significantly increased the agro-morphological parameters, i.e., plant height (47.01%), primary branches (41.36%), secondary branches (45.33%), 1000 seed weight (54.35%), siliques/plant (41.57%), seeds/silique (52.30%) biological yield (68.38%), seed yield (54.90%), harvest index (11%), and oil yield (38.84%), as compared to the control. Moreover, protein contents and oil contents were significantly increased (5.15% and 6%, respectively), as compared to the control, while glucosinolate content was decreased (4.36%). Similarly, maximum agronomic efficiency (AE), apparent recovery efficiency (ARE) (53%), physiological efficiency (PE), and nutrient use efficiency (NUE) were also improved, as compared to the control. Hence, N application at a concentration of 100 kg·ha−1 can be recommended for S. alba under the present cropping system of Pothwar.

1. Introduction

Despite the fact that the economy of Pakistan is based on agricultural developments, the import of different agricultural commodities exceeds US$6 billion annually [1]. Oil crops also have a vital role in the economy, but unfortunately, the yield of edible oil from oil crops is inadequate to meet the requirements. Improper policies, lack of farmers’ knowledge and interest regarding oilseed crops, the use of traditional crop cultivation methods, biotic and abiotic factors, and technological deficiencies are some of the reasons for the low production of oilseed crops in Pakistan. The genus Brassica is considered to be very important, belonging to the Brassicaceae family, which consists of more than 338 genera and 3700 species [2]. Today, the usage of edible oil has been extended, and different oilseeds are being used to extract oil from these crops [3]. Although Brassica crops are mainly used for edible oil purposes, in the developed world, agricultural surpluses are being considered as possible alternative biofuels [4]. Oilseed crops are important all over the world, as the main source of edible oil, with the meal cake being used in animal feed. During the last 40 years, canola (Brassica napus L.) has become the third most important oilseed crop after soybean and palm [5]. In Pakistan, more than a dozen crops are sown for the production of edible oil. Oilseed crops have been classified into two groups: traditional (sesame, rapeseed mustard, linseed ground nut,) and non-traditional (sunflower soybean, canola, and safflower) [6].
Sinapis alba, also known as white mustard, is an annual oilseed crop that belongs to the Brassicaceae family. It originated in the Mediterranean region and is used as a horticultural plant species, as well being considered as a weed, all over the world [7]. It is a winter crop, with the potential for a second crop, that may be produced in short cycles, frequently in rotation with other cereal crops [8]. White mustard is the most widely used mustard species in Europe [9], and it is the only species grown commercially in North America for food processing and condiments [7]. It is considered to be a promising alternative oilseed crop for dry temperate climates. Arif et al. [10] demonstrated the valuable features of this species, such as shatter-free pods, pest resistance, short growing season, and better drought tolerance, as compared to rapeseed (Brassica compestris) or canola (Brassica napus). S. alba as a cover crop reduced weed infestation by 50 and 60% and had the potential to delay weed appearance by 3 to 4 weeks in the first and second years, respectively, compared with bare soil [9]. Studies conducted by the authors in [11,12] demonstrated that white mustard is characterized by its high agronomic value, as it exhibits significant levels of protein (28–40%), oil (24–36%), carbohydrates (20–25%), minerals (4%), the fatty acids oleic acid (26.5%) and linolenic acid (9.8%), and erucic acid (34%).
Nitrogen (N) fertilizer is an essential component of modern farming, and it has played a significant role in agricultural growth and yield enhancement. To enhance agricultural production, global applications of N fertilizer increased by 40% between 2000 and 2020, resulting in an annual application of over 113 million tons [13]. Nitrogen is considered to be a fundamental component of plant growth and development, and it is recognized as a complex nutrient due to the many forms its takes and the various roles it plays throughout its life cycle [14,15]. It is involved in plant metabolic processes, and the plant’s life cycle’s supply–demand equilibrium largely determines how much is absorbed and distributed [16]. Nitrogen availability and provision fluctuate based on crop species and are influenced by their distinct needs [17].
Nitrogen fertilizers, on the other hand, have not always had a positive environmental impact [18]. Despite advances in nitrogen fertilizer optimization, nitrogen is currently lost to the environment due to over-application of nitrogen fertilizer to crops worldwide [19]. Nitrogen is not easily removed from the fields during harvest and enters the crop production system via runoff, nitrate leaching, or as volatile nitrous oxide or ammonia, having a negative environmental impact [20]. Furthermore, the production of mineral fertilizers is predominantly reliant on fossil fuel energy, causing more greenhouse gas emissions and increased fertilizer costs. High N fertilization and other management techniques may result in excessive nitrate leaching [21]. As a result, evidence of growing nitrate leaching from soils under diverse land-use regimes has heightened interest in the need for improved mitigating techniques [22].
The nitrogen use efficiency (NUE) of oilseed crops has been shown to differ depending on the species and variety [23]. Maintaining a high plant population per acre is required to achieve a high yield of white mustard. As a result, one of the most significant cultural techniques affecting grain production, along with other essential agronomic features of this crop, is plant density [24]. Improving the N efficiency of winter oilseed rape reduces the potential for environmental contamination while increasing economic rewards. In terms of the environment, the crop should receive optimal N dosages to ensure yield development and to avoid eventual N leaching from the soil [25]. Agronomic nitrogen utilization efficiency is defined as the direct increase in seed output per increased unit of N fertilizer [26]. Physiological nitrogen usage efficiency, on the other hand, is assessed as the nitrogen/carbon balance in the shoots at harvest, which is measured by examining the relationship between the biomass and N content of the shoots [27]. To the best of our knowledge, no evidence exists regarding the impact of nitrogen fertilization on the agro-morphological and yield attributes of S. alba in the Pothwar region of Pakistan. Hence, this study aimed to examine the optimization of nitrogen doses for S. alba in the rainfed region, to enhance the growth, yield, and N use efficiencies of the crop.

2. Materials and Methods

2.1. Experimental Site Conditions

The field experiment was executed during Rabi seasons in 2019–2020 and 2020–2021 to determine the impact of “nitrogen” on Sinapis alba. For this purpose, the crop was sown at the University Research Farm Koont, Chakwal Road, Rawalpindi (latitude 33.3° N, longitude 73.3° E; 460 m above sea level; annual rainfall of 650–850 mm, long-term average). The particular site was in summer fallow. The seed bed was prepared as per the general practice in the area, with summer ploughing for moisture conservation and weed control. At the end of September, the soil was ploughed thrice with a cultivator at the appropriate moisture conditions. The recommended dose of nitrogen (70 kg·ha−1), phosphorus (35 kg·ha−1), and potassium (25 kg·ha−1) was incorporated into the soil as urea, diammonium phosphate, and sulphate of potash at the time of the last seedbed preparation. Sowing was carried out using a hand drill and seed was applied at a concentration of 5 kg·ha−1. Spacing was 30 cm row-to-row and 15 cm plant-to-plant (maintained after complete germination) in a randomized complete block design (RCBD), with three replicates on the date of sowing: 5 October 2019 and 2020. The plot size for each treatment was kept at 10 m2. Thinning was practiced at the three-leaf stage and weeding was also carried out manually when needed. The plant density was maintained after thinning to 22 plants per 1 m2. To determine the impact of nitrogen as a macronutrient in Sinapis alba, seven different concentrations, i.e., T1-(Control, no fertilizer application), T2-20, T3-40, T4-60, T5-80, T6-100, and T7-120 kg·ha−1 of nitrogen, were used in this experiment. After the preparation of the land, each nutrient was broadcast prior to the sowing of the crop. Urea was employed as a nitrogen source and data were collected at the maturity stage. The crop was harvested at maturity on 20 April 2020 and 26 April 2021.

2.2. Soil Data Collection

Pre-sowing physiochemical properties of the soil are presented in Table 1. Composite soil samples from each replication were taken from depths of 0–15 cm and 15–30 cm prior to sowing during both years. The soil extract was prepared and the pH of the extract was recorded with a pH meter (BANTE Instrument, PHS-3BW). The electrode of the EC meter (CORNING Conductivity meter-220) was rinsed with distilled water and then inserted into the soil extract to record the EC from the instrument display. A spectrophotometer (PD 303S-APEL Co., Ltd., Kawaguchi, Japan) was used to record phosphorus and extractable K was measured by flame photometer (Digiflame-DV-710). Analysis was in accordance with the protocol suggested by Minter [28]. Organic matter and nitrate content were calculated as per the method used by Malcolm [29]. The Kjeldhal (KjelSampler K-376) method of Bremner and Mulvaney [30] was used for measuring total nitrogen after digesting the sample in the digestion mixture (H2SO4 + K2SO4 in 9:1).

2.3. Weather Data Collection

Weather data, such as rainfall, mean maximum and minimum temperatures, and humidity were recorded during both years (2019–2020 and 2020–2021) of the crop life cycle, taken from the automatic university farm weather station, is presented in Table 2.

2.4. Agro-Morphological Parameters

Plant height was calculated at the time of maturity. Five randomly selected plants from each treatment and their heights were measured from soil to plant tip. The mean of five heights was taken.
The primary and secondary branches per plants were counted at the physiological maturity stage. Then, an average was taken for number of branches. Similarly, the number of siliques per plant was randomly counted from each treatment and the average number of siliques from plants was taken. One hundred siliques were randomly selected from each treatment. The number of seeds in each silique was counted, and the average was calculated.
Thousand seed weight was calculated after harvesting the crop; three replicates of 1000 seeds were taken separately and weighed using a digital balance.
For determination of biological yield, the central two rows were harvested from each plot. Harvested samples were dried in the sun for a few days. After drying, samples were weighed for biological and seed yield, converted to kg·ha−1 [14].
The harvest index was calculated using the following formula:
Harvest   index   % = Economic   yield Biological   yield × 100
Similarly, the oil yield of Sinapis alba L. was calculated using the following formula:
Oil   yield   kg / ha = Oil   content   ×   Seed   yield 100

2.5. Seed Quality Parameters

Seed oil contents (%), protein contents (%), and glucosinolate contents (%) were measured and calculated using a near-infrared reflectance spectroscopy system (NIRS) [31]. A weighed seed sample of 100 g was taken from each treatment and was cleaned of all impurities. Then, each seed sample was poured into the seed collecting chamber of the near-infrared (NIR) seed analyzer (Perten (Instruments), Inframatics-9200). The analysis carried out using this technique did not require too much sample preparation (grinding) or chemical reagents. The reflectance of each seed sample was read out from the display screen of the instrument. Each sample was repeated three times to achieve uniformity in results.

2.6. Nitrogen Use Efficiency Parameters

Nitrogen use efficiency was calculated as per the following formula given by Gan et al. [32]:
Physiological efficiency × Apparent recovery efficiency

2.7. Physiological Efficiency

The biological production obtained per unit of fertilizer applied was calculated using the following equation:
Total   dry   matter   yield   of   fertilized   crop   in   kg Total   dry   matter   yield   of   the   control   in   kg Nitrogen   uptake   by   fertilized   crop Nitrogen   uptake   by   the   control

2.8. Apparent Recovery Efficiency

The quantity of nutrient absorbed per unit of nutrient applied was calculated using the following equation:
Nitrogen   uptake   by   fertilized   crop   Nitrogen   uptake   by   the   control Quantity   of   nitrogen   applied   in   kg

2.9. Agronomic Efficiency

The economic production obtained per unit of nutrient applied was calculated using the following equation:
Seed   yield   of   nitrogen   fertilized   crop   in   kg Seed   yield   of   control   in   kg Quantity   of   nitrogen   applied   in   kg

2.10. Nitrogen Use Efficiency

The nitrogen fertilizer use efficiency was calculated using the following equation:
Total   dry   matter   yield   of   nitrogen   fertilized   crop Total   dry   matter   yield   of   the   control Quantity   of   nitrogen   applied

2.11. Statistical Analysis

Statistics 8.1 software was used to statistically analyze the data using analysis of variance (ANOVA), and the treatment means were compared using LSD at a 5% confidence level [33]. Additionally, Pearson’s correlation and principal component analysis between agronomic and seed quality traits were used to classify linear correlations between the studied attributes and N fertilizer doses using R software (version 1.2.5033). Figures were plotted using Origin pro version 2021 (OriginLab, Northampton, MA, USA). Quadratic models were fitted for agro-morphological, qualitative parameters and nitrogen use efficiencies to examine the response to N fertilizer doses. The choice of the best model was based on model significance (significantly different from zero based on the t test at p < 0.05) and R2 value. The quadratic model was considered to be the best choice to describe the relationship between different N use efficiencies and N fertilizer doses.
The equation for the quadratic model was:
Y =   β 0 + β 1   N i +   β 2   N 2 i +
where Y indicates crop yield; Ni represents applied nitrogen; N²i represents the square of applied nitrogen; and β0, β1, and β2 are the parameters that determine the position and shape of the quadratic curve. The coefficient “β0” determines the concavity of the curve.

3. Results

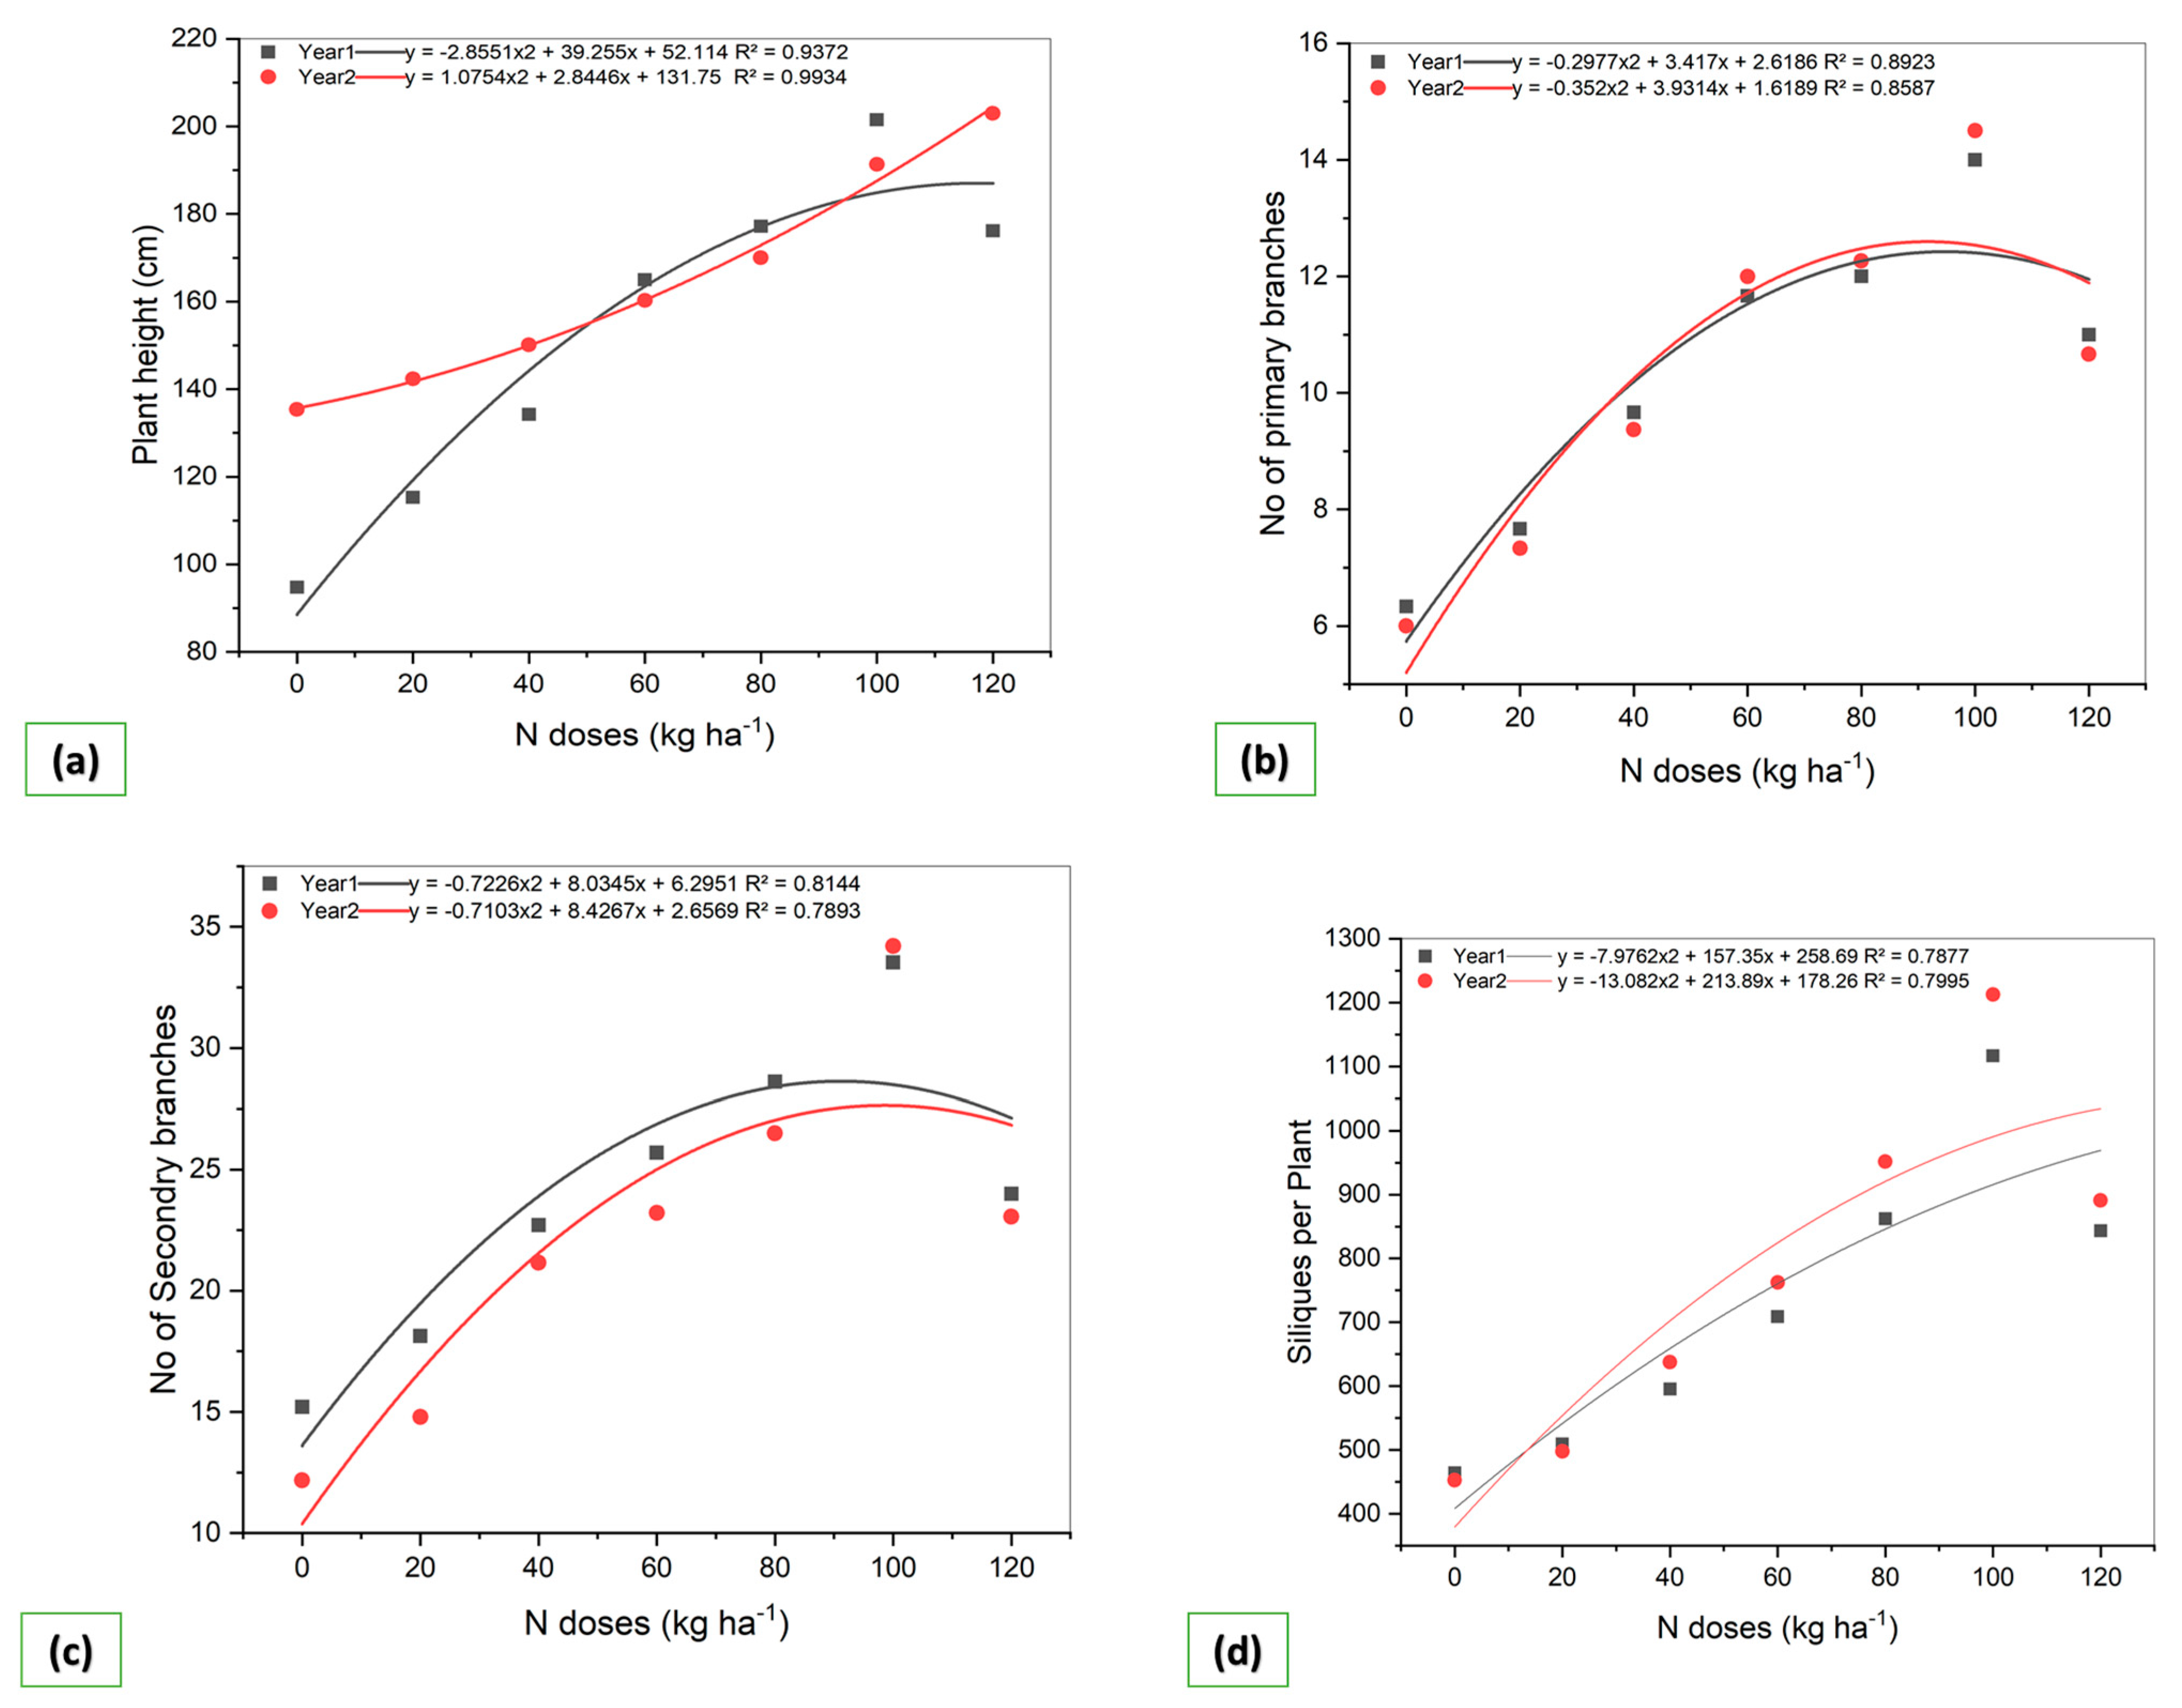
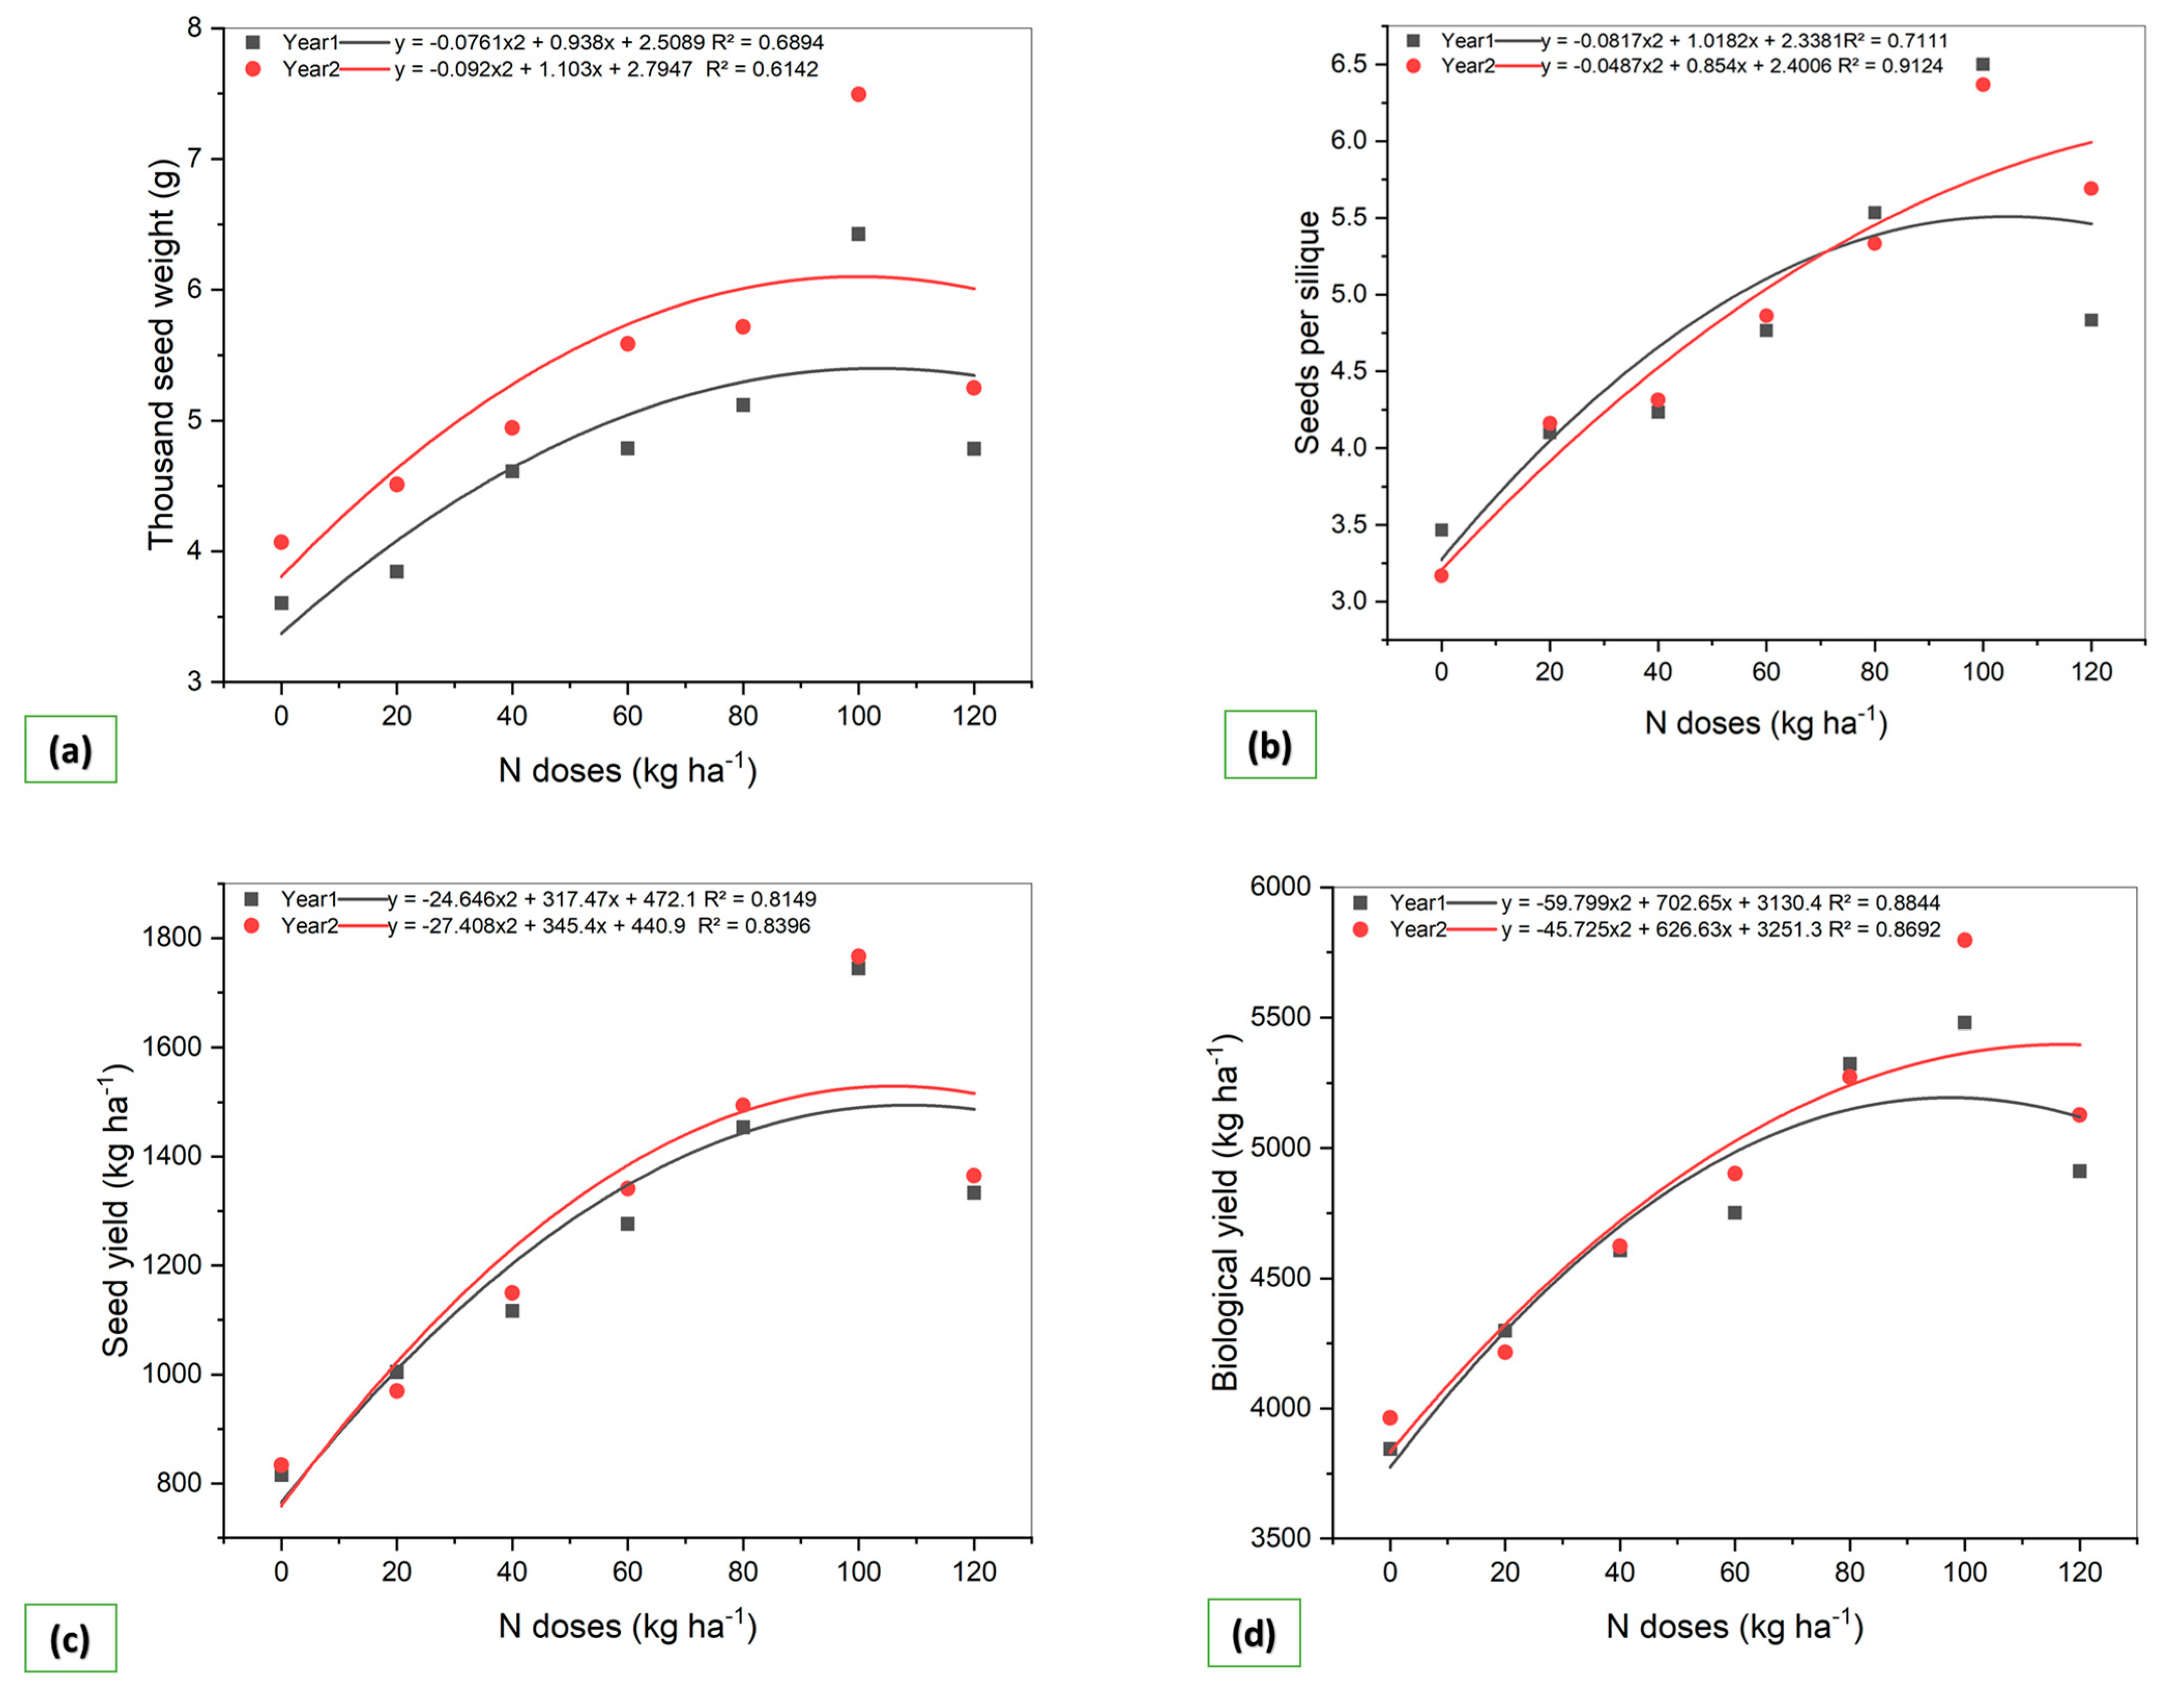
3.1. Impact of N Fertilizer Levels on Agro-Morphological Parameters of S. alba

The results of the present study showed a consistent and progressive increase in plant height up to 100 kg·ha−1 N; however, further addition of N caused a decrease in plant height. The differences observed among the different treatments had a statistically significant positive impact on plant height, with a regression value of (0.99 > 0.93) for both years of the experiment (Figure 1a). During the period of 2019–2020, the maximum plant height was 201.54 cm, whereas, the shortest plant height of 94.76 cm was recorded in the control group. A similar trend was observed during 2020–2021, as described in Figure 1a. However, the tallest plants were observed with the maximum N dose (120 kg·ha−1), yet statistically significant differences were seen among the first four treatments (T1–T4). A further increase in N application resulted in a non-significant difference among the last three treatments.
The effect of different nitrogen doses on the number of primary and secondary branches (PB, SB) per plant of S. alba revealed significant differences among the regression values; (0.89 > 0.85) and (0.81 > 0.78) (Figure 1b,c). During 2019–2020, at T6 (100 kg·ha−1), the maximum number of PB (14) and SB (33.53) were observed, while the minimum number of PB (6.33) and SB (15.2) were obtained from T1 (control). A similar trend was observed during the year 2020–2021, with the maximum PB (14.5) and SB (34.20) being recorded. Moreover, the minimum PB (6) and SB (12.71) were observed in the control treatment group.
The regression analysis for the number of siliques per plant indicated a significant linear relationship among the various treatments, with a regression value of (0.79 > 0.78), during both years of experiment (Figure 1d). During 2019–2020, the maximum number of siliques (1116.7) were obtained from T6 (100 kg·ha−1 N), while the minimum number of siliques (464.3) was observed in the control plants. Almost the same trend was observed during next growing season (2020–2021) where the maximum number of siliques (1212.6) was obtained from T6 (100 kg·ha−1 N), while the minimum number of siliques (452.6) was observed in the control group. First, three treatments (T1–T3) were statistically different from the last three treatments (T4–T6), but they were not significantly different among themselves. However, T6 differed considerably from the rest of the treatments, but further increasing the level of N up to 120 kg·ha−1 resulted in the difference being non-significant among T3, T4, and T6.
The number of seed per silique and the thousand seed weight exhibited statically significant differences during both years of the experiment at T6 (100 kg·ha−1 N); the maximum number of seeds per silique (6.5) and 1000 seed weight (6.27) were recorded during 2019-20, while the minimum seeds per silique (3.17) and 1000 seed weight (3.60) were calculated from T1 (control) (Figure 2a,b). Therefore, the N doses appeared to have a significantly positive impact on seeds per silique and 1000 seed weight, with regression values of (0.91 > 0.71) and (0.68 > 0.61), respectively.
Different doses of N fertilizer had a significant effect on the biological yield and seed yield of S. alba during both years of the experiments. The results revealed that the maximum biological yield (5480.2 kg·ha−1), seed yield (1744.1 kg·ha−1), harvest index (31.88), and oil yield (588.74 kg·ha−1) were observed at T6 (100 kg·ha−1 N) during 2019–202. In contrast, the minimum biological yield (3843.1 kg·ha−1), seed yield (815.9 kg·ha−1), harvest index (21.24), and oil yield (263.19 kg·ha−1) were observed in the control group. During 2020-21, similar trends were observed (Figure 2c,d and Figure 3a,b). Similarly, the maximum BY (3962.7 kg·ha−1), SY (1766.6 kg·ha−1), HI (30.50), and OY (854.32 kg·ha−1) were observed from T6 (100 kg·ha−1). The minimum yield and HI was observed in the control group. Therefore, the different N doses had a significantly positive impact on SY, BY, HI, and OY with regression values of (0.83 > 0.81), (0.88 > 0.86), (0.88 > 0.79), and (0.76 > 0.75), respectively.

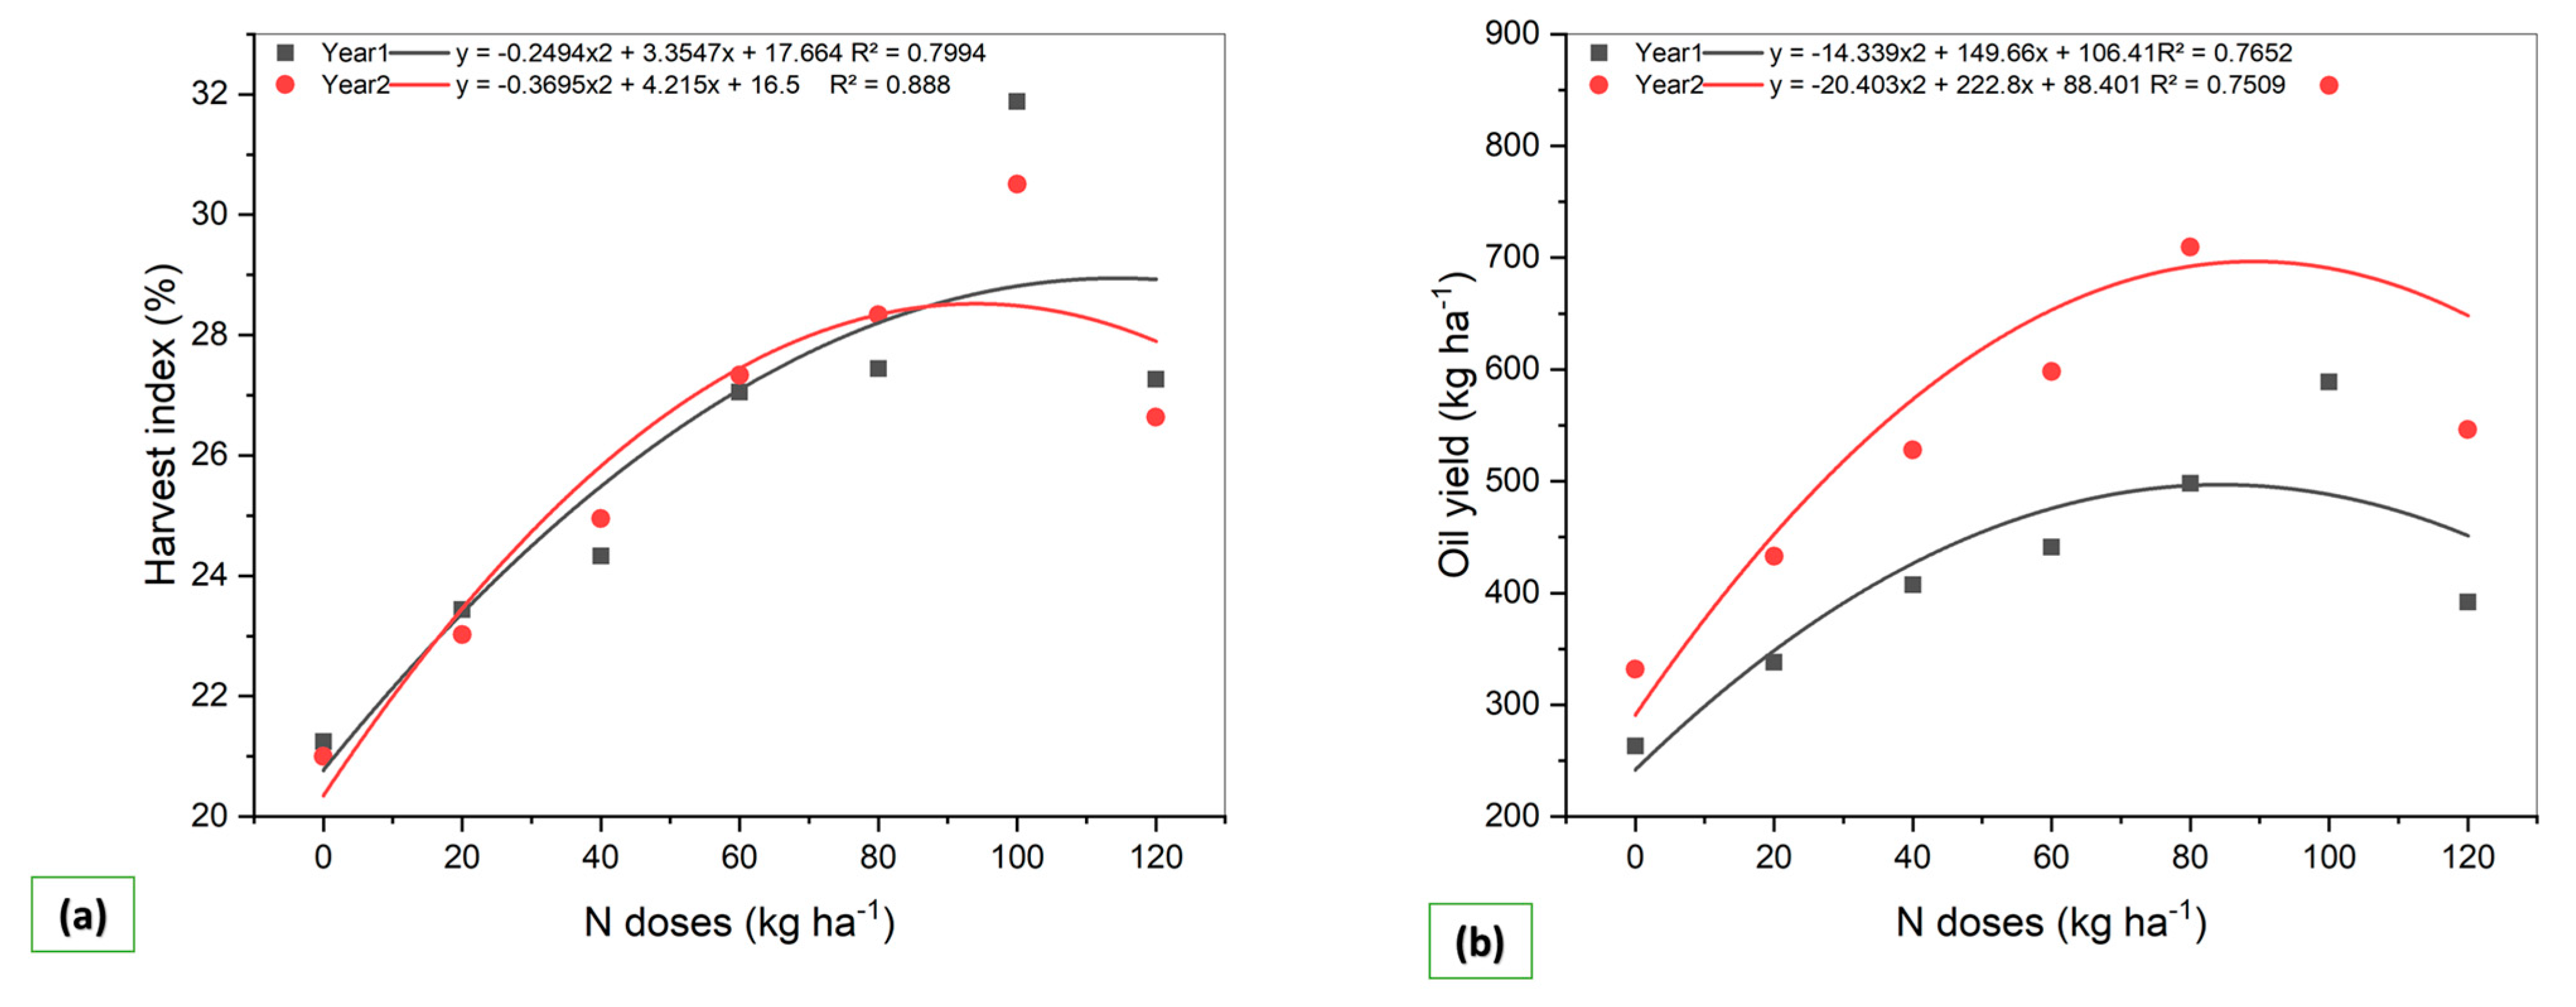
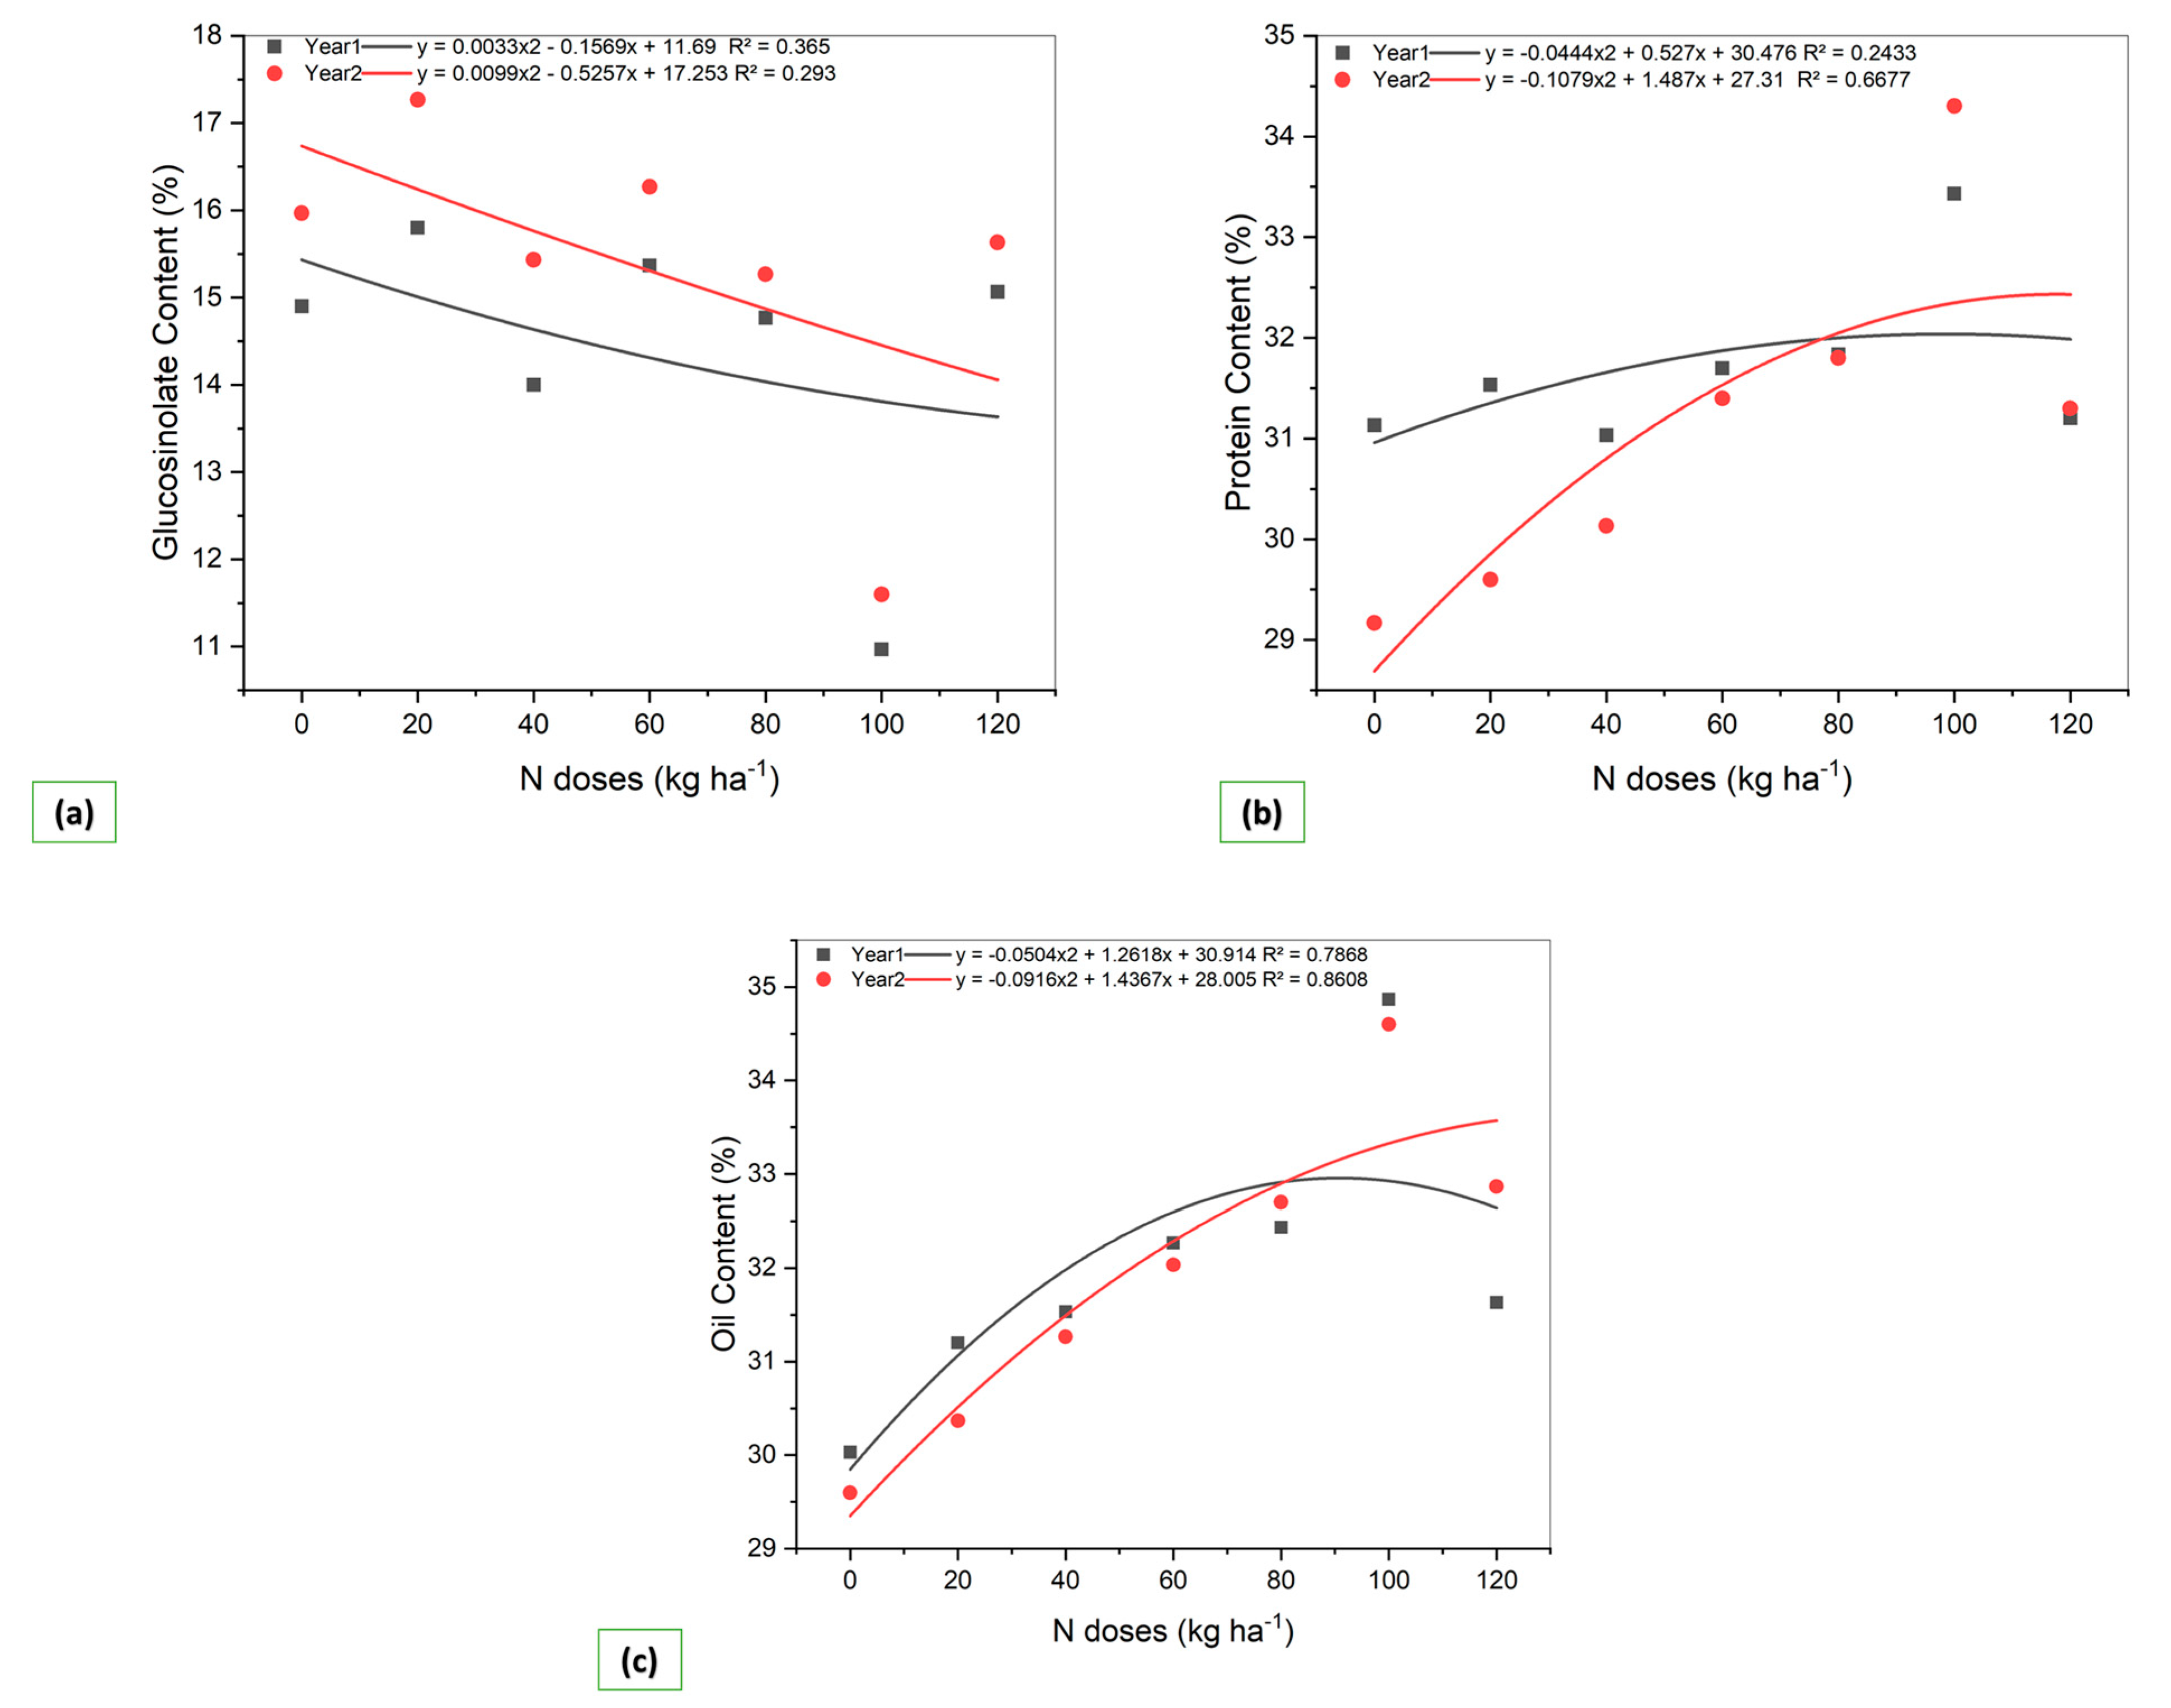
3.2. Effect of Different Nitrogen Fertilizer Levels on Quality Parameters of S. alba

The effect of different nitrogen fertilizer doses on the glucosinolate content of S. alba was found to be non-significant with a very low regression value (0.36 > 0.29) (Figure 4a). Gradually increasing the level of N did not significantly increase the glucosinolate (GS) content. The results showed that T1 and T2 were significantly different. During 2019–2020, and 2020–2021, the highest GS content (18% and 17%, respectively) was observed in T3 (40 kg·ha−1 N) and T2 (20 kg·ha−1 N); the minimum GS (13%) was observed from T6.
Protein content (PC) was significantly affected by different doses of N fertilizer, with a regression value of (0.66 > 0.24) during both years of the experiment (Figure 4b). During the year 2019–2020, the highest PC (33.43) was recorded from T6, which was significantly different from the other treatments. During the year 2020–2021, a similar trend was observed with the highest PC (34.3) recorded. The minimum PC was observed in the control group.
Different doses of nitrogen did not significantly increase the oil content. However, the maximum (34.8%) oil content (OC) was observed from T6 (100 kg·ha−1) during 2019–2020, which was not significantly different from the highest oil content (34.6%) in the same treatment group during 2020–2021. When comparing both growing years, it was generally observed that the OC was higher in the first year (2019–2020), as compared to the second year (2020–2021) (Figure 4).

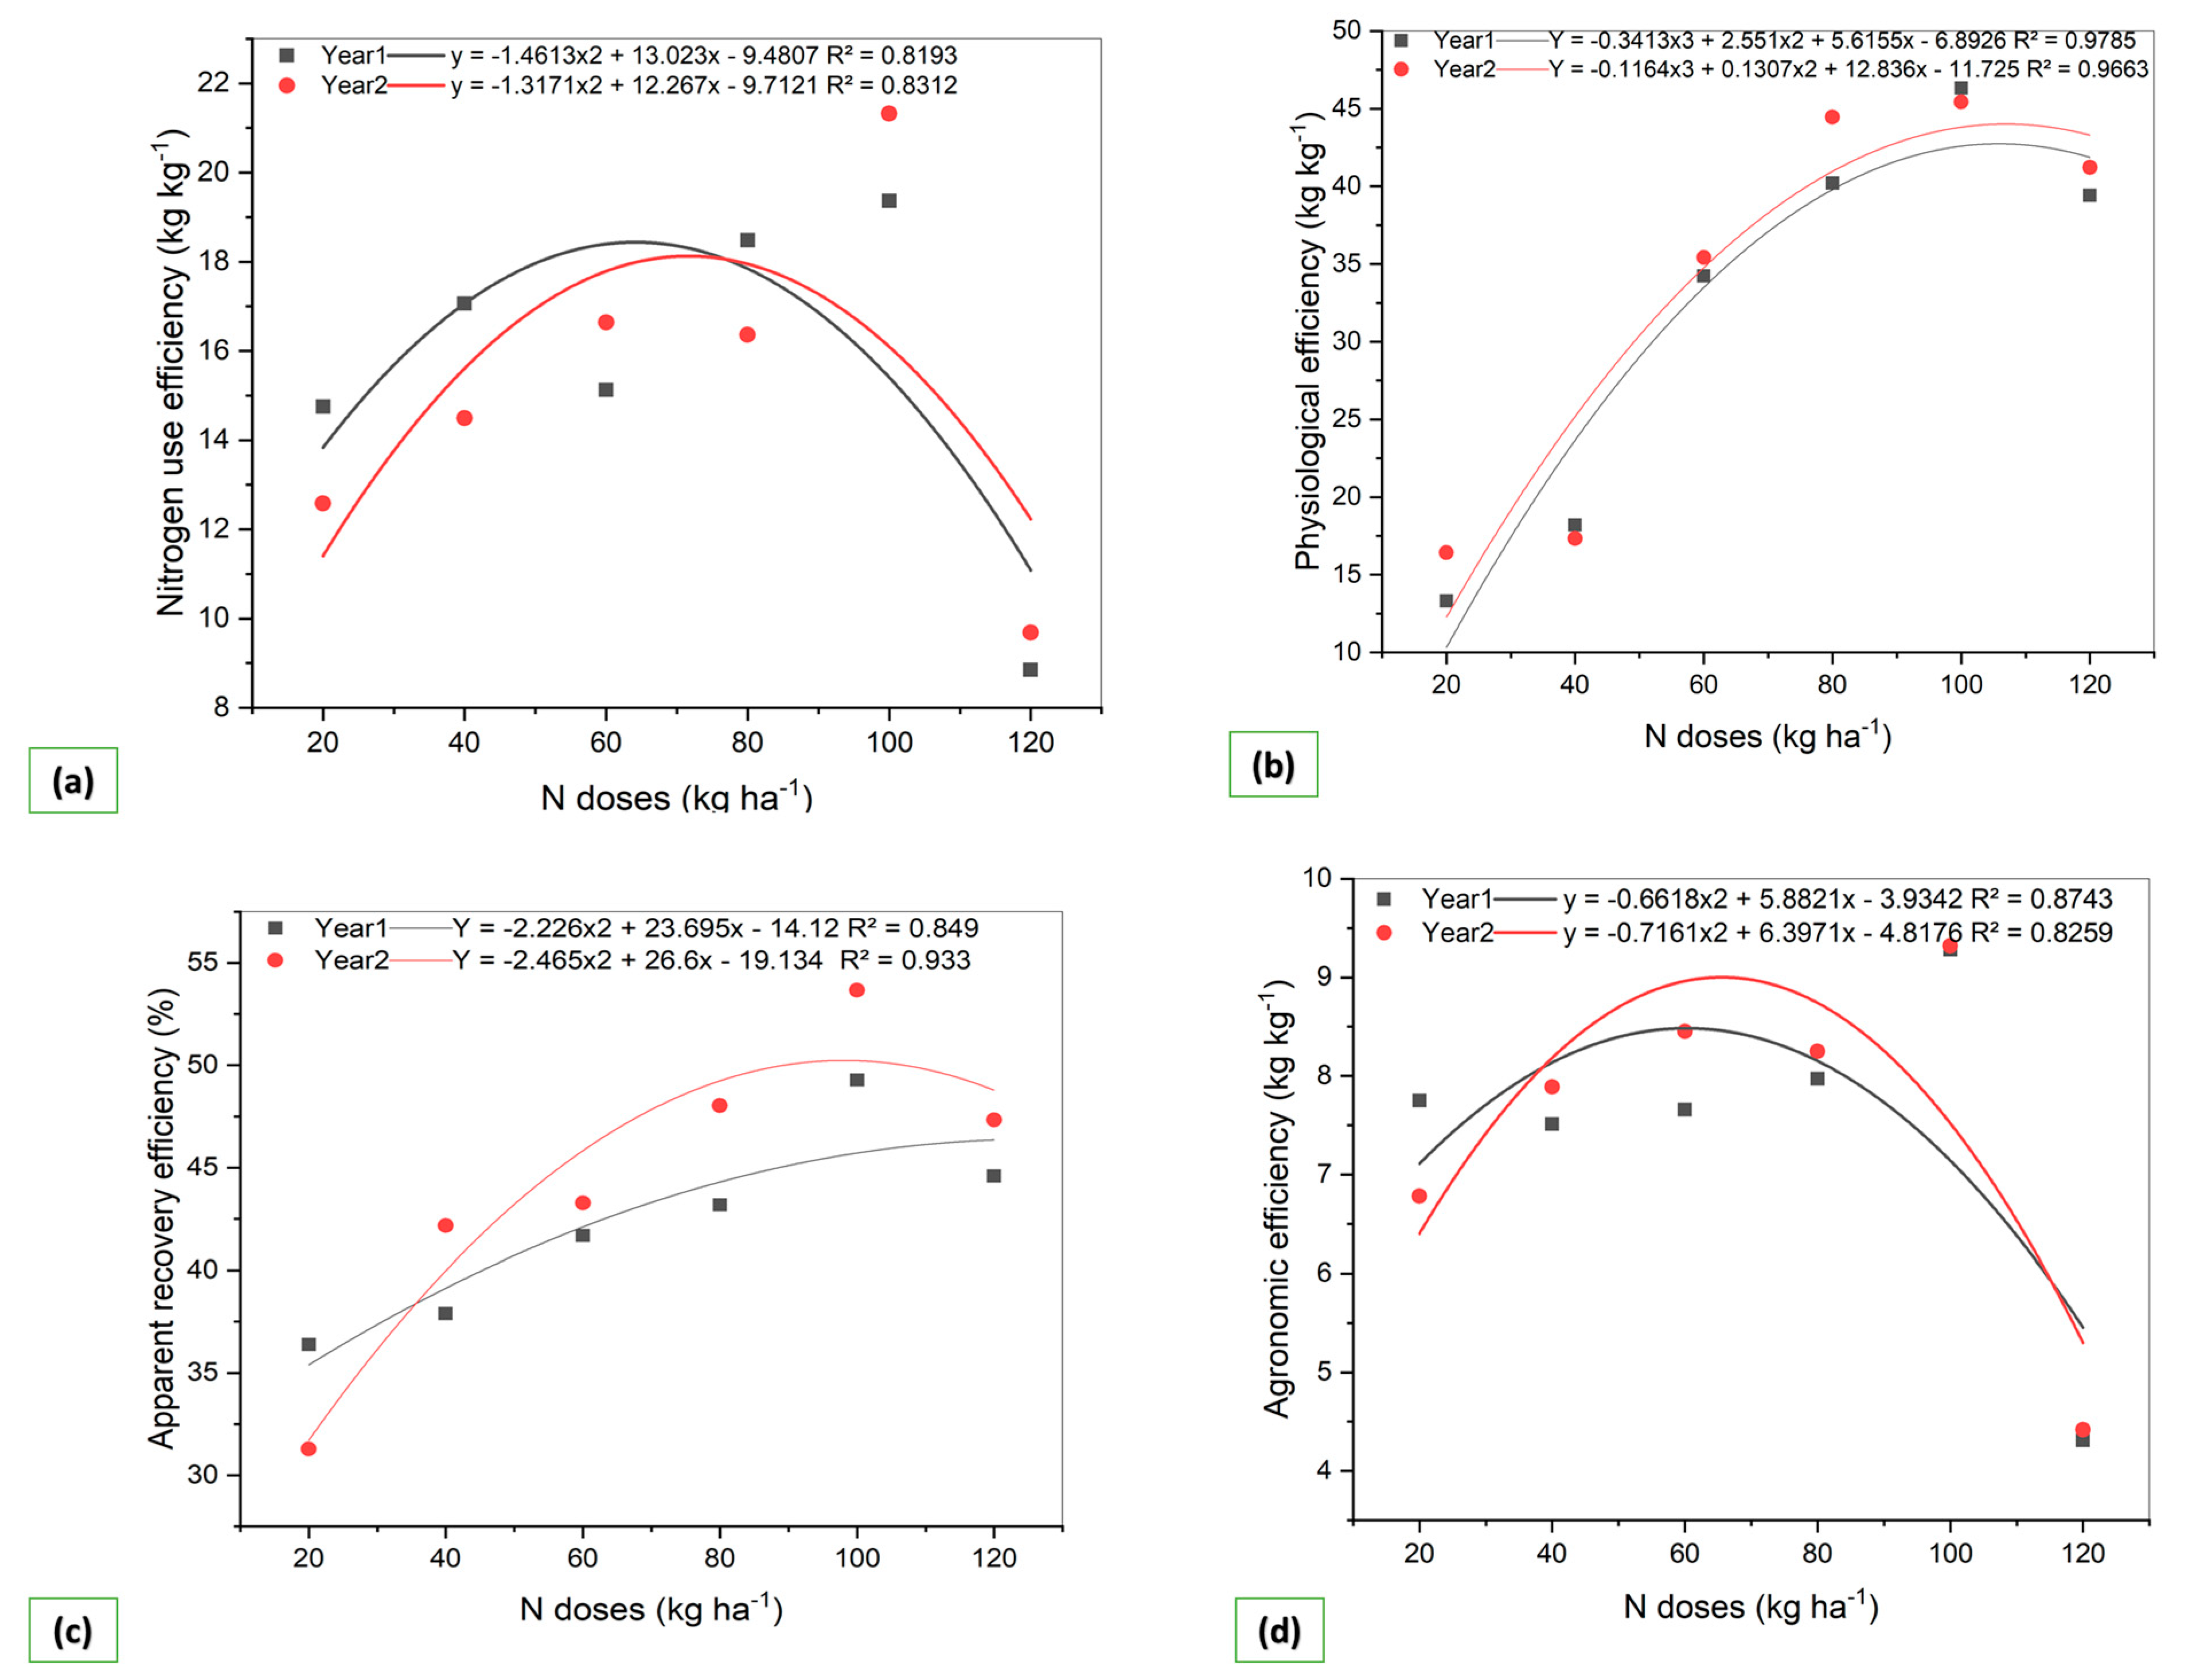
3.3. Impact of Fertilizer Levels of Nitrogen on Various Efficiencies of S. alba

In the present study, the different use efficiencies, i.e., agronomic efficiency (AR), apparent recovery efficiency (ARE), physiological efficiency (PE), and nitrogen use efficiency (NUE), were significantly influenced by different N fertilizer doses (p < 0.05). Nitrogen use efficiencies increased in response to increasing N fertilizer doses, following a quadratic model (Figure 5). In the quadratic model, β0 determines the concavity of the curve. If the β0 is a positive value, the curve opens upward; if the β0 is negative, the curve opens downward (n shape). The curve peak showed the maximum result at the optimum level, and a further increase in N fertilizer resulted in the peak moving downwards. There were clear trends showing that the NUE was significantly increased by the application of N fertilizer; thereafter, any further addition caused a decrease, as compared to the other treatments (Figure 5). During 2019–2020, the maximum (19.36 kg/kg) NUE, (47.312 kg/kg) PE, (9.327 kg/kg) AE, and (53.67 kg/kg) ARE were obtained from the optimum dose of 100 kg·ha−1, and the minimum was recorded at 20 kg·ha−1 of N fertilizer. During 2020–2021, the same trend was recorded for 100 kg·ha−1 N, as compared to the other treatments. Therefore, the N doses showed a significant positive impact on NUE, PE, ARE, and AE, with regression values of (0.83 > 0.81), (0.97 > 0.96), (0.93 > 0.84), and (0.87 > 0.82), respectively.

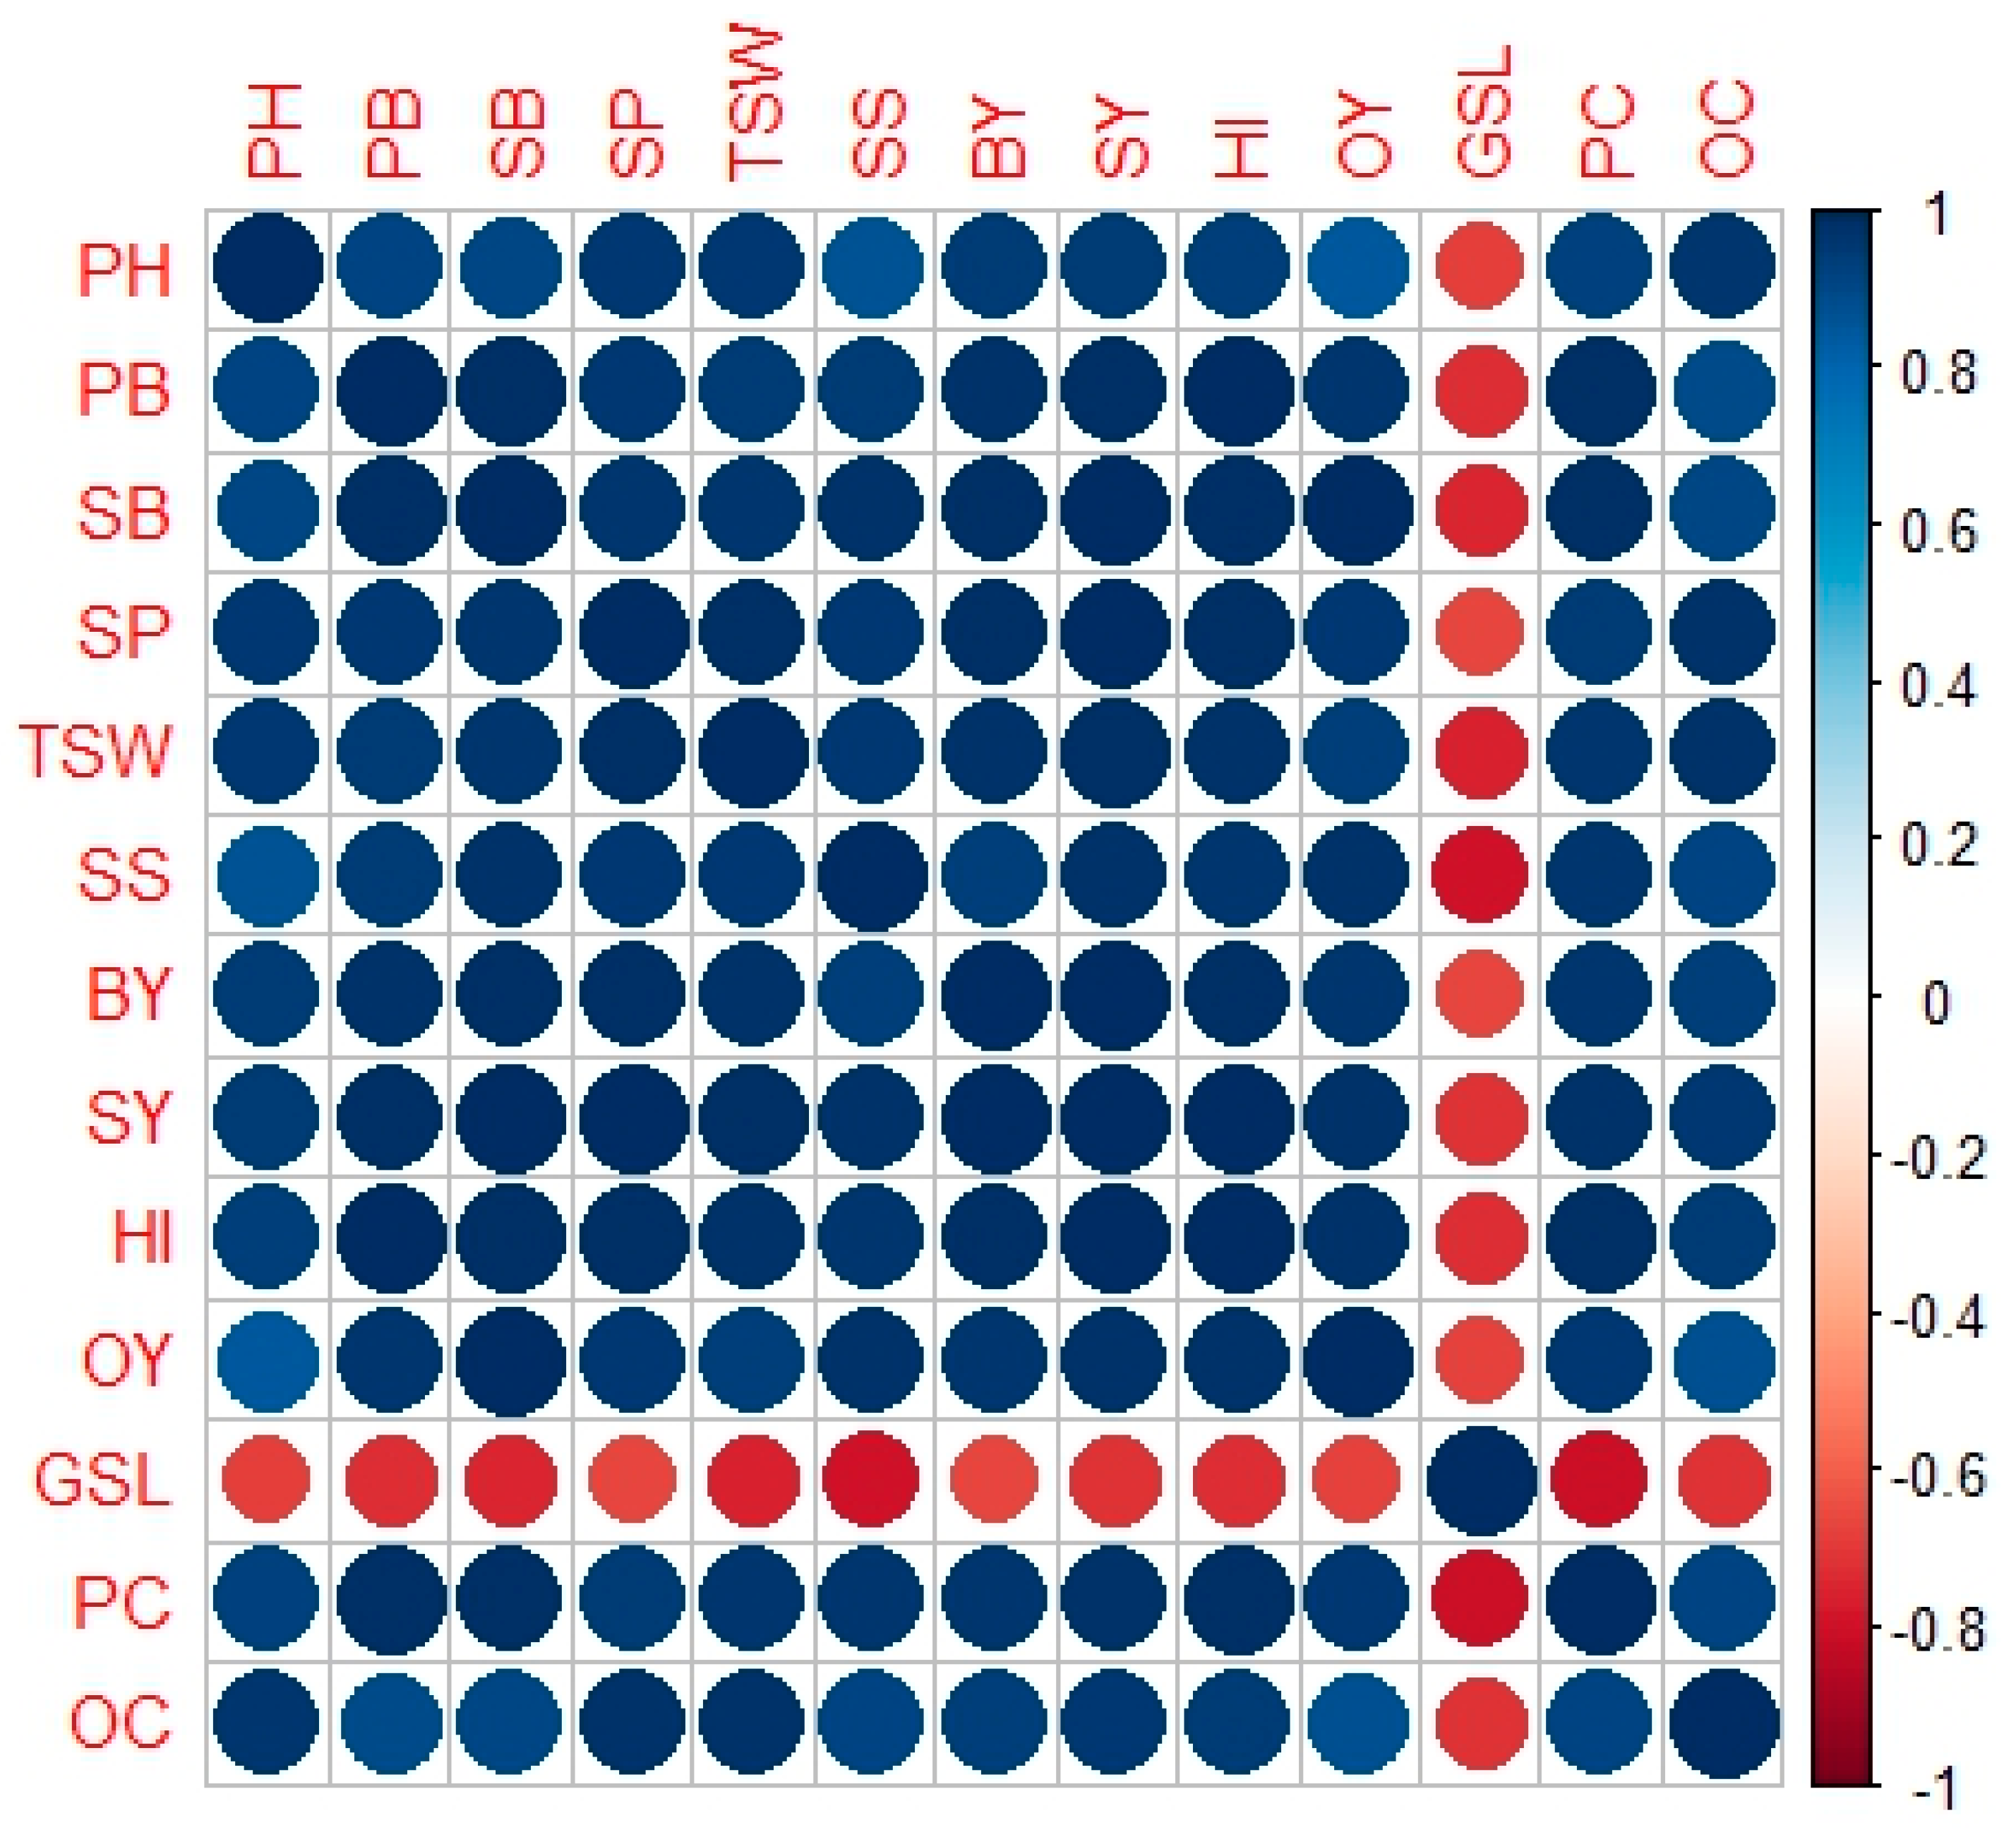
3.4. Correlation between Agro-Morphological and Seed Quality Traits of S. alba

Figure 6 indicates highly significantly (p < 0.01) positive and negative correlations among the different agro-morphological and bio-chemical attributes of white mustard, as influenced by different levels of N fertilizer. Seed yield was significantly and positively correlated with PH (rp = 0.98, p < 0.001), S/P (rp = 0.99, p < 0.001), PB (rp = 0.99, p < 0.001), SB (rp = 1.00, p < 0.001), seeds/S (rp = 0.99, p < 0.001), and TSW (rp = 0.99, p < 0.001). However, a significantly negative correlation was found for glucosinolate contents with PH (rp = −0.96, p < 0.005), S/P (rp = −0.87, p < 0.01), PB (rp = −0.92, p < 0.005), SB (rp = −0.93, p < 0.005), seeds/S (rp = −0.95, p < 0.005), and TSW (rp = −0.93, p < 0.005). Plant height was significantly positively correlated with S/P (rp = 0.96, p < 0.001), PB (rp = 0.99, p < 0.001), Sb (rp = 0.98, p < 0.001), seeds/S (rp = 0.98, p < 0.001), and TSW (rp = 0.96, p < 0.001). Siliques per plant (S/P) was also positively correlated PB (rp = 0.97, p < 0.001), SB (rp = 0.98, p < 0.001), seeds/S (rp = 0.99, p < 0.001), and TSW (rp = 0.97, p < 0.001). The number of primary branches per plant (PB) was positively correlated with SB (rp = 0.98, p < 0.001), seeds/S (rp = 0.99, p < 0.001), and TSW (rp = 0.99, p < 0.001). There were significant correlations between SB and seeds/S (rp = 0.99, p < 0.001); SB and TSW (rp = 0.96, p < 0.001); and seeds/S and TSW (rp = 0.98, p < 0.001).

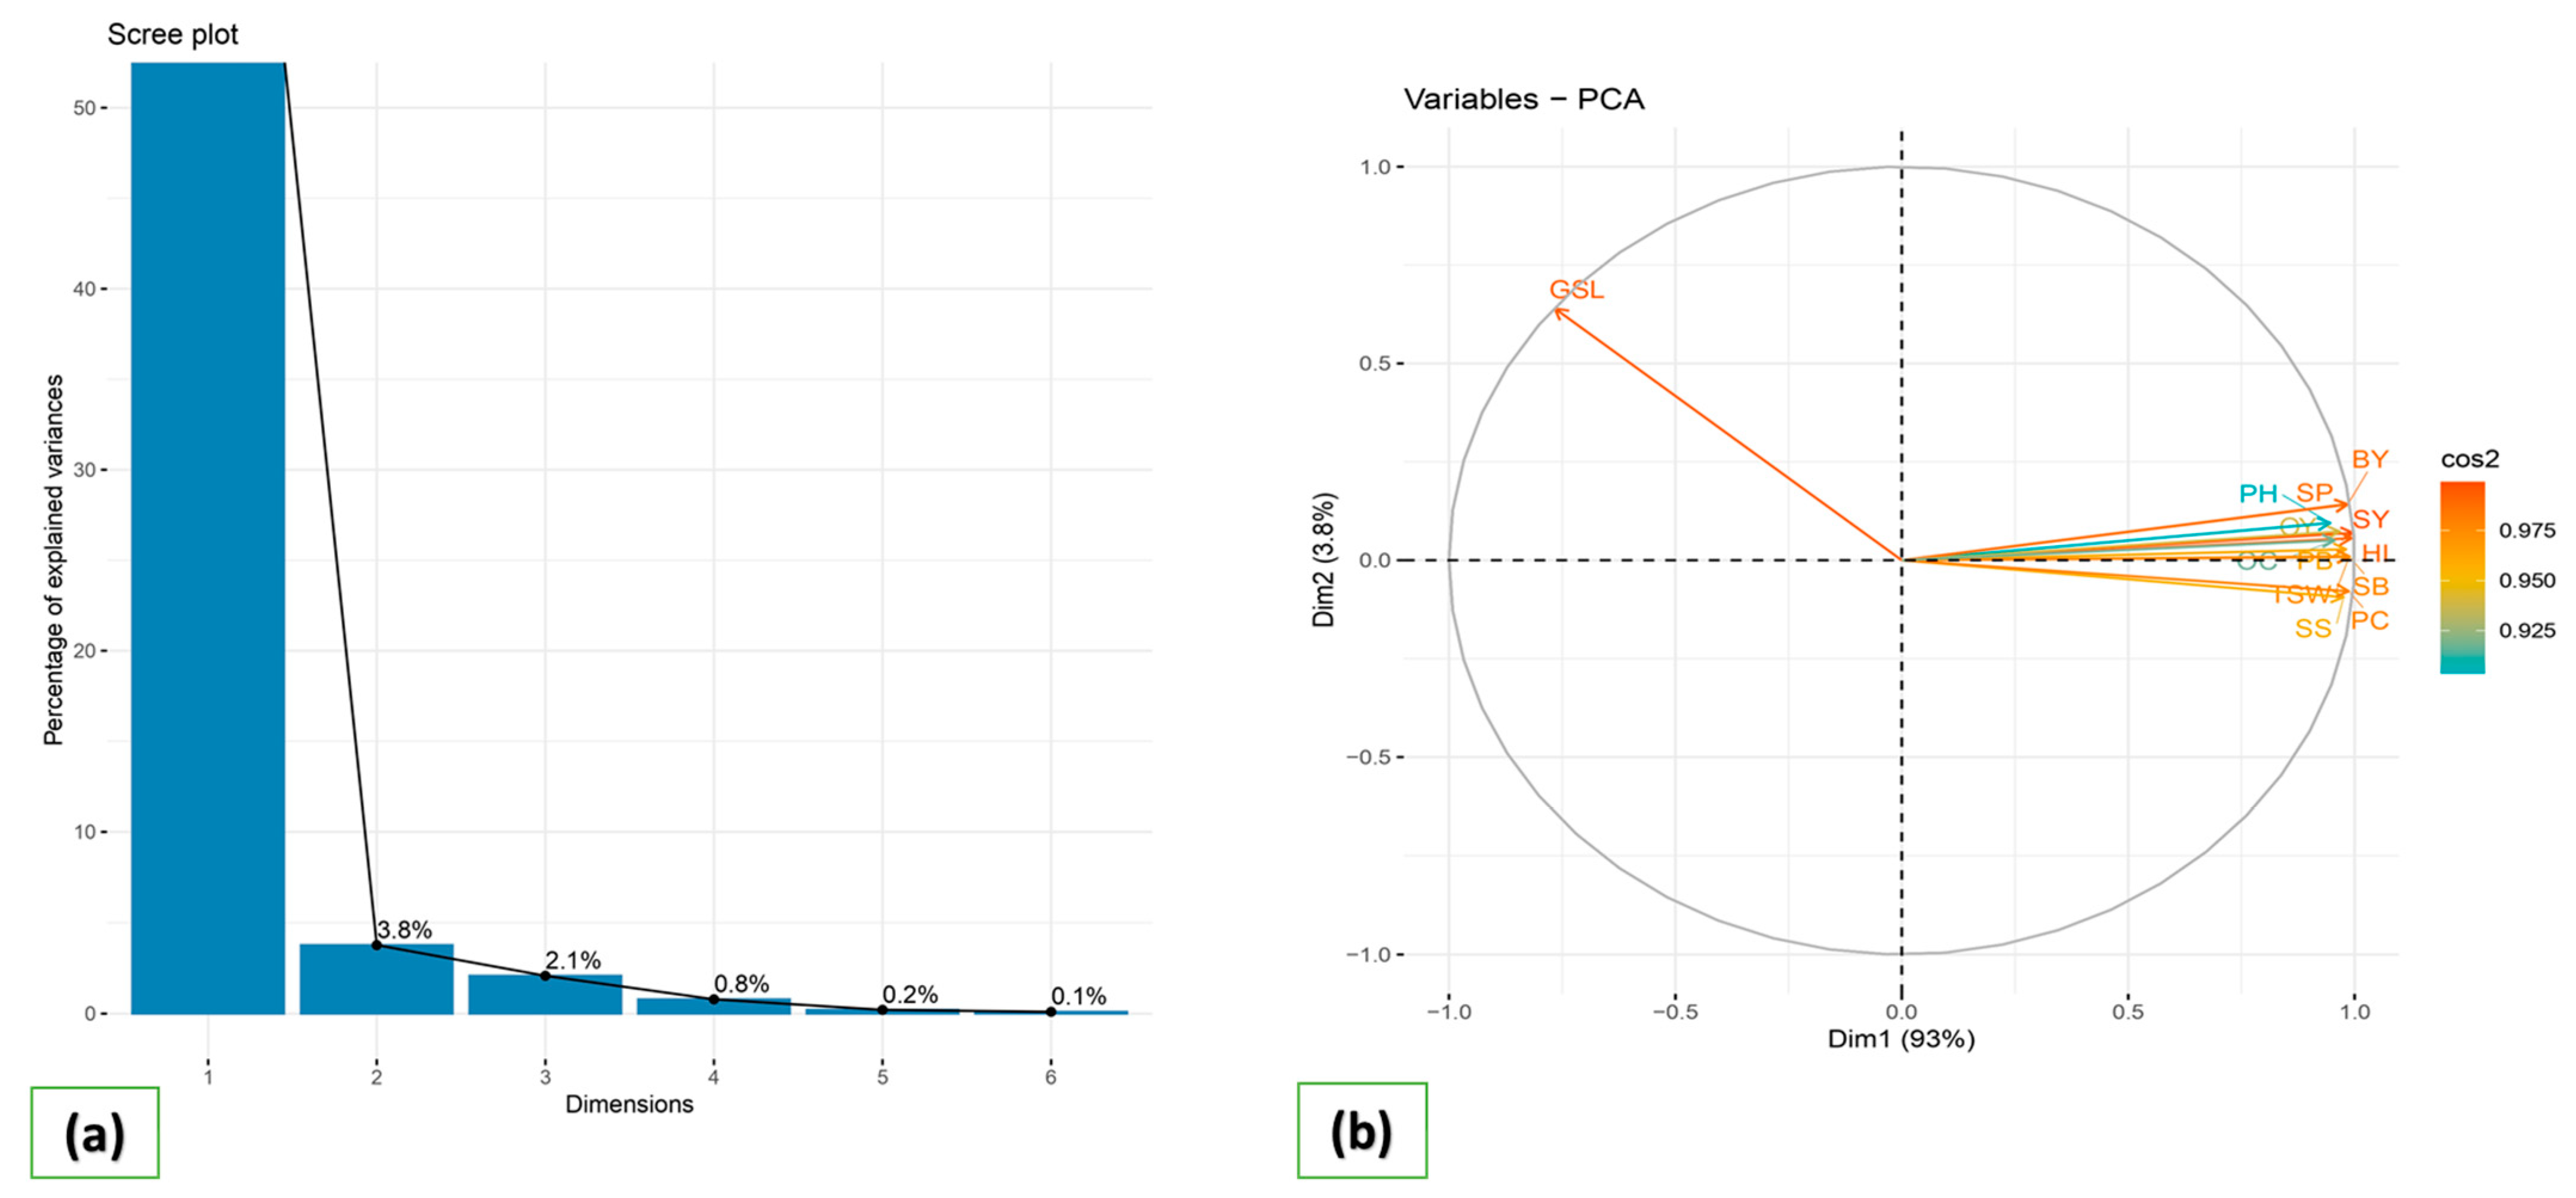
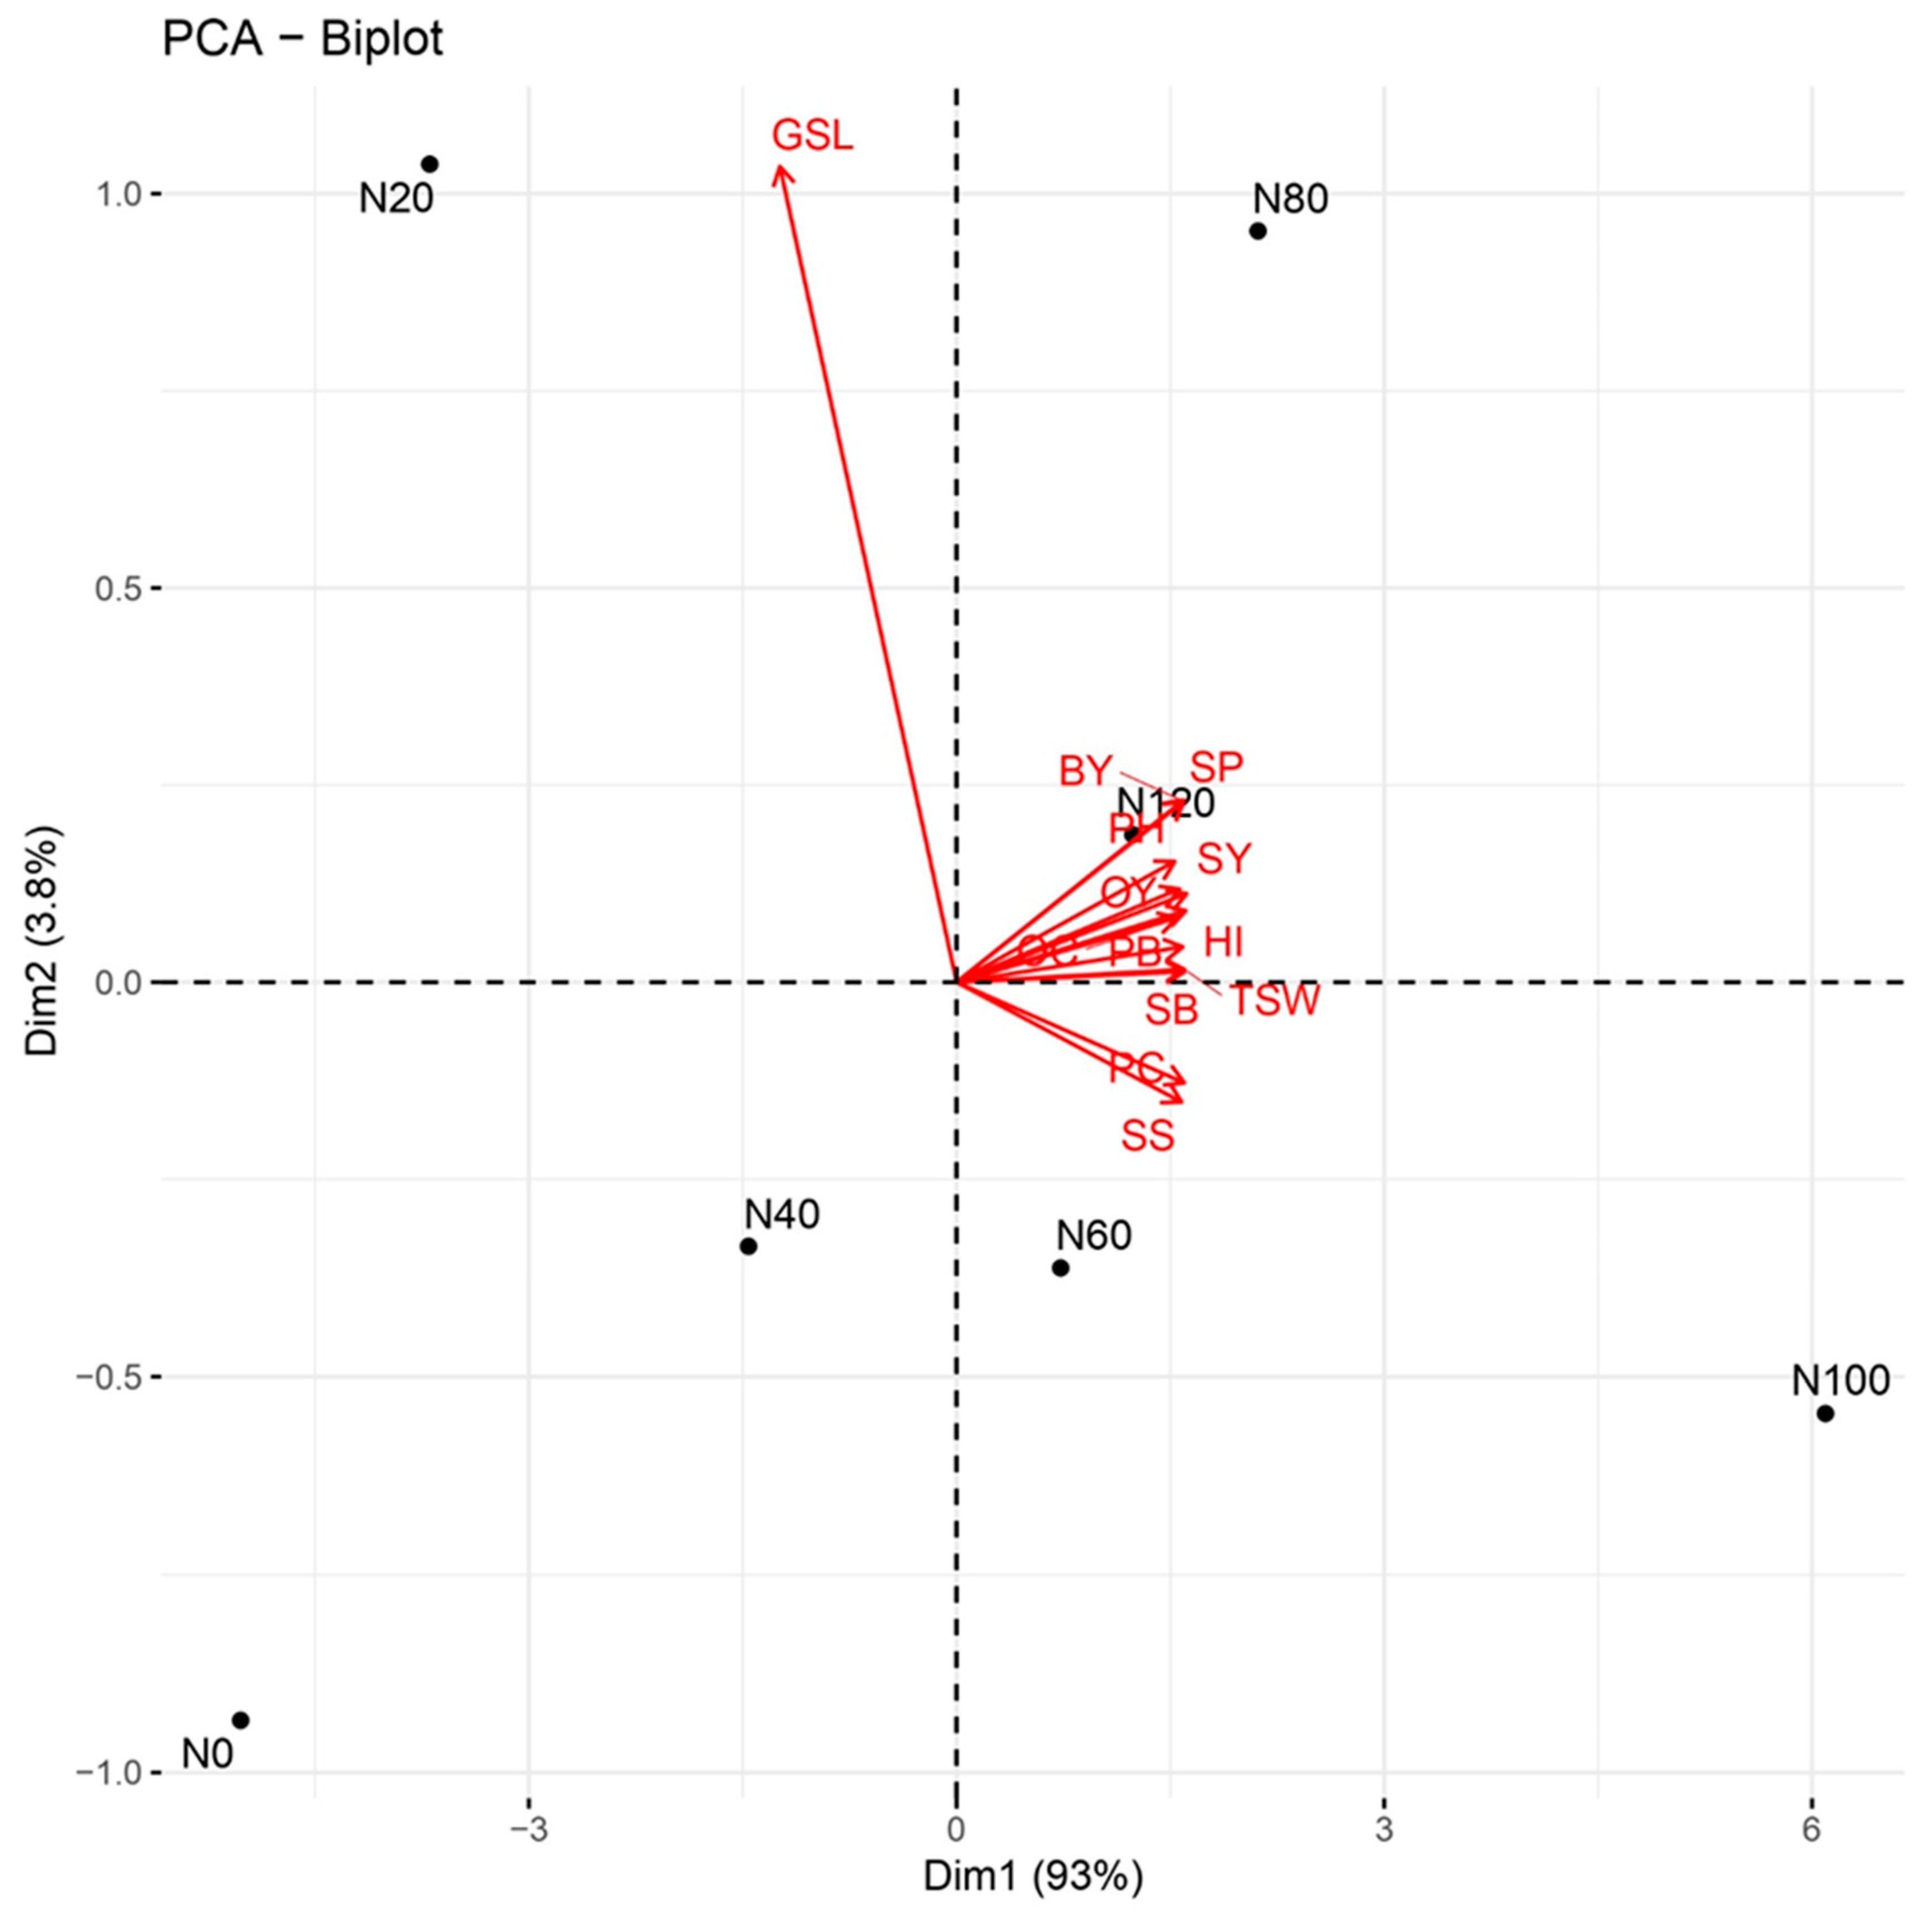
3.5. Principle Component Analysis (PCA) for Agro-Morphological and Seed Quality Traits of S. alba

Principal component analysis (PCA) was used to determine how different N fertilizer doses interacted with one another, as well as whether and to what extent their contents were related to one another. PCA is a method of multivariate statistical analysis based on the variable correlation matrix that is used to examine and simplify huge, complex datasets in order to observe attributes. PCA was carried out to show the dispersion of different variables of white mustard coordinated on the basis of their individual response to the different N fertilizer levels. In Figure 7 and Table 3, the examined features, i.e., the effect of nutrients on different variables, are presented in the first two main components: PC1 dimension 1 (Dim1) and second PC dimension 2 (Dim2). PC1 and PC2 explained the highest variability, at 93% and 3.8%, respectively, towards the total variability (Figure 7). In comparison, PH, PB, SB, SS, TSW, BY, and SY positively contributed (93%) maximally to PC1. Furthermore, GSL (3.8%) contributed to PC2. The PCA analysis based on a scree plot, which shows the eigenvalues and related principal component numbers was used to illustrate these values. Six principal components (PCs) were produced in total for this investigation. However, only two PCs were declared noteworthy, with the other PCs being classified as insignificant since they had eigenvalues of less than one. Specifically, PC1 had an eigenvalue of 12.09 and PC2 had a value of 0.49 (Figure 7 and Table 3).

3.6. Principal Component Analysis (PCA) for Agro-Morphological and Seed Quality Parameters of S. alba

PCA biplot analysis can be used to find features that can be divided into primary groups and subgroups based on their homogeneity and dissimilarity. The quantity and direction of loading vectors indicate a positive or negative contribution of variables to the total phenotypic diversity (Figure 8). Furthermore, the essential features (PH, PB, SB, SP, SS, TSW, BY, SY, HI, and OY) that contributed significantly to the computed variance were assigned to the positive side of the loading plot. In contrast, left-aligned characters such as GSL had a negative impact on the overall diversity. The treatment distances showed the degree of difference between the measured variables. For one or more criteria, the variables on either the positive or negative side of the biplot had a comparable phenotypic performance (Figure 8). Furthermore, the treatment distances between variables furthest from the origin were the highest. As a result, the optimum N doses, 120 kg·ha−1 and 80 kg·ha−1, distributed at the score plots in extreme places, exhibited the widest phenotypic variety.

4. Discussion

The current results validate the hypothesis that the examined optimized of nitrogen dose for S. alba in the rainfed region also enhance the growth, yield, and different use efficiencies of the crop. The application of N showed a consistent and progressive increase in agro-morphological, seed quality and quantity attributes, and nitrogen use efficacies up to 100 kg·ha−1; thereafter, further addition of nitrogen caused a decrease in these attributes [34,35]. According to Razaq et al. [36] concluded that a higher level of N fertilizer caused an increase in plant height, as compared to a low level of N fertilizer. In terms of plant height, in this study, significant differences were observed among the different nitrogen doses. The maximum plant height was recorded at an optimum N fertilizer concentration, while the shortest height was observed in the control group (Figure 1). The optimum level of nitrogen stimulates the production of cytokines, which affects the flexibility of cell walls, the proliferation of meristematic cells, and overall cell growth [37]. However, Kukal [38] was of the view that the high temperature of the air and soil causes the alteration in water transport in the plant, which ultimately reduces stomatal conductance and causes low productivity and yield. Quantitatively, N fertilizer is the most important mineral required for the proper growth and development of plants. This also plays a significant role in the architecture of the vegetative and reproductive organs of a plant. Consequently, using N fertilizer at the optimum level increases crop yield factors such as branches, pod number, seed weight, etc. [39]. In the present study, increasing the level of N fertilizer increased the number of secondary branches. Our findings were consistent with the findings of Seepaul et al. [40], who applied four different concentrations of N (56, 84, 112, and 140 kg·ha−1); the higher doses (112 and 140 kg·ha−1) significantly increased the number of SB of Ethiopian mustard.
These results are in line with those of Achakzai and Bangulzai [41], who were of the view that all levels of N significantly increased the silique number, as compared to the control, and the number of siliques also increased by increasing the level of N in a mustard crop. However, the number of siliques per plant decreased at the highest level of N (120 kg·ha−1) in our studies. The application of essential nutrients to plants is necessary for obtaining a good yield [42]. In the current study, the positive impact of nitrogen fertilizer on the number of seed per silique of Sinapis alba was observed and it was found that the number of seed per silique increased by increasing the level of N. Our findings are supported by the studies of Aminpanah et al. [43] who reported that the use of N fertilizer enhanced the number of seed per silique in a brassica crop. According to Sokólski et al. [44], nitrogen fertilizer had the most positive effect on TSW. Further, Öztürk [45] also stated that the 100 kg·ha−1 level of N caused an increase in the TSW of a brassica crop. Our results regarding the increase in TSW after the application of N fertilizer were supported by Williams et al. [46], who concluded that the brassica species are high nitrogen-demanding crops, and thus respond positively to optimum or near-optimal N application. Similarly, by improving the levels of fertilizers, seed components are also upgraded. The TSW in both seasons at the 100 kg·ha−1 level of N significantly differed from each other (Figure 2). The difference might be due to variations in fertilizer uptake efficiency on the basis of environmental conditions like rainfall, fog, frost, etc. [47].
In the present study, it was observed that BY yield was highly responsive to the levels of N fertilizer up to a concentration of 100 kg·ha−1; a further increase in the N level caused a decline in BY. Similar results were described by Gan et al. [32], who concluded that the yield of different brassica species was highly responsive to the N fertilizer levels from zero to 100 kg·ha−1, but thereafter, the level of response to N fertilizer declined. Data show that the BY during 2020–2021 at a concentration of 80 kg·ha−1 of N fertilizer was greater than the BY during 2019–2020 at a N fertilizer concentration of 100 kg·ha−1; however, this was not significantly different. The reason for the decrease in BY during 2019–2020, as compared to the BY during 2020–2021, might be due to the low uptake efficiency of nutrients during crop development. A critical concentration of N is necessary to obtain maximum plant growth. However, during the growth of the crop, this critical concentration declined at some stages due to different factors and caused a low yield or biomass accumulation [48]. Our findings regarding the escalation in seed yield by increasing the level of N are supported by the findings of the Youssef et al. [49], who concluded that the application of nitrogen fertilizer has a vital role in increasing crop productivity. Similarly, Umar et al. [50] stated that the application of N at rate of 46–100 kg·ha−1 gave the maximum seed yield of a canola crop, and when the rate of N was lower than 46 kg·ha−1, the seed yield was badly affected. In the current study, the harvest index (HI) increased with increasing N levels up to the optimum level, as shown in Figure 4. The findings of Yahbi et al. [51] are also supportive of our findings as they experimented with the impact of different N levels (0, 30, 60, and 90 kg·ha−1) on Brassica napus and observed that the highest HI occurred from 60 and 90 kg·ha−1 of N.
The current study’s results are in line with the findings of Potdar et al. [52] who reported, through the combined application of N and FYM, a significant improvement of oil content in mustard. Similarly, Diederichsen et al. [52] reported that different levels of N (20–120 kg·ha−1) did not significantly affect the oil content of Sinapis alba. Our results were supported by the findings of Aminpanah [43], who applied 0, 50, 100, 150, and 200 kg·ha−1 doses of nitrogen to Brassica napus and concluded that different doses of N did not significantly affect the oil contents in the seed. The difference between the years might be due to higher precipitation occurring in growing months (October–April) during 2019–2020, as compared to in 2020–2021 (Table 2). It was also previously reported by Öztürk et al. [45] that high precipitation may cause higher oil contents in the crop. In the current study, at a level of 100 kg·ha−1 N, maximum protein contents were noted. Protein content, which is considered an important quality standard in oil crops, can be affected by environmental factors such as temperature and precipitation [34]. In general, the protein contents of the S. alba plants were higher in 2019–2020 than in 2020–2021.
It was observed that the GS content increased non-significantly in the seed of S. alba in response to N fertilization. These observations were in line with the findings of the Kim et al. [53] who evaluated the impact of N and S fertilizers on glucosinolate content in the edible portions of Brassica napus and concluded that the use of fertilizers slightly increased the GS content. The findings of Øvsthus et al. [54] are also supportive of our study as they reported that the application of fertilizer caused the increase in GS contents. In the present study, the analysis of variance revealed that nitrogen fertilizer had a significant impact on nitrogen use efficiency (NUE), which describes the overall increase in crop growth and seed yield of S. alba in relation to the amount of applied nitrogen. The results obtained were in line with the findings of Nayak et al. [55], who concluded that the optimum level of fertilizer increases the nutrient use efficiency, and a further increase in the doses of N decreases the NUE. Waqar et al. [56] also reported that the optimum level of fertilizer increases the nutrients uptake efficiency. During first growing season, NUE was higher, as compared to the second growing season. The reason for this might be the comparatively low temperature during the growing season (Table 2). Our findings were also supported by a study evaluating how temperature affects nutrients uptake from the soil, that ultimately found that the NUE was also affected [57].
Different levels of nitrogen fertilizer exhibit significant differences for physiological efficiency [58]. The physiological efficiency is directly related to the dry matter yield, and the dry matter accumulation was directly dependent upon the utilization of fertilizers. By increasing the level of N, dry matter increased [59]. Therefore, ultimately, the physiological efficiency was also increased in the current study. Our findings are in line with the findings of Nayak et al. [55] who concluded that the optimum dose of fertilizer increases the agronomic efficiency. The authors in [60] also reported that the N fertilizer increases the nutrient uptake efficiency. Nitrogen is a vital nutrient that is involved in the metabolic activities of plants and also plays a role in the transformation of energy [61]. In the current study, different levels of nitrogen affected the NUE in a significant way. The study conducted by Liao et al. [39] on the effect of the biochar-based controlled release of N on the nutrient use efficiency of a Brassica napus crop concluded that a higher nitrogen concentration in the soil during the reproductive stage of the crop improved the uptake of N and, ultimately, its use efficiency.

5. Conclusions

The results of the current study indicate that Sinapis alba has the potential to be grown in Pakistan as an alternate oil crop that is drought and shatter resistant. For proper vegetative and reproductive growth, it is necessary to apply nitrogen fertilizer at an optimum level (100 kg·ha−1). The application of N fertilizer significantly improved the agro-morphological and qualitative parameters. Furthermore, nitrogen use efficiency, agronomic efficiency, apparent recovery efficiency, and physiological efficiency were also improved by using nitrogen fertilizer. Further study can be carried out regarding the use of nitrogen fertilizer in combination with other essential nutrients at an optimum level to further improve the production of S. alba.

Author Contributions

E.U.H. designed and performed the experiment, writing of the original draft, methodology, formal analysis.; F.U.H. designed and supervised the experiment, visualization, writing—review and editing; A.M. and G.S. provided the lab facilities; X.G., M.F.A., M.F.K., F.Z. and P.J.H.K. writing—review and editing; I.H.S. correspondence, supervision, funding acquisition and writing—review and editing. All authors have read and agreed to the published version of the manuscript.

Funding

This research was financially supported by the Sino-Pakistan Project NSFC Grant No. 31961143008; the National Natural Science Foundation of China, International (Regional) Cooperation and Exchange Program, Research fund for International Young Scientists, Grant No. 31750110462 and 32250410280; the Jiangsu Collaborative Innovation Centre for Modern Crop Production (JCIC-MCP) China; and the Key Laboratory of State Forestry and Grassland Administration on the Highly Efficient Utilization of Forestry Biomass Resources in Southwest China (SKLUWRE) 2020-KF15.

Data Availability Statement

Data generated or analyzed during this study are provided within the published article.

Acknowledgments

The authors are grateful to the management of the University Research Farm Koont, Chakwal Road, Rawalpindi for providing the necessary facilities to carry out this research.

Conflicts of Interest

The authors declare no conflict of interest.

References

  1. Economic Survey of Pakistan. 2022. Available online: https://kpmg.com/pk/en/home/insights/2022/06/pakistan-economic-brief-2022.html (accessed on 4 May 2023).
  2. Cheng, F.; Wu, J.; Wang, X. Genome triplication drove the diversification of Brassica plants. Hortic. Res. 2014, 1, 14024. [Google Scholar] [CrossRef] [PubMed] [Green Version]
  3. Cartea, M.E.; Francisco, M.; Soengas, P.; Velasco, P. Phenolic Compounds in Brassica Vegetables. Molecules 2011, 16, 251–280. [Google Scholar] [CrossRef]
  4. Cartea, E.; De Haro-Bailón, A.; Padilla, G.; Obregón-Cano, S.; del Rio-Celestino, M.; Ordás, A. Seed Oil Quality of Brassica napus and Brassica rapa Germplasm from Northwestern Spain. Foods 2019, 8, 292. [Google Scholar] [CrossRef] [PubMed] [Green Version]
  5. Imran; Amanullah; Al Tawaha, A.R. Regenerating Potential of Dual Purpose Rapeseed (Brassica napus L.) as Influenced by Decapitation Stress and Variable Rates of Phosphorous. Commun. Soil Sci. Plant Anal. 2022, 54, 534–543. [Google Scholar] [CrossRef]
  6. Siddiqui, M.A.; Aslam, M.M.; Khan, M.T.; Yasmeen, S.; Iqbal, R.; Sial, M.A.; Khan, I.A. Allometric parameters assessment in canola under different macro and micronutrient regimes. Pak. J. Bot. 2021, 54, 1097–1101. [Google Scholar] [CrossRef]
  7. Katepa-Mupondwa, F.; Gugel, R.K.; Raney, J.P. Genetic diversity for agronomic, morphological and seed quality traits in Sinapis alba L. (yellow mustard). Can. J. Plant Sci. 2006, 86, 1015–1025. [Google Scholar] [CrossRef] [Green Version]
  8. Falasca, S.; Ulberich, A. Argentina’s semiarid lands aptitude to cultivate non-traditional species for biodiesel production. In Biodiesel: Blends, Properties and Applications; Marchetti, J.M., Fang, Z., Eds.; Nova Science Publishers, Inc.: New York, NY, USA, 2011; pp. 123–150. [Google Scholar]
  9. Mitrović, P.M.; Stamenković, O.S.; Banković-Ilić, I.; Djalović, I.G.; Nježić, Z.B.; Farooq, M.; Siddique, K.H.M.; Veljković, V.B. White Mustard (Sinapis alba L.) Oil in Biodiesel Production: A Review. Front. Plant Sci. 2020, 11, 299. [Google Scholar] [CrossRef]
  10. Arif, M.; Shehzad, M.A.; Mushtaq, S. Inter and intra row spacing effects on growth, seed yield and oil contents of white mustard (Sinapis alba L.) under rainfed conditions. Pak. J. Agric. Sci. 2012, 49, 21–25. [Google Scholar]
  11. Alcántara, C.; Pujadas, A.; Saavedra, M. Management of Sinapis alba subsp. mairei winter cover crop residues for summer weed control in southern Spain. Crop Prot. 2011, 30, 1239–1244. [Google Scholar] [CrossRef]
  12. Barłóg, P.; Grzebisz, W. Effect of timing and nitrogen fertilizer application on winter oilseed rape (Brassica napus L.): II—Nitrogen uptake dynamics and fertilizer efficiency. J. Agron. Crop Sci. 2004, 190, 314–323. [Google Scholar] [CrossRef]
  13. Veronica, M.A.P. The Production of a Potential Feedstock for Biodiesel Using Water and Isopropyl Alcohol to Extract Yellow Mustard Oil; Master of Applied Science, Graduate Department of Chemical Engineering and Applied Chemistry, University of Toronto: Toronto, ON, Canada, 2010; Available online: https://www.utoronto.ca/2010 (accessed on 10 January 2023).
  14. Haq, E.U.; Hassan, F.U.; Iqbal, M.; Ahmed, M.; Ghuffar, S.; Ahmed, J.; Ahmed, R.; Shahbaz, M.; Rehman, A.U.; Hamzah, A.M. Effects of micronutrients (Boron and Zinc) as foliar application on growth and yield of Camelina sativa L. Plant CELL Biotechnol. Mol. Biol. 2022, 23, 1–11. [Google Scholar] [CrossRef]
  15. Jarecki, W. The Reaction of Winter Oilseed Rape to Different Foliar Fertilization with Macro- and Micronutrients. Agriculture 2021, 11, 515. [Google Scholar] [CrossRef]
  16. Yang, Z.; Chen, Y.; Wang, Y.; Xia, H.; Zheng, S.; Xie, S.; Cao, Y.; Liu, J.; Sehar, S.; Lin, Y.; et al. Nitrogen metabolic rate and differential ammonia volatilization regulate resistance against opportunistic fungus Alternaria alternata in tobacco. Front. Plant Sci. 2022, 13, 1003534. [Google Scholar] [CrossRef] [PubMed]
  17. Montemurro, F.; Diacono, M. Towards a Better Understanding of Agronomic Efficiency of Nitrogen: Assessment and Improvement Strategies. Agronomy 2016, 6, 31. [Google Scholar] [CrossRef]
  18. Bingham, I.J.; Garzon, D.C. Relative contribution of soil N availability and grain sink demand to the control of post-anthesis N uptake by field-grown spring barley. Field Crops Res. 2023, 292, 108829. [Google Scholar] [CrossRef]
  19. Tilman, D.; Cassman, K.G.; Matson, P.A.; Naylor, R.; Polasky, S. Agricultural sustainability and intensive production practices. Nature 2002, 418, 671–677. [Google Scholar] [CrossRef]
  20. Lassaletta, L.; Billen, G.; Grizzetti, B.; Anglade, J.; Garnier, J. 50 year trends in nitrogen use efficiency of world cropping systems: The relationship between yield and nitrogen input to cropland. Environ. Res. Lett. 2014, 9, 105011. [Google Scholar] [CrossRef]
  21. Robertson, G.P.; Bruulsema, T.W.; Gehl, R.J.; Kanter, D.; Mauzerall, D.L.; Rotz, C.A.; Williams, C.O. Nitrogen–climate interactions in US agriculture. Biogeochemistry 2012, 114, 41–70. [Google Scholar] [CrossRef] [Green Version]
  22. Wang, Z.-H.; Li, S.-X. Nitrate N loss by leaching and surface runoff in agricultural land: A global issue (a review). Adv. Agron. 2019, 156, 159–217. [Google Scholar] [CrossRef]
  23. Cameron, K.C.; Di, H.J.; Moir, J.L. Nitrogen losses from the soil/plant system: A review. Ann. Appl. Biol. 2013, 162, 145–173. [Google Scholar] [CrossRef]
  24. Gan, Y.; Malhi, S.S.; Brandt, S.; Katepa-Mupondwa, F.; Kutcher, H.R. Brassica juncea Canola in the Northern Great Plains: Responses to Diverse Environments and Nitrogen Fertilization. Agron. J. 2007, 99, 1208–1218. [Google Scholar] [CrossRef]
  25. Isfan, D. Nitrogen physiological efficiency index in some selected spring barley cultivars. J. Plant Nutr. 1990, 13, 907–914. [Google Scholar] [CrossRef]
  26. Rathke, G.-W.; Behrens, T.; Diepenbrock, W. Integrated nitrogen management strategies to improve seed yield, oil content and nitrogen efficiency of winter oilseed rape (Brassica napus L.): A review. Agric. Ecosyst. Environ. 2006, 117, 80–108. [Google Scholar] [CrossRef]
  27. Roussis, I.; Kakabouki, I.; Beslemes, D.; Tigka, E.; Kosma, C.; Triantafyllidis, V.; Mavroeidis, A.; Zotos, A.; Bilalis, D. Nitrogen Uptake, Use Efficiency, and Productivity of Nigella sativa L. in Response to Fertilization and Plant Density. Sustainability 2022, 14, 3842. [Google Scholar] [CrossRef]
  28. Minter, D.L.; Westerman, R.L.; Johnson, G.V. Humidification for ICAP-AES analysis of salt extracts of soils. Commun. Soil Sci. Plant Anal. 1990, 21, 1587–1606. [Google Scholar] [CrossRef]
  29. Malcolm, B.; Cameron, K.; Curtin, D.; Di, H.; Beare, M.; Johnstone, P.; Edwards, G. Organic matter amendments to soil can reduce nitrate leaching losses from livestock urine under simulated fodder beet grazing. Agric. Ecosyst. Environ. 2018, 272, 10–18. [Google Scholar] [CrossRef]
  30. Bremner, J.M.; Hauck, R.D. Advances in Methodology for Research on Nitrogen Transformations in Soils. Nitrogen Agric. Soils 1982, 22, 467–502. [Google Scholar] [CrossRef]
  31. Sato, S.; Hirayama, T.; Hirazawa, N. Lipid content and fatty acid composition of the monogenean Neobenedenia girellae and comparison between the parasite and host fish species. Parasitology 2008, 135, 967–975. [Google Scholar] [CrossRef]
  32. Gan, Y.; Malhi, S.S.; Brandt, S.; Katepa-Mupondwa, F.; Stevenson, C. Nitrogen Use Efficiency and Nitrogen Uptake of juncea Canola under Diverse Environments. Agron. J. 2008, 100, 285–295. [Google Scholar] [CrossRef]
  33. Steel, R.G.D.; Torrie, J.H. Principles and Procedures of Statistics, a Biometrical Approach, 2nd ed.; McGraw-Hill Kogakusha, Ltd.: New York, NY, USA, 1980. [Google Scholar]
  34. Guarda, G.; Padovan, S.; Delogu, G. Grain yield, nitrogen-use efficiency and baking quality of old and modern Italian bread-wheat cultivars grown at different nitrogen levels. Eur. J. Agron. 2004, 21, 181–192. [Google Scholar] [CrossRef]
  35. Zhao, K.; Yang, Y.; Peng, H.; Zhang, L.; Zhou, Y.; Zhang, J.; Du, C.; Liu, J.; Lin, X.; Wang, N.; et al. Silicon fertilizers, humic acid and their impact on physicochemical properties, availability and distribution of heavy metals in soil and soil aggregates. Sci. Total Environ. 2022, 822, 153483. [Google Scholar] [CrossRef] [PubMed]
  36. Razaq, M.; Zhang, P.; Shen, H.-L. Influence of nitrogen and phosphorous on the growth and root morphology of Acer mono. PLoS ONE 2017, 12, e0171321. [Google Scholar] [CrossRef] [PubMed] [Green Version]
  37. Wierzbowska, J.; Cwalina-Ambroziak, B.; Bogucka, B. The Effect of Nitrogen Fertilization on Yield and Macronutrient Concentrations in Three Cultivars of Jerusalem Artichoke (Helianthus tuberosus L.). Agronomy 2021, 11, 2161. [Google Scholar] [CrossRef]
  38. Kukal, M.; Irmak, S.; Dobos, R.; Gupta, S. Atmospheric dryness impacts on crop yields are buffered in soils with higher available water capacity. Geoderma 2023, 429, 116270. [Google Scholar] [CrossRef]
  39. Liao, J.; Liu, X.; Hu, A.; Song, H.; Chen, X.; Zhang, Z. Effects of biochar-based controlled release nitrogen fertilizer on nitrogen-use efficiency of oilseed rape (Brassica napus L.). Sci. Rep. 2020, 10, 11063. [Google Scholar] [CrossRef]
  40. Seepaul, R.; Kumar, S.; Iboyi, J.E.; Bashyal, M.; Stansly, T.L.; Bennett, R.; Boote, K.J.; Mulvaney, M.J.; Small, I.M.; George, S.; et al. Brassica carinata: Biology and agronomy as a biofuel crop. GCB Bioenergy 2021, 13, 582–599. [Google Scholar] [CrossRef]
  41. Achakzai, A.K.K.; Bangulzai, M.I. Effect of various levels of nitrogen fertilizer on the yield and yield attributes of pea (Pisum sativum L.) cultivars. Pak. J. Bot. 2006, 38, 331. [Google Scholar]
  42. Chrysargyris, A.; Höfte, M.; Tzortzakis, N.; Petropoulos, S.A.; Di Gioia, F. Micronutrients: The Borderline between Their Beneficial Role and Toxicity in Plants. Front. Plant Sci. 2022, 13, 178. [Google Scholar] [CrossRef]
  43. Aminpanah, H. Effect of nitrogen rate on seed yield, protein and oil content of two canola (Brassica napus L.) cultivars. Acta Agric. Slov. 2013, 101, 183–190. [Google Scholar] [CrossRef]
  44. Sokólski, M.; Załuski, D.; Jankowski, K. Crambe: Seed Yield and Quality in Response to Nitrogen and Sulfur—A Case Study in Northeastern Poland. Agronomy 2020, 10, 1436. [Google Scholar] [CrossRef]
  45. Öztürk, E. Critical dose of nitrogen and phosphorus for the enhanced growth, yield, and quality components in mustard (Sinapsis arvensis L.) in a semi-arid environment. Turk. J. Field Crops 2021, 26, 244–252. [Google Scholar] [CrossRef]
  46. Williams, S.T.; Vail, S.; Arcand, M.M. Nitrogen Use Efficiency in Parent vs. Hybrid Canola under Varying Nitrogen Availabilities. Plants 2021, 10, 2364. [Google Scholar] [CrossRef] [PubMed]
  47. Gastal, F.; Lemaire, G. N uptake and distribution in crops: An agronomical and ecophysiological perspective. J. Exp. Bot. 2002, 53, 789–799. [Google Scholar] [CrossRef] [Green Version]
  48. Shah, A.N.; Iqbal, J.; Tanveer, M.; Yang, G.; Hassan, W.; Fahad, S.; Yousaf, M.; Wu, Y. Nitrogen fertilization and conservation tillage: A review on growth, yield, and greenhouse gas emissions in cotton. Environ. Sci. Pollut. Res. 2016, 24, 2261–2272. [Google Scholar] [CrossRef] [PubMed]
  49. Youssef, M.A.; Yousef, A.F.; Ali, M.M.; Ahmed, A.I.; Lamlom, S.F.; Strobel, W.R.; Kalaji, H.M. Exogenously applied ni-trogenous fertilizers and effective microorganisms improve plant growth of stevia (Stevia rebaudiana Bertoni) and soil fertility. AMB Express 2021, 11, 133. [Google Scholar] [CrossRef] [PubMed]
  50. Umar, W.; Ayub, M.A.; Zia ur Rehman, M.; Ahmad, H.R.; Farooqi, Z.U.R.; Shahzad, A.; Rehman, U.; Mustafa, A.; Nadeem, M. Nitrogen and phosphorus use efficiency in agroecosystems. In Resources Use Efficiency in Agriculture; Kumar, S., Meena, R.S., Jhariya, M.K., Eds.; Springer: Singapore, 2020; pp. 213–257. [Google Scholar]
  51. Yahbi, M.; Nabloussi, A.; Maataoui, A.; El Alami, N.; Boutagayout, A.; Daoui, K. Effects of nitrogen rates on yield, yield components, and other related attributes of different rapeseed (Brassica napus L.) varieties. OCL 2022, 29, 8. [Google Scholar] [CrossRef]
  52. Potdar, D.S.; Purohit, H.S.; Meena, R.H.; Kaushik, M.K.; Jain, H.K.; Ameta, K.D. Effect of integrated phosphorus management on growth, yield, and quality of mustard (Brassica juncea L.). J. Pharmacogn. Phytochem. 2019, 8, 1700–1704. [Google Scholar]
  53. Diederichsen, A.; McVetty, P.B. Botany and Plant Breeding. In Biology; AOCS Press: Urbana, IL, USA, 2011; pp. 29–56. [Google Scholar] [CrossRef]
  54. Kim, S.-J.; Matsuo, T.; Watanabe, M.; Watanabe, Y. Effect of nitrogen and sulphur application on the glucosinolate content in vegetable turnip rape (Brassica rapa L.). Soil Sci. Plant Nutr. 2002, 48, 43–49. [Google Scholar] [CrossRef] [Green Version]
  55. Øvsthus, I.; Thorup-Kristensen, K.; Seljåsen, R.; Riley, H.; Dörsch, P.; Breland, T.A. Calibration of the EU-Rotate_N model with measured C and N mineralization from potential fertilizers and evaluation of its prediction of crop and soil data from a vegetable field trial. Eur. J. Agron. 2021, 129, 126336. [Google Scholar] [CrossRef]
  56. Nayak, H.S.; Parihar, C.; Mandal, B.; Patra, K.; Jat, S.; Singh, R.; Singh, V.; Jat, M.; Garnaik, S.; Nayak, J.; et al. Point placement of late vegetative stage nitrogen splits increase the productivity, N-use efficiency and profitability of tropical maize under decade long conservation agriculture. Eur. J. Agron. 2021, 133, 126417. [Google Scholar] [CrossRef]
  57. Waqar, M.; Habib-ur-Rahman, M.; Hasnain, M.U.; Iqbal, S.; Ghaffar, A.; Iqbal, R.; Sabagh, A.E. Effect of slow release nitrog-enous fertilizers and biochar on growth, physiology, yield, and nitrogen use efficiency of sunflower under arid climate. Environ. Sci. Pollut. Res. 2022, 29, 52520–52533. [Google Scholar] [CrossRef] [PubMed]
  58. Yang, X.; Zhang, S.; Ju, M.; Liu, L. Preparation and Modification of Biochar Materials and their Application in Soil Remediation. Appl. Sci. 2019, 9, 1365. [Google Scholar] [CrossRef] [Green Version]
  59. Parihar, C.M.; Jat, H.S.; Jat, S.L.; Kakraliya, S.K.; Nayak, H.S. Precision nutrient management for higher nutrient use effi-ciency and farm profitability in irrigated cereal-based cropping systems. Ind. J. Ferti. 2020, 16, 1000–1014. [Google Scholar]
  60. Yasari, E.; Patwardhan, A. Physiological Analysis of the Growth and Development of Canola (Brassica napus L.) Under Different Chemical Fertilizers Application. Asian J. Plant Sci. 2006, 5, 745–752. [Google Scholar] [CrossRef] [Green Version]
  61. Keerthi, P.; Pannu, R.K.; Dhaka, A.K.; Reddy, Y.A. Yield attributes, yield and quality of Indian mustard (Brassica juncea L.) as influenced by dates of sowing and nitrogen levels in Western Haryana. IJCS 2017, 5, 1890–1893. [Google Scholar]
Figure 1. The quadratic curve model for different nitrogen doses on different morphological attributes: (a) plant height, (b) primary branches, (c) secondary branches, and (d) number of siliques per plant. The study was conducted for two years (2019–2020 and 2020–2021). The lines indicate the relationship between agro-morphological attributes and different N doses with 95% confidence interval. R2 represents the coefficient of determination.
Agronomy 13 01621 g001
Figure 2. The quadratic curve model for different nitrogen doses on the agro-morphological attributes: (a) 1000 seed weight, (b) seeds per silique, (c) seed yield, and (d) biological yield. The study was conducted for two years (2019–2020 and 2020–2021). The lines indicate the relationship between agro-morphological attributes and different N doses with 95% confidence interval. R2 represents the coefficient of determination.
Agronomy 13 01621 g002
Figure 3. The quadratic curve model for different of nitrogen doses on agro-morphological attributes: (a) harvest index and (b) oil yield. The study was conducted for two years (2019–2020 and 2020–2021). The lines indicate the relationship between agro-morphological attributes and different N doses with 95% confidence interval. R2 represents the coefficient of determination.
Agronomy 13 01621 g003
Figure 4. The quadratic curve model for different nitrogen doses on the seed quality parameters: (a) glucosinolate contents, (b) protein contents, and (c) oil contents. The study was conducted for two years (2019–2020 and 2020–2021). The lines indicate the relationship between seed quality parameters and different N doses with 95% confidence interval. R2 represents the coefficient of determination.
Agronomy 13 01621 g004
Figure 5. The quadratic curve model for different nitrogen use efficiencies: (a) nitrogen use efficiency, (b) physiological efficiency, (c) agronomic efficiency, and (d) apparent recovery efficiency. The lines indicate the relationship between nitrogen use efficiencies and different N doses with 95% confidence interval. R2 represents the coefficient of determination.
Agronomy 13 01621 g005
Figure 6. Pearson’s correlation between agro-morphological and seed quality traits of S. alba.
Agronomy 13 01621 g006
Figure 7. Principal component analysis (PCA) (a) scree plot and (b) variable plot of the first two components performed on agro-morphological and seed quality traits affected by different N fertilizer doses.
Agronomy 13 01621 g007
Figure 8. Principal component analysis (PCA) for biplot of the first two components performed on agro-morphological and seed quality traits affected by different N fertilizer doses.
Agronomy 13 01621 g008
Table 1. Pre-sowing physiochemical properties of studied soil.
ParametersUnits0–15 cm15–30 cm
Textural class Sandy clay loamSandy clay loam
ECdS m−10.610.58
pH 7.847.81
O.M%0.750.72
BDg cm−31.531.55
NO3Nmg kg−13.743.68
NH4mg kg−10.70.5
Phosphorus—Olsen Pmg kg−13.793.74
Potassiummg kg−1185162
EC = Electrical conductivity; O.M = Organic matter; BD = Bulk density.
Table 2. Weather data from experimental site.
MonthsMonthly Rainfall (mm)Max. Temperature MeanMin. Temperature MeanHumidity (%)
2019–20202020–20212019–20202020–20212019–20202020–20212019–20202020–2021
October141529.031.213.313.35961
November192422.025.18.38.36363
December7.615.518.218.33.13.16658
January51.9161517.73.53.47570
February53.110.221.523.56.46.47764
March195.665.821.925.98.88.86954
April45.823.82829.215.715.75859
Total/Average387170.322.524.413.38.45961.3
Table 3. Eigenvalues, factor loadings, and individual and cumulative variation.
ParametersDim 1Dim2Dim 3Dim 4Dim 5Dim 6
PH0.9458−0.09470.2794−0.1267−0.2794−0.0455
PB0.98050.02772−0.10740.1544 0.03840.0051
SB0.98910.00830.1362−0.0064−0.0449−0.0290
SP0.98420.14280.05920.0753 0.0347−0.0207
TSW0.98840.0100 −0.0978 0.0838 −0.0597 0.0524
SS0.9755−0.09390.1253 0.1426 0.0484 −0.0323
BY0.98470.14180.0118 −0.0351−0.0920−0.0169
SY0.99700.06940.0251 0.0127−0.0075 0.0119
HI0.99390.05610.0385−0.0419 0.0740−0.0094
OY0.9670.07310.23650.0535−0.02450.0021
GSL−0.76590.63950.05950.01050.01860.0157
PC0.9871−0.07880.0516−0.10570.02480.0697
OC0.95590.0505−0.26380.11090.03270.0232
Eigenvalue 12.090.490.270.10.020.01
Variability %93.043.772.080.780.210.1
Cumulative %93.0496.8198.8999.6899.89100
Disclaimer/Publisher’s Note: The statements, opinions and data contained in all publications are solely those of the individual author(s) and contributor(s) and not of MDPI and/or the editor(s). MDPI and/or the editor(s) disclaim responsibility for any injury to people or property resulting from any ideas, methods, instructions or products referred to in the content.

