Article

Constitution of a Camelina sativa L. Synthetic Population and Agronomic Comparison between Spring and Winter Cultivation in North Italy

1
Department of Agricultural and Environmental Sciences—Production, Landscape and Agroenergy, University of Milan, Via Celoria 2, 20133 Milan, Italy
2
Department of Veterinary Medicine and Animal Sciences, University of Milan, Via Dell’Università 6, 26900 Lodi, Italy
3
Department of Food, Environmental and Nutritional Sciences, University of Milan, 20133 Milan, Italy
4
Department of Earth and Environmental Sciences, University of Pavia, Via S. Epifanio 14, 27100 Pavia, Italy
*
Author to whom correspondence should be addressed.
Agronomy 2023, 13(6), 1562; https://doi.org/10.3390/agronomy13061562
Submission received: 9 May 2023 / Revised: 29 May 2023 / Accepted: 5 June 2023 / Published: 7 June 2023
(This article belongs to the Special Issue Novel Studies in Crop Breeding for Promoting Agro-Biodiversity)

Abstract

:
In recent years, the interest in increasingly sustainable agriculture has also turned attention towards new cover crops suitable for use in marginal areas that could enter the food chain as new protein and oil sources or for biodiesel production. In this scenario, Camelina sativa is a perfect crop to study. Camelina is an annual herbaceous plant belonging to the Brassicaceae which is interesting in terms of its oil content, since the seeds contain about 40% oils, with a high level of polyunsaturated fatty acids (30–40% alpha linolenic acid, 15–25% linoleic acid, 15% oleic acid and about 15% eicosenoic acid). It is a hexaploid species (2n = 40, genome size ~782 Mb) characterized by rapid growth, a short life cycle (85–100 days for spring varieties, 190–210 for autumn varieties) and low input cultivation needs. However, its use in feed and food is limited by the presence of glucosinolates (GLS). GLS are sulfur molecules involved in plant defense. In recent years, they have been studied not only as antinutritionals but also for their anti-carcinogenic effects against chronic inflammatory and heart diseases and for their use as natural pesticides. Given the recent interest in camelina and its highly nutritious oil, eight pure lines and a synthetic population were compared in two different growing periods, spring and winter. In this work, the genetic materials were characterized for different phenotypic traits, yields and yield components, and bromatological and glucosinolate content. The results confirmed that in North Italy, camelina has higher yields if cultivated in the autumn–winter period (about 2 t/ha vs. 0.6 t/ha); furthermore, a negative correlation was found between spring and winter yields, indicating that varieties that produce more in winter cultivation produce less in spring cultivation. Moreover, to our knowledge, it is the first work in which a synthetic population of Camelina sativa has been tested and proved to be a valid solution for use in various environments both for its adaptability and for the low content of glucosinolates (about 17 mmol/kg).

1. Introduction

Camelina [Camelina sativa (L.) Crantz] is an ancient oilseed crop belonging to the Brassicaceae family, to the tribe Camelineae. Camelina sativa, also called by different names such as false flax or gold of pleasure, has been grown as a crop since the Iron Age in European countries and Russia, where the center of origin is located. It was abandoned after the Second World War for more profitable crops [1,2,3].
The average height of the plants is between 30 and 90 cm. The stems are branched, with alternate lanceolate leaves. Inflorescences are racemes composed of small yellow flowers with four petals. The siliques are smooth, leathery, 7 to 9 mm long and usually contain 5–15 golden/brown seeds. The seeds are 2 to 3 mm long, and the weight of 1000 seeds is 0.8 to 2.0 g [4]. It is an interesting, resilient plant with a fast growth cycle of about 85–100 days, which can be used in different low-input agronomic systems, especially in the increasingly topical perspective of climate change [5].
Nowadays, the interest in camelina has increased because of the crop’s great potential and the numerous uses, for example, as a new source of polyunsaturated fatty acids and proteins for feed, food and bio-based products. Camelina oil is attractive for its high content in the seeds (up to 40%) and for the high proportion of unsaturated fatty acids (30–40% alpha linolenic acid fraction, 15–25% linoleic acid fraction, 15% oleic acid fraction and about 15% eicosenoic acid fraction) [6,7].
Although camelina oil has excellent nutritional and functional characteristics and the protein cake resulting from the pressing of the seeds has an excellent protein content, it also contains antinutritional compounds, such as glucosinolates, synapin, phytic acid, condensed tannins and erucic acid [8,9]. However, the major antinutritional compounds are glucosinolates (GSL), which are the main secondary metabolites present in Brassicaceae and limit their use, especially as feed [10].
Among the agronomic traits that have to be considered in the selection of new varieties, the yield, which can be expressed as the size of the seed and competitive capacity (e.g., wider leaves), the concentration of antinutritional compounds, and the resistance to herbicides are of paramount importance. In the field of classical genetic improvement, there are difficulties in breeding programs concerning Camelina sativa, as this species is allohexaploid (chromosome number 2n = 40, genome size 750 Mbp) [11] and does not present much variability [5].
In this work, eight spring varieties of Camelina sativa and a synthetic population generated by crossing two spring-type parents (varieties do not require vernalization) were studied in two different cultivation periods, spring and winter. The aim of the study was to evaluate the performances of these varieties through the comparison of yield and other agronomic parameters, bromatological analysis and antinutritional content in two cultivation periods.

2. Materials and Methods

2.1. Plant Materials

Eight different spring lines and a synthetic population of Camelina sativa (Table 1) were tested via low-input farming in the University of Milan experimental field, which is situated in Landriano (PV), North Italy (45°19′ N 9°16′ E), 88 m a.s.l. The screening trial aimed to establish an agronomic comparison between spring and winter cultivation.
The Calena variety was kindly provided by Dr. Incoronata Galasso, IBBA-CNR, Milan, Italy. The Omich and Madalina varieties are registered at the CPVO (Community Plant Variety Office). All of the other experimental materials are advanced breeding lines provided by the germplasm bank at DISAA, Department of Agricultural and Environmental Sciences—Production, Landscape and Agroenergy, University of Milan, Italy.

2.2. Constitution of Synthetic Population

The synthetic population was developed starting from spring lines of Camelina sativa.
In particular, the constitution of the synthetic population started with a cross between an experimental material of the University of Milan (C1199) and the Omich CPVO variety (C1204), which was performed in 2018. The breeding system used was a bulk method, in which after the initial crosses (18 F1 plants), we obtained about 12,000 F2 plants in the following generations; each generation was advanced by collecting (about 15,000 seeds) and propagating the material for 5 agronomic cycles. The synthetic population used in this study is the F6 generation.

2.3. Field Experimentation

The camelina plants were grown in the North Italy area in the experimental farm of the University of Milan in Landriano (PV). In Table 2, the characteristics of the soil are reported.
The experiment was carried out by evaluating the spring-type pure lines and the synthetic population of camelina at two different sowing times, in spring (from sowing in April 2021 to harvest in July 2021) and in winter (from sowing in October 2021 to harvest in May 2022). In the spring field, the yield was recorded for all the genetic materials in Table 1 (accessions C1199, C1200, C1201, C1202, C1204, C1207, C1208, C1209 and C1215), while the agronomic traits (plant height, number of branches and weight of 1000 seeds) were collected for the accessions of C1999, C1200, C1201, C1204, C1202 and C1215. In the winter field, all of the parameters were collected for all accessions (C1999, C1200, C1201, C1204, C1202, C1207, C1208, C1209 and C1215). Table 3 shows the mean temperature and rainfall for the months of interest for the two experimental fields. In Table S1, the monthly rainfall (mm) and mean monthly temperatures (°C) are shown from January 2010 to November 2022 (Supplementary Materials).
No irrigation was provided in either of the cycles of cultivation. The experiment was laid out in randomized blocks in both the spring and winter fields. The 8 pure lines and the synthetic population were cultivated in three plots for a total of 27 plots. The size of each plot was about 6 m2 (5 m × 1.2 m). The sowing was carried out on tilled soil in rows spaced 0.2 m, using an Earthway 1001B manual seeder, with seed disc 1002-5, at a density of 8 kg/ha. Periodic monitoring was conducted during the crop cycle. At maturity, the harvest was carried out manually by cutting at ground level. The plants were collected and left to dry thoroughly. Once the drying was completed, the siliques were opened by applying pressure to the dry plants, and the seeds were collected using a sieve.

2.4. Agronomic Parameters

At maturity, in each plot, some agronomic traits were measured: plant height (from ground level to the tip of the plant), branch height (from ground level to the first branch node on the stem), number of branches (number of nodes present on the stem), stem diameter (measured below the first branch node from ground level), number of siliques per plant, silique size (length and width), number of seeds per siliqua and the weight of 1000 seeds. To calculate the parameter weight of 1000 seeds, 3 samples were measured for each accession, and for all the other parameters, at least 10 samples were analysed. In each plot, one square meter was harvested, the number of plants was counted, and the yield was calculated.

2.5. Bromatological Analysis

The analysis was conducted by bulking 100 g of seed per plot for each variety. Then, 5 g of the bulked seeds were sampled for the bromatological analysis. The Camelina sativa seeds were analysed in triplicate in terms of principal nutrients: dry matter (DM), ash content (AC), ether extract (EE), crude proteins (CP) and crude fibre (CF) (AOAC, 2019). DM was obtained by drying the seeds in a forced-air oven at 65 °C for 24 h (AOAC method 930.15). AC was obtained by incinerating the samples in a muffle furnace at 550 °C (AOAC method 942.05). EE was determined using ether extraction in a Soxtec system (SER 148 Series Solvent Extractor, Velp Scientifica Srl, Usmate, Italy; AOAC method 2003.05). CP was determined through the Kjeldahl method (AOAC method 2001.11). CF was determined using the filter bag method (AOCS method Ba 6a-05) (AOCS, 2009).

2.6. Glucosinolates Quantification

As reported in Section 2.5. Bromatological analysis, 5 g of the bulked seeds were used for glucosinolates analyses.
The seeds were ground with mortar and pestle in liquid Nitrogen, kept frozen to avoid endogenous myrosinase action, and stored at −80 °C until analysis. For glucosinolate extraction, 200 mg of ground seeds were resuspended in 5 mL of 80% Methanol (Sigma-Aldrich, St. Louis, MO, USA) and incubated at 70 °C for 30 min. After centrifugation at 9000 rpm for 20 min, 4 mL of the extract was transferred, and the solvent was evaporated under vacuum with an Eppendorf concentrator plus (Eppendorf, Hamburg, Germany). Glucosinolate quantification was performed by resuspending the desiccated material in 1 mL of 50 mM Citrate Buffer pH 6. After centrifugation, 200 µL was added with 0.3 U of Thioglucosidase from Sinapis alba (white mustard) seed (Sigma-Aldrich) in a final volume of 500 µL. An enzymatic reaction was performed at 25 °C for 20 min. Finally, the glucose released by Thioglucosidase from Glucosinolate was measured using an Enzytec™ Generic D-Glucose/D-Fructose/Sucrose kit (R-biopharm, Darmstadt, Germany) following the manufacturer’s instructions. As a negative control, free glucose quantification was performed for each sample without the addition of Thioglucosidase; the obtained value was subtracted from the relative glucose quantification. Each experiment was performed in duplicate.

2.7. Informatic Tools

Microsoft Excel® was used to collect the data, and the PAST program (Paleontological Statistics, version 4.12) and IBM SPSS version 20 software were used to perform the statistical analysis. The results are presented as least square means’ standard deviation. Statistically significant differences are considered for p ≤ 0.05.

3. Results

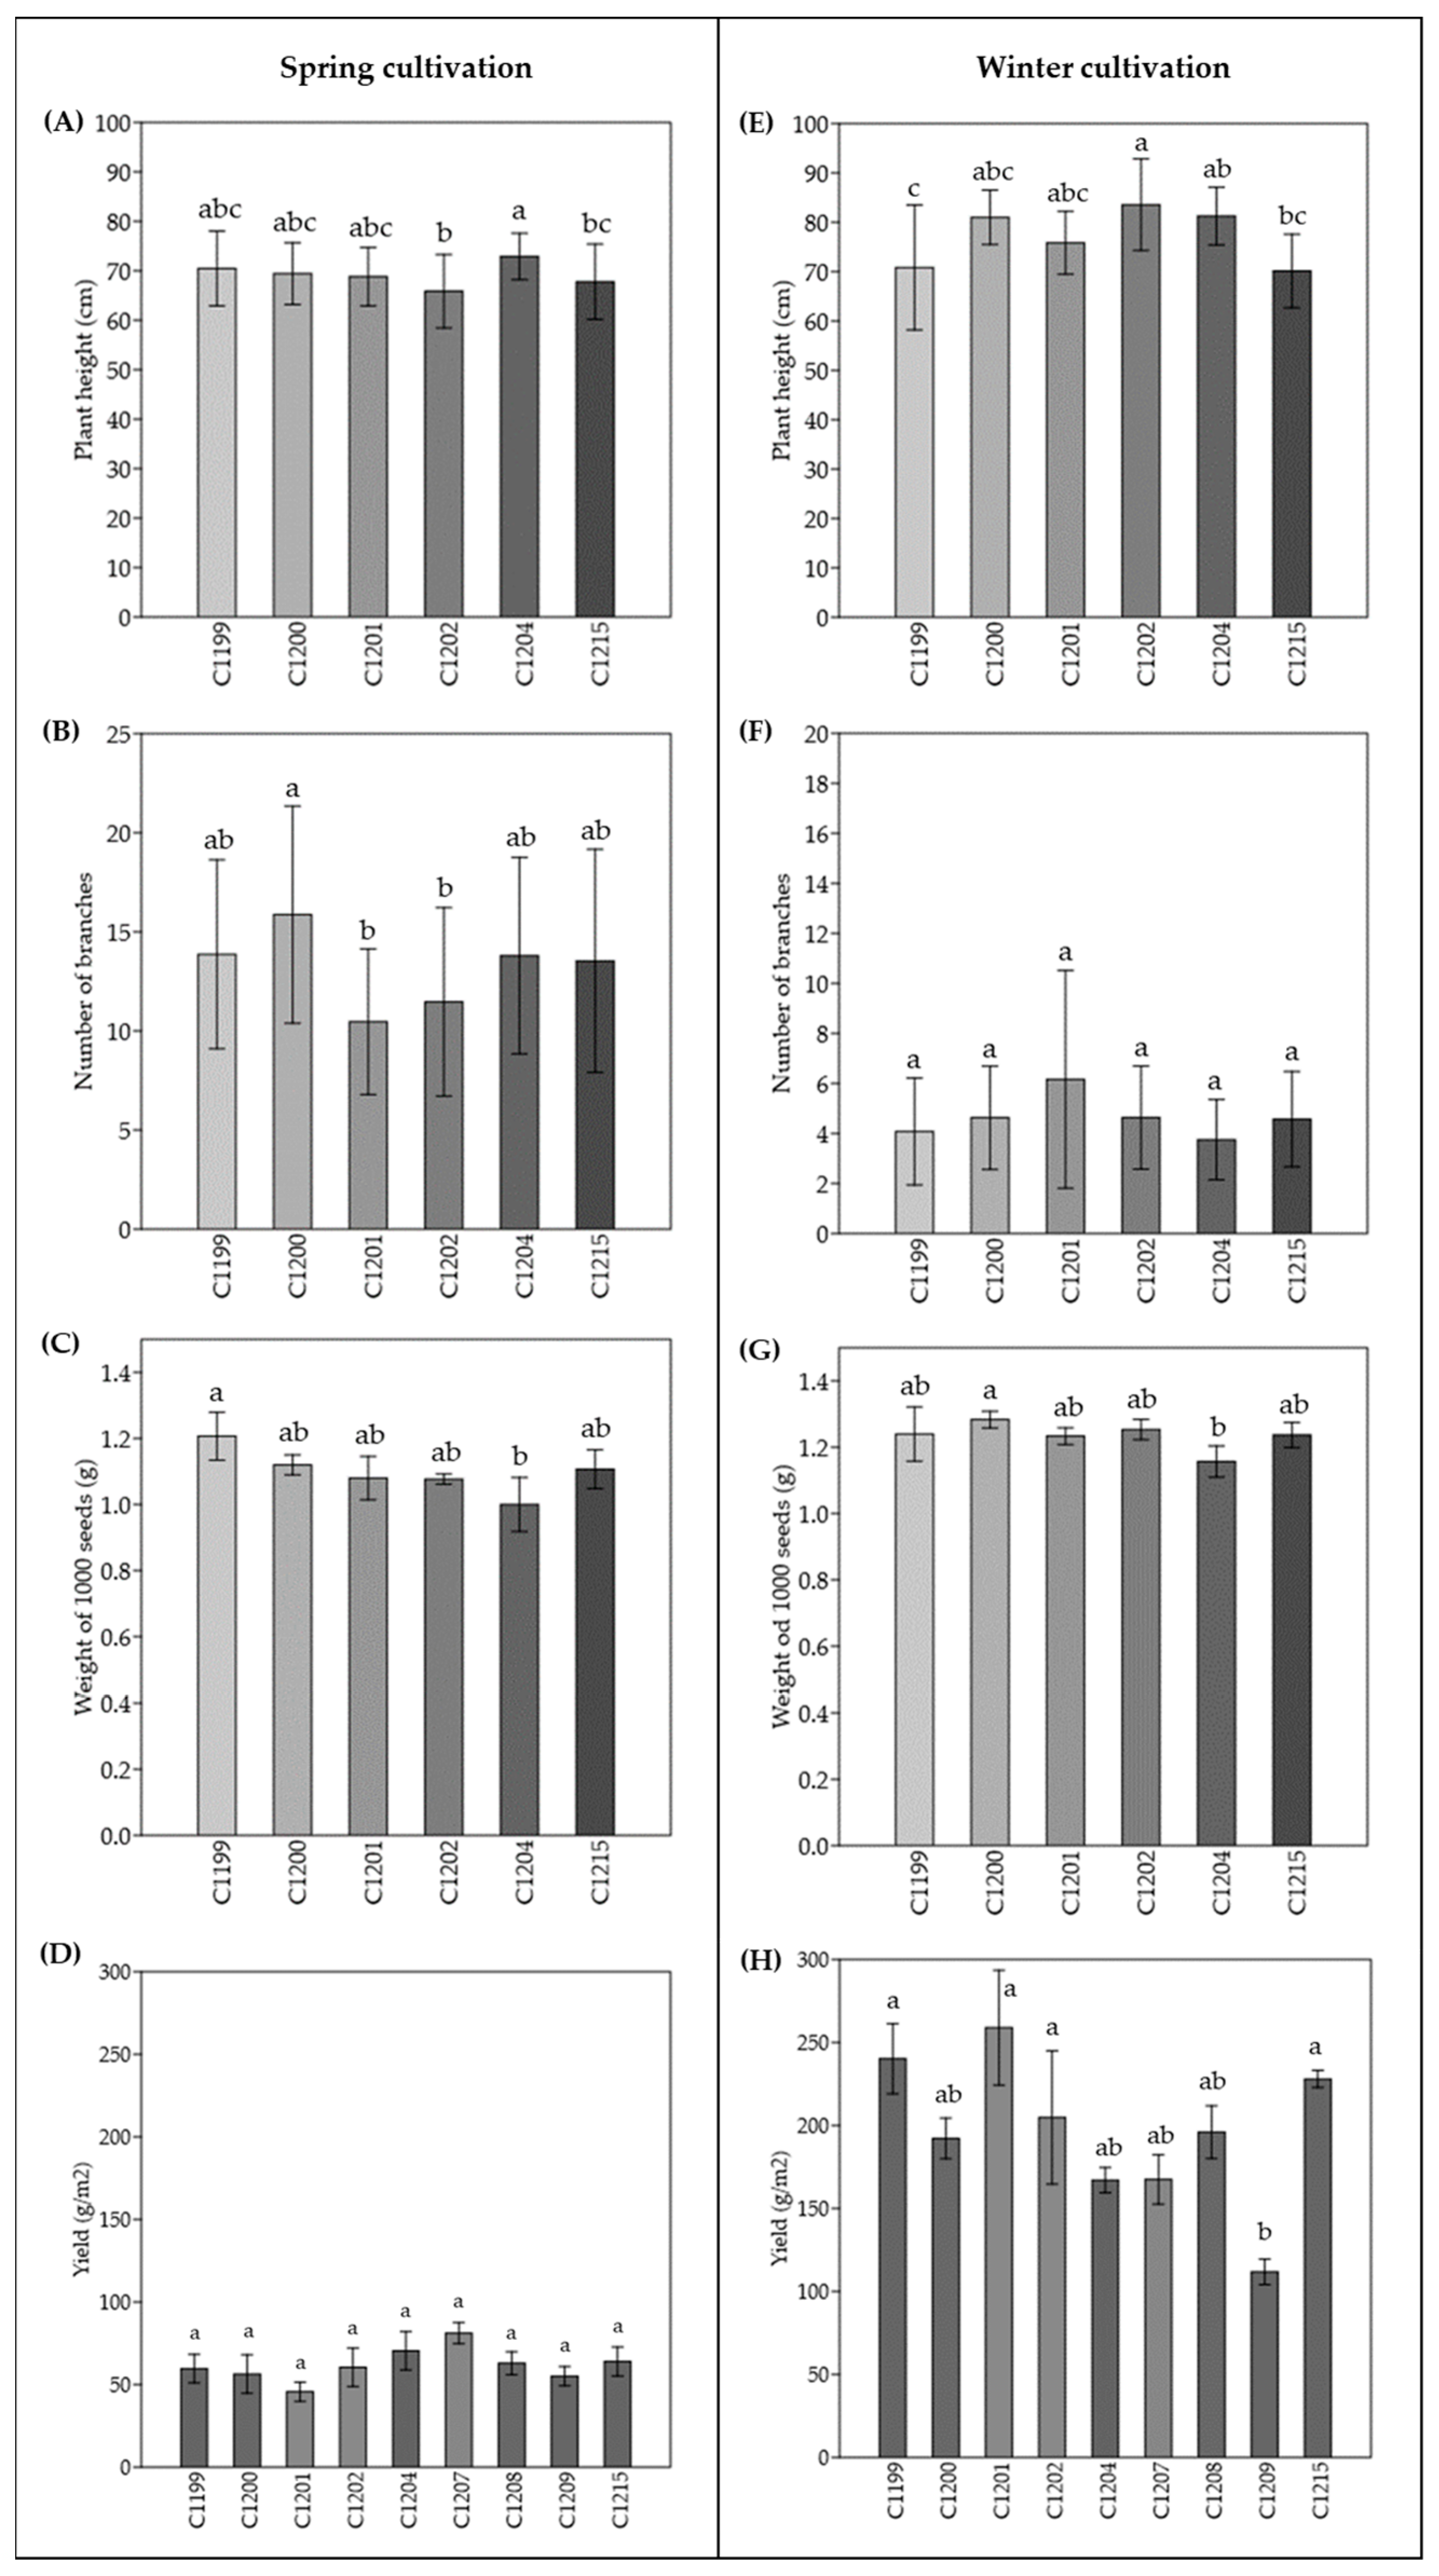
3.1. Comparison among Varieties Cultivated at Two Different Sowing Times

The plant materials under study (Table 1) were cultivated at two different times: spring cultivation and winter cultivation. The experimental design consisted of randomized blocks, and each genetic line was cultivated, as reported in the Materials and Methods section. The first experimental field (spring field) was sown in April 2021 and harvested in July 2021; in this spring field, the yield was recorded for all the accessions in the study, while the agronomic traits (plant height, number of branches and the weight of 1000 seeds) were collected only on C1199, C1200, C1201, C1202, C1204 and C1215. The second experimental field (winter field) was sown in October 2021 and harvested in May 2022. All of the parameters were collected concerning all the varieties (C1201, C1204, C1202, C1999, C1200, C1207, C1208, C1209 and C1215). The results obtained are reported in Figure 1.
The agronomic traits measured for each genetic line were plant height, number of branches, the weight of 1000 seeds and yield. Starting from the plant height in the spring field, the variety with the highest average was C1204 (72.90 ± 4.69 cm), which was statistically different (p < 0.05), from C1202 (65.87 ± 7.43 cm) and from C1215 (67.80 ± 7.62 cm), the synthetic population. C1215 was also different from C1202 (Figure 1A). In the winter field, the tallest height was recorded for the C1202 variety (83.55 ± 9.28 cm), which was statistically different from the C1199 variety, with the lowest height (70.85 ± 12.66 cm). The variety C1204 (81.25 ± 5.82 cm) was also different from C1199. The synthetic population of C1215, with a height of 70.14 ± 7.45 cm, was different from C1202 (Figure 1E). Regarding the number of branches, in the spring field, the varieties C1201 and C1202 were statistically different from C1200 (p < 0.05; Figure 1B); in the winter field, no statistically significant differences were found (Figure 1F). The weight of 1000 seeds was also evaluated, and in the spring field, the weight was higher for the C1199 (1.21 ± 0.07 g) variety and lower for C1204 (1.00 ± 0.08 g); between these two varieties, the difference was statistically significant (p < 0.05; Figure 1C). In the winter field, the statistically significant difference was between C1200 and C1204. The variety with the highest 1000 seeds weight was C1200 (1.28 ± 0.03 g) (Figure 1G). Lastly, concerning the estimated yield in the spring field, there were no statistically significant differences between the varieties, and the average of the estimated yields of all varieties was about 600 kg/ha (Figure 1D). In the winter field, there are no statistically significant differences a part C1209 variety that turned out different from C1199, C1201, C1202 and C1215 with the lowest yield level. The estimated average yield value for the varieties was 1963 kg/ha (Figure 1H). No correlation was found among the different traits studied.
Table 4 reports the yields compared among varieties within the same cultivation season and the comparison between the spring cultivation (S) and the winter cultivation (W).
All of the genetic materials showed statistically different yields between the spring field (S) and winter field (W). Figure 2 shows the regression curve (r = −0.65565; p = 0.0552) between these two different sowing times.

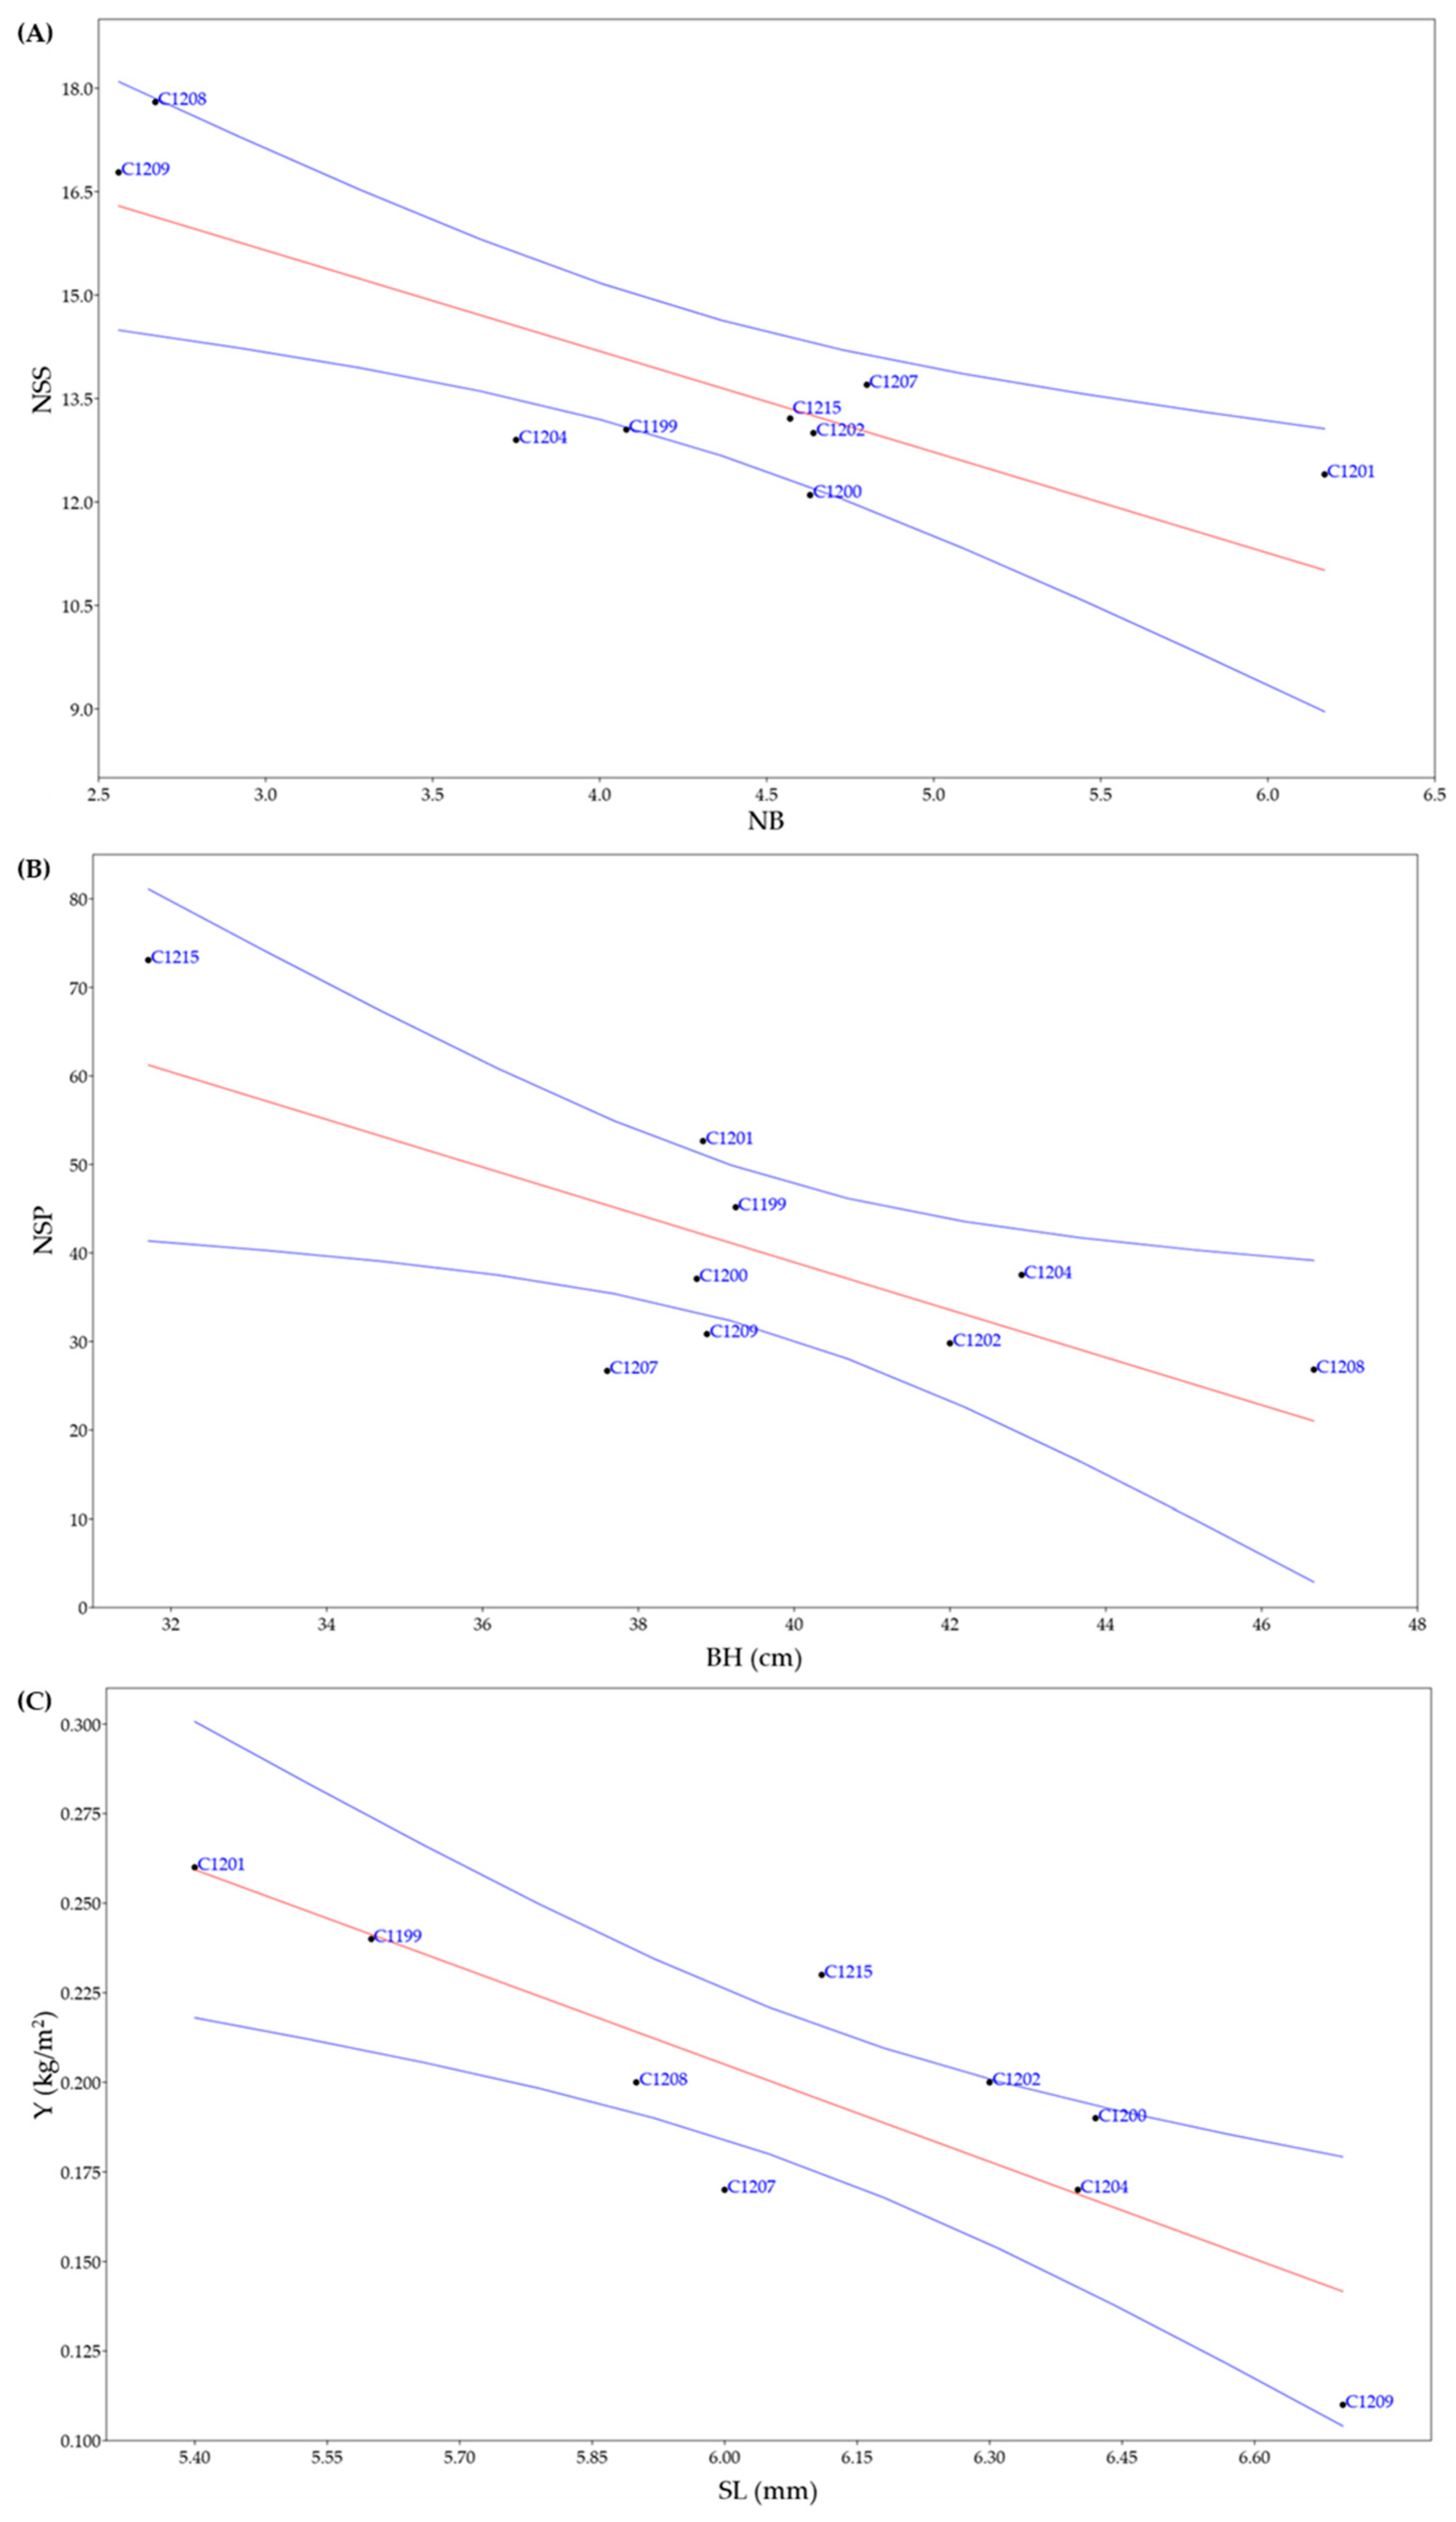
3.2. Dissection of Agronomic Parameters Involved in Yield

During the growth of the winter crop, the agronomic comparison of all the plant materials under study (Table 1) was carried out on the main parameters involved in the yield required by the CPVO (Community Plant Variety Office). The agronomic traits measured for each genetic line were plant height (PH), number of branches (NB), branch height (BH), stem diameter (SD), number of siliques per plant (NSP), number of seeds per silique (NSS), silique length (SL), silique width (SW), the weight of 1000 seeds (W1000), number of plants per m2 (NP) and the yield (Y) (Table 5).
The experimental design comprised randomized blocks, and each genetic line was cultivated, as reported in the Materials and Methods section. At maturity, at least 10 plants were collected, and some parameters were measured. The results obtained are reported in Table 5.
Starting from the plant height, the tallest variety was C1202 (83.55 ± 9.28 cm); for this phenotypic trait, there are no statistically significant differences between the materials. Regarding the number of branches, the C1201 variety, with the greater presence of ramifications on the stem, was statistically different from C1209, which produced only a third of the number of branches (p < 0.05); none of the others are statistically different from these varieties. However, the branch height was lower in the synthetic population, with a value of 31.71 ± 10.93 cm, and was statistically different from all of the other materials. The stem diameter measurements did not show statistically significant differences between the lines, nor did the estimated number of siliques per plant. The number of seeds per silique was higher in varieties C1208 and C1209, respectively, 17.80 ± 2.20 and 16.78 ± 2.78; these two varieties were statistically different from all of the genetic lines, except for C1207. Two further traits considered concern the size of the siliques. The silique length was greater for varieties C1200 and C1209, and these were statistically different from C1199 and C1201. Regarding the width of the siliques, no big differences were recorded (average value 3 mm) apart from variety C1201, in which the average width of the siliques was 2 mm.
Another important trait that provides an estimate of the yield was the weight of 1000 seeds, which was higher in the C1207 variety (1.44 ± 0.04 g) and lower in the C1209 variety (1.11 ± 0.02 g). The number of plants per m2 was highest in C1202 (421.67 ± 85.20), statistically different from C1209 (185 ± 56.35) (p < 0.05).
Lastly, the estimated yield was lower for the variety C1209, at about 1118 kg/ha, which is statistically different from the estimated yield of the variety C1199 and the synthetic population C1215, which recorded the highest yields, respectively, about 2402 kg/ha and 2284 kg/ha.

3.3. Bromatological Analyses and Glucosinolates Content

The comparison among different pure lines and the synthetic population showed that no big differences were recorded concerning dry matter and ash. For the crude fibre, the highest value was observed in the C1199 variety (24.49%), while the lowest was in the C1200 variety (20.01%). The crude protein percentage ranged from 26.12% (C1201) to 30.75% (C1204). Lastly, the varieties with the highest ether extract were C1201 and C1207, respectively 31.43% and 31.15%, while the lowest content was in C1209 (23.58%) (Table 6).
As shown in Table 7, the lower glucosinolate content was found in the synthetic population C1215 (16.92 mmol/kg), while the variety with the highest content was C1204 (26.52 mmol/kg).

3.4. Correlation among Agronomic and Chemical Traits

A correlation was performed on all the agronomic parameters collected:plant height (PH), number of branches (NB), branch height (BH), stem diameter (SD), number of siliqua per plant (NSP), number of seeds per siliqua (NSS), silique length (SL), silique width (SW), the weight of 1000 seeds (W1000), number of plants per m2 (NP), yield (Y), dry matter (%DM), ash (%A), crude fibre (%CF), crude protein (%CP), oil (%O) and glucosinolates content (GLS). The results shown in Figure 3 highlight (gray boxes) three positive correlations and three negative correlations, which are statistically significant (p < 0.05); Figure 4 shows the regressions referring to statistically significant correlations.
As regards the positive correlations, two of these refer to the percentage of oil in seeds (%O), which was correlated to the weight of the 1000 seeds (W1000) and to the number of plants per m2 (NP); while the other positive correlation was found between the content of glucosinolates (GLS) and the percentage of crude proteins (%CP).
Furthermore, negative correlations were found between agronomic parameters. The first was between the number of siliques per plant (NSP) and the height of the first branch above the ground (BH), the second between the number of seeds per siliqua (NSS) and the number of branches (NB) and the last and most significant between the yield (Y) and the length of the siliques (SL).

3.5. Multivariate Analyses

A multivariate analysis was carried out on the parameters of Figure 3.
In the clustering analysis by imposing k means equal to 2, the two clusters are composed of C1202, C1207, C1200, C1204, and C1201 and C1199, C1215, C1209 and C1208. Instead, with k means equal to 3, in the first cluster, there are C1204, C1202, C1207 and C1201; in the second, there are C1209, C1199, C1215 and C1208, while in the third, there is the variety C1200 (Figure 5).

4. Discussion

This work aims to evaluate the agronomic performances of eight different genetic lines and a synthetic population in the northern Italian area, comparing two different sowing periods. The data reported in this work regarding yield do not show statistical differences between the pure line varieties and the synthetic population when cultivated in the spring or winter periods (Figure 1). However, some differences were registered regarding plant height, number of branches and weight of 1000 seeds. While considering the comparison of yields between spring and winter cultivations, statistically significant differences (p < 0.05) were found among all the materials, suggesting that winter cultivation as a cover crop would be the best choice in the northern Italian agroecosystem (Table 4, Figure 2).
As reported by Angelini et al. [13], in the Mediterranean area, with autumn sowing, the crop encounters relatively milder temperatures during seed filling compared to spring sowing, thus favoring the production of seeds with better chemical characteristics [13]. Many scientific papers state that camelina adapts well to different environments and sowing periods: however, the environmental conditions that most influence the yield and quality of the seeds are temperatures and water [14]. Yield may be limited in years characterized by lower rainfall and/or high temperatures, causing thermal stress during the reproductive phase [15,16]. Some previous studies have documented the reduction in yield in spring sowing due to fewer siliques per plant, lower seed weight and reduced branching. Instead, with autumn sowing, camelina accumulates more biomass thanks to the longer growing season and cooler temperatures [11].
In the experiments of Angelini et al. [13], the cumulative rainfall received by winter crops was about 460 mm, and for spring crops, this was about 170 mm (2017–2018). In these two years, the rainfall was below the long-term average; however, the amount of water received in the winter harvest exceeded the needs of the camelina [13].
In fact, the yields in the two different sowing periods resulted in the average production of the crop being, respectively, 1.6 t/ha in the spring field and 1.9 t/ha in the winter field [13]. Compared with our results, in the spring field, the cumulative rainfall recorded was 147 mm, and the yield was 0.6 t/ha, while in the winter field, the cumulative rainfall was 404 mm, and 2 t/ha was the yield (Table 3). Although the winter yields of Angelini et al. [13] work were comparable with those obtained in this experiment, the spring yields of our experiment were lower. These results are probably due to the very low water intake caused by the extremely dry season. In fact, as reported in Table S1 regarding the monthly rainfall and mean temperatures from 2010 to 2022, we can observe that the 2021/2022 years were extremely dry and hot with respect to the ten-years trend. Other agronomic differences found, such as height, could also be due to the scarcity of water during the periods considered. However, the weights of 1000 seeds are comparable for both seasons (about 1.00 ± 0.03).
In addition, bromatological analyses concerning dry matter, ash, crude fibre, crude protein, oil (Table 6) and glucosinolate analysis (Table 7) were carried out.
As regards the bromatological analyses, the protein content rate found was about 26% in the varieties C1199, C1200, C1201, C1208 and in the synthetic population C1215, while the highest values were found in C1204 (30.7%) and in C1202 (29.4%). The oil content, on the other hand, recorded the lowest value in the C1209 variety (23.6%) and the highest value in the C1201 variety (31.4%) (Table 6).
The protein content found agrees with that reported in the literature; in fact, in Perera et al. [17], the range of protein content is between 20 and 30%, while the oil content is between 35 and 43% [17]. In their work, the oil content can probably be traced to drought and high temperatures, as reported in the work of Brock et al. [18], who demonstrated that seed oil content can differ within species based on growing conditions, particularly temperature [18]. Among the fatty acid present in Camelina sativa, erucic acid represent an important antinutritional factor, in particular in the spring varieties compared to the winter varieties, as reported by Kurasiak-Popowska et al. [9]. In this paper, the content of erucic acid in the spring genotypes was 3.4% vs. 0.1% in the winter genotypes [9]. However, in this work, we take into consideration only glucosinolates antinutritional compounds, which are the main limiting factor concerning the utilization of camelina as food and feed.
Concerning the quantification of glucosinolates (GLS), the genetic materials in our study showed values from 17 to 26.5 mmol/kg (Table 7), while in the work of Russo et al., the range reported for the species Camelina sativa was 23−44 mmol/g [19].
As shown in Jiang et al. [16], the GLS content in camelina is highly dependent on the soil sulfur and nitrogen concentrations. It has been shown how the application of sulfur results in a significant increase in the total GLS, while the application of nitrogen was negatively correlated with the GLS seed quantities [16].
However, the impact of sulfur application on GLS content varies significantly, influenced by factors such as plant species, growth stage, organs involved, and the supplied sulfur rate [20,21,22,23]. A more recent investigation conducted by Amiri-Darban et al. [24] confirmed these results regarding fertilization and demonstrated the significant influence of drought stress conditions on the GLS content. The current study observed an augmentation in GLS content when plants were exposed to drought stress conditions. This increase in GLS accumulation is believed to be a plant response triggered by the osmotic adjustment process in the face of drought stress. The study suggests that the magnitude and duration of drought play a crucial role in determining the accumulation of specific glucosinolates, along with the developmental stage of the plant when the stress is applied [24].
These results suggest that GLS in camelina can be manipulated through the use of cultural management practices such as the application of nitrogen and sulfur.
Taking together all these data, a correlation analysis was performed, and three of these correlations were negative: the number of branches and the number of seeds per siliqua (r = −0.81761; p = 0.007103) (Figure 4A), the branch height and the number of siliques per plant (r = −0.72895; p = 0.025873) (Figure 4B), and the silique length and yield (r = −0.8231; p = 0.0064183) (Figure 4C).
Regarding the strongest correlation, which was between the length of the siliqua and the yield (Figure 4C), Li et al. [25] found eight QTLs (quantitative trait locus) associated with siliqua length [25]. In their work, the genetic variation of Camelina sativa was evaluated using 161,301 SNPs (Single nucleotide polymorphism) generated by the use of whole-genome resequencing, and out of a worldwide collection of 222 accessions, it was confirmed that within the species, the genetic variability is moderate/low. Furthermore, GWAS (genome-wide association studies), supplemented with linkage mapping, used an RIL (Recombinant inbred line) population consisting of 257 lines and allowed them to identify QTLs associated with several characteristics, in particular with siliqua length. Indeed, as reported by Li et al. [25], QTLs associated with siliqua length were found on the following chromosomes: Chr7 (SNP loc. 14,318,121; p = 6.37 × 10⁻¹¹; MAF 0.217; effect 0.135), Chr12 (SNP loc. 4,754,022; p = 4.05 × 10⁻¹⁰; MAF 0.481; effect 0.122), Chr13 (SNP loc. 16,869,038; p = 7.30 × 10⁻¹⁰; MAF 0.222; effect −0.192), Chr5 (SNP loc. 16,896,860; p = 3.01 × 10⁻⁹; MAF 0.147; effect 0.187), Chr6 (SNP loc. 13,707,922; p = 1.13 × 10⁻⁸; MAF 0.451; effect 0.109), Chr16 (SNP loc. 26,230,101; p = 2.10 × 10⁻⁸; MAF 0.112; effect 0.189), Chr9 (SNP loc. 7,139,766; p = 1.00 × 10−07; MAF 0.157; effect −0.160) and Chr8 (SNP loc. 10,452,428; p = 1.37 × 10⁻⁷; MAF 0.126; effect 0.177). It can be hypothesized that among the eight QTLs associated with siliqua length, there are one or more genes that are linked with the trait yield [25].
The other three positive correlations found are between the weight of 1000 seeds and the oil content (r = 0.74559; p = 0.021102) (Figure 4D), the number of plants per m2 and oil content (r = 0.78185; p = 0.012803) (Figure 4E) and the crude protein and glucosinolates content (GLS) (r = 0.66743; p = 0.049508) (Figure 4F). The first positive correlation reported in Figure 4D, regarding the percentage of oil in the seeds with the weight of 1000 seeds, confirms one of the most important traits to look for in a breeding program to improve yield, which is the size of the seed, especially to increase the oil content. Another positive correlation was found between glucosinolates and protein content (Figure 4F). With the aim to explain this correlation, we proposed two hypotheses: (i) Glucosinolates are sulphur compounds whose biosynthetic pathway starts from sulphur amino acids, which could explain the correlation found; (ii) Epithiospecific proteins (ESPs) are non-catalytic cofactors of myrosinase, and they are correlated with the content of glucosinolates, as reported in the work of Williams and co-authors, 2008. ESPs were found to determine the proportion of nitriles produced by hydrolysis of glucosinolates [26].
After the correlations analysis, all of the collected data were used to perform a multivariate analysis, and the main determinants describing clustering that have been highlighted are plant height and glucosinolates content (Figure 5).
Glucosinolates (sulfur glycosides) are antinutritional compounds that limit the use of camelina cake left over from oil extraction in Europe and the United States. The limits of use are indicated in the European regulation EC Directive 2013/1275, and although in camelina the content of glucosinolates is lower (23−44 mmol/g) compared to other Brassicaceae crops, the quantity exceeds European legislation [19]. For this reason, breeding programs are trying to lower the content of glucosinolates. In this work, the results obtained from the analysis carried out on these compounds identified, among the plant materials under study, the synthetic population (C1215) as the one with the lowest content (about 17 mmol/kg), as well as the C1199 variety, which is a parent of the crossing that originated the synthetic population.
To our knowledge, this is the first work in which a synthetic population of Camelina sativa has been developed and tested.
The results obtained regarding the synthetic population (C1215) cultivated in both spring and winter recorded the third-highest yield value. This leads us to suppose that the synthetic population, as reported, for example, in rapeseed, is the most resilient genetic material with respect to different environments and growth conditions [27]. The resulting plants in the synthetic population will exhibit a wide range of traits, which can be assessed and selected for specific characteristics in subsequent generations. This genetic diversity can be beneficial for plant breeders, as it provides a broader pool of genetic variation to work with, allowing for the development of improved plant varieties with desirable traits such as disease resistance, increased yield, or environmental adaptation [27].
By exploiting the adaptive potential of the synthetic population, the cultivation of camelina could be extended to marginal and/or mountainous areas since it shows tolerance to unfavourable conditions, contributing to yield stability and abiotic and biotic stress resistance.

5. Conclusions

In conclusion, the results of this work highlighted, firstly, that in northern Italy, the best yield is obtained following an autumn–winter cultivation. Secondly, camelina breeding programs should be developed considering the growing season because our results clearly show that the most productive varieties in winter are the least productive in spring. Thirdly, seed size is the most important parameter to consider towards having a high oil yield. Finally, synthetic populations of Camelina sativa may represent the best genetic constitution for both spring and winter sowing.

Supplementary Materials

The following supporting information can be downloaded at: https://www.mdpi.com/article/10.3390/agronomy13061562/s1, Table S1: long-term average precipitation and temperature data.

Author Contributions

Conceptualization, R.P. and M.G.; methodology, M.G. and M.L.; software, M.G.; validation, M.G. and R.P.; formal analysis, S.F., S.D.B., L.R. and A.S.; investigation, M.G. and R.P.; resources, R.P.; data curation, M.G., S.S., S.F. and S.D.B.; writing—original draft preparation, M.G.; writing—review and editing, R.P., M.L., L.R. and A.S.; visualization, M.G.; supervision, R.P.; project administration, R.P.; funding acquisition, R.P. All authors have read and agreed to the published version of the manuscript.

Funding

Agritech National Research Centre and received funding from the European Union NextGenerationEU (PIANO NAZIONALE DI RIPRESA E RESILIENZA (PNRR)–MISSIONE 4 COMPONENTE 2, INVESTIMENTO 1.4–D.D. 1032 17/06/2022, CN00000022) to R.P. This manuscript reflects only the authors’ views and opinions; neither the European Union nor the European Commission can be considered responsible for them.

Data Availability Statement

Not applicable.

Acknowledgments

We wish to thank Davide Reginelli for his work in the field and Lesley Currah for her editing and suggestions.

Conflicts of Interest

The authors declare no conflict of interest.

References

  1. Vollmann, J.; Moritz, T.; Kargl, C.; Baumgartner, S.; Wagentristl, H. Agronomic Evaluation of Camelina Genotypes Selected for Seed Quality Characteristics. Ind. Crops Prod. 2007, 26, 270–277. [Google Scholar] [CrossRef]
  2. Falk, K.C. Camelina (Camelina sativa). In Biofuel Crops: Production, Physiology and Genetics; CABI: Wallingford, UK, 2013; pp. 369–391. [Google Scholar]
  3. Gore, M.; Kurt, O. Evaluation of Camelina Genotypes Grown in Winter at Different Sowing Times in Northern Turkey Ecological Conditions in Terms of Yield and Oil Ratio. Agrotech. Ind. Crops 2022, 1, 154–159. [Google Scholar]
  4. Government of Canada; Canadian Food Inspection Agency. The Biology of Camelina sativa (L.) Crantz (Camelina). Available online: https://inspection.canada.ca/plant-varieties/plants-with-novel-traits/applicants/directive-94-08/biology-documents/camelina-sativa-l-/eng/1330971423348/1330971509470 (accessed on 18 November 2022).
  5. Ghidoli, M.; Ponzoni, E.; Araniti, F.; Miglio, D.; Pilu, R. Genetic Improvement of Camelina sativa (L.) Crantz: Opportunities and Challenges. Plants 2023, 12, 570. [Google Scholar] [CrossRef] [PubMed]
  6. Zubr, J. Oil-Seed Crop: Camelina sativa. Ind. Crops Prod. 1997, 6, 113–119. [Google Scholar] [CrossRef]
  7. Rodríguez-Rodríguez, M.F.; Moreno-Pérez, A.J.; Makni, S.; Troncoso-Ponce, M.A.; Acket, S.; Thomasset, B.; Sánchez, R.; Venegas-Calerón, M.; Garcés, R.; Martínez-Force, E.; et al. Lipid Profiling and Oil Properties of Camelina sativa Seeds Engineered to Enhance the Production of Saturated and Omega-7 Fatty Acids. Ind. Crops Prod. 2021, 170, 113765. [Google Scholar] [CrossRef]
  8. Matthäus, B.; Zubr, J. Variability of Specific Components in Camelina sativa Oilseed Cakes. Ind. Crops Prod. 2000, 12, 9–18. [Google Scholar] [CrossRef]
  9. Kurasiak-Popowska, D.; Graczyk, M.; Stuper-Szablewska, K. Winter Camelina Seeds as a Raw Material for the Production of Erucic Acid-Free Oil. Food Chem. 2020, 330, 127265. [Google Scholar] [CrossRef]
  10. Russo, R.; Reggiani, R. Antinutritive Compounds in Twelve Camelina sativa Genotypes. Am. J. Plant Sci. 2012, 3, 1408–1412. [Google Scholar] [CrossRef] [Green Version]
  11. Berti, M.; Gesch, R.; Eynck, C.; Anderson, J.; Cermak, S. Camelina Uses, Genetics, Genomics, Production, and Management. Ind. Crops Prod. 2016, 94, 690–710. [Google Scholar] [CrossRef]
  12. Landoni, M.; Scapin, A.; Cassani, E.; Borlini, G.; Follador, A.; Giupponi, L.; Ghidoli, M.; Hejna, M.; Rossi, L.; Pilu, R. Comparison among Four Maize Varieties in Conventional and Low Input Cultivation. Maydica 2021, 65, 1–13. [Google Scholar]
  13. Angelini, L.G.; Abou Chehade, L.; Foschi, L.; Tavarini, S. Performance and Potentiality of Camelina (Camelina sativa L. Crantz) Genotypes in Response to Sowing Date under Mediterranean Environment. Agronomy 2020, 10, 1929. [Google Scholar] [CrossRef]
  14. Berti, M.; Wilckens, R.; Fischer, S.; Solis, A.; Johnson, B. Seeding Date Influence on Camelina Seed Yield, Yield Components, and Oil Content in Chile. Ind. Crops Prod. 2011, 34, 1358–1365. [Google Scholar] [CrossRef]
  15. Pavlista, A.D.; Isbell, T.A.; Baltensperger, D.D.; Hergert, G.W. Planting Date and Development of Spring-Seeded Irrigated Canola, Brown Mustard and Camelina. Ind. Crops Prod. 2011, 33, 451–456. [Google Scholar] [CrossRef] [Green Version]
  16. Jiang, Y.; Li, J.; Caldwell, C.D. Glucosinolate Content of Camelina Genotypes as Affected by Applied Nitrogen and Sulphur. Crop Sci. 2016, 56, 3250–3262. [Google Scholar] [CrossRef]
  17. Perera, S.P.; McIntosh, T.; Coutu, C.; Tyler, R.T.; Hegedus, D.D.; Wanasundara, J.P.D. Profiling and Characterization of Camelina sativa (L.) Crantz Meal Proteins. J. Am. Oil Chem. Soc. 2022, 99, 873–889. [Google Scholar] [CrossRef]
  18. Brock, J.R.; Scott, T.; Lee, A.Y.; Mosyakin, S.L.; Olsen, K.M. Interactions between Genetics and Environment Shape Camelina Seed Oil Composition. BMC Plant Biol. 2020, 20, 423. [Google Scholar] [CrossRef]
  19. Russo, R.; Galasso, I.; Reggiani, R. Variability in Glucosinolate Content among Camelina Species. Am. J. Plant Sci. 2014, 5, 42529. [Google Scholar] [CrossRef] [Green Version]
  20. Biofumigation Potential of Brassicas|SpringerLink. Available online: https://link.springer.com/article/10.1023/A:1004364713152 (accessed on 29 May 2023).
  21. Castro, A.; Aires, A.; Rosa, E.; Bloem, E.; Stulen, I.; De Kok, L. Distribution of Glucosinolates in Brassica Oleracea Cultivars. Phyton Ann. Rei Bot. 2004, 44, 133–143. [Google Scholar]
  22. Falk, K.L.; Tokuhisa, J.G.; Gershenzon, J. The Effect of Sulfur Nutrition on Plant Glucosinolate Content: Physiology and Molecular Mechanisms. Plant Biol. Stuttg. Ger. 2007, 9, 573–581. [Google Scholar] [CrossRef]
  23. Antonious, G.F.; Bomford, M.; Vincelli, P. Screening Brassica Species for Glucosinolate Content. J. Environ. Sci. Health B 2009, 44, 311–316. [Google Scholar] [CrossRef]
  24. Amiri-Darban, N.; Nourmohammadi, G.; Shirani Rad, A.H.; Mirhadi, S.; Heravan, I. Potassium Sulfate and Ammonium Sulfate Affect Quality and Quantity of Camelina Oil Grown with Different Irrigation Regimes. Ind. Crops Prod. 2020, 148, 112308. [Google Scholar] [CrossRef]
  25. Li, H.; Hu, X.; Lovell, J.T.; Grabowski, P.P.; Mamidi, S.; Chen, C.; Amirebrahimi, M.; Kahanda, I.; Mumey, B.; Barry, K.; et al. Genetic Dissection of Natural Variation in Oilseed Traits of Camelina by Whole-Genome Resequencing and QTL Mapping. Plant Genome 2021, 14, e20110. [Google Scholar] [CrossRef] [PubMed]
  26. Williams, D.J.; Critchley, C.; Pun, S.; Nottingham, S.; O’Hare, T.J. Epithiospecifier Protein Activity in Broccoli: The Link between Terminal Alkenyl Glucosinolates and Sulphoraphane Nitrile. Phytochemistry 2008, 69, 2765–2773. [Google Scholar] [CrossRef]
  27. Becker, H.C.; Svensk, H.; Engqvist, G. Chances and Limitations for the use of Heterosis in Synthetic Cultivars of Rapeseed. Groupe Consult. Int. Rech. Colza (GCIRC) Bull. 1998, 15, 51–57. [Google Scholar]
Figure 1. The plant height (A), number of branches (B) and the weight of 1000 seeds (C) and the estimated yield (D) of camelina varieties in the spring field. The plant height (E), number of branches (F), weight of 1000 seeds (G) and the estimated yield (H) of camelina varieties in the winter field. For each parameter measured, different letters indicate statistically significant differences (Tukey’s test, p < 0.05).
Agronomy 13 01562 g001
Figure 2. Regression plot between the yield of spring and winter cultivation (r = −0.65565; p = 0.0552). In blue confidence band for the regression, in red regression line.
Agronomy 13 01562 g002
Figure 3. Correlation plot. Negative correlations in red, positive correlations in blue. Gray box on statistically significant correlations p < 0.05.
Agronomy 13 01562 g003
Figure 4. Regression plots of statistically significant negatives correlations. (A) Number of branches (NB) and number of seeds per siliqua (NSS) (r = −0.81761; p = 0.007103); (B) branch height (BH) and number of siliques per plant (NSP) (r = −0.72895; p = 0.025873); (C) silique length (SL) and yield (Y) (r = −0.8231; p = 0.0064183). In blue, confidence band for the regression, in red, regression line. Regression plots of statistically significant correlations. (D) weight of 1000 seeds (W1000) and % Oil (%O) (r = 0.74559; p = 0.021102) (E) number of plants per m2 (NP) and % Oil (%O) (r = 0.78185; p = 0.012803); (F) % crude protein (%CP) and glucosinolates content (GLS) (r = 0.66743; p = 0.049508). In blue confidence band for the regression, in red regression line.
Agronomy 13 01562 g004aAgronomy 13 01562 g004b
Figure 5. Principal components analysis (PCA) obtained using parameters of Figure 3. In green the main determinants of the clustering.
Agronomy 13 01562 g005
Table 1. Camelina sativa genotype and their respective ID codes tested in the study.
Name VarietiesGenetic ConstitutionCode
CalenaPure lineC1201
OmichPure lineC1204
MadalinaPure lineC1202
Experimental materialPure lineC1199
Experimental materialPure lineC1200
Experimental materialPure lineC1207
Experimental materialPure lineC1208
Experimental materialPure lineC1209
Experimental materialSynthetic population
(C1199 × C1204)
C1215
Table 2. Soil analysis of the experimental field used for this study. SD are shown (n = 3). Modified from [12].
ParametersValues
pH (H2O) 6.5 ± 0.01
Organic matter 14.2 ± 0.12 g/kg
Sand 56.2 ± 0.37%
Coarse Silt 14.6 ± 0.52%
Fine Silt 22.6 ± 1.53%
Clay 6.6 ± 0.63%
P available (Bray/Kurtz) 136 ± 1.44 mg/kg
Cation Exchange Capacity 10.6 ± 0.24 cmol/kg
K exchangeable432 ± 8.16 mg/kg
Mg exchangeable229 ± 9.40 mg/kg
Ca exchangeable1331 ± 22.6 mg/kg
Estimated water holding capacity 24.3 ± 1.59%
Table 3. Cumulative rainfall and average monthly temperatures relating to the spring cultivation and the winter cultivation.
YearMonthMonthly Rainfall (mm)Mean Monthly Temperature (°C)
2021April70.613.22
May60.818.67
June15.826.03
2021October5214.12
November165.69.49
December463.11
2022January283.18
February167.59
March9.89.13
April2514.44
May6222.47
Table 4. Comparison of yields between spring cultivation (S) and winter cultivation (W) of Camelina sativa benchmark (C1199, C1200, C1201, C1204, C1207, C1208 and C1209) and the synthetic population (C1215). For each parameter measured, the asterisk indicates statistically significant differences of the trait between the spring field and the winter field (Student’s t-test, p < 0.05).
ID CodeCultivation PeriodTrait
Yield
(g/m2)
Estimated Yield (kg/ha)
C1199S59.68 ± 15.01596.83 ± 150
W240.18 ± 36.46 *2401.83 ± 365 *
C1200S56.39 ± 20.14563.92 ± 201
W192.18 ± 21.20 *1921.83 ± 212 *
C1201S45.64 ± 10.06456.38 ± 101
W258.93 ± 59.93 *2589.33 ± 599 *
C1202S60.47 ± 20.01604.66 ± 200
W204.77 ± 69.43 *2047.67 ± 694 *
C1204S70.46 ± 20.02704.55 ± 200
W167.02 ± 13.19 *1670.17 ± 132 *
C1207S81.48 ± 18.25814.80 ± 183
W167.48 ± 24.40 *1674.83 ± 244 *
C1208S62.73 ± 19.81627.30 ± 198
W195.98 ± 20.18 *1959.83 ± 202 *
C1209S65.43 ± 23.42654.32 ± 234
W111.77 ± 21.80 *1117.67 ± 218 *
C1215S63.98 ± 15.10639.83 ± 151
W228.42 ± 9.03 * 2284.20 ± 90.3 *
TotalS62.17 ± 16.36621.66 ± 164
W196.26 ± 58.57 *1962.57 ± 586 *
Table 5. Agronomic characterization of Camelina sativa benchmark (C1199, C1200, C1201, C1202, C1204, C1207, C1208 and C1209) and the synthetic population (C1215) in winter cultivation. For each parameter measured, different letters indicate statistically significant differences (Tukey’s test, p < 0.05). Plant height (PH), number of branches (NB), branch height (BH), stem diameter (SD), number of siliques per plant (NSP), number of seeds per silique (NSS), silique length (SL), silique width (SW), weight of 1000 seeds (W1000), number of plants per m2 (NP) and the yield (Y).
TraitsID Code
C1199C1200C1201C1202C1204C1207C1208C1209C1215
PH (cm)70.85 ± 12.66 81.00 ± 5.50 75.83 ± 6.37 83.55 ± 9.28 81.25 ± 5.82 80.18 ± 12.64 71.10 ± 20.44 69.78 ± 9.31 70.14 ± 7.45
NB4.08 ± 2.14 ab4.63 ± 2.07 ab6.17 ± 4.36 a4.64 ± 2.06 ab3.75 ± 1.60 ab4.80 ± 1.99 ab2.67 ± 1.32 ab2.56 ± 1.81 b4.57 ± 1.90 ab
BH (cm)39.25 ± 9.76 a38.75 ± 5.39 a38.83 ± 9.06 a42.00 ± 10.73 a42.92 ± 10.15 a37.60 ± 12.84 a46.67 ± 6.71 a38.88 ± 6.10 a31.71 ± 10.93 b
SD (mm)2.74 ± 0.41 2.25 ± 0.63 2.76 ± 0.82 2.08 ± 0.62 1.97 ± 0.73 2.05 ± 0.47 1.90 ± 0.45 2.66 ± 1.02 2.36 ± 0.59
NSP45.17 ± 6.85 37.08 ± 4.09 52.64 ± 12.18 29.80 ± 10.10 37.52 ± 2.96 26.68 ± 3.75 26.82 ± 3.75 30.84 ± 3.67 41.57 ± 20.96
NSS13.05 ± 3.34 b12.10 ± 3.11 b12.40 ± 3.20 b13.00 ± 2.62 b12.90 ± 3.73 b13.70 ± 2.45 ab17.80 ± 2.20 a16.78 ± 2.78 a13.21 ± 3.05 b
SL (mm)5.60 ± 1.01 b6.42 ± 0.81 a5.40 ± 0.70 b6.30 ± 0.95 ab6.40 ± 0.52 ab6.00 ± 0.29 ab5.90 ± 0.74 ab6.70 ± 0.81 a6.11 ± 0.89 ab
SW (mm)3.05 ± 0.22 b3.30 ± 0.46 a2.30 ± 0.48 c3.00 ± 0.11 ab2.90 ± 0.35 b3.00 ± 0.11 ab3.00 ± 0.15 ab3.00 ± 0.14 b2.85 ± 0.47 b
W1000 (g)1.24 ± 0.08 bc1.28 ± 0.03 c1.23 ± 0.03 bc1.25 ± 0.03 bc1.16 ± 0.05 bd1.44 ± 0.04 a1.19 ± 0.03 cd1.11 ± 0.02 d1.24 ± 0.04 bc
NP320 ± 77.62 ab328.33 ± 35.11 ab321.67 ± 79.43 ab421.67 ± 85.20 a298.33 ± 46.46 ab317.50 ± 29.30 ab345.00 ± 50.00 ab185 ± 56.35 b213.33 ± 65.26 b
Y (g/m2)240.18 ± 36.46 a192.18 ± 21.20 ab258.93 ± 59.93 a204.77 ± 69.43 ab167.02 ± 13.19 ab167.48 ± 25.83 ab195.98 ± 27.41 ab111.77 ± 13.30 b228.42 ± 9.03 a
Y (kg/ha)2401.83 ± 365 a1921.83 ± 212 ab2589.33 ± 599 a2047.67 ± 694 ab1670.17 ± 132 ab1674.83 ± 258 ab1959.83 ± 274 ab1117.67 ± 133 b2284.20 ± 903 a
Table 6. Compositional analyses carried out on Camelina sativa seeds. The nutrient composition is expressed on a dry matter (DM) basis. For each parameter measured, different letters indicate statistically significant differences (Tukey’s test, p < 0.05). Dry matter (%DM), ash (%A), crude fibre (%CF), crude protein (%CP) and oil (%O).
ID Code%DM %A%CF%CP%O
C119995.21 ± 0.95 4.27 ± 0.02 cd24.49 ± 1.31 a26.35 ± 1.47 b 29.99 ± 1.00 ab
C120095.56 ± 0.22 4.37 ± 0.02 ad20.01 ± 0.52 b26.54 ± 1.06 b30.61 ± 0.58 a
C120195.61 ± 0.31 4.55 ± 0.04 a20.22 ± 0.77 b26.12 ± 1.54 b 31.43 ± 0.78 a
C120295.31 ± 0.30 4.25 ± 0.05 d21.05 ± 1.33 ab 29.37 ± 0.26 ab 30.54 ± 1.37 a
C120495.48 ± 0.20 4.28 ± 0.06 bd 24.04 ± 1.70 a30.75 ± 1.26 a26.39 ± 0.78 cd
C120795.39 ± 0.29 4.28 ± 0.12 bd 21.79 ± 0.19 ab26.91 ± 1.16 b31.15 ± 0.30 a
C120895.62 ± 0.27 4.46 ± 0.07 abc 22.74 ± 1.82 ab26.32 ± 0.21 b 29.63 ± 1.49 ab
C120995.05 ± 0.85 4.54 ± 0.03 a21.16 ± 0.47 ab27.03 ± 1.87 b 23.58 ± 1.70 d
C121595.08 ± 0.35 4.55 ± 0.12 a 23.91 ± 1.75 a26.22 ± 1.55 b27.13 ± 0.88 bc
Table 7. Glucosinolates analyses carried out on Camelina sativa seeds. For each parameter measured, different letters indicate statistically significant differences (Tukey’s test, p < 0.05). Glucosinolates content (GLS).
ID CodeGLS (mmol/kg)
C119917.10 ± 0.03 de
C120019.25 ± 0.07 d
C120123.21 ± 0.19 bc
C120225.15 ± 1.22 ab
C120426.52 ± 0.35 a
C120724.88 ± 1.50 ab
C120821.90 ± 0.40 c
C120924.29 ± 0.11 ab
C121516.92 ± 1.22 e
Disclaimer/Publisher’s Note: The statements, opinions and data contained in all publications are solely those of the individual author(s) and contributor(s) and not of MDPI and/or the editor(s). MDPI and/or the editor(s) disclaim responsibility for any injury to people or property resulting from any ideas, methods, instructions or products referred to in the content.

