Article

Counting Crowded Soybean Pods Based on Deformable Attention Recursive Feature Pyramid

1
College of Artificial Intelligence, Nanjing Agricultural University, Nanjing 210095, China
2
National Engineering & Technology Center for Information Agricultural, Nanjing Agricultural University, Nanjing 210095, China
3
National Center for Soybean Improvement, Key Laboratory of Biology & Genetics & Breeding for Soybean, Ministry of Agriculture, State Key Laboratory for Crop Genetics & Germplasm Enhancement, Nanjing Agricultural University, Nanjing 210095, China
*
Author to whom correspondence should be addressed.
Agronomy 2023, 13(6), 1507; https://doi.org/10.3390/agronomy13061507
Submission received: 11 May 2023 / Revised: 23 May 2023 / Accepted: 27 May 2023 / Published: 30 May 2023
(This article belongs to the Special Issue Precision Operation Technology and Intelligent Equipment in Farmland)

Abstract

:
Counting the soybean pods automatically has been one of the key ways to realize intelligent soybean breeding in modern smart agriculture. However, the pod counting accuracy for whole soybean plants is still limited due to the crowding and uneven distribution of pods. In this paper, based on the VFNet detector, we propose a deformable attention recursive feature pyramid network for soybean pod counting (DARFP-SD), which aims to identify the number of soybean pods accurately. Specifically, to improve the feature quality, DARFP-SD first introduces the deformable convolutional networks (DCN) and attention recursive feature pyramid (ARFP) to reduce noise interference during feature learning. DARFP-SD further combines the Repulsion Loss to correct the error of predicted bboxse coming from the mutual interference between dense pods. DARFP-SD also designs a density prediction branch in the post-processing stage, which learns an adaptive soft distance IoU to assign suitable NMS threshold for different counting scenes with uneven soybean pod distributions. The model is trained on a dense soybean dataset with more than 5300 pods from three different shapes and two classes, which consists of a training set of 138 images, a validation set of 46 images and a test set of 46 images. Extensive experiments have verified the performance of proposed DARFP-SD. The final training loss is 1.281, and an average accuracy of 90.35%, an average recall of 85.59% and a F1 score of 87.90% can be achieved, outperforming the baseline method VFNet by 8.36%, 4.55% and 7.81%, respectively. We also validate the application effect for different numbers of soybean pods and differnt shapes of soybean. All the results show the effectiveness of the DARFP-SD, which can provide a new insight into the soybean pod counting task.

1. Introduction

Soybean is an important crop, containing rich protein and fat, whose safe production contributes to economic development and social stability. As the most effective way to improve yield, cultivating high-quality soybean varieties has attracted many breeders’ research interests. In actual breeding, the number of pods per plant is one of the most important indicators to evaluate the quality and yield of soybean varieties. However, the number of pods per plant is mainly obtained through manual counting, which is time-consuming and laborious, limiting the development of large-scale and high-throughput soybean breeding. In this case, it is urgent to find a fast and efficient method for automatic pod counting.
Thanks to the rapid development of image acquisition equipment and artificial intelligence algorithms, counting the harvest organ based on object detection models has been proved to be a promising artificial alternative, which has been applied to various field objects such as soybeans [1], wheat ears [2,3,4], rice panicles [5,6], fruits [7,8,9,10,11,12], etc. For example, gulzar et al. [11,12] carry out a series of work focus on the fruits classification based on deep learning. Lyu et al. [10] replace the convolution layer of YOLO V5 with the attention convolution module to extract more spatial and semantic information of green oranges, which effectively reduces the missed detection caused by the confusion between oranges and the environment. Sun et al. [13] introduce the AugFPN to narrow the semantic gap between features of different scales and reduce the information loss of the feature map, which improves the detection capability of small wheat ears. For soybean pod counting tasks, Uzal et al. [14] train the pod detection model after manually disassembling pods. Though reducing the work intensity of manual counting to a certain extent, destructive sampling makes the sample unable to maintain the original structural information, which is not conducive to obtaining the phenotypic information of the whole plant. To solve the above problem, Guo et al. [15] directly detect pods on the whole soybean plant and achieve a speed of 240 plants/hour, greatly improving the detection efficiency. Li et al. [16] further propose the SPM-IS, which acquires a material soul type based on instance segmentation.
Existing soybean pod detection works advanced both the counting accuracy and speed, while their performances still cannot meet the actual application demand for counting pods, especially for the following scenes: (1) Crowded pods. A large number of pods are often crowded in a certain area of a single soybean image because of the cluster growth characteristics of soybean pods. The pods with uncertain posture are shielded by the stems and surrounding pods. When the convolution neural network extracts the feature of pods, it will inevitably mix with noise, affecting the final detection accuracy. (2) Uneven distribution of pods. The multi-branched structure of soybean makes the pod density change obviously in different local areas. The detection model not only generates anchors of a fixed size and number for each spatial position uniformly when generating candidate proposals, but also fuses predicted bounding boxes with a given threshold. Both two aspects make it is impossible to achieve adaptive detection according to the pod density, resulting in some pods being missing from the count.
To improve the soybean pod counting accuracy, in this paper, we first adopt the dense anchor-free detection algorithm VarifocalNet [17] as the baseline and qualitatively analyze the advantages when applying the VarifocalNet in the soybean pod detection. Different from previous efforts that mainly follow the Faster-RCNN or YOLO series, VarifocalNet includes an IoU-aware Classification Score (IACS) in the classification branch and a star-shaped bounding box representation method in the regression branch, respectively. IACS multiplies the original classification score and IoU between the predicted bbox and its ground truth, whose output will be used as the class label value to improve the reliability of the prediction box ranking. Compared with the classification scores used by existing algorithms such as YOLO, IACS helps integrate the spatial information of the bounding box into the classification score, which can simultaneously evaluate the classification confidence and positioning quality of the box. The star-shaped box representation method selects eight fixed points around the sampling points on the feature map. For pods with variable shapes, this representation method can better capture the geometric shape of the bounding box and the local context information than the diagonal point coordinate representation method used by other algorithms. At the same time, to alleviate the issues of crowded and uneven pods, we further propose a deformable attention recursive feature pyramid network (DARFP-SD) for soybean pod counting based on the VarifocalNet. DARFP-SD first introduces the deformable convolutional networks (DCN) and attention recursive feature pyramid (ARFP), which aims to reduce noise interference during feature learning. DARFP-SD further combines the Repulsion Loss to correct the error of predicted boxes coming from the mutual interference between dense pods. DARFP-SD finally designs a density prediction branch in the post-processing stage, which learns an adaptive soft distance IoU to assign a suitable NMS threshold for different counting scenes with uneven soybean pod distributions.
In summary, our contributions are as follows: (1) A detailed review is conducted to examine the most notable work in soybean pods based on deep learning, and challenges of crowding and uneven distribution in practical applications of pod counting are summarized. (2) A deformable attention recurrent feature pyramid network is specifically designed, which adaptively extracts fine-grained soybean features and assigns suitable NMS threshold to improve the counting performance of crowded and uneven soybean pods. (3) Extensive experiments are conducted on the constructed soybean pods dataset. Quantitative and qualitative results validate the effectiveness of the proposed method, which significantly outperforms baseline methods in different scenarios and can achieve a state-of-the-art performance compared to previous counting methods.
The layout of this paper is arranged as follows: Section 1 (this section) introduces the background of the research and to highlight the problem statement. The main contribution of this paper is presented in Section 2, where the principles and designs of the DARFP-SD algorithm are described. Section 3 discusses the results and in Section 4 the conclusion of this work is drawn and future work along the line is proposed.

2. Materials and Methods

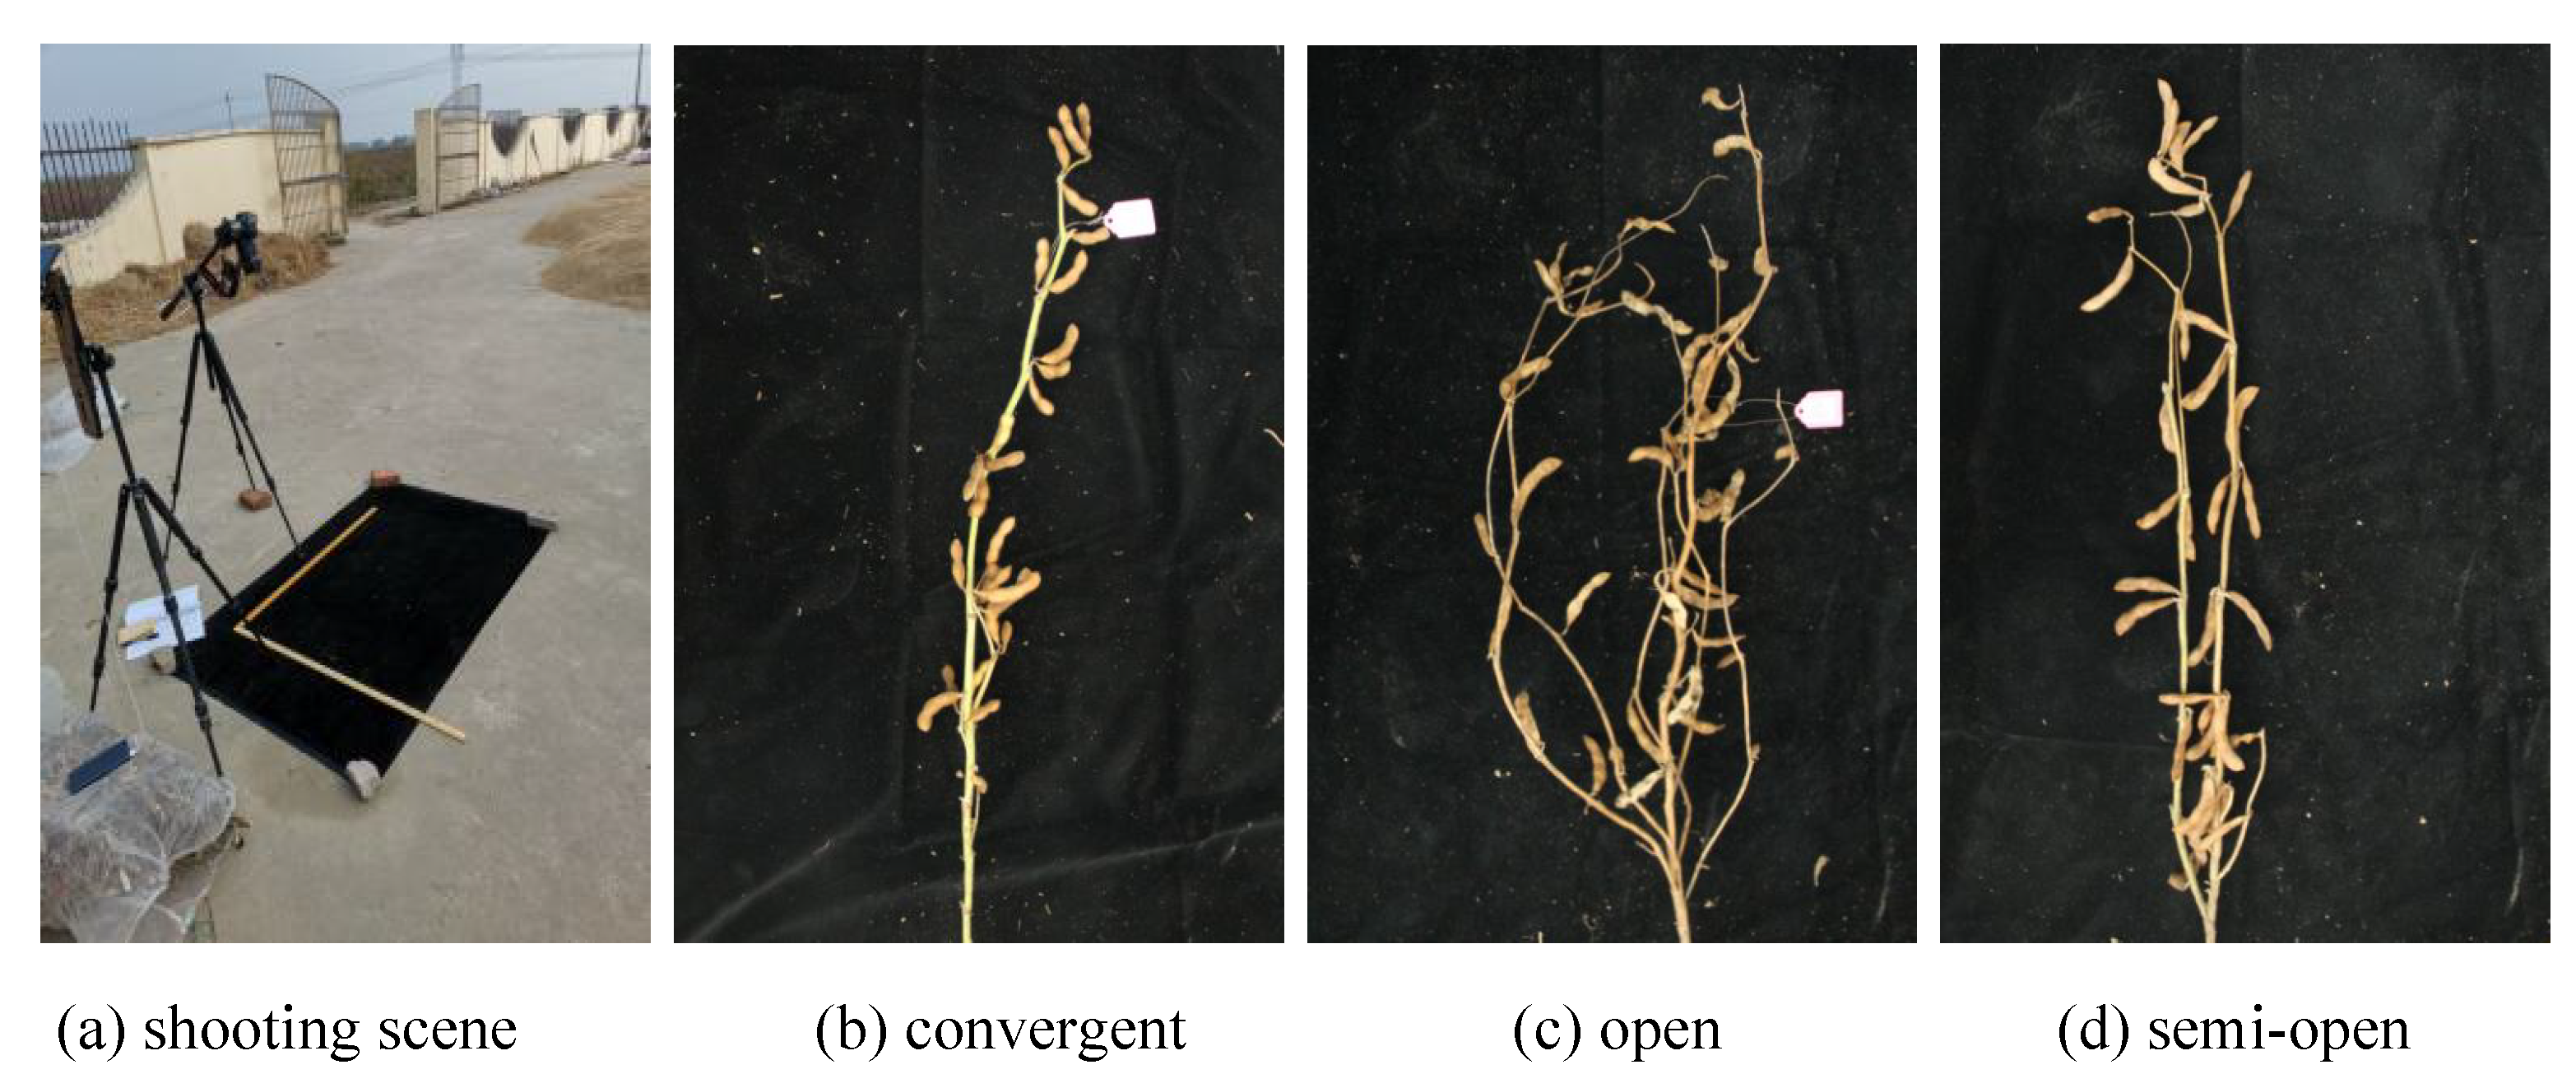
2.1. Image Acquisition and Annotation

The soybean plants are placed on the non-reflective black suede (1.5 × 1.5 m) and occurs in the middle of the camera field of view with the basic growth shape. We use a tripod to keep the camera off the ground about 1 m and the angle of the camera is about 75 degrees to the horizontal ground. The shooting scene is shown in Figure 1a. For each soybean plant, we collect 3 images and artificially select the clearer one as the representative image of the plant. According to the opening angle among the main stem, branch and petiole, as shown in Figure 1b–d, we further divide soybean shapes into: (1) Open: The angle is generally above 45 . (2) Convergent: The angle is generally 15 . (3) Semi-open: The angle is between 15 and 45 . In this study, a plant will be classified as convergent when all the branches have an angle of less than 15 with the main stem, while it is classified as open as long as there is a branch with an angle greater than 45 with the main stem.
The final soybean dataset contain 230 images with a resolution of 3456 × 5184 . The pods are yellowish brown with a relatively different shape, whose number ranges from 10–70 in a single picture. We then manually label the image through the tool of Labelme, marking the pods with a rectangular box and recording the coordinates of the upper left vertex ( X m i n , Y m i n ) and the lower right vertex ( X m a x , Y m a x ) of the labeling box. For individual pods, the minimum circumscribed rectangle is marked with a rectangular box. For pods covered by stems, the area where the stems are located is regarded as a part of the pod and marked. For crowded pods, the pods visually in the upper layer are labeled as individual pods, while the pods visually in the lower layer are labeled as a whole by considering the different parts separated by the upper pods. We split the original images into training, validation, and test sets in a ratio of 3:1:1, and the number of pictures in a different set is shown in Table 1.

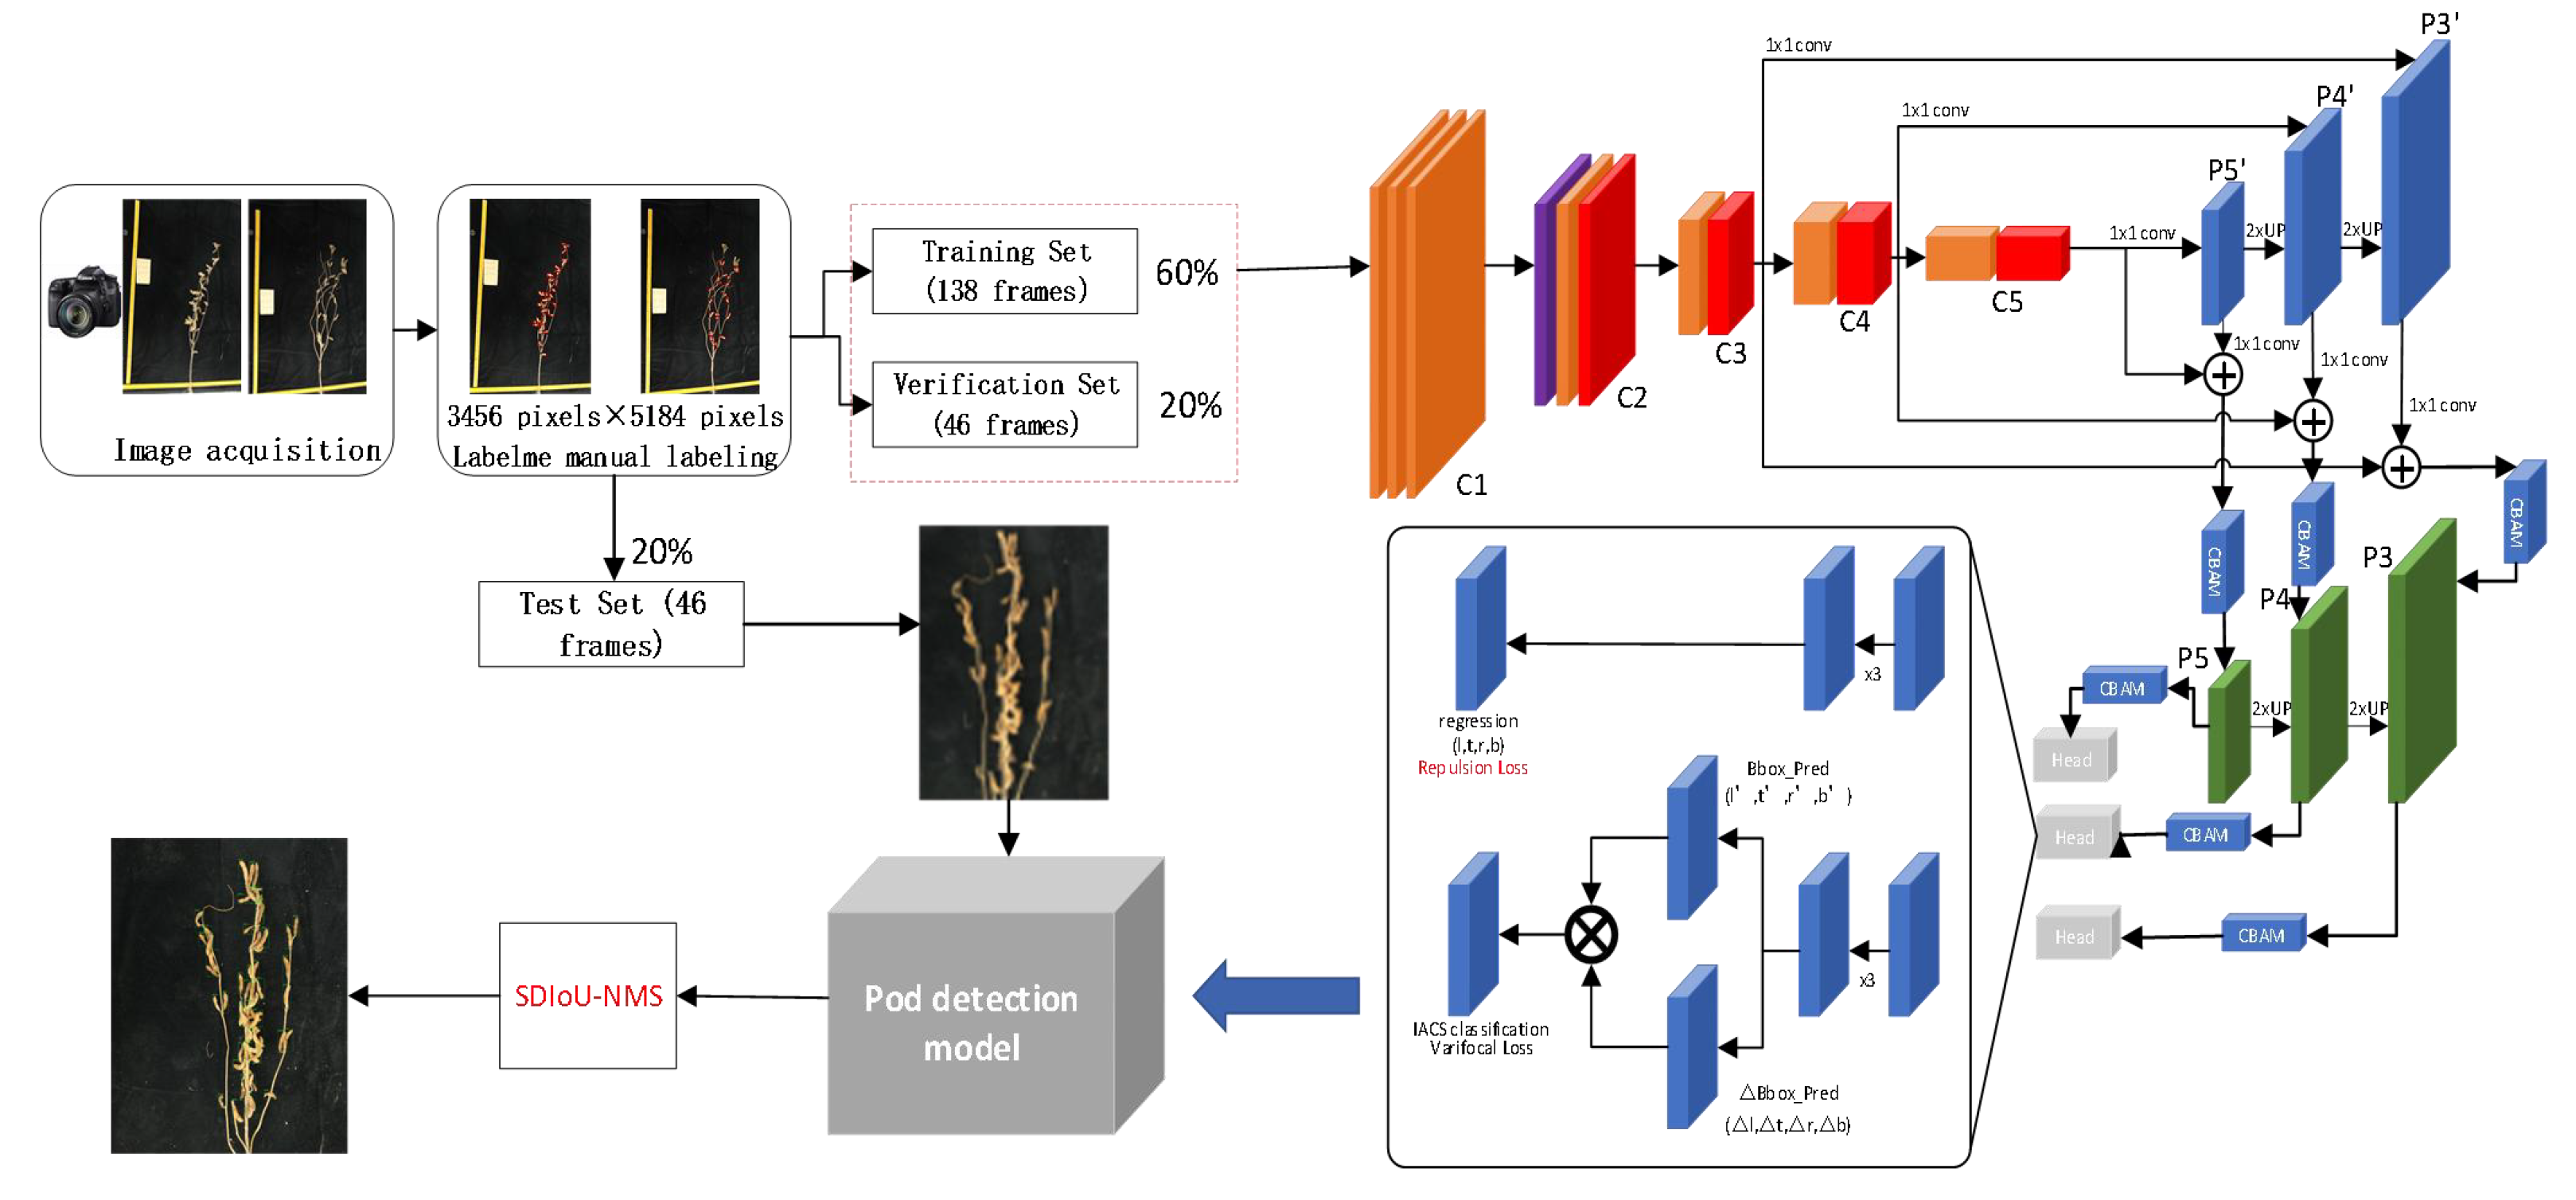
2.2. Design of DARFP-SD

The DARFP-SD algorithm mainly includes the Deformable Attention Recursive Feature Pyramid (DARFP) and the Bounding box Refinement (BR). The DARFP module firstly extracts features through the ResNet-50 backbone with the deformable convolution kernel [18], which aims to increase the size of the effective receptive field so that the sampling point of the convolution operation can avoid the interference of stems to a certain extent and improve the quality of the learning network for sheltered pod features. To select the appropriate feature map to construct a recursive pyramid, DARFP then quantifies the relationship between the pod size and receptive field, increasing the recursive feedback connection with the feature learning network. BR designs an adaptive SDIoU-NMS branch, where the local area density will be predicted to help adaptively assign the NMS threshold. BR is supervised with the Repulsion loss [19] and GIoU loss, which constrains the predicted box close to the corresponding ground truth and away from labeled boxes of other targets, which can improve the position accuracy of the candidate proposals. We will describe the detail of each module step by step in the following subsections.

2.2.1. Deformable Attention Recursive Feature Pyramid

Feature extraction based on deformable convolution. Traditional convolution operation learns the features through window sliding. When the size and stride of the convolution kernel are determined, the receptive field is fixed and its specific weight value will be determined in the network training process. Taking the 3 × 3 convolution kernel and input image X as an example, the pixel p 0 on the feature map F can be calculated as Equation (1):
F ( p 0 ) = p n R w ( p n ) · X ( p 0 + p n )
where w ( p n ) represents the weight of convolution kernel in position p n . p n is the 8 neighborhood positions of p 0 and can be formulated as p n { ( 1 , 1 ) , ( 1 , 0 ) , , ( 0 , 1 ) , ( 1 , 1 ) } . Due to the uncertainty of the growth direction of pods in a single soybean plant, as shown in the blue area of the local pod feature map in Figure 2, the fixed receptive field has a large number of sampling points outside the pods during feature learning, which will amplify the interference of background noise (such as stems) on pod features and restrict the quality of the feature map and candidate regions generated based on the feature map. To this end, we add an additional deformable convolution layer to predict the horizontal and vertical offsets for each pixel in the feature map. The whole feature extraction process of the deformable convolution for pods is shown in Equation (2):
F ( p 0 ) = p n R w ( p n ) · X ( p 0 + p n + Δ p n )
where Δ p n is the offset of the predicted pixel p n . For each pixel, its final offset is the superposition of the offset components in the horizontal and vertical direction. X ( p 0 + p n + Δ p n ) is obtained through the bilinear interpolation. As shown in the green area of the local pod feature map in Figure 2, for pods with an uncertain attitude, deformable convolution can adaptively capture various shape and scale information of pods, effectively reducing noise interference.
Feature enhancement based on attention. For the feature map F R C × H × W , before constructing the DARFP, we introduce the channel attention and spatial attention based on the convolutional block attention module (CBAM) to enhance the feature quality, as in Equation (3):
F = M S ( F ) F = M S ( M C ( F ) F ) ( M C ( F ) F )
⨂ means the element-wise multiply, and M s and M c are the channel attention and spatial attention. For the original channel-wise feature F, channel attention helps to capture the discriminative information of the object by learning the response relationship between channel features and the category label. For the crowed pods in our research scene, with semantic dependency between different channels, the features are guided to pay more attention to the pod areas rather than the complex background. The feature enhancement process based on channel attention is modeled through a max pooling M a x p o o o l ( ) and average pooling A v e p o o o l ( ) , as in Equation (4):
M c ( F ) = σ ( W 0 ( A v e p o o o l ( F ) ) + W 1 ( M a x p o o o l ( F ) ) )
Here, W 0 and W 1 are the learned weight of a shared Multilayer Perceptron. σ means a Sigmoid activation function. For the uneven pods, fully embedding their spatial position information into the features is obviously helpful to improve the accuracy of detection and counting. Different from channel attention mechanism, we further utilize the spatial dependency between features to generate the spatial attention map, which can complementarily mine the spatial location information of pods ignored by the channel attention module. We calculate the spatial attention based on the feature maps enhanced with the channel attention. Similar to the channel attention, a max pooling and average pooling operation will be added to output F M a x S R 1 × H × W and F A v g S R 1 × H × W . Then, the two feature maps will be fused through a convolution operation f 7 × 7 with a 7 × 7 kernel, as:
M C B A M ( F ) = σ ( f 7 × 7 ( [ A v e p o o o l ( F ) ; M a x p o o o l ( F ) ] )
To make the most use of the semantic and spatial dependency between different channels captured by the M S ( F ) and M C ( F ) , we add the channel attention and spatial attention to each layer of the recursive feature pyramid.
Selection of feature maps. The area of the input image corresponding to any pixel on the feature map is described as the receptive field. The image information in the receptive field area directly affects the quality of the features learned by the network. The calculation method of thereceptive field in each layer is shown in Equation (6):
S R F ( t ) = ( S R F ( t 1 ) 1 ) N s ( t ) + S f ( t )
S R F ( t ) is the size of the receptive field of the convolution layer t, and N s ( t ) and S f ( t ) are the stride and kernel size of layer t, respectively. For the soybean pods distributed by leaves or branches, to suppress the interference of background, we would like to let the receptive field be equivalent to the pod size. According to Equation (6), the receptive field sizes of the C2, C3, C4 and C5 layer of ResNet50 are 35 × 35 , 91 × 91 , 267 × 267 and 427 × 427 . For the images of the single soybean plant collected in this study, the average size (length × width) of a single pod is about 100 × 53 pixels after randomly selecting and manually counting 50 images. In order to make the sheltered pod feature learning network universal for pods of different sizes, without adding additional convolution layers, we select the output of C3, C4 and C5 layer so that the original receptive field of the shallowest feature map is close to the average pod size. Similar to DCNV2 [20], our DARFP introduces the deformable convolution with a 3 × 3 kernel to conv2, conv3, conv4 and conv5 of ResNet50, so that the feature extraction can improve the noise immunity at different scales.
Feature fusion based on recursive feature pyramid. The information contained in the feature maps output by different convolution layers is different. To fully exploit the limited pod features, the classical FPN [21] fuses features of different scales along the top-down direction. However, the feedforward propagation is only conducted between the backbone and the pyramid structure, which means the gradient optimization information obtained during the pyramid constructing process cannot be fed back to the backbone to help the parameter learning. Motivated by DetectoRS [22], we add cross layer feedback links for different feature pyramids. The feature map output from the previous recursive pyramid is first followed by a convolution operation. Then, the original feature and output feature will be stacked together as the feature layer of the next recursive pyramid. The transmission and calculation between the feature layers of the recursive feature pyramid are shown in Equation (7):
f i l = F i l ( f i + 1 l , x i l ) , x i l = B i l ( x i 1 l , R i l ( f i l 1 ) )
R i l represents the feature transformation operation with a 1 × 1 convolution kernel. For any layer i = 1 , 2 , , S , B i l and F i l represent the feature maps of i layer and the i-th top-down operation of the FPN in recursions’ step l. After introducing recursions’ parameter l, the residual FPN can be expanded into a continuous network to extract and fuse features repeatedly, which can effectively improve the utilization of the priority feature information. The feedback also makes the parameter update optimize the feature extraction. In order to balance the feature quality and model training speed, the maximum number of recursions is set as 2.

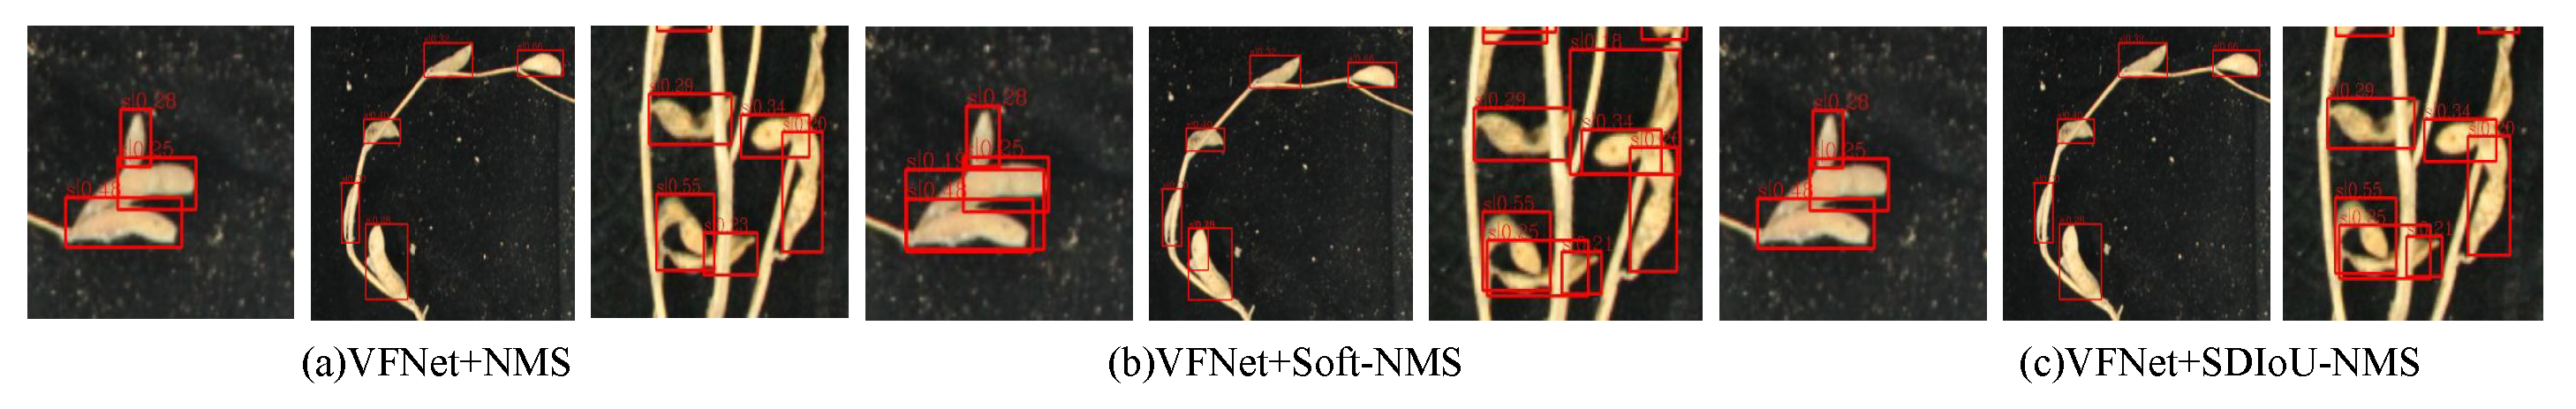
2.2.2. Bounding Box Refinement

Non-maximum suppression is a common post-processing for object detection, which aims to suppress redundant predicted boxes in the detection results. However, limited by the cluster growth habit of the pod, only part of the pods can be successfully detected among the crowded multiple pods. Intuitively, the correct predicted bounding box belonging to one pod may be regarded as the offset predicted bounding box of another adjacent pod, which will be suppressed as a redundant predicted bounding box by the NMS algorithm [23]. Increasing the NMS threshold can reduce the missed detection rate of pods theoretically, while it is challenging to manually set an appropriate threshold to handle the uneven pods with different densities at different locations. To this end, we design the adaptive SDIoU-NMS and Repulsion Loss to refine the bounding box.
Adaptive SDIoU-NMS. Adaptive SDIoU-NMS first introduces the DIoU [24] to the Soft-NMS algorithms, which can measure the similarity and overlap between the two predicted boxes better. Compared with classical Soft-NMS, the adaptive SDIoU-NMS also considers the distance R D I o U between the center points of the two boxes. The suppression function in SDIoU-NMS can be calculated as Equations (8)–(10).
S i = S i , D I o U ( M , B i ) < T S i ( 1 D I o U ( M , B i ) ) , D I o U ( M , B i ) T
D I o U ( M , B i ) = I o U ( M , B i ) R D I o U ( M , B i )
R D I o U ( M , B i ) = ( ρ 2 ( b , b g t ) ) / C 2
For the i-th object, S i is the classification scores of all predicted boxes. M and B i are the box with the highest score and other predicted boxes. b and b g t represent the center points of the predicted box and the ground truth box, and ρ is the Euclidean distance between these two center points. c is the diagonal distance of the minimum closure area that contains both the predicted box and the ground truth box. T is the threshold indicating the maximum IoU with all ground truth boxes.
For pods with an uneven number distribution, we expect a small threshold for sparse pods to remove more redundant boxes while a large threshold for dense pods to improve recall. To this end, based on SDIoU-NMS, the adaptive SDIoU-NMS further designs an independent density prediction branch to estimate the pod density, so that threshold T can be dynamically adjusted according to the pod density. The density prediction branch adopts the VGG16 as the backbone, whose network structure is shown in Figure 3. Note that, in order to consider more context information around the objects, 5 × 5 convolution kernel is used in the final convolution layer to increase the receptive field. The degree of density at the first target is defined as Equation (11):
d i : = m a x ( I o U ( b i , b j ) ) b j G , i j
b i and b j are the generated bounding box and ground truth. At the inference stage, the density prediction network outputs the object density at each position. Substituting the entire density value back into Equations (8) and (11), the adaptive SDIoU-NMS finally completes the operation of non-maximum suppression.

2.2.3. Loss Function

Bounding box refinement further introduces the Repulsion Loss [19] to optimize the regression of the bounding box. For the predicted pod bounding boxes close to each other, the Repulsion loss L R e p can constrain each predicted box to stay away from surrounding real boxes belonging to other objects while being close to its corresponding real box. Then, the overall loss of DARFP-SD is defined as Equation (12):
L = L c l s + α L G I o U + β L R e p
L c l s = q ( q l o g ( p ) + ( 1 q ) l o g ( 1 p ) ) , q > 0 p γ l o g ( 1 p ) , q = 0
L G I o U = 1 ( I o U | C ( A B ) | C )
α and β are used to adjust the proportion of the GIoU loss L G I o U and Repulsion loss L R e p . Here, we set both of them to 0.5. GIoU loss can reflect the overlap between the predicted box and the ground truth box while retaining all the properties of the IoU. C represents the smallest rectangular area, including two different boxes, A and B. The classification loss L c l s is based on VariFocal Loss, which can significantly improve the quality of candidate regions and pod recognition accuracy in crowded regions. p is the predicted IoU-aware classification score. For positive samples, q is the IoU between the predicted bounding box and the ground truth box; for negative samples, the value of q is 0.

2.3. Counting Pods Based on DARFP-SD

Based on the proposed DARFP-SD, we further train the pod counting model, whose framework is illustrated in Figure 4. In order to improve the generalization ability of the model, an adaptive training sample selection strategy is adopted, and t o p k = 9 is set to keep the balance of positive and negative samples. The parameters of the backbone is initialized using a model pre-trained on the Imagenet dataset. The model is trained for 200 epochs with a batch size of 4 and an initial learning rate of 0.00125. The learning rate is adjusted based on the cosine annealing algorithm and Warmup. The density estimation module of the adaptive SDIoU-NMS is initialized with random network parameters. The other training strategies are consistent with those used to train pod object detection networks.

3. Results

3.1. Evaluation Index

The accuracy, recall and F 1 are selected as the evaluation indicators to measure the model performance, which can be calculated as:
P t = 1 N e r r N d e c t
P c = N c o r N r e a l
F 1 = 2 × P c × P t P c + P t
N c o r and N e r r are the number of pods detected by the model correctly and wrongly, respectively. N r e a l is the actual number of pods contained in the test image, and N d e c t is the number of detected pods.

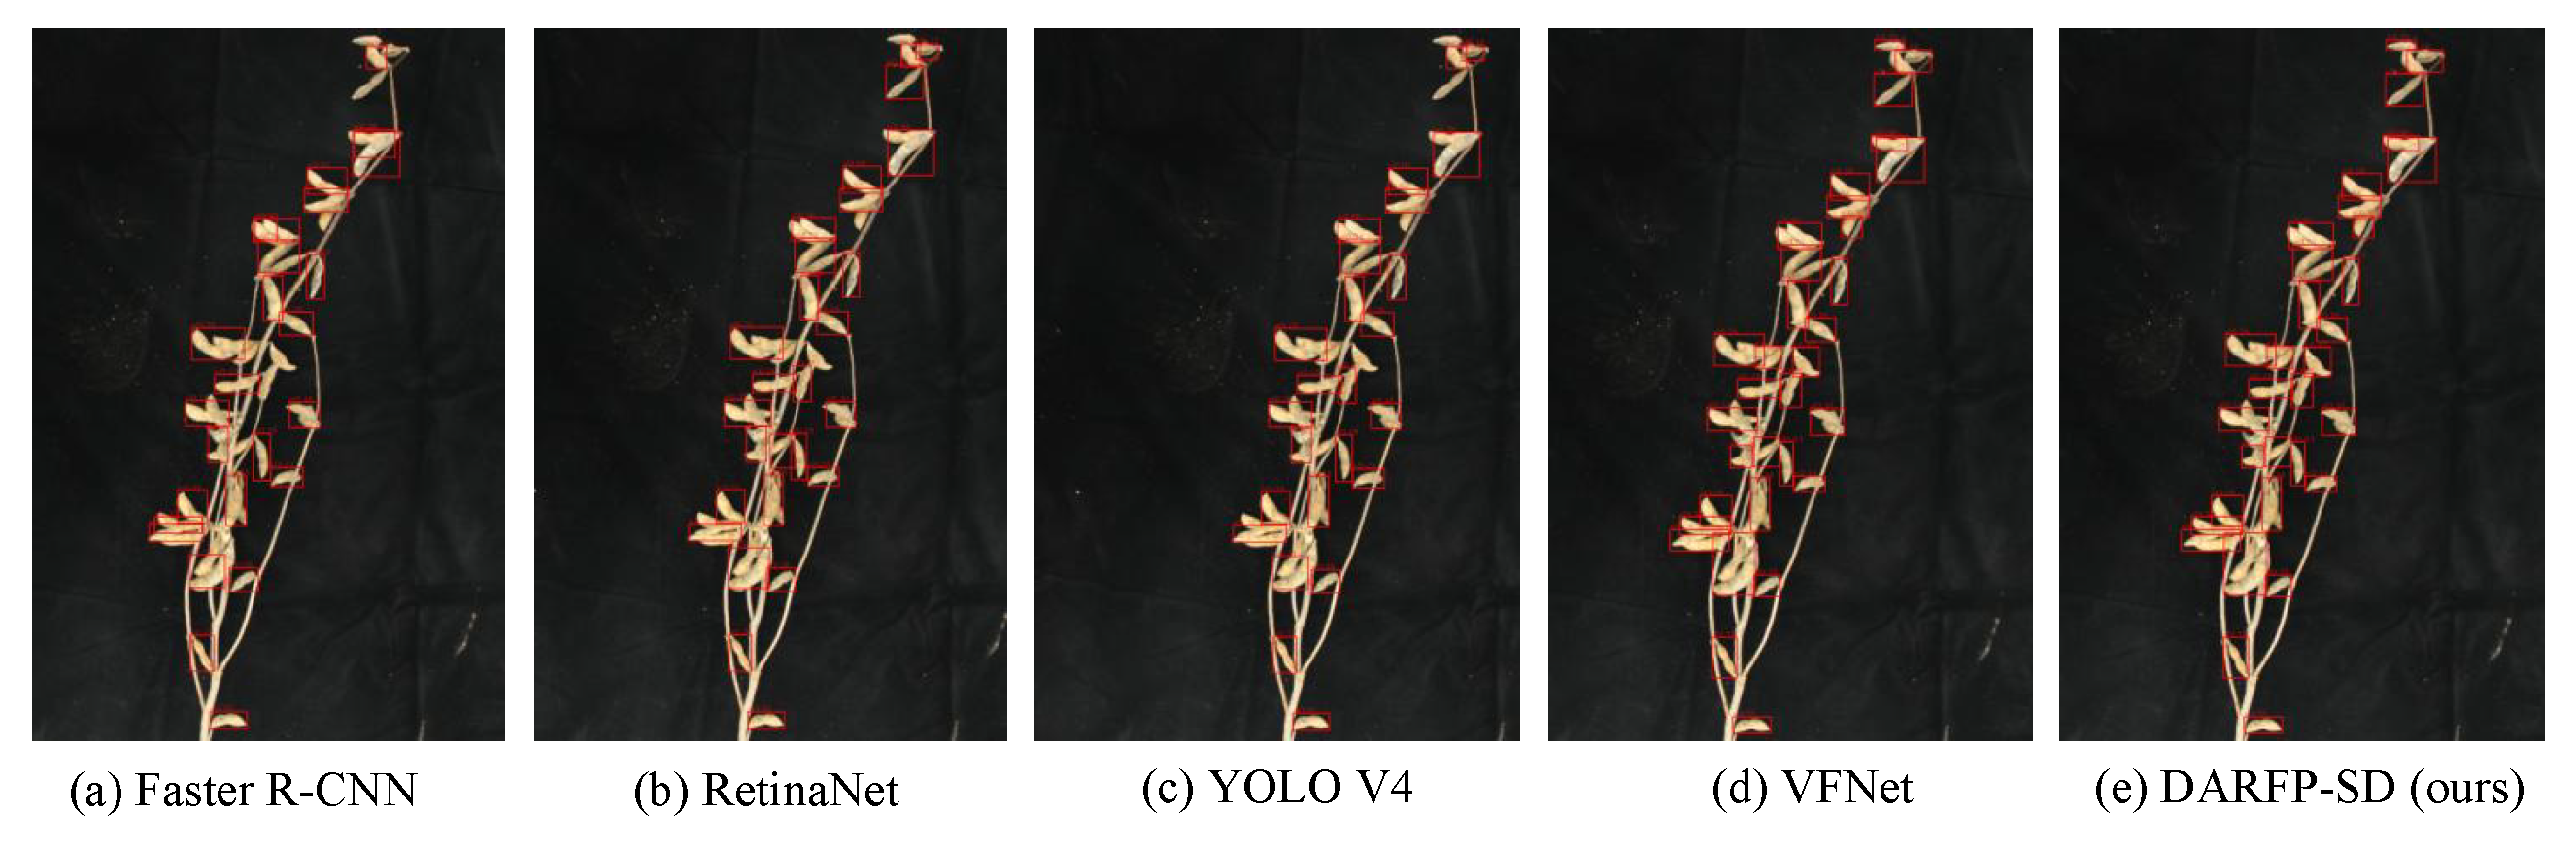
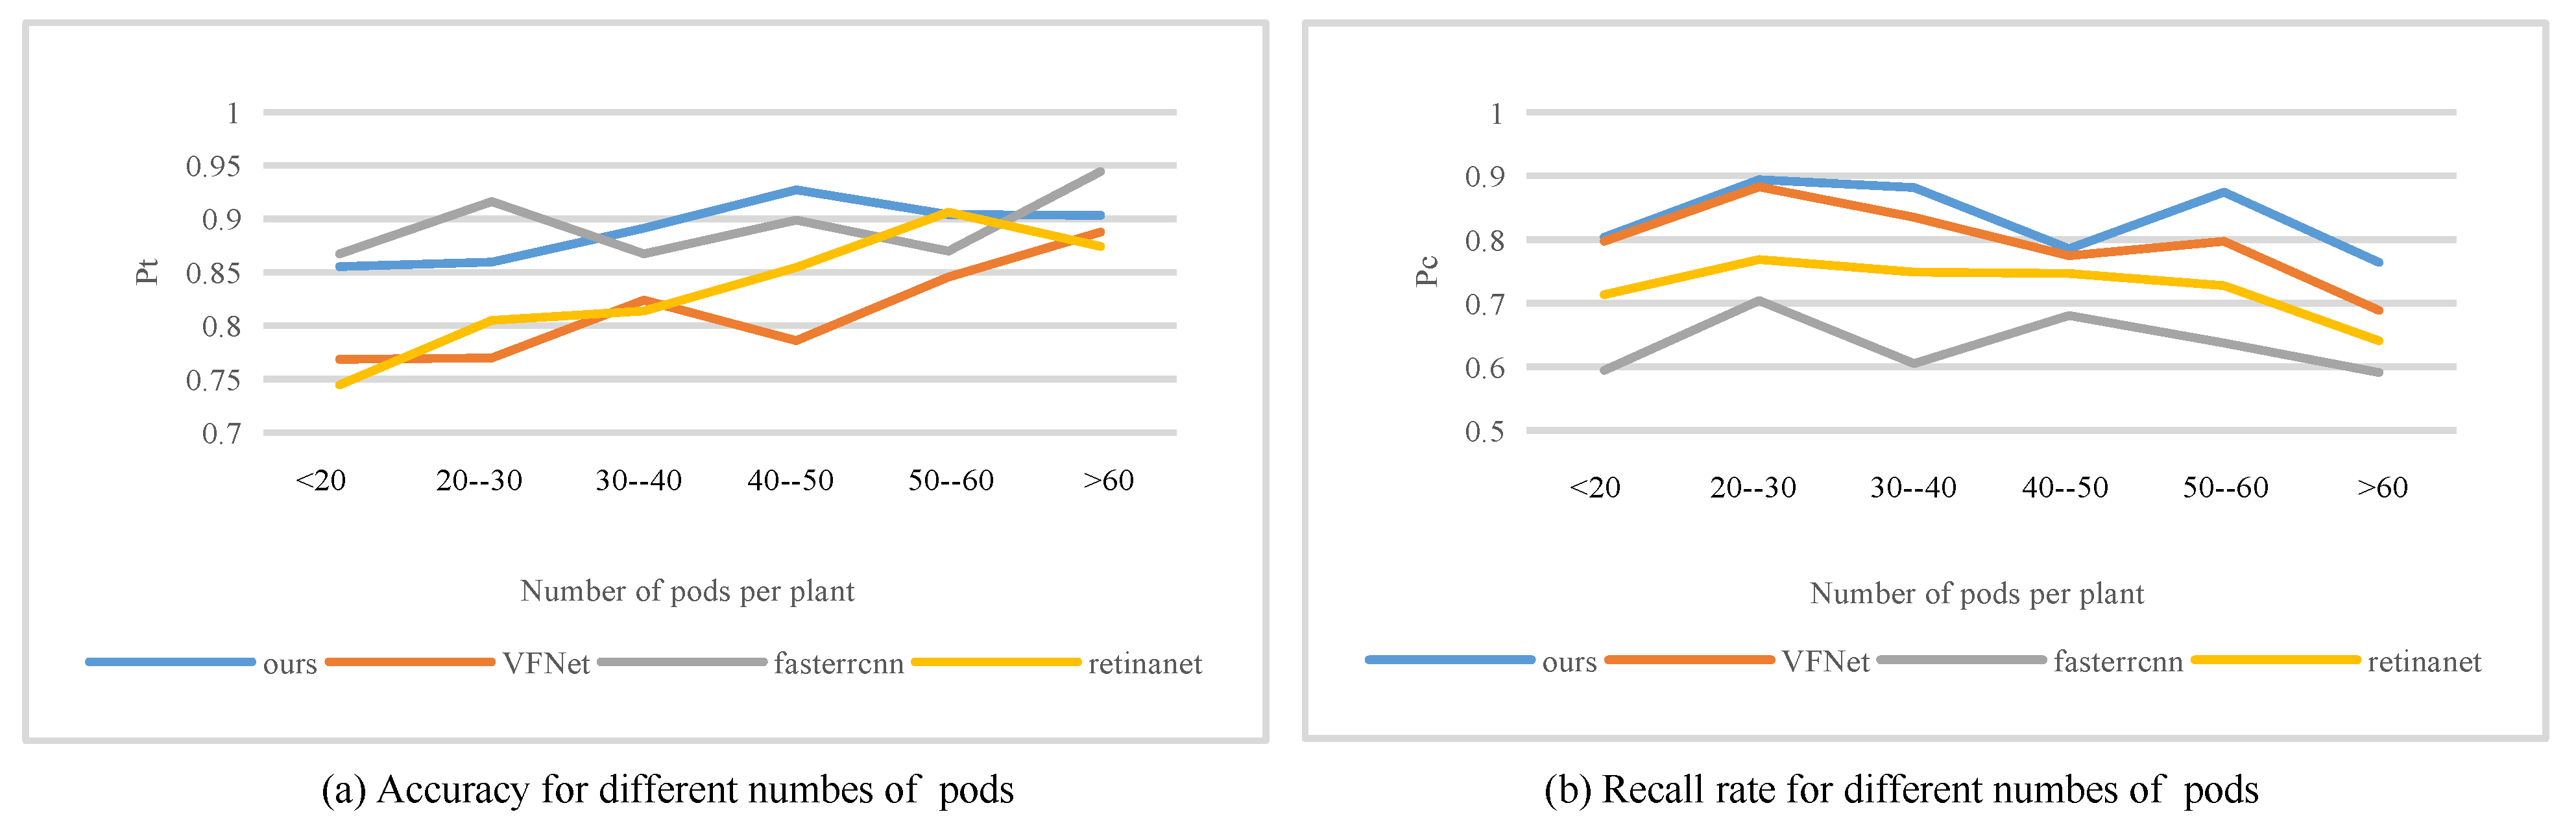
3.2. Comparison with SOTA Methods

To verify the effectiveness of the proposed DARFP-SD for soybean pod detection, we first compared the results of DARFP-SD with other representative detection algorithms, whose accuracy, recall and F1 are shown in Table 2. For pods with different postures, our DARFP-SD can achieve the best performance with an average accuracy of 90.35%, recall of 85.59% and F1 of 87.90%, which are 8.36%, 4.55% and 7.81% higher than the baseline method VFNet, respectively. The above results first validate the effectiveness of the deformable attention recurrent pyramid. By capturing multi-scale pod information, the deformable recurrent pyramid can significantly enhance the model’s ability to express pods with different poses, and further improve feature quality and classification accuracy. As shown in Figure 5d,e, for individual pods or dense pods missed by VFNet due to stalk interference, DARFP-SD can improve the quality of candidate bounding boxes after introducing the repulsion loss.
We also conduct a set of experiments to study the counting performance with various backbones in Table 2, such as VGG16, AlexNet, DarkNet53 and MobilenetV3. Compared with the well-designed ResNet, the counting results demonstrate a slight drop to varying degrees. Compared with Faster R-CNN, DARFP-SD achieves a similar detection accuracy rate, while improving the recall rate by more than 10%. As shown in Figure 5a, though Faster R-CNN performs better in areas where pods are sparsely distributed, it misses more for smaller pods or pods with occlusions, which seriously inhibits its recall rate. For RetinaNet that also incorporates feature pyramids, the average accuracy, recall and F1 of our DARFP-SD outperforms by 6.42%, 11.19% and 8.99%, respectively. With the collaboration of deformable recursive attention pyramid and box optimization, DARFP-SD can alleviate the changing of pod posture and uneven distribution of pod quantity, which meets the actual application requirements of soybean counting per plant.

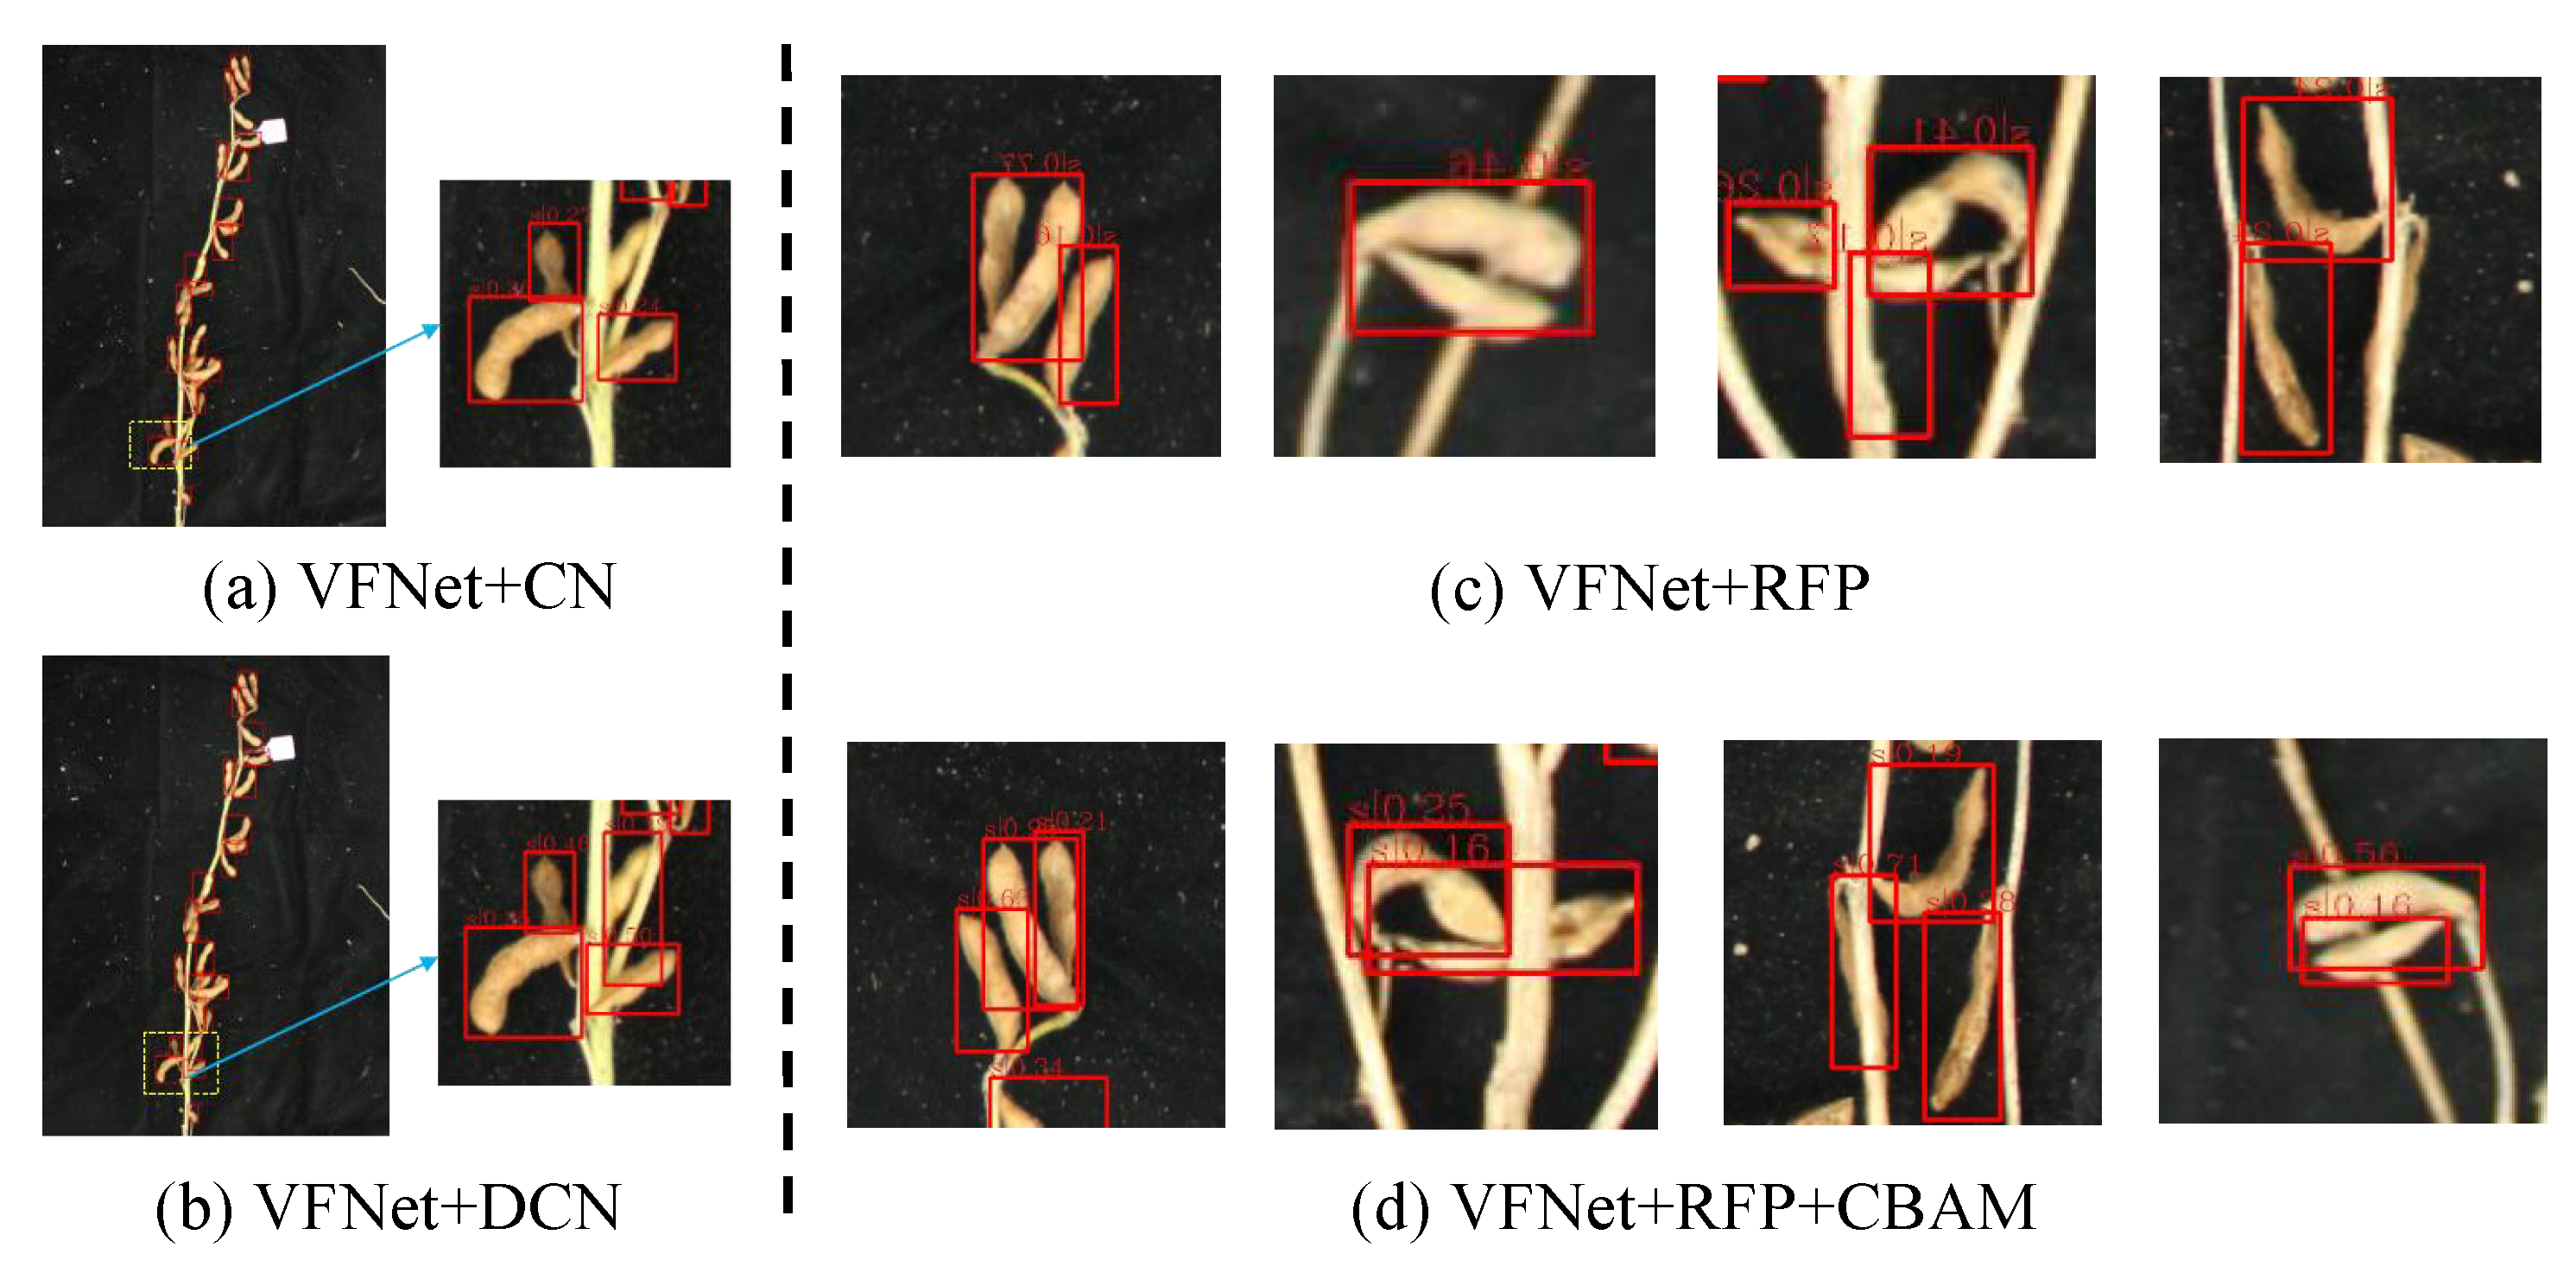
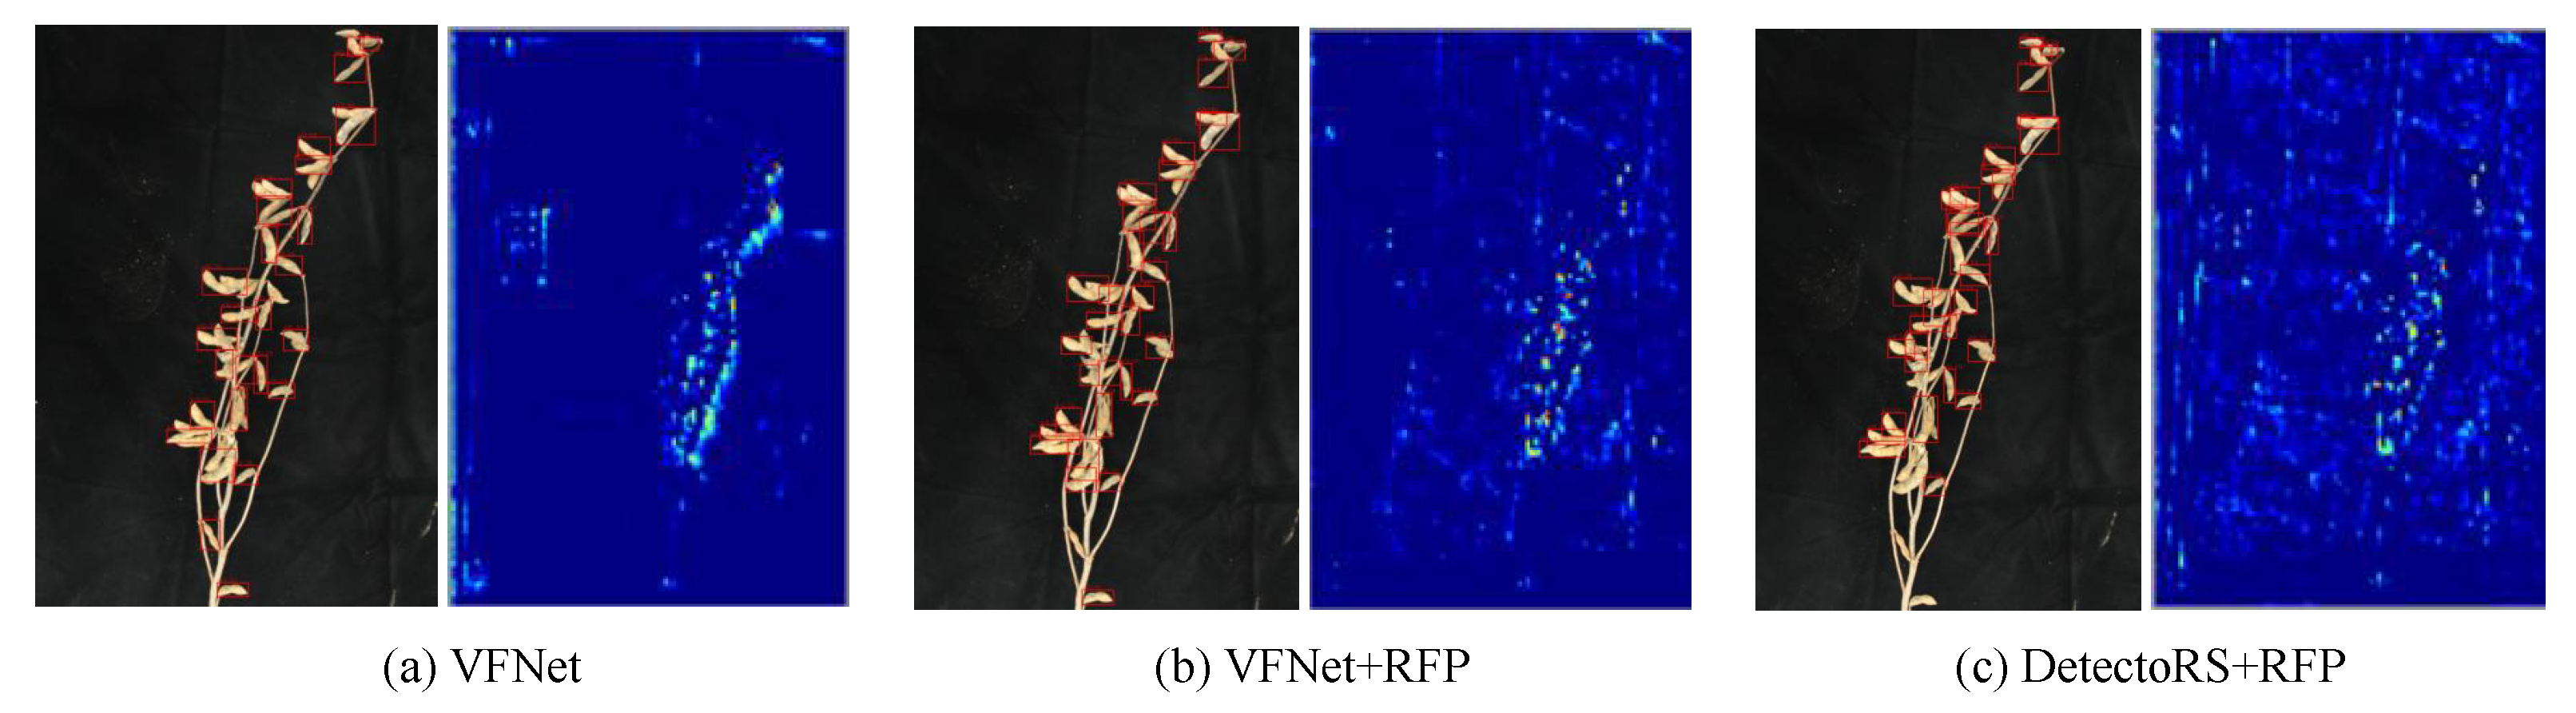
3.3. Effectiveness Analysis of ARFP

To quantify the improvement of the attention deformable recursive pyramid (ARFP) on model feature quality and counting accuracy, the feature extraction module based on deformable convolution and the feature fusion module based on the attention recursive feature pyramid were used to train the pod counting model, whose experimental results are shown in Table 3. After introducing the deformable convolution and attention recursive feature pyramid, the average accuracy, recall and F1 increased to 87.57%, 85.06% and 86.30%, which improved the detection performance far more than only using the deformable convolution or recursive pyramid. The results verify the effectiveness of the deformable attention recursive feature pyramid in this study, where the feature expression ability of individual soybean pods with indeterminate posture can be better improved with ARFP.
Effectiveness of deformable convolution for feature extraction. To verify the improvement of deformable convolution, we replace the conv2, conv3, conv4 and conv5 layer of ResNet50 with deformable convolution. Compared with the baseline method using the traditional convolution module, after introducing the deformable convolution module, the average accuracy, recall and F1 are increased by 0.80%, 2.70% and 1.94%, respectively. As shown in Figure 6a,b, the receptive field can avoid the stalk area. By adaptively capturing the various shape and scale information of pods, the deformable convolution can effectively suppress noise interference and improve the feature quality of pods with uncertain poses and the recall of positive samples.
Effectiveness of attention module for feature enhancement. After combining CBAM in the recursive feature pyramid, the average accuracy, recall and F1 can increase by 1.42%, 0.8% and 1.1%. Adding the CBAM can effectively improve the detection effect of pods blocked by stalks. As shown in Figure 6c,d, adding the CBAM can effectively improve the detection effect of pods blocked by stalks. In addition, the accuracy of crowded small-sized pods is also significantly improved. We suppose the improvement comes from the interaction relationship between multi-scale features captured by CBAM, which helps to dynamically assign the optimal weight for the feature fusion of different layers.
Effectiveness of attention recursive feature pyramid for feature fusion. To verify the effectiveness of the recursive feature pyramid, we construct a traditional feature pyramid and a recursive feature pyramid (the number of recursions is set to 2) based on the feature distribution output by the C3, C4, and C5 layers of ResNet50. It can be seen from Table 3 that the average accuracy, recall and F1 of recursive feature pyramid can improve by 4.63%, 2.34% and 3.48%. Visualization results in Figure 7 demonstrate the recursive feature pyramid benefits to the small-sized pods. We also visualizes the feature maps obtained by different backbone networks. The color indicates the weight of the feature in the region. It can be found that the feedback information acting on the backbone network can improve the utilization of feature information after adding the RFP structure. Specifically, areas of pods and stems are evenly covered without differences in Figure 7a, while more areas are activated in Figure 7c.

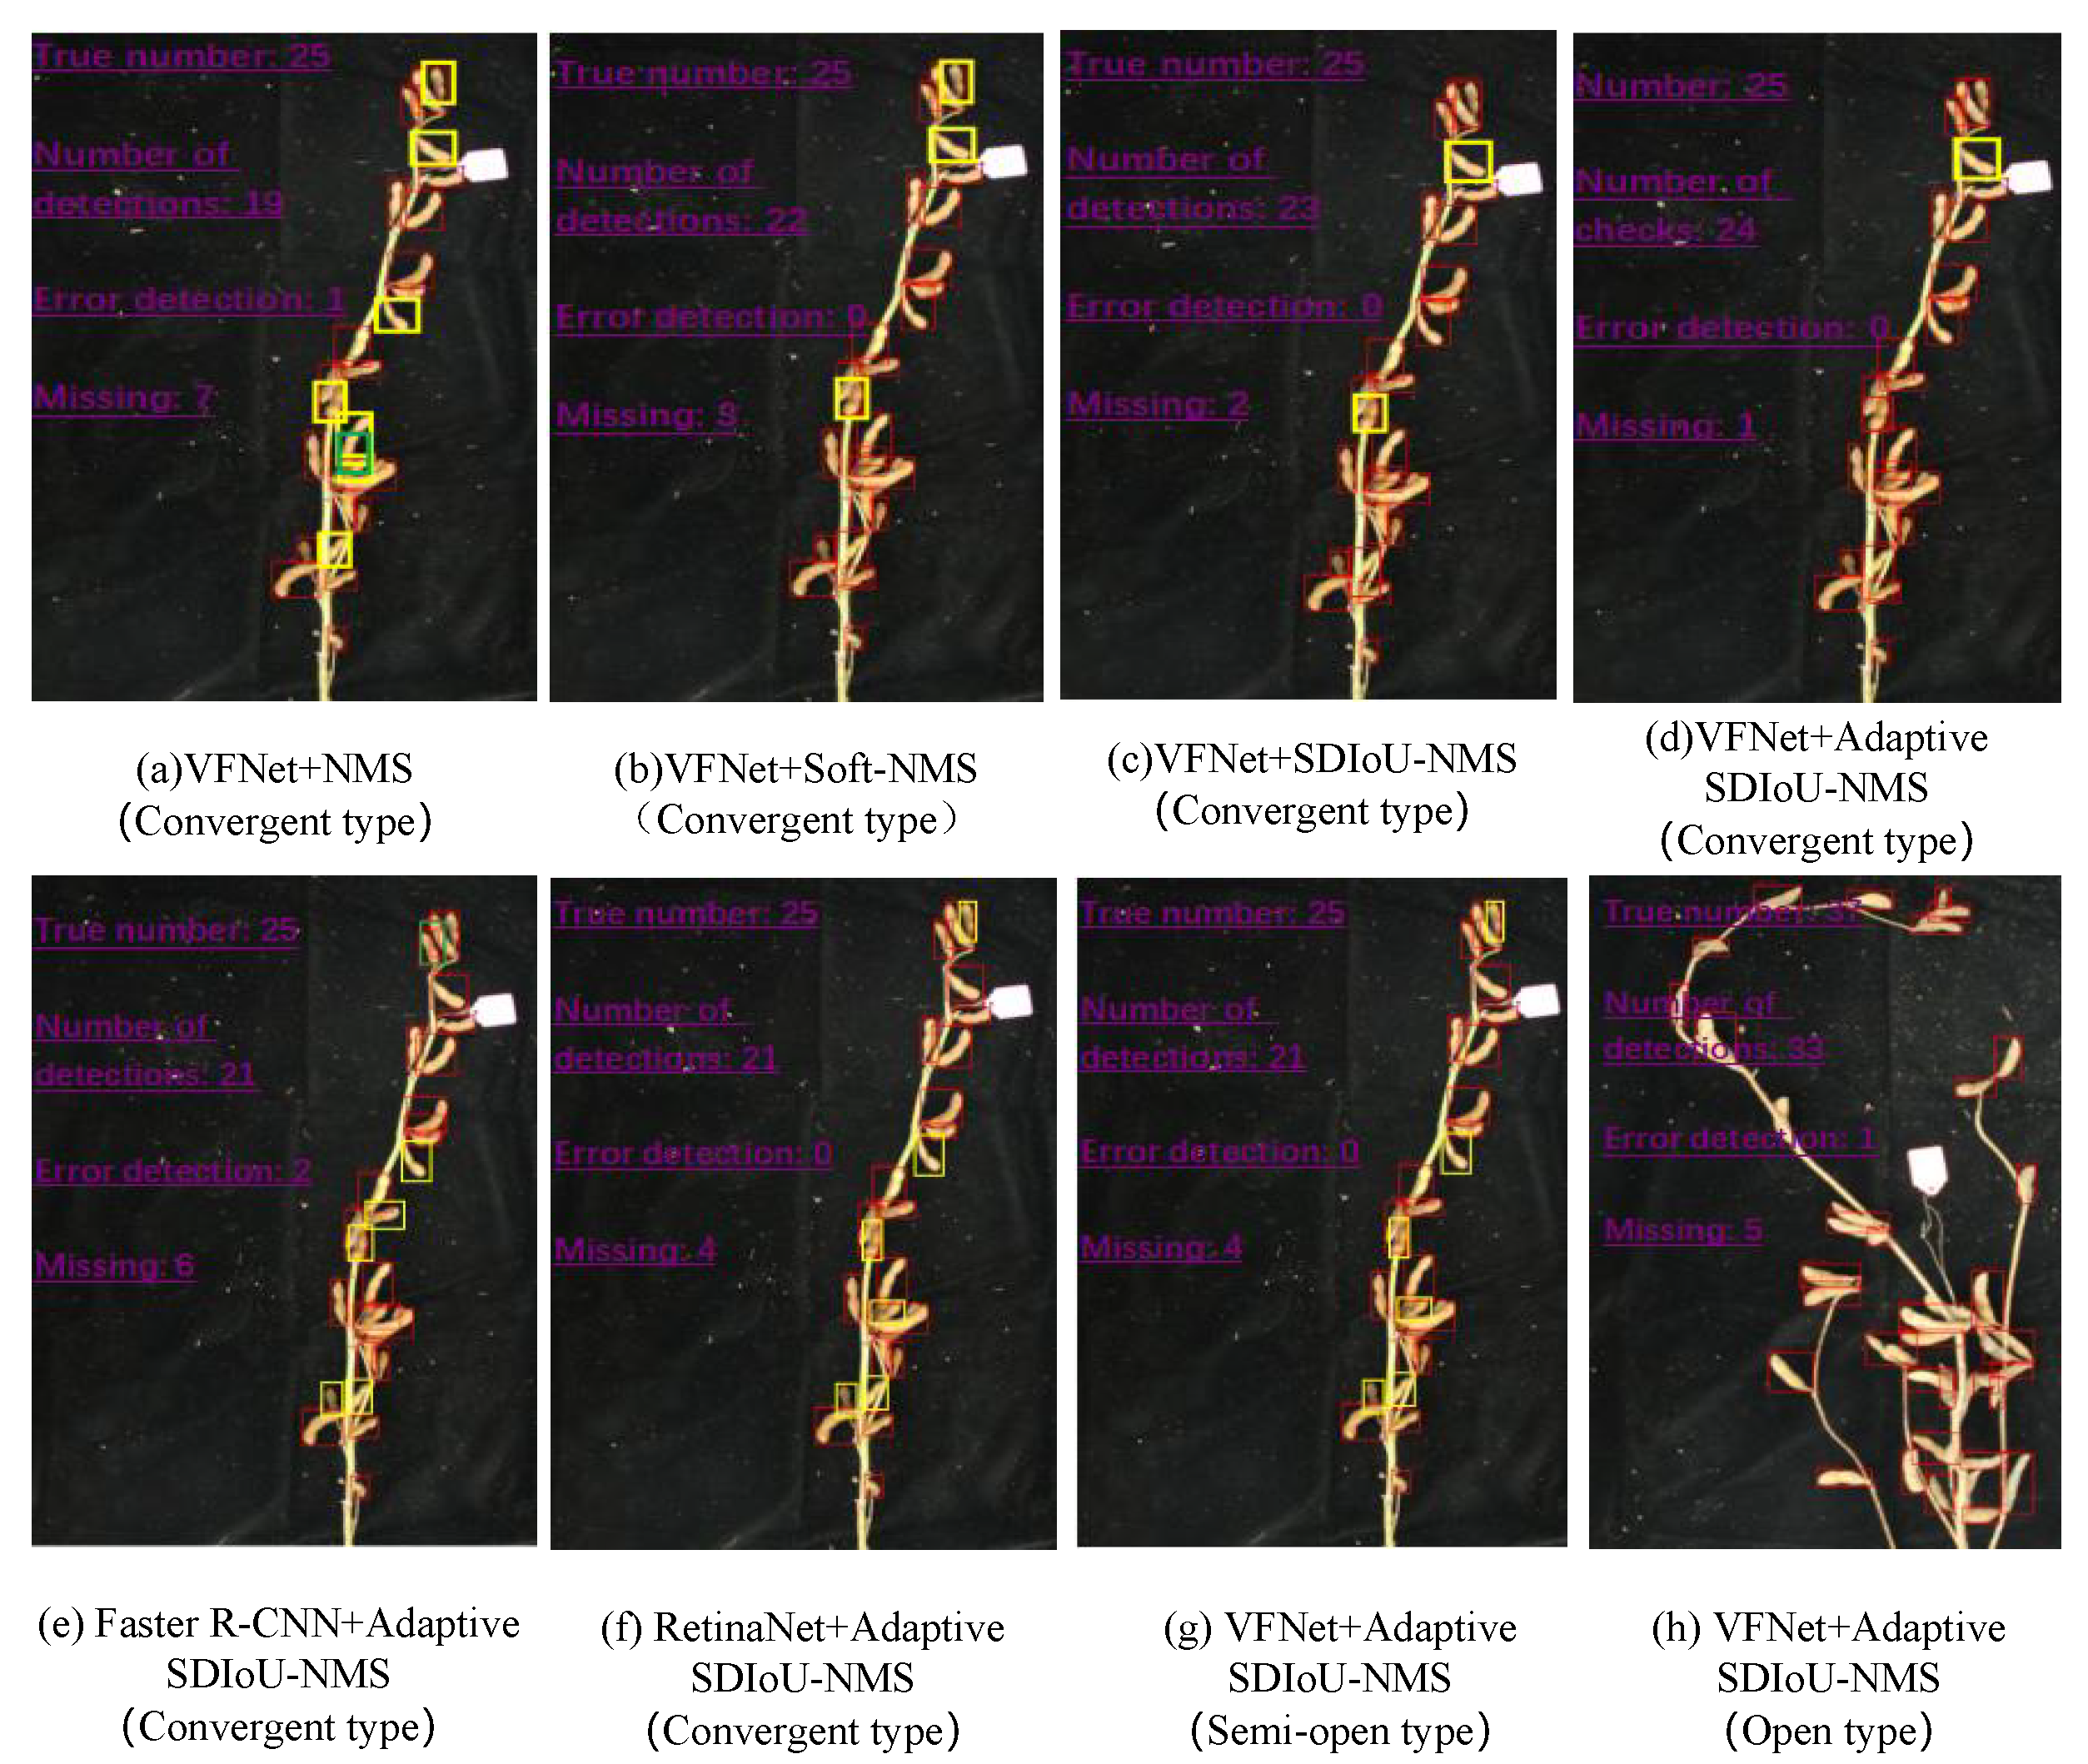
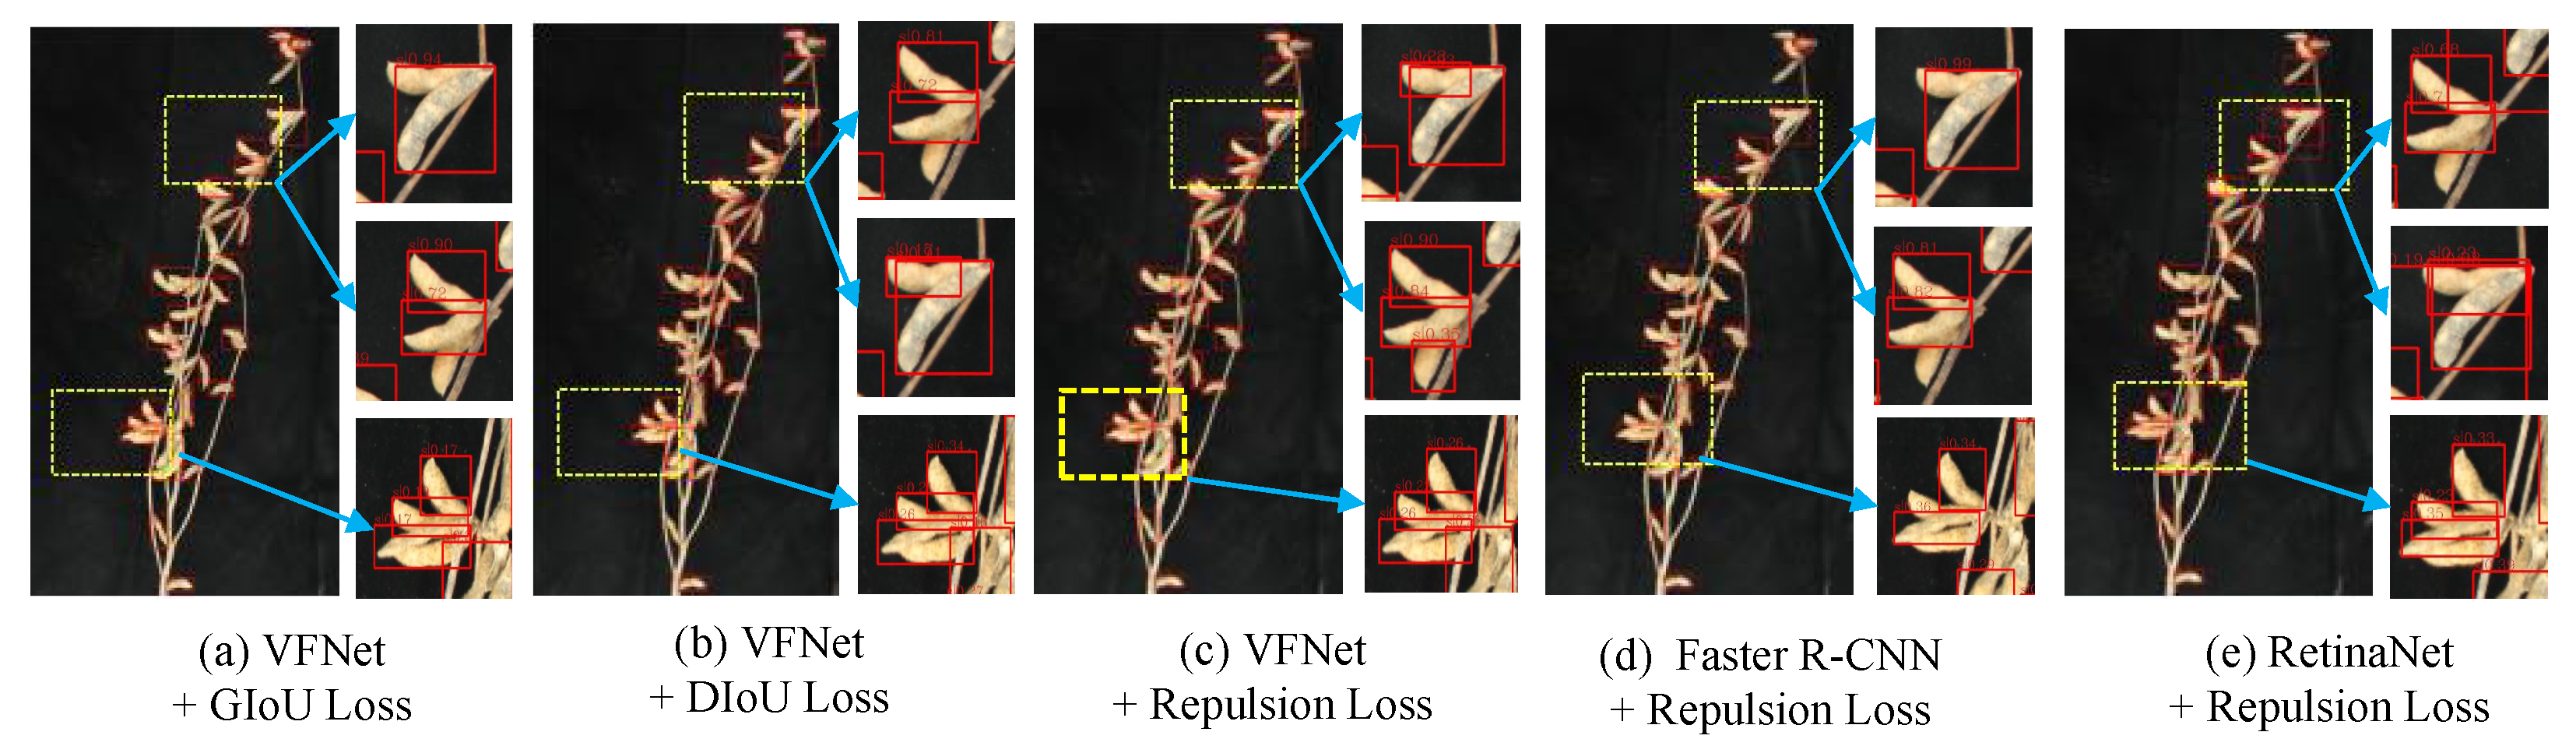
3.4. Effectiveness Analysis of BR

Effectiveness of repulsion loss. To verify the effectiveness of the bounding box refinement, we conduct a set of experiments based on repulsion loss and the adaptive SDIoU-NMS, whose results are reported in Table 4. Compared with the VFNet, the increase of accuracy is only 1.33% when introducing the DIoU loss to optimize the bounding box. After using the repulsion loss, the average accuracy for pods can significantly increase to 86.69%. A similar performance increase trend also occurs in other baselines, such as Faster R-CNN or RetinaNet. As shown in Figure 8, the repulsion loss can guide the model to effectively eliminate the interference of other similar candidate regions when the box returns, while it may exist as a performance boundary for more than four pods.
Effectiveness of adaptive SDIoU-NMS. From the results in Table 5, the average recall rate of the model increased by 0.3% and 1.57% after the introduction of Soft-NMS and SDIoU-NMS, respectively. For our adaptive SDIoU-NMS, a best F1 of 83.57% can be obtained based on VFNet. The results first verify the effectiveness of our SDIoU-NMS, that is, for pods with large differences in quantity distribution, setting the threshold according to DIoU can more finely evaluate the quality of the predicted boxes. We also visualize the detection results of different NMS strategies in Figure 9. For local scenes with clustered growth, relatively scattered and many stalks, the horizontal comparison detection results demonstrate that SDIoU-NMS can not only retrieve the detection frame that was wrongly removed by NMS, but also reasonably distinguish Soft-NMS errors. When using the adaptive SDIoU-NMS strategy for non-maximum suppression, the average accuracy rate, recall and F1 are 82.83%, 84.33% and 83.57%, respectively, which are further improved by 0.39%, 1.23% and 0.80% compared with SDIoU-NMS. It shows that adaptively learning the density to the set threshold can improve the recall. As can be observed in Figure 10, the adaptive SDIoU-NMS outputs less multi-inspection, maintaining a reasonable evaluation and screening of pods in dense areas. Thanks to the dynamic adjustment of the threshold, there is no missed detection in sparser areas due to higher thresholds such as SDIoU-NMS (yellow box). In addition, the accuracy is still stable for different plant shapes such as semi-open and open pods.

4. Discussion

For the soybean pod counting task, it is a common phenomenon to deal with varieties of soybeans. The soybeans with different plant shapes and numbers of pods result in a different complexity of detection scenarios. To analyze the robustness of our DARFP-SD, we discuss the deviations in the counting accuracy for the different number of pods and different plant shapes.
Robustness for different number of pods. We divided the test images according to the number of pods per plant with a stride of 10. We counted the detection results of the model in each number range and compared them with other algorithm models. The results are shown in Figure 11 and Figure 12. For sparse scenes with less than 30 pods per plant, our DARFP-SD is comparable to the baseline VFNet and far exceeds the results of the Faster-RCNN and RetinaNet methods. For scenarios where the number of pods per plant is 30–60, the average accuracy and recall of DARFP-SD are 90.35% and 85.59%, which are 8.36% and 4.55% higher than VFNet, respectively. For dense or overlapping scenes with more than 60 pods, the proposed DARFP-SD has an average accuracy of 90.33%, which is similar to sub-dense scenes with 50–60 pods, showing better stability. The average recall rate and F1 of DARFP-SD are significantly improved compared with other counting methods. The above results demonstrate that DARFP-SD can more effectively meet the counting task of the single soybean plant with variable pod density.
Robustness for different shapes. To better meet the high-throughput pod counting requirements of different soybean varieties, we further discuss the difference in the counting accuracy of DARFP-SD for soybeans of different plant shapes. We divided the test images into convergent, semi-open and open, and the counting performances are shown in Table 6 and Figure 13. Taking the convergent soybean plant as an example, the average accuracy, recall and F1 of DARFP-SD are 88.87%, 86.37% and 87.60%, and the three evaluation indicators are all improved by more than 5% compared with the baseline method VFNet. The improvement was also evident in the semi-open and open soybean plants. All the results demonstrate that DARFP-SD can better deal with the soybean counting scenarios of different plant shapes, indicating that DARFP-SD can be applied to the task of counting soybean pods in a single plant to solve the change of plant type.
Combination with more fine-grained pod phenomics. Although pod counting is important for both breeding and cultivation tasks, considering the combination with other fine-grained pod phenomics measurements shows a more promising future. The method proposed in this paper can accurately identify and locate dense small-sized pods, which can provide instance-level research objects for the further detailed analysis of pod length, thickness, shape, color, maturity, and disease conditions. In addition, the pod counting task can also be extended to the prediction of the number of pod seeds [25] or even the number of pod fluff, which is of great significance for the breeding of high-yield and disease-resistant soybean varieties. However, we also note the difficulty in constructing the above multi-task models, especially in terms of imaging quality and algorithm performance. For example, for dense small-sized pods, the pixel-level deviation of the predicted foreground area will lead to huge fluctuations in the length of the pod. The thickness of the pod requires additional spatial information from 3D point clouds or RGB-D images or multi-view RGB images. From the perspective of algorithm design, a conventional solution is to directly construct a regression model by combining the measured data of specific traits, which is cost-effective for the pod length and thickness that are easy to measure manually. Meanwhile, the design of the multi-phenomics algorithm can introduce the ensemble learning, contrastive learning, weakly supervised learning and multi-modal learning. In order to improve the accuracy and generalization of the model, we also try to embed agricultural expert knowledge into the learning of vision tasks. What is more, combined with some related latest research [26], mining the relationship between phenotypic trait results and gene sequences can also be considered.

5. Conclusions

Counting the soybean pods efficiently and accurately has been a challenging task, especially for the crowded small-sized pods with uneven distributions in quantity. In this paper, we propose a novel method termed as DARFP-SD to realize the pods counting of the whole soybean plant. The main contribution of this work is to design a deformable attention recursive feature pyramid network with an additional bounding box refinement module. Through experimental design and results analysis, the conclusions can be summarized as follows: (1) The proposed DARFP-SD can significantly improve the counting accuracy for the scene containing crowded small-sized pods in a single image, which can achieve an average accuracy of 90.35%, recall of 85.59% and F1 of 87.90%, respectively. (2) The attention recursive feature pyramid constructed in DARFP-SD benefits the feature quality, while the bounding box refinement module can alleviate the missing detection issue for dense pods. With the collaboration of the attention recursive feature pyramid and bounding box refinement, DARFP-SD has better stability in counting accuracy for the increasing number of soybean pods. (3) DARFP-SD shows a strong robustness in different scenarios with different pod numbers per plant, different plant shapes and different density levels, which provides a new insight in the soybean pod counting task and can be applied in high-throughput soybean breeding. We believe the proposed DARFP-SD can give some new insights in the automatic counting task of crop organs, and relieve the manual workload when measuring the pods number per plant during soybean breeding. In the follow-up work, we will build a counting model that integrates more fine-grained phenotypic traits and mine the potential genetic relationship between these traits and gene sequences.

Author Contributions

H.J., C.X. and Y.L. designed the method and wrote all the code scripts; Y.L., S.L. and Y.M. performed the experiments; C.X. and Y.L. interpreted the data and wrote the manuscript; H.J., T.Z. and Y.L. designed the experiments; C.X., Y.M., H.J. and T.Z. revised the manuscript. All authors read and approved the final manuscript.

Funding

This work was supported by the National Key R&D Program of China [No.2021YFD1201603].

Data Availability Statement

The data that support the findings of this study are available on request from the corresponding author, [Haiyan Jiang], upon reasonable request.

Conflicts of Interest

The authors declare that they have no known competing financial interest or personal relationship that could have appeared to influence the work reported in this paper.

References

  1. Razfar, N.; True, J.; Bassiouny, R.; Venkatesh, V.; Kashef, R. Weed detection in soybean crops using custom lightweight deep learning models. J. Agric. Food Res. 2022, 8, 100308. [Google Scholar] [CrossRef]
  2. Zhao, J.; Yan, J.; Xue, T.; Wang, S.; Qiu, X.; Yao, X.; Tian, Y.; Zhu, Y.; Cao, W.; Zhang, X. A deep learning method for oriented and small wheat spike detection (OSWSDet) in UAV images. Comput. Electron. Agric. 2022, 198, 107087. [Google Scholar] [CrossRef]
  3. Shafi, U.; Mumtaz, R.; Shafaq, Z.; Zaidi, S.M.H.; Kaifi, M.O.; Mahmood, Z.; Zaidi, S.A.R. Wheat rust disease detection techniques: A technical perspective. J. Plant Dis. Prot. 2022, 129, 489–504. [Google Scholar] [CrossRef]
  4. Liu, C.; Wang, K.; Lu, H.; Cao, Z. Dynamic color transform networks for wheat head detection. Plant Phenomics 2022, 2022, 9818452. [Google Scholar] [CrossRef] [PubMed]
  5. Xu, C.; Jiang, H.; Yuen, P.; Ahmad, K.Z.; Chen, Y. MHW-PD: A robust Rice Panicles Counting Algorithm based on Deep Learning and Multi-scale Hybrid Window. Comput. Electron. Agric. 2020, 173, 105375. [Google Scholar] [CrossRef]
  6. Tseng, H.H.; Yang, M.D.; Saminathan, R.; Hsu, Y.C.; Yang, C.Y.; Wu, D.H. Rice seedling detection in UAV images using transfer learning and machine learning. Remote Sens. 2022, 14, 2837. [Google Scholar] [CrossRef]
  7. Huang, M.L.; Wu, Y.S. GCS-YOLOV4-Tiny: A lightweight group convolution network for multi-stage fruit detection. Math. Biosci. Eng. 2023, 20, 241–268. [Google Scholar] [CrossRef] [PubMed]
  8. Tang, Y.; Zhou, H.; Wang, H.; Zhang, Y. Fruit detection and positioning technology for a Camellia oleifera C. Abel orchard based on improved YOLOv4-tiny model and binocular stereo vision. Expert Syst. Appl. 2023, 211, 118573. [Google Scholar] [CrossRef]
  9. Gao, F.; Fang, W.; Sun, X.; Wu, Z.; Zhao, G.; Li, G.; Li, R.; Fu, L.; Zhang, Q. A novel apple fruit detection and counting methodology based on deep learning and trunk tracking in modern orchard. Comput. Electron. Agric. 2022, 197, 107000. [Google Scholar] [CrossRef]
  10. Lyu, S.; Li, R.; Zhao, Y.; Li, Z.; Fan, R.; Liu, S. Green citrus detection and counting in orchards based on YOLOv5-CS and AI edge system. Sensors 2022, 22, 576. [Google Scholar] [CrossRef] [PubMed]
  11. Mamat, N.; Othman, M.F.; Abdulghafor, R.; Alwan, A.A.; Gulzar, Y. Enhancing Image Annotation Technique of Fruit Classification Using a Deep Learning Approach. Sustainability 2023, 15, 901. [Google Scholar] [CrossRef]
  12. Gulzar, Y. Fruit Image Classification Model Based on MobileNetV2 with Deep Transfer Learning Technique. Sustainability 2023, 15, 1906. [Google Scholar] [CrossRef]
  13. Sun, J.; Yang, K.; Chen, C.; Shen, J.; Yang, Y.; Wu, X.; Norton, T. Wheat head counting in the wild by an augmented feature pyramid networks-based convolutional neural network. Comput. Electron. Agric. 2022, 193, 106705. [Google Scholar] [CrossRef]
  14. Uzal, L.C.; Grinblat, G.L.; Namías, R.; Larese, M.G.; Bianchi, J.S.; Morandi, E.N.; Granitto, P.M. Seed-per-pod estimation for plant breeding using deep learning. Comput. Electron. Agric. 2018, 150, 196–204. [Google Scholar] [CrossRef]
  15. Guo, R.; Yu, C.; He, H.; Zhao, Y.; Yu, H.; Feng, X. Detection method of soybean pod number per plant using improved YOLOv4 algorithm. Trans. Chin. Soc. Agric. Eng. 2021, 37, 179–187. [Google Scholar]
  16. Li, S.; Yan, Z.; Guo, Y.; Su, X.; Cao, Y.; Jiang, B.; Yang, F.; Zhang, Z.; Xin, D.; Chen, Q.; et al. SPM-IS: An auto-algorithm to acquire a mature soybean phenotype based on instance segmentation. Crop J. 2022, 10, 1412–1423. [Google Scholar] [CrossRef]
  17. Zhang, H.; Wang, Y.; Dayoub, F.; Sunderhauf, N. Varifocalnet: An iou-aware dense object detector. In Proceedings of the IEEE/CVF Conference on Computer Vision and Pattern Recognition, Nashville, TN, USA, 20–25 June 2021; pp. 8514–8523. [Google Scholar]
  18. Dai, J.; Qi, H.; Xiong, Y.; Li, Y.; Zhang, G.; Hu, H.; Wei, Y. Deformable convolutional networks. In Proceedings of the IEEE International Conference on Computer Vision, Honolulu, HI, USA, 21–26 July 2017; pp. 764–773. [Google Scholar]
  19. Wang, X.; Xiao, T.; Jiang, Y.; Shao, S.; Sun, J.; Shen, C. Repulsion loss: Detecting pedestrians in a crowd. In Proceedings of the IEEE Conference on Computer Vision and Pattern Recognition, Salt Lake City, UT, USA, 18–23 June 2018; pp. 7774–7783. [Google Scholar]
  20. Zhu, X.; Cheng, D.; Zhang, Z.; Lin, S.; Dai, J. An empirical study of spatial attention mechanisms in deep networks. In Proceedings of the IEEE/CVF International Conference on Computer Vision, Seoul, Republic of Korea, 27 October–2 November 2019; pp. 6688–6697. [Google Scholar]
  21. Lin, T.Y.; Goyal, P.; Girshick, R.; He, K.; Dollár, P. Focal loss for dense object detection. In Proceedings of the IEEE International Conference on Computer Vision, Venice, Italy, 22–29 October 2017; pp. 2980–2988. [Google Scholar]
  22. Qiao, S.; Chen, L.C.; Yuille, A. Detectors: Detecting objects with recursive feature pyramid and switchable atrous convolution. In Proceedings of the IEEE/CVF Conference on Computer Vision and Pattern Recognition, Nashville, TN, USA, 20–25 June 2021; pp. 10213–10224. [Google Scholar]
  23. Neubeck, A.; Van Gool, L. Efficient non-maximum suppression. In Proceedings of the 18th International Conference on Pattern Recognition (ICPR’06), Guayaquil, Ecuador, 4–7 July 2006; Volume 3, pp. 850–855. [Google Scholar]
  24. Zheng, Z.; Wang, P.; Liu, W.; Li, J.; Ye, R.; Ren, D. Distance-IoU loss: Faster and better learning for bounding box regression. In Proceedings of the AAAI Conference on Artificial Intelligence, New York, NY, USA, 7–12 February 2020; Volume 34, pp. 12993–13000. [Google Scholar]
  25. Gulzar, Y.; Hamid, Y.; Soomro, A.B.; Alwan, A.A.; Journaux, L. A convolution neural network-based seed classification system. Symmetry 2020, 12, 2018. [Google Scholar] [CrossRef]
  26. Aggarwal, S.; Gupta, S.; Gupta, D.; Gulzar, Y.; Juneja, S.; Alwan, A.A.; Nauman, A. An Artificial Intelligence-Based Stacked Ensemble Approach for Prediction of Protein Subcellular Localization in Confocal Microscopy Images. Sustainability 2023, 15, 1695. [Google Scholar] [CrossRef]
Figure 1. Shooting scene and collected images.
Agronomy 13 01507 g001
Figure 2. Feature extraction based on deformable convolution.
Agronomy 13 01507 g002
Figure 3. Network structure of density prediction branch.
Agronomy 13 01507 g003
Figure 4. Pipeline of pod counting based on DARFP-SD.
Agronomy 13 01507 g004
Figure 5. Detection effects of soybean pod based on different models.
Agronomy 13 01507 g005
Figure 6. Visualization of detection improvement with DCN and CBAM.
Agronomy 13 01507 g006
Figure 7. Detection effects and feature visualization of different models.
Agronomy 13 01507 g007
Figure 8. Detection effects of pods with various losses.
Agronomy 13 01507 g008
Figure 9. Pod detection effect of NMS algorithm in different scenarios.
Agronomy 13 01507 g009
Figure 10. Comparison of detection effects in different areas of a single image.
Agronomy 13 01507 g010
Figure 11. Performance comparison between DRFPBR-SD and other detection algorithms under different pod numbers per plant.
Agronomy 13 01507 g011
Figure 12. Detection effect of DARFP-SD for pods with different numbers.
Agronomy 13 01507 g012
Figure 13. Detection effect of DARFP-SD for pods with different shapes.
Agronomy 13 01507 g013
Table 1. Detail of the soybean detection data set.
TypeTraining SetVal SetTest SetTotal
Convergent type48161680
Semi-open type124420
Open type782626130
Total1384646230
Table 2. Comparison of soybean detection performance with different models.
MethodTPFP P t % P c % F 1 %
Faster R-CNN113614188.9564.3474.67
RetinaNet130125982.7074.1078.17
YOLO V4132725383.5075.6979.40
YOLO V5140873366.7084.7674.13
VFNet142234581.0481.5381.28
DARFP-SD + VGG16133530080.5282.2381.36
DARFP-SD + AlexNet125031479.0576.6377.15
DARFP-SD + DarkNet5359511783.2339.0751.05
DARFP-SD + MobilenetV384121479.0351.7960.26
DARFP-SD + ResNet(ours)150217990.3585.5987.90
Table 3. Detection results with various feature extraction and fusion module, where ‘√’ and ‘×’ means with/without the corresponding module. ‘/’ means the missing of results.
VFNetDCNRFPCBAM P t % P c % F 1 % Δ P t % Δ P c % Δ F 1 %
×××81.0481.5381.28///
××81.8484.2383.02+0.80+2.7+1.74
××85.6783.8784.76+4.63+2.34+3.48
×87.0984.6785.86+6.05+3.14+4.58
87.5785.0686.30+6.53+3.53+5.02
×××79.4678.2878.87−1.58−3.25−2.41
Table 4. Performance comparison of different loss.
MethodsBackboneLoss FunctionPost Processing P t % P c % F 1 %
VFNetResNet50 + FPNGIoU LossNMS81.0481.5381.28
VFNetResNet50 + FPNDIoU LossNMS82.3781.6281.99
VFNetResNet50 + FPNRepulsion LossNMS86.6981.5984.06
Faster R-CNNResNet50 + FPNGIoU LossNMS88.9564.3474.67
Faster R-CNNResNet50 + FPNRepulsion LossNMS89.8264.7875.28
RetinaNetResNet50 + FPNGIoU LossNMS82.7074.1078.17
RetinaNetResNet50 + FPNRepulsion LossNMS84.5775.7879.94
Table 5. Pod test results under different post-processing methods.
MethodsBackboneLoss FunctionPost Processing P t % P c % F 1 %
VFNetResNet50 + FPNGIoU LossNMS81.0481.5381.28
VFNetResNet50 + FPNGIoU LossSoft-NMS80.9181.8381.37
VFNetResNet50 + FPNGIoU LossSDIoU-NMS82.4483.1082.77
VFNetResNet50 + FPNGIoU LossAdaptive SDIoU-NMS82.8384.3383.57
Faster R-CNNResNet50 + FPNGIoU LossNMS88.9564.3474.67
Faster R-CNNResNet50 + FPNGIoU LossSDIoU-NMS89.0664.5174.82
Faster R-CNNResNet50 + FPNGIoU LossAdaptive SDIoU-NMS89.5164.9875.30
RetinaNetResNet50 + FPNGIoU LossNMS82.7074.1078.17
RetinaNetResNet50 + FPNGIoU LossSDIoU-NMS83.8675.3279.36
RetinaNetResNet50 + FPNGIoU LossAdaptive SDIoU-NMS84.0476.2479.95
Table 6. Performance comparison for pods with different shapes.
MethodsConvergentOpenSemi-Open
P t % P c % F 1 % P t % P c % F 1 % P t % P c % F 1 %
Faster R-CNN88.4965.3075.1588.5565.6875.4289.3063.5474.25
RetinaNet83.0274.8478.7286.3476.6281.1981.9673.2677.37
VFNet83.3981.5782.4788.9875.3481.6078.3882.4280.35
DARFP-SD (Ours)88.8786.3787.6090.5383.9387.1089.0784.8186.89
Disclaimer/Publisher’s Note: The statements, opinions and data contained in all publications are solely those of the individual author(s) and contributor(s) and not of MDPI and/or the editor(s). MDPI and/or the editor(s) disclaim responsibility for any injury to people or property resulting from any ideas, methods, instructions or products referred to in the content.

