Article

Droplet Deposition of Leaf Fertilizers Applied by an Unmanned Aerial Vehicle in Coffea Canephora Plants

by
Déborah Hoffmam Crause
1,
Edney Leandro da Vitória
1,2,*,
Luis Felipe Oliveira Ribeiro
2,
Francisco de Assis Ferreira
2,
Yubin Lan
3 and
Pengchao Chen
3
1
Postgraduate Program in Tropical Agriculture (PPGAT), Federal University of Espirito Santo (UFES), São Mateus 29932-510, ES, Brazil
2
Department of Agricultural and Biological Sciences (DCAB), Federal University of Espirito Santo (UFES), São Mateus 29932-510, ES, Brazil
3
National Center for International Collaboration Research on Precision Agricultural Aviation Pesticides Spraying Technology, College of Electronic Engineering and Artificial Intelligence, South China Agricultural University, Guangzhou 510642, China
*
Author to whom correspondence should be addressed.
Agronomy 2023, 13(6), 1506; https://doi.org/10.3390/agronomy13061506
Submission received: 14 April 2023 / Revised: 8 May 2023 / Accepted: 23 May 2023 / Published: 30 May 2023
(This article belongs to the Section Agricultural Biosystem and Biological Engineering)

Abstract

:
The yield of coffee plants depends on several factors, and the leaf nutrition is one of the most important. The form of application of leaf fertilizers used is expensive considering the application efficacy and the efficacy of adherence and absorption of nutrients. The objective of this work was to evaluate the effect of configurations of operational parameters of centrifugal nozzle rotation and operational height on the application efficacy and efficacy of absorption of leaf fertilizers in Conilon coffee plants. The coverage, density, and deposition of spray droplets were efficacy parameters evaluated through water-sensitive paper tags and artificial targets. The efficacy of the macronutrients applied was confirmed through leaf analyses at 15 and 30 days after application. The application efficacy with a height of flight of 2.0 m and rotation of 10,000 rpm was the most adequate, with coverage of 12.4% and density of droplets of 127 droplets cm−2. The application of foliar fertilizers by UAV provided a distribution in newer leaves in which the absorption of macronutrients was greater, and the flight height of 2.0 m and rotation of the centrifugal nozzle of 10,000 rpm resulted in the best efficacy parameters.

1. Introduction

Coffee is one of the most traded commodities worldwide and one of the most consumed beverages in the world due to increases in consumption in emerging countries and interest in special coffees. The estimated world coffee production for the 2022–2023 crop season is 172.7 million bags (60 kg), approximately 80.1 million bags of Coffea canephora (Conilon + Robusta) and 92.6 million bags of Coffea arabica, with the highest increases in the European Union, United States, Japan, and Brazil [1].
Coffee crops demand several adequate managements for ensuring economically viable yield levels, mainly mineral nutrition, which is one of the most expensive practices for this crop, since the plant cannot complete its cycle adequately without the use soil amendments and fertilizers. Thus, adequate availability and quantities of mineral macro- and micronutrients are required for supplying the demands of coffee plants and maintaining the nutritional balance [2,3,4].
The methods that are commonly used for the application of agrochemicals and leaf fertilizers in coffee crops consist of growing applications with manual and electric backpack sprayers; and hydraulic, hydropneumatic, and pneumatic tractor sprayers. However, when these devices are used without the adequacy regarding the target to be reached, correct regulation and calibration can cause uneven application, slide of droplets, and spray drift and evaporation, resulting in negative impacts on the environment and health human; in addition, excess solution can affect slide, compromising leaf macronutrient absorption [5]. Unmanned aerial vehicles (UAVs) are versatile due to their easy maneuverability and ultralow application rate, as well as the fact that they do not require specific area nor airstrips [6]; have a low flight rate without load; and are adequate for applications in mountainous terrains, mud fields, and ground crops with high area leaf index. In addition, applications with UAV considerably decrease risks associated with agrochemical solutions and restrictions associated with several field conditions and reduce the work intensity and time [7,8].
Operational conditions for the UAVs used for the application of agrochemicals and their effects on the efficacy of the spraying and application were the focus of recent studies. These studies determined the effects of application rates, flow of spray tips, speed, operational height of flight, and planning flight pathways [9,10,11]. However, these studies were specific, considering the application of agrochemicals, and investigations on the use of UAVs for the application of leaf fertilizers are scarce and limited to studies on application efficacy [12], disregarding the efficacy of the adherence and absorption of the nutrients applied. Leaf fertilizers have characteristics connected to the solution mixture in the UAV application tank that affect the spraying efficacy and, consequently, the efficacy of retention of absorption of fertilizers, for example, the density, viscosity, and surface tension of the solution. In this sense, hydraulic spray nozzles and the application rate can compromise the application quality; the alternative for mixtures with pronounced physical characteristics is the application through centrifugal nozzles [13,14,15,16].
Thus, operational conditions for spraying using UAVs vary as a function of agricultural crops. Some experimental studies using UAVs as aerial sprayers were carried out for maize [17], apple [18], vine [19], and citrus [20] crops. All of them found significant effects of operational parameters during the applications. However, studies are focused on evaluating the application efficacy when used with tracer dyes and/or the efficacy of the control of pests and diseases using insecticides and fungicides, respectively, and studies on the application of leaf fertilizers are still scarce.
Whereas the studies on foliar fertilizer application by unmanned aerial vehicle are scarce or limited in regard to the aspects of droplet deposition efficiency and lack results that correlate the application efficiency with the efficacy of adherence and uptake of macroelements, the objective of the present work was to evaluate the effect of configurations of operational parameters of centrifugal nozzle rotation and operational height on the coverage, density, and deposition of droplets of the sprayed solution and evaluate the efficacy of retention and absorption of macronutrients applied by UAV in Conilon coffee plants.

2. Materials and Methods

2.1. Characterization of the Area and Experimental Crop

The experiment was carried out in a rural property in the municipality of Vila Pavão, northwest region of the state of Espírito Santo, Brazil (18°33′04″ S, 40°36′06″ W, and altitude of 180 m). The climate of the region is Aw, hot and wet, with a dry season in the autumn–winter and a rainy season in the spring–summer, according to the Köppen classification. The crop was implemented and managed in a Typic Hapludult (Argissolo; Santos et al. 2018) of loamy sandy texture. The crop was 25 months old at the time of the experiment, with a mean plant height of 1.60 m, composed of medium cycle genotypes (genotype 12V) in the useful rows and pollinator genotypes (LB1, P2, 2V, and A1) in the other rows, and a spacing of 2.5 m between rows and 0.4 m between plants in the rows.

2.2. Characterization of the Unmanned Aerial Vehicle

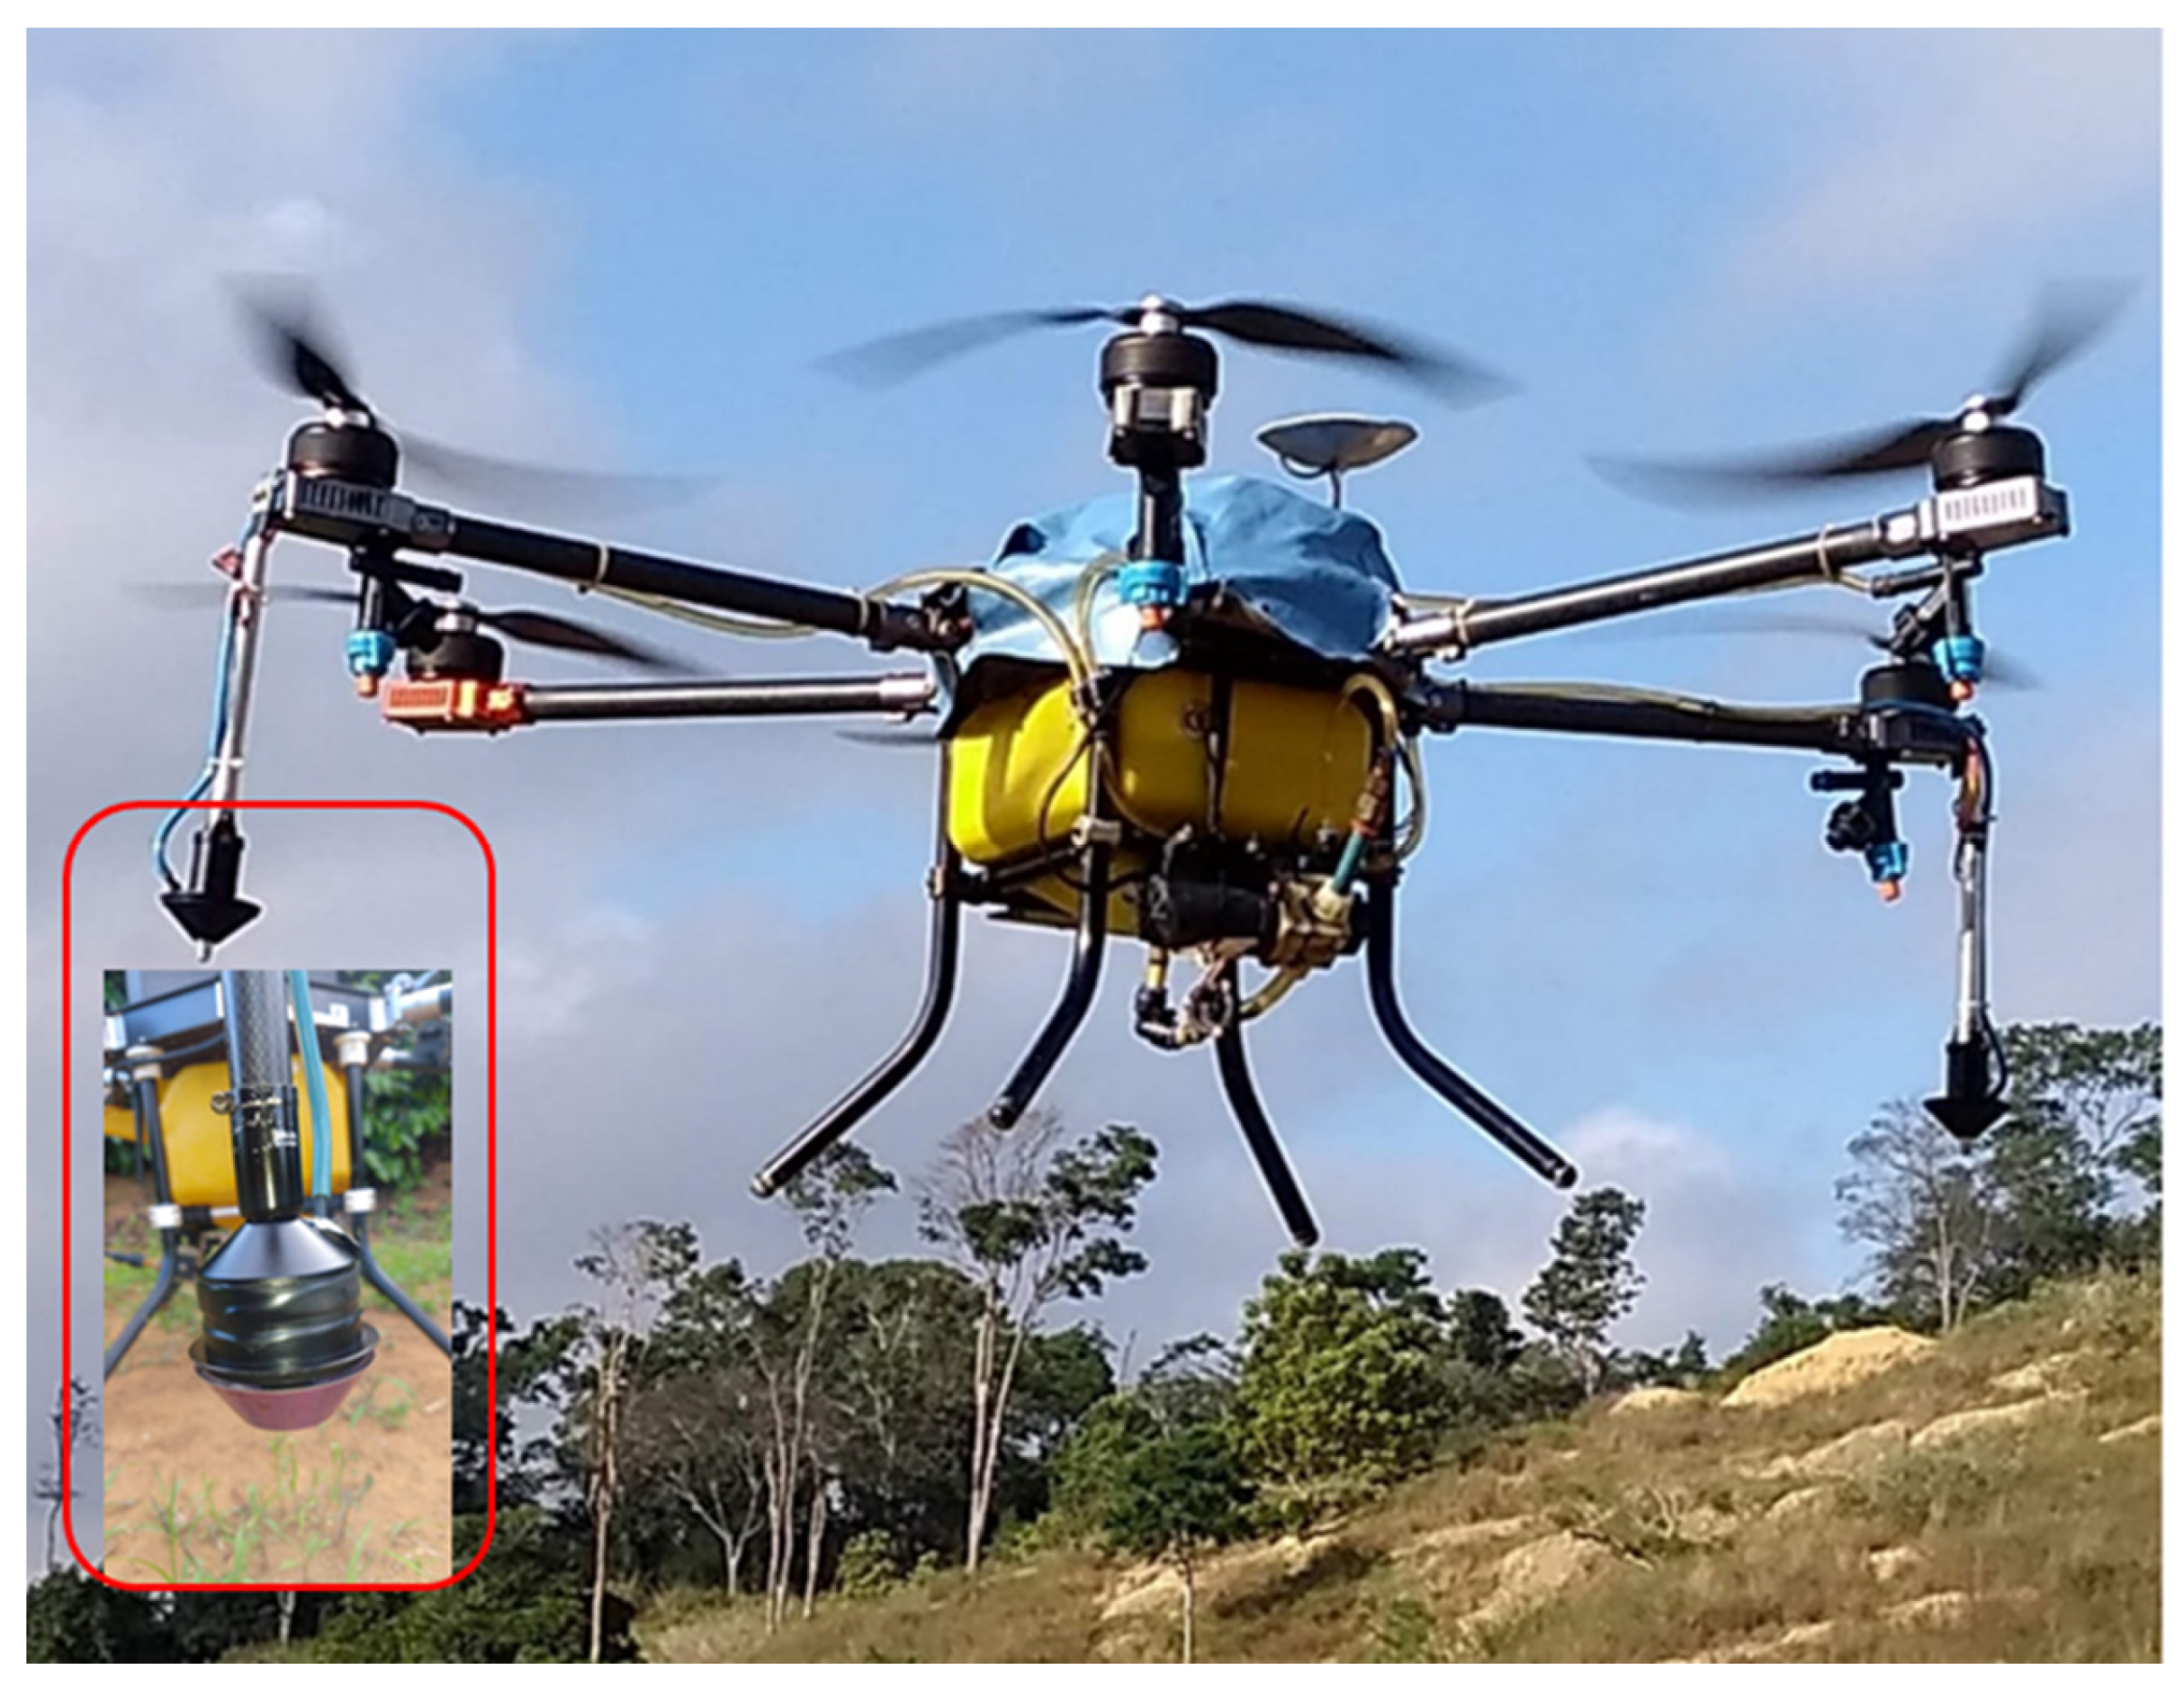
The unmanned aerial vehicle (UAV) used was a Joyance model JT-5 (Joyance Intelligence Technology Co., Ltd., Weifang, China), which has a tank capacity for 10 L and was adapted and regulated for spraying in coffee crop (Figure 1).
In addition to the storage tank, the UAV is equipped with a water pump, tubulation circuit for liquid circulation, two centrifugal nozzles responsible for applying the solution, electronic control, valves, and other components. The centrifugal nozzles (Jacto Company, São Paulo/SP, Brazil) were spaced 0.75 m from each other. An application rate of 12 L ha−1 was used for all treatments, according to practice recommendation [14]. The main specifications of the UAV are listed in Table 1. The centrifugal nozzles were adapted to the UAV; tested; regulated; calibrated; and configured for working in two different rotations, 7500 and 10,000 rpm.

2.3. Experimental Design

The experiment was divided into two evaluation phases: The first consisted of evaluating variables connected to technology of application, i.e., variables that define the efficacy and quality of spraying and application of droplets—estimated coverage, density, and deposition of spray droplets. The second step consisted of evaluating the efficacy of the spraying process and application of leaf fertilizers; in this step, the macronutrient (N, P, and K) contents were determined through leaf analyses.
The solution was applied to the UAV, which was regulated and calibrated with six different combinations between spray nozzle rotations and the operational height of the flight (Table 2). The experiment was conducted in a randomized block design with the treatments arranged in strips. The first factor was the centrifugal nozzle rotations (7500 and 10,000 rpm), and the second factor was the height of flight (2.0, 4.0, and 6.0 m); each treatment had six replications. A control treatment was added in the evaluations of macronutrient contents. All treatments had the same control regarding irrigation, climatic conditions, plant age, and soil fertility conditions to control the effects of variables not considered in the experiments.
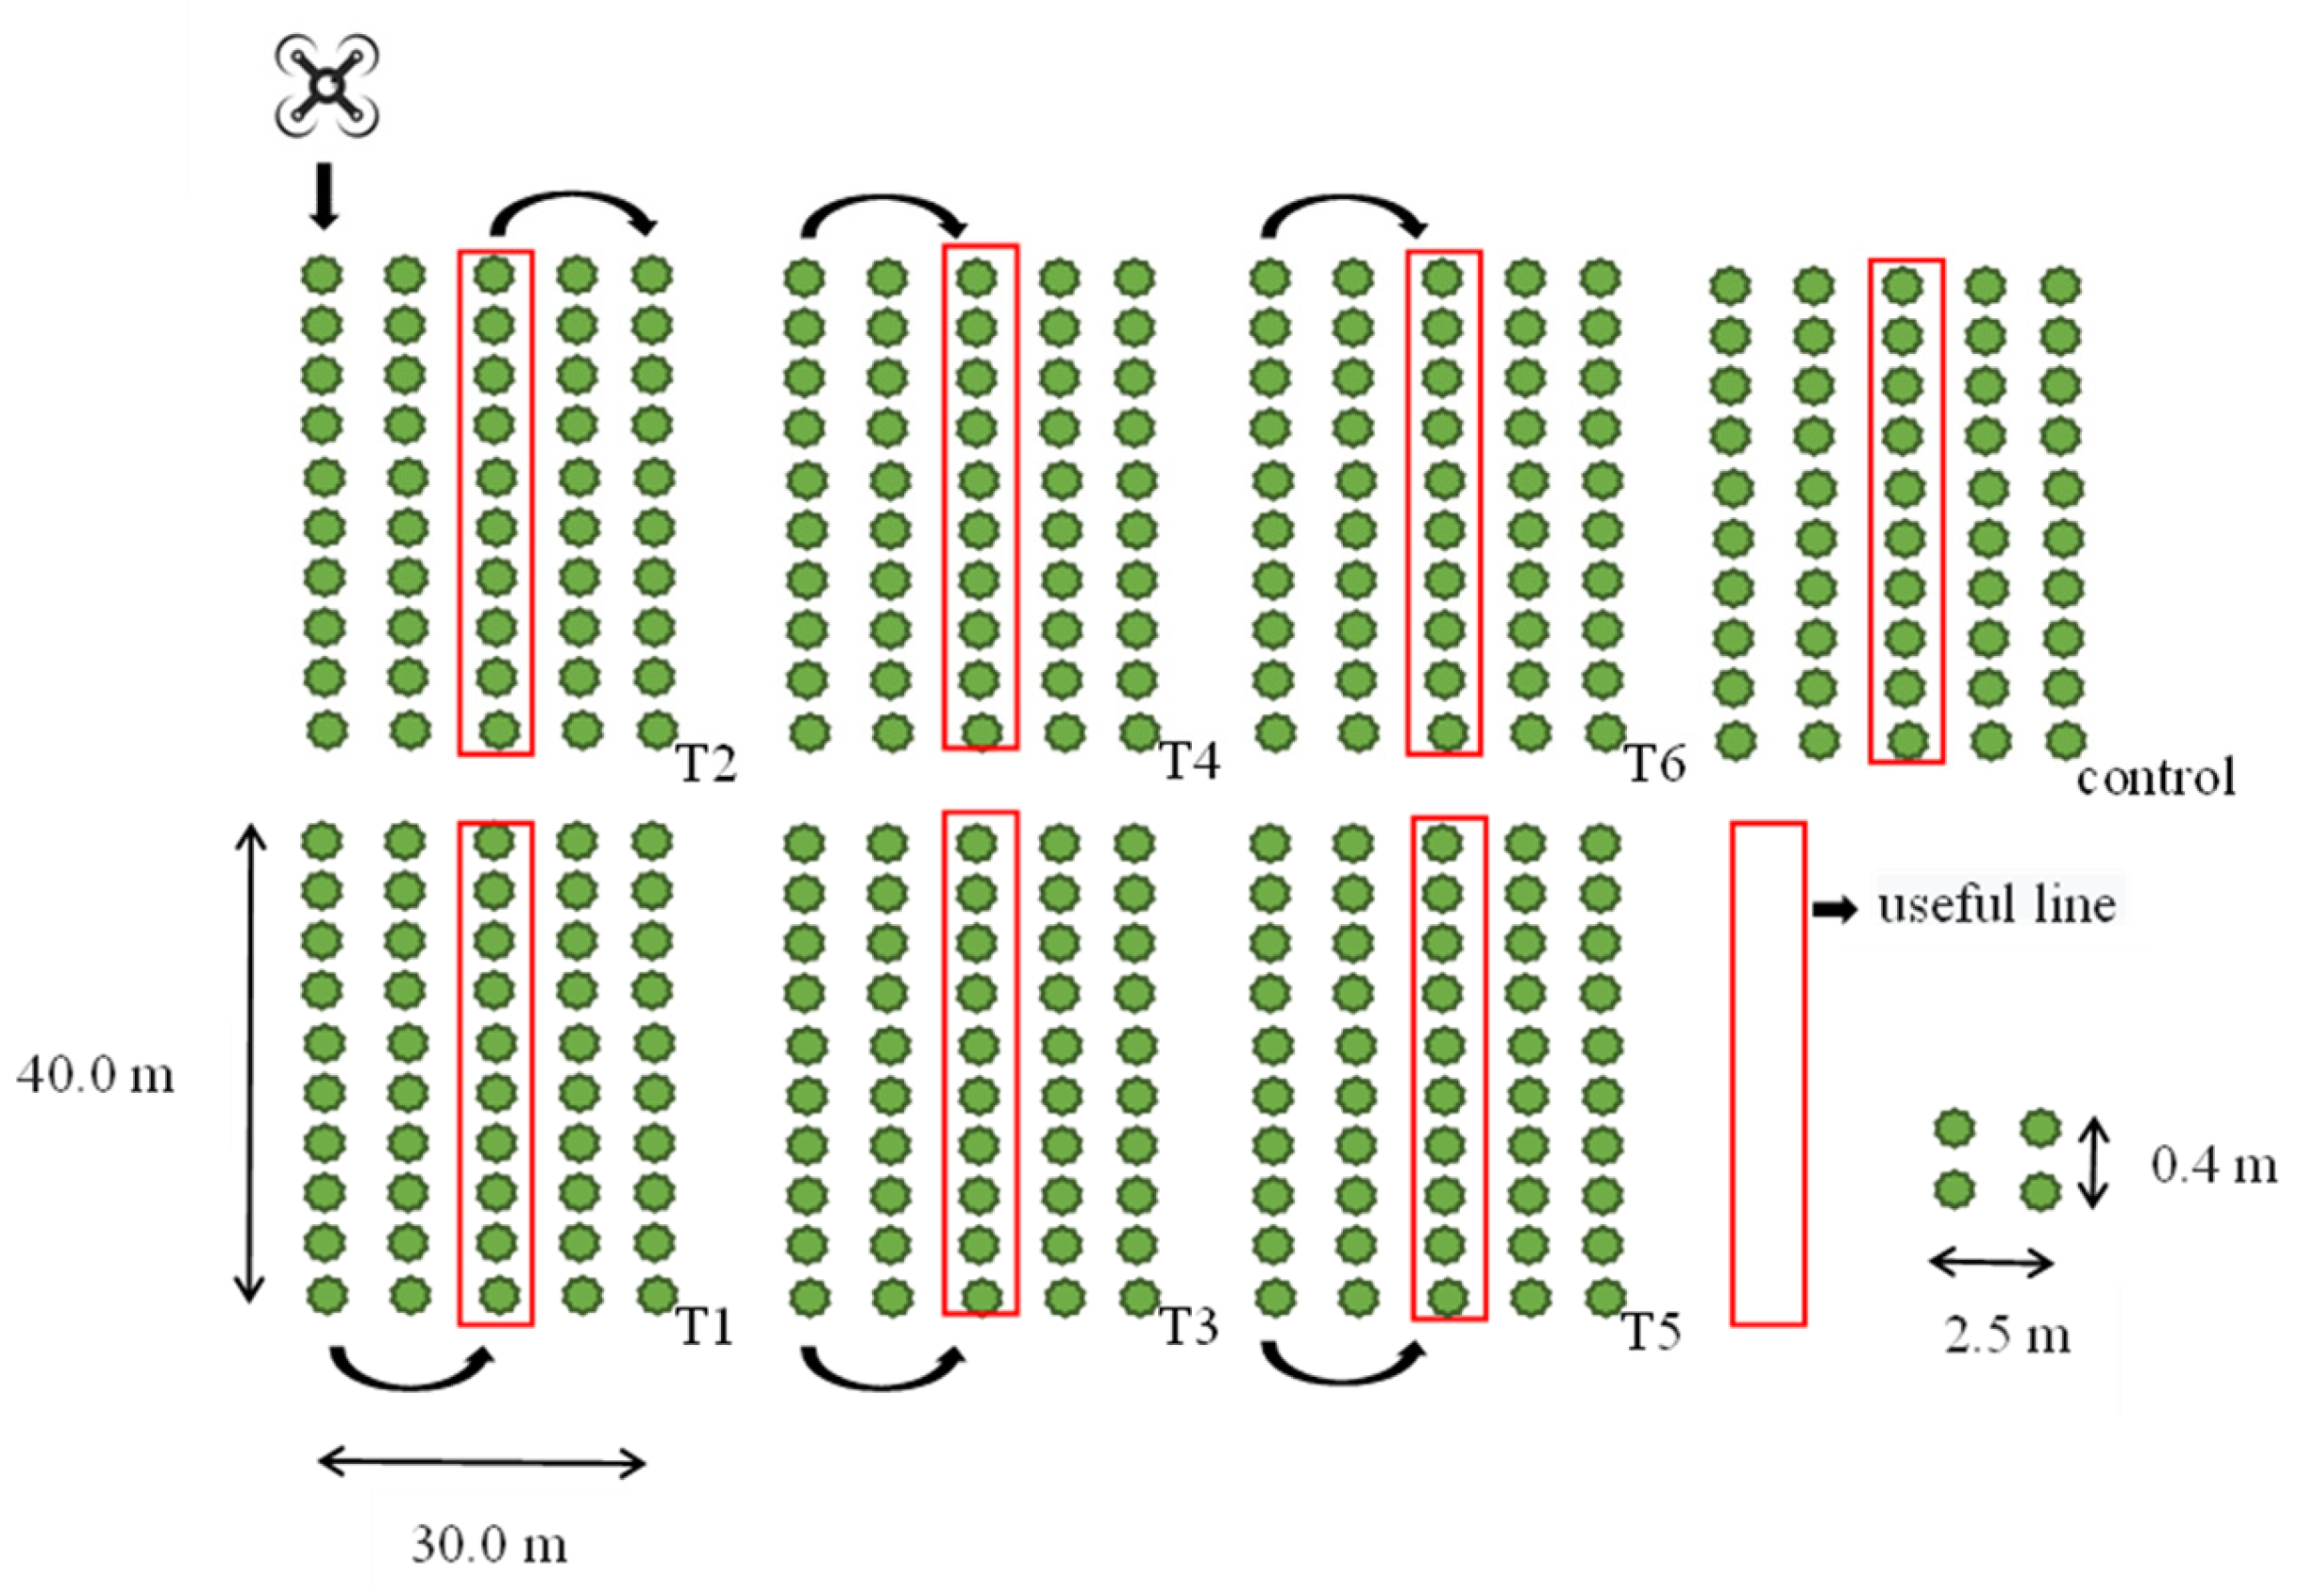
The area occupied by each treatment was 1200 m2 (30 m × 40 m), but only the central row of each treatment was used for the evaluations (useful row); the others were considered to be borders to avoid effects between the treatments (Figure 2). The useful row was considered as a function of the effective application strips, which varied as a function of the operational height of flight, to ensure the same application rate of 12 L ha−1 and flight speed of 18 km h−1. Thus, the effective strip lengths were 4.8, 5.6, and 6.2 m for the heights of flight of 2.0, 4.0, and 6.0 m, respectively. The total flow applied in each treatment was calculated according to Equation (1):
q = Q × v × f 600
where q is the total flow of centrifugal nozzles (L min−1), Q is the application rate (L ha−1), v is the operational flight speed (km h−1), and f is the effective strip length applied (m).
In addition, a 30% overlap was observed, as defined in the Agri Assistant flight plan application; the objective was to uniformize the deposition strip between the treatments.

2.4. Determination of Variables Related to Quality of Deposition of Droplets

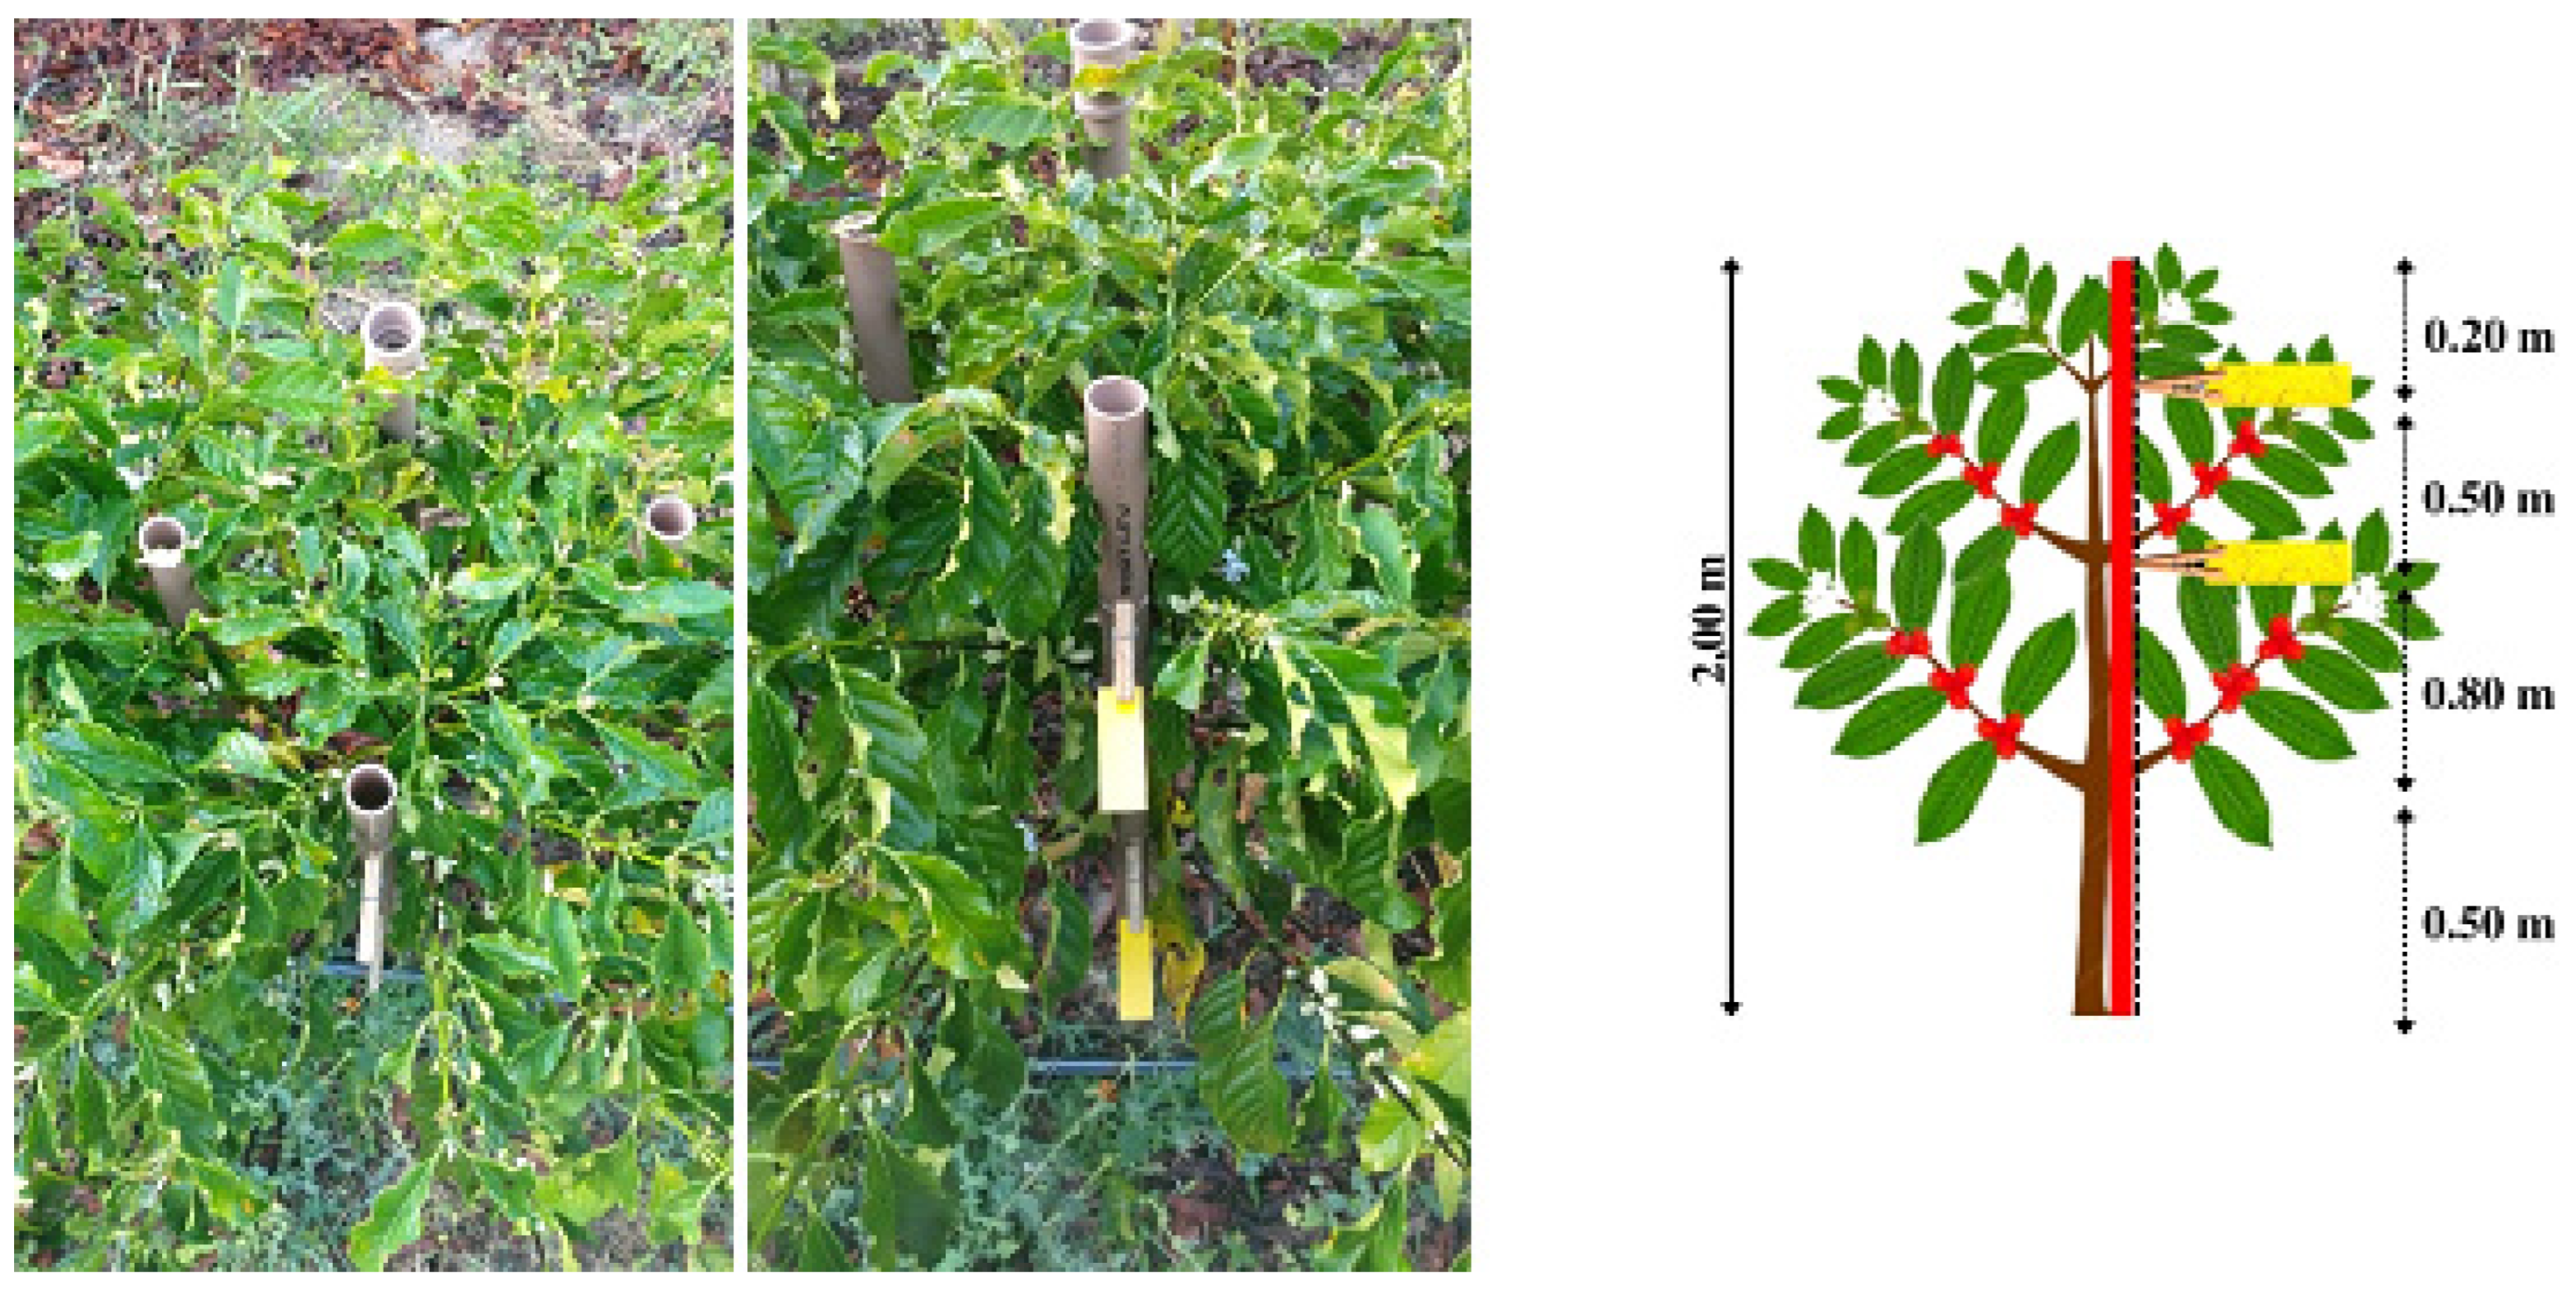
A solution with water, food dye (bright blue, rate of 800 g ha−1, Allimentari Company, São Paulo/SP, Brazil), and non-silicon adjuvant based on balanced polymers specific for aerial applications with a low volume of solution (0.3% v v−1) was applied to test the application efficacy in each one of the treatments. Water-sensitive paper tags with dimensions of 76 × 26 mm were used to characterize the coverage and density of the sprayed droplets, and artificial targets of polyvinyl chloride (PVC) with the same dimensions of the paper tags were used to estimate the deposition. The paper tags and artificial targets were placed in pins fixed in four PVC stalks at two heights equivalent to the coffee canopy heights (Figure 3), using four targets for each height.
Both the quantification and characterization of impacts in each water-sensitive paper tag were carried out immediately after applications of each treatment and drying of the tags, using the DropScope® wireless system (SprayX Company, São Carlos/SP, Brazil), which is composed of application programs, and a wireless digital microscope with digital image sensor higher than 2500 dpi. It enabled us to estimate droplets partially overlapping of approximately 35 µm and larger (Figure 4). The following parameters were evaluated: density of droplets (droplets cm−2) and coverage. Water-sensitive paper tags present limitations in detecting very thin droplets; however, this method is used because of its practicality in obtaining results of the spectrum of droplets.
The PVC artificial targets were withdrawn 30 min after application of each treatment to ensure the evaporation of the solution, keeping only the dye; they were then placed in plastic bags, identified, and stored in a closed box to avoid exposure to solar radiation and potential degradation by oxidation of the dye marker. The artificial targets were then taken to the laboratory for removal of the dye by washing, using 50 mL of distilled water per sample. This washing step was carried out with the artificial targets inside the plastic bags.
The readings of absorbance of these solutions were carried out in a spectrophotometer (Genesys 10 UV; Thermo Scientific Company, Waltham, MA, USA) set to measure absorbance at the wavelength of 630 ηm. The absorbance values were obtained through an individual reading of each sample in the spectrophotometer and transformed in concentration (mg L−1), using a standard-curve equation developed by dilutions of 1/100, 1/200, 1/500, 1/1000, 1/2000, 1/5000, and 1/10,000 of the sample solution collected in the mixture tank before of application. The mass balance generated by the deposits of tracer dye in the samples in relation to the initial concentration was used to estimate the deposition on artificial targets. Considering the readings of the spectrophotometer, the data of the calibration curves, and the area of the artificial targets, the quantity of the spray deposit per unit of area was calculated in μg cm−2 (Equation (2)).
β dep = ρ sample ρ blank   ×   F calibration   ×   V deposit ρ spray     ×   A leaf
where ßdep is the deposition on artificial targets, µg cm−2; ρsample is the reading of the sample by the spectrophotometer; ρblank is the reading of the blank test in the spectrophotometer; Fcalibration is the p factor of calibration, µg L−1; Vdeposit is the liquid volume of the dilution, L; ρspray is the sprayed concentration, g L−1; and Aleaf is the artificial target area.
The data of deposition were normalized for a comparison of treatments due to the variation in atmospheric conditions at the time of applications [21,22]. The normalized deposition was estimated according to Equation (3):
β N = β d e p × 10 5 Q × ρ s p r a y
where βN is the normalized deposition (µg cm−2 per mg ha−1), βdep is the deposition on artificial targets (µg cm−2), Q is the application rate (L ha−1), and ρspray is the sprayed concentration (mg L−1).

2.5. Determination of Macronutrient Contents

The spray solution that was composed of a mixture of leaf fertilizers and the same adjuvant used in the evaluations of application efficacy (0.3% v v−1, ICL South America, São Paulo/SP, Brazil) were applied. The fertilizers were applied with the objective of improving the performance of coffee plants in the flowering and fruiting stages. The leaf tissues were sampled 15 and 30 days after application (DAA) of a mixture of three leaf fertilizers recommended for the post-harvest application of Conilon coffee (Table 3).
The sampled leaves were from randomly selected plants in the evaluation rows; a pair of leaves was collected from each plant, from the third or fourth node of the plagiotropic branch from the apex, present in the upper middle third of the plants. The soil fertilizer application was equal for all treatments, thus ensuring that the effect of variations in macronutrients was only due to the leaf application using the UAV.
The collected leaves were washed with distilled water to remove impurities and dehydrated in a forced air-circulation oven at 70 °C for 72 h. Total N contents in the extract of sulfuric digestion were determined by the semi micro Kjeldhal method. P and K contents in the extract of nitroperchloric digestion were determined by induced plasma spectrometry and flame photometry, respectively.
The increase in N, P, and K retention and absorption by the treatments was calculated using Equation (4):
I % = T i T c 1 × 100
where I% is the efficacy of retention and absorption of macronutrients, Ti is the mean macronutrient contents in each treatment, and Tc is the mean macronutrient contents in the control treatment.

2.6. Monitoring of Climatic Conditions

Climatic conditions were monitored and registered by a meteorological station (Sigma Sensors®, model EMI-RX-500, São Paulo/SP, Brazil) during the applications and are listed in Table 4. The descriptive methodology in the Norm 22866 of the International Organization for Standardization (ISO, 2005) was used. According to this norm, during the applications, the temperature should be between 5 and 35 °C, the wind speed should be at most 10% of measurements below 1.0 m s−1, and the wind direction should be within the range of 90° ± 30° in relation to the spray line.

2.7. Statistical Analyses

Student’s t-test was used to test the equality of means of the variables of spraying efficacy (coverage, density, and deposition of spray droplets) between the two heights of collection in the canopy of plants. It enables us to define whether the variables would be analyzed separately as a function of heights of collection in the canopy or would be considered the mean values of variables of efficacy, regardless of the height of collection. The criterion established was that if at least two variables of efficacy presented statistically equal means, all analyses would be carried out while considering this information. The assumptions of homogeneity and normality of residues of the data of variables of spraying efficacy were then tested. The same tests were applied to the data of N, P, and K contents. The data were transformed when needed after the analysis of variance and tests of comparison of means at the level of 5% of significance.
The uniformity of distribution of sprayed droplets in each treatment was calculated by using the standard deviation (sd) and coefficient of variation (CV), using Equations (5) and (6).
s d = x i x ¯ ² n 1
C V = s x ¯ × 100
where xi represents the values of coverage, density, and deposition of spray droplets captured by the water-sensitive paper tags and artificial targets placed in the coffee plants in each treatment; x ¯ is the mean values of coverage, density, and deposition of spray droplets; and n is total number of samples of water-sensitive paper tags and artificial targets.

3. Results

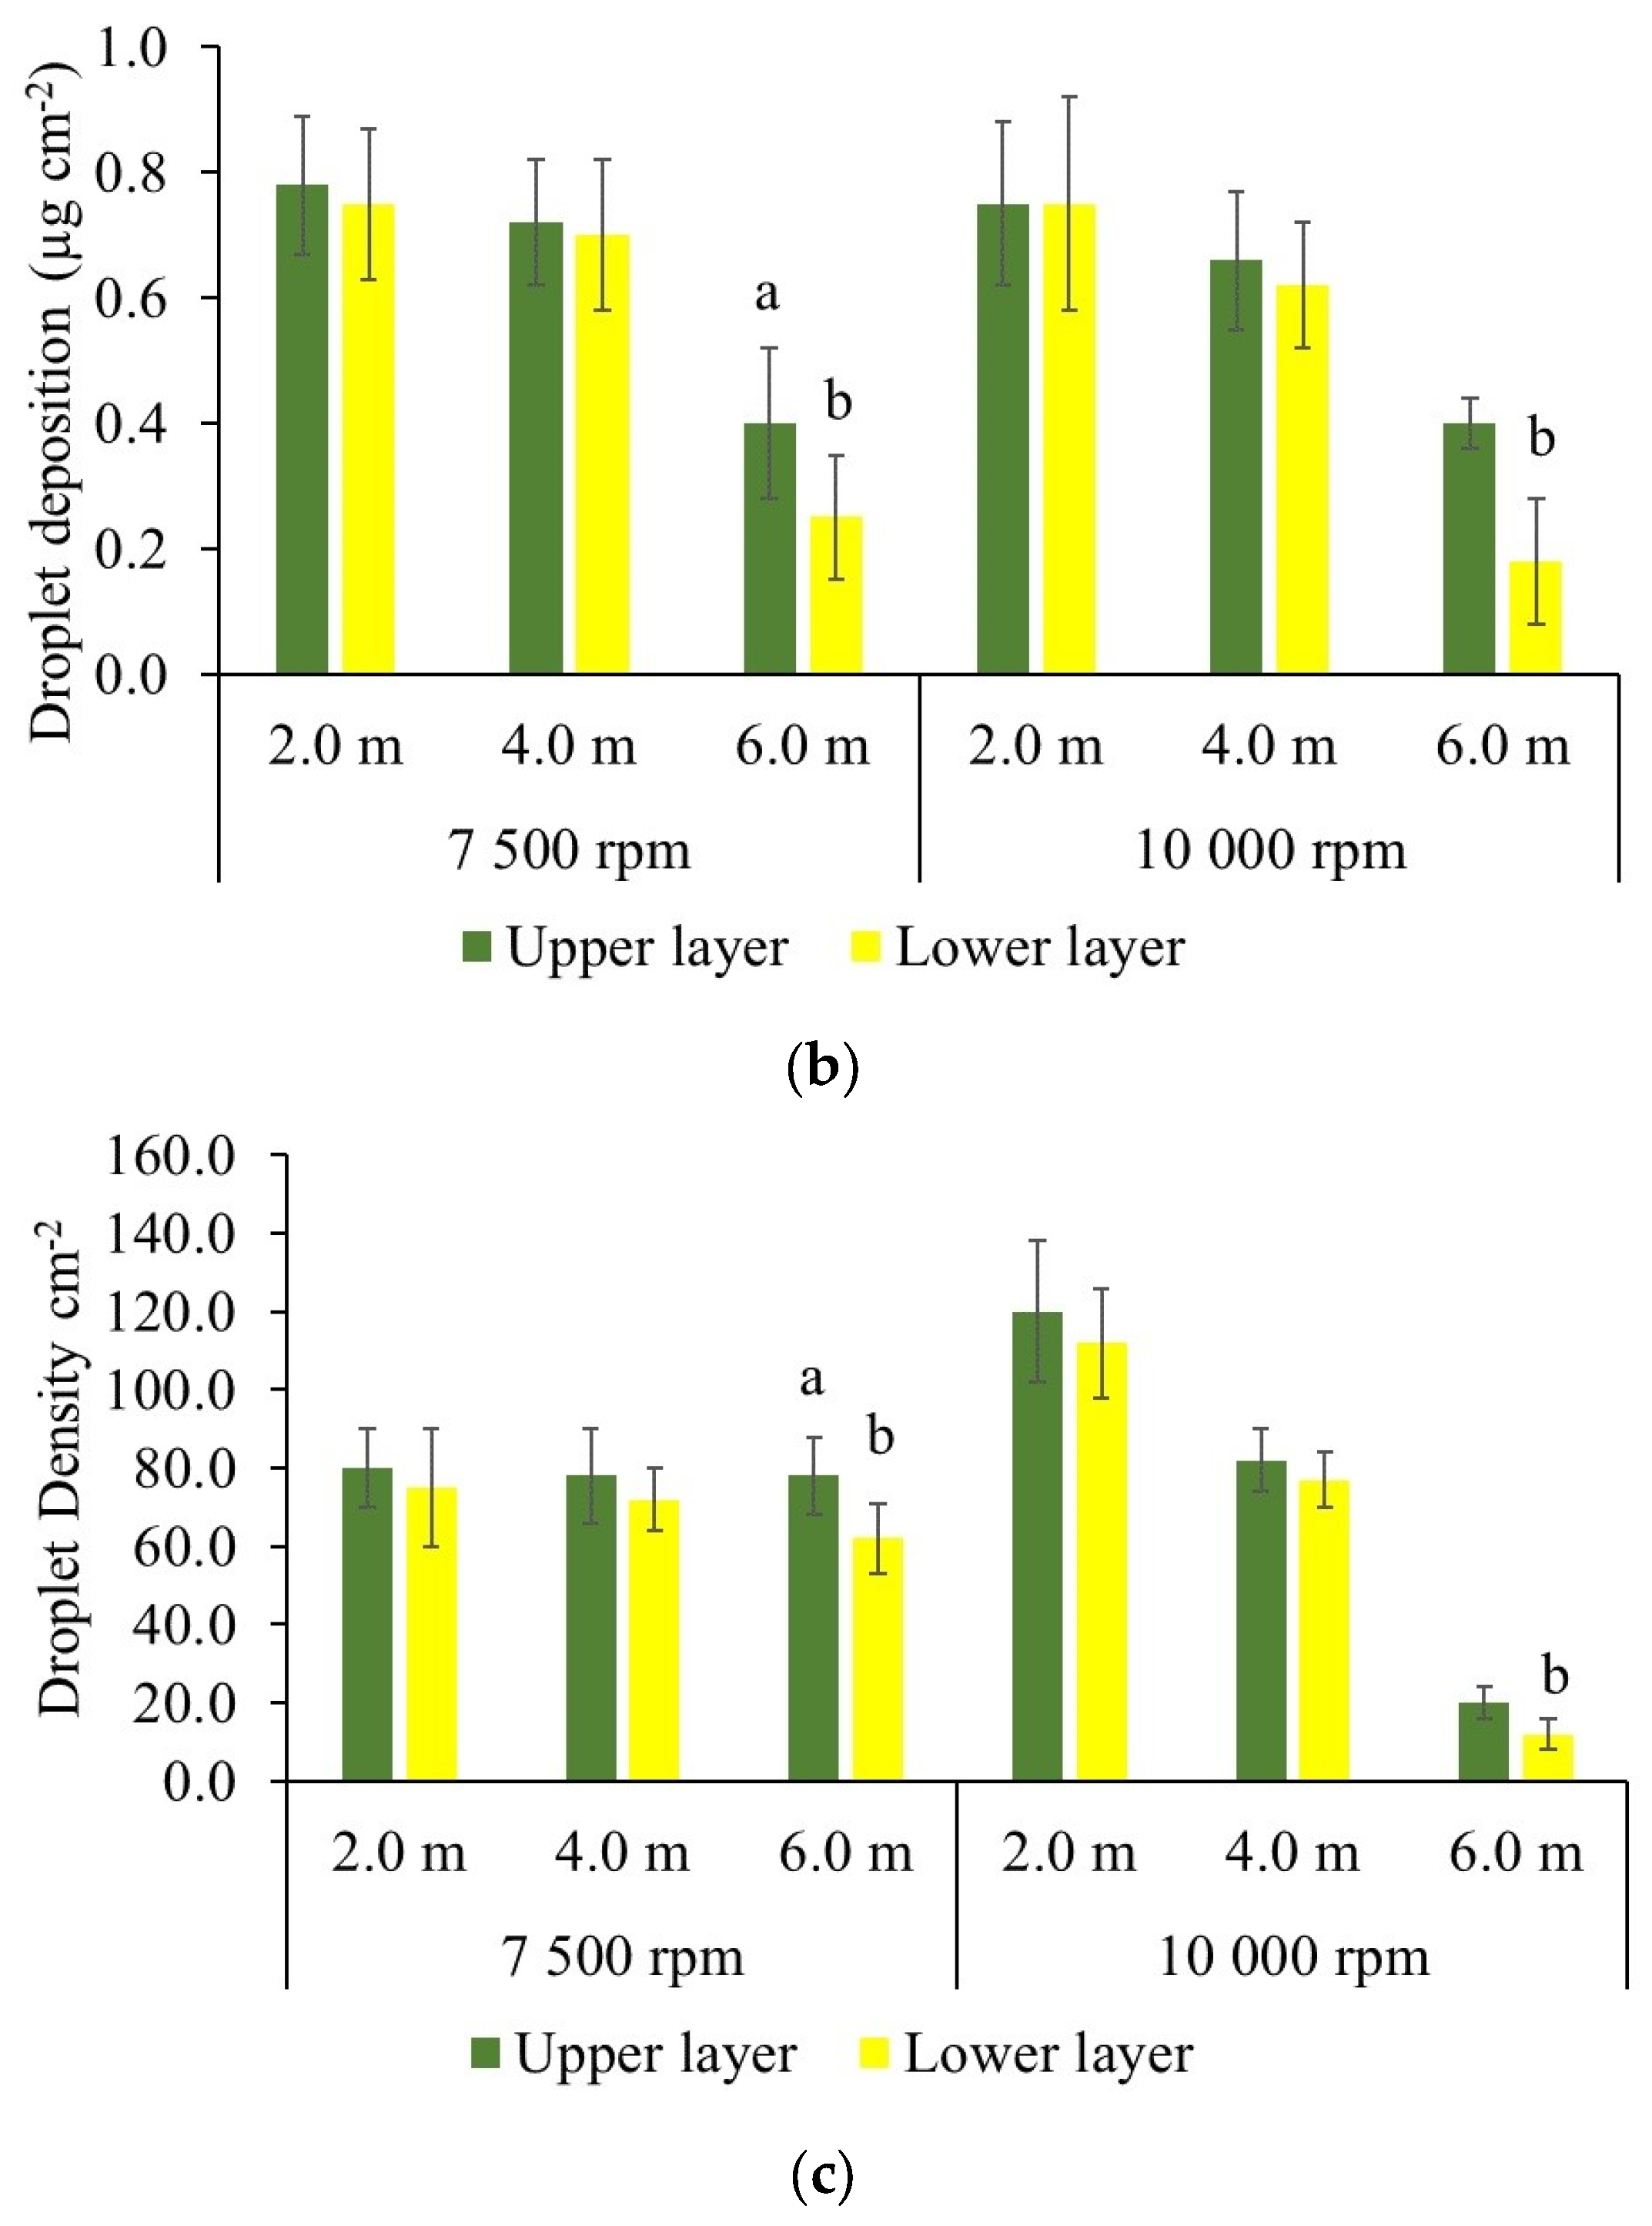
Figure 5 shows the comparative analysis of means of variables of efficacy between the upper and lower canopy layers within each height of flight and centrifugal nozzle rotation.
The coverage presents a higher means in the upper layer than in the lower layer, except in the height of flight of 6.0 m in the rotation of 10,000 rpm, i.e., 6.2% and 4.0%, respectively. The deposition and density of droplets presented significant differences in the height of 6.0 m in both rotations. In the rotation of 7500 rpm, the mean depositions were 0.401 and 0.231 µg cm−2 in the upper and lower layers, respectively, in the rotation of 10,000 rpm, the mean depositions were 0.397 and 0.188 µg cm−2 in the upper and lower canopy layers. The density of droplets presented similar results to the deposition: in the rotation of 7500 rpm, the density of droplets was 1.29-fold higher in the upper compared to the lower layer; in the rotation of 10,000 rpm, this value was 1.33-fold higher.
Considering the six combinations between operational height of flight and centrifugal nozzle rotation (three heights of flight and two centrifugal nozzle rotations), only one (6.0 m and 10,000 rpm) presented significantly different means between layers for the coverage and two (6.0 and 7500 rpm; 6.0 and 10,000 rpm) for the deposition and density of droplets. Thus, the criterion described in the statistical analysis was used; i.e., the variables of efficacy were analyzed as means of different points of collection in the two canopy layers.
Table 5 presents the synthesis of the analysis of data related to variables of efficacy of application of the sprayed solution using UAV. The asymmetry values varied from −0.26 to 0.2, and the kurtosis values varied from −1.95 to −1.63; these values denote that the three variables of efficacy present the normal distribution of the data collected in relation to their respective means. The normality of the data was confirmed by the Shapiro–Wilk test, with probabilities between 0.10 and 0.50; thus, the hypothesis of normality of errors was not rejected at the 5% significance level. The homogeneity of variances by the Bartlett test denoted that the variances of errors were homogeneous. The results of the normality of data, the independence of errors, and the homogeneity of variances are important assumptions for the analysis of variance (ANOVA). The coefficient of variance (CV) for each source of variation was between 12.2% and 33.4%; the CV in the ANOVA denotes the precision of the planning and obtaining of experimental data.
The centrifugal nozzle rotation did not affect the means of coverage of droplets and deposition of the spray solution (p-value = 0.088 and 0.603), as well as the interaction with the factor height of flight (p-value = 0.623 and 0.064); these variables were significantly affected in the contrasts of means only by the factor height of flight. The interaction between the centrifugal nozzle rotation and height of flight was significant in the contrasts of means for the density of droplets (p-value < 0.01 **).
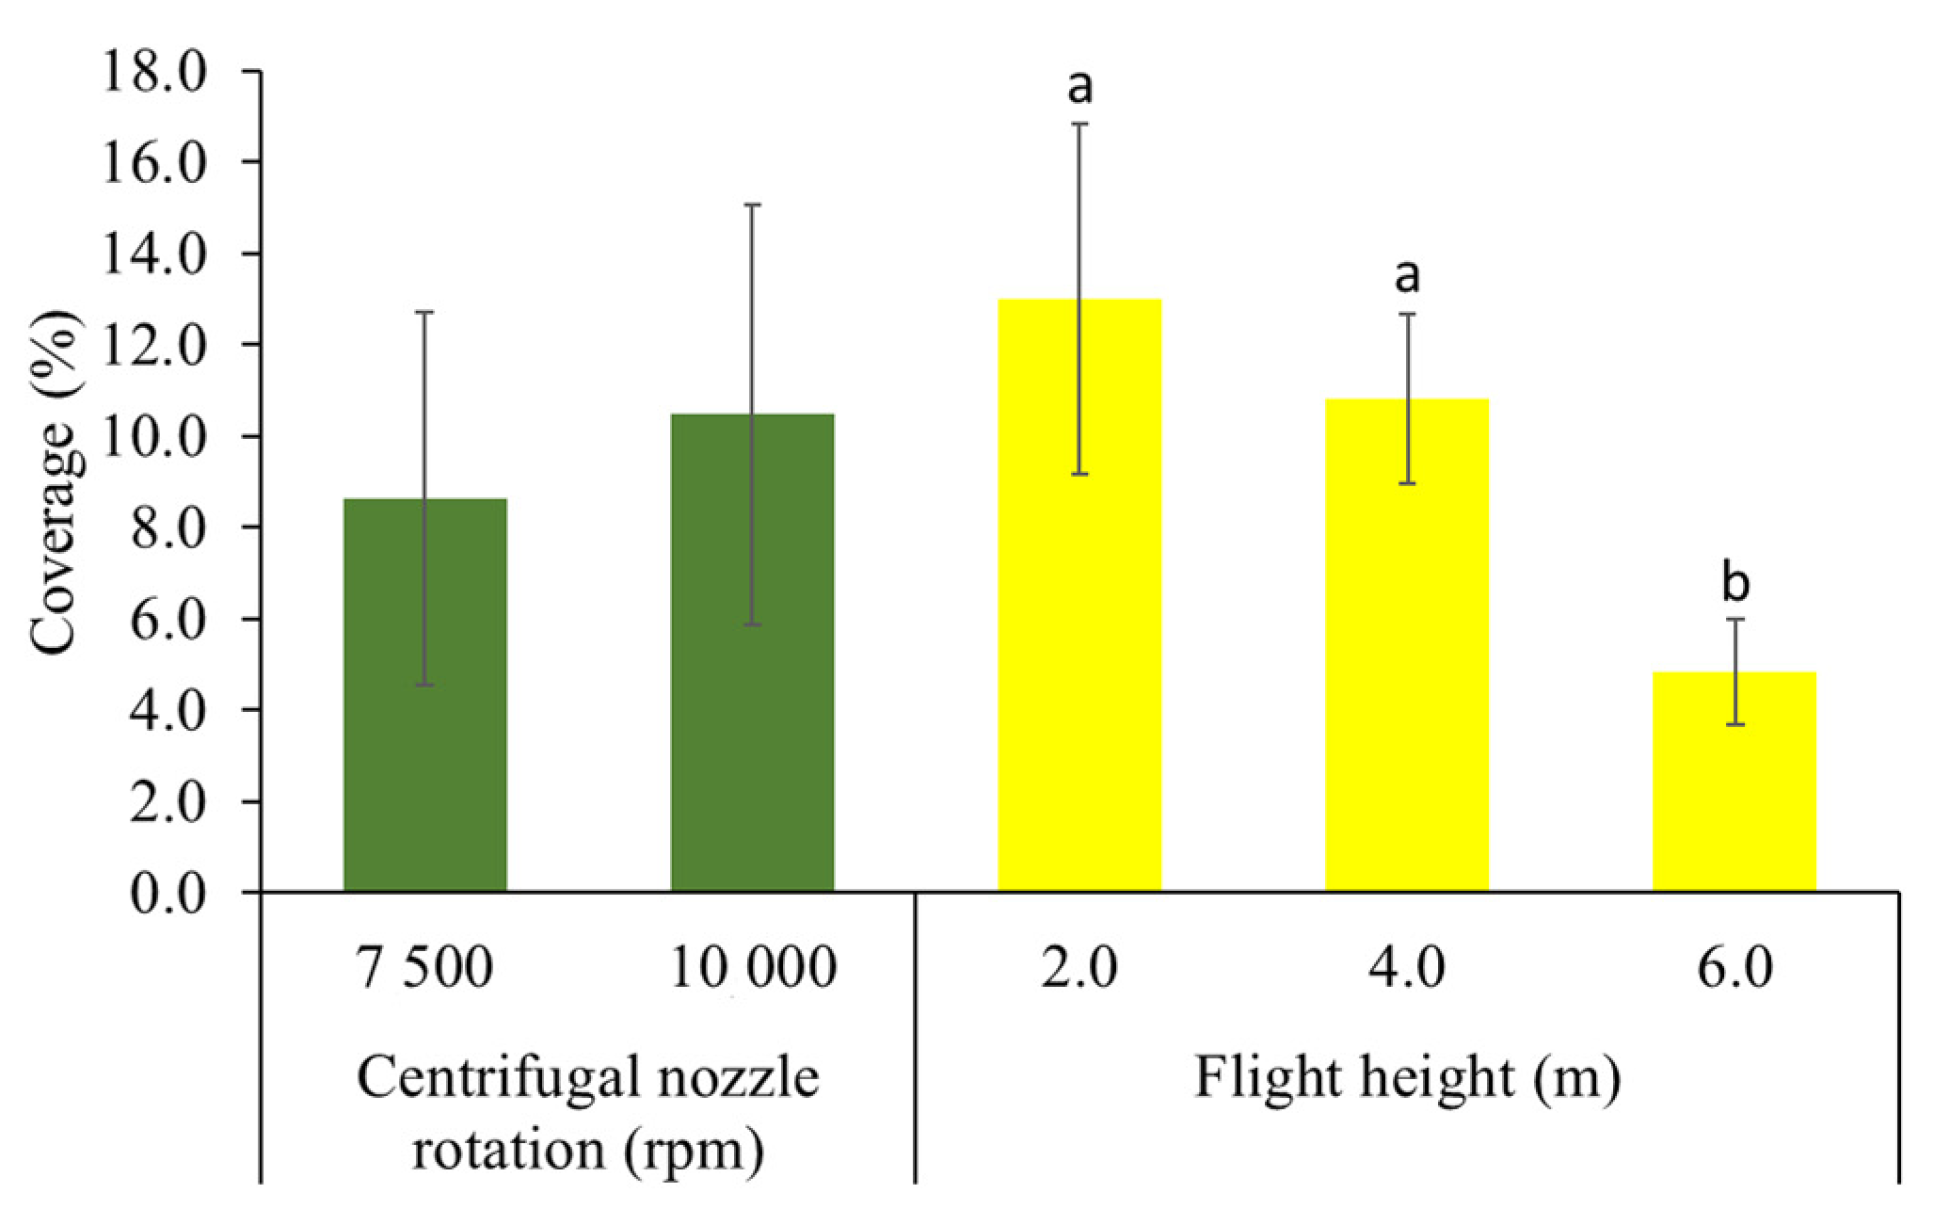
The mean coverage of droplets at the height of flight of 2.0 m (12.4%) does not differ from that of the height of flight of 4.0 m (11.1%); however, it was three-fold higher than that of the height of flight of 6.0 (4.1%) (Figure 6). Although the centrifugal nozzle rotation had no significant effect, the coverage in the rotation of 10,000 rpm (10.4%) is higher than that in the rotation of 7500 rpm (8.5%).
Figure 7 presents the means of deposition of sprayed solution. The centrifugal nozzle rotation did not significantly affect the deposition; the difference between the means was 0.020 µg cm−2 (0.595–0.575 µg cm−2). There was no significant difference in deposition means between the heights of flight of 2.0 (0.755 µg cm−2) and 4.0 (0.642 µg cm−2), but the deposition in the height of flight of 6.0 (0.358 µg cm−2) was significantly higher, with a mean of deposition of 52.6%.
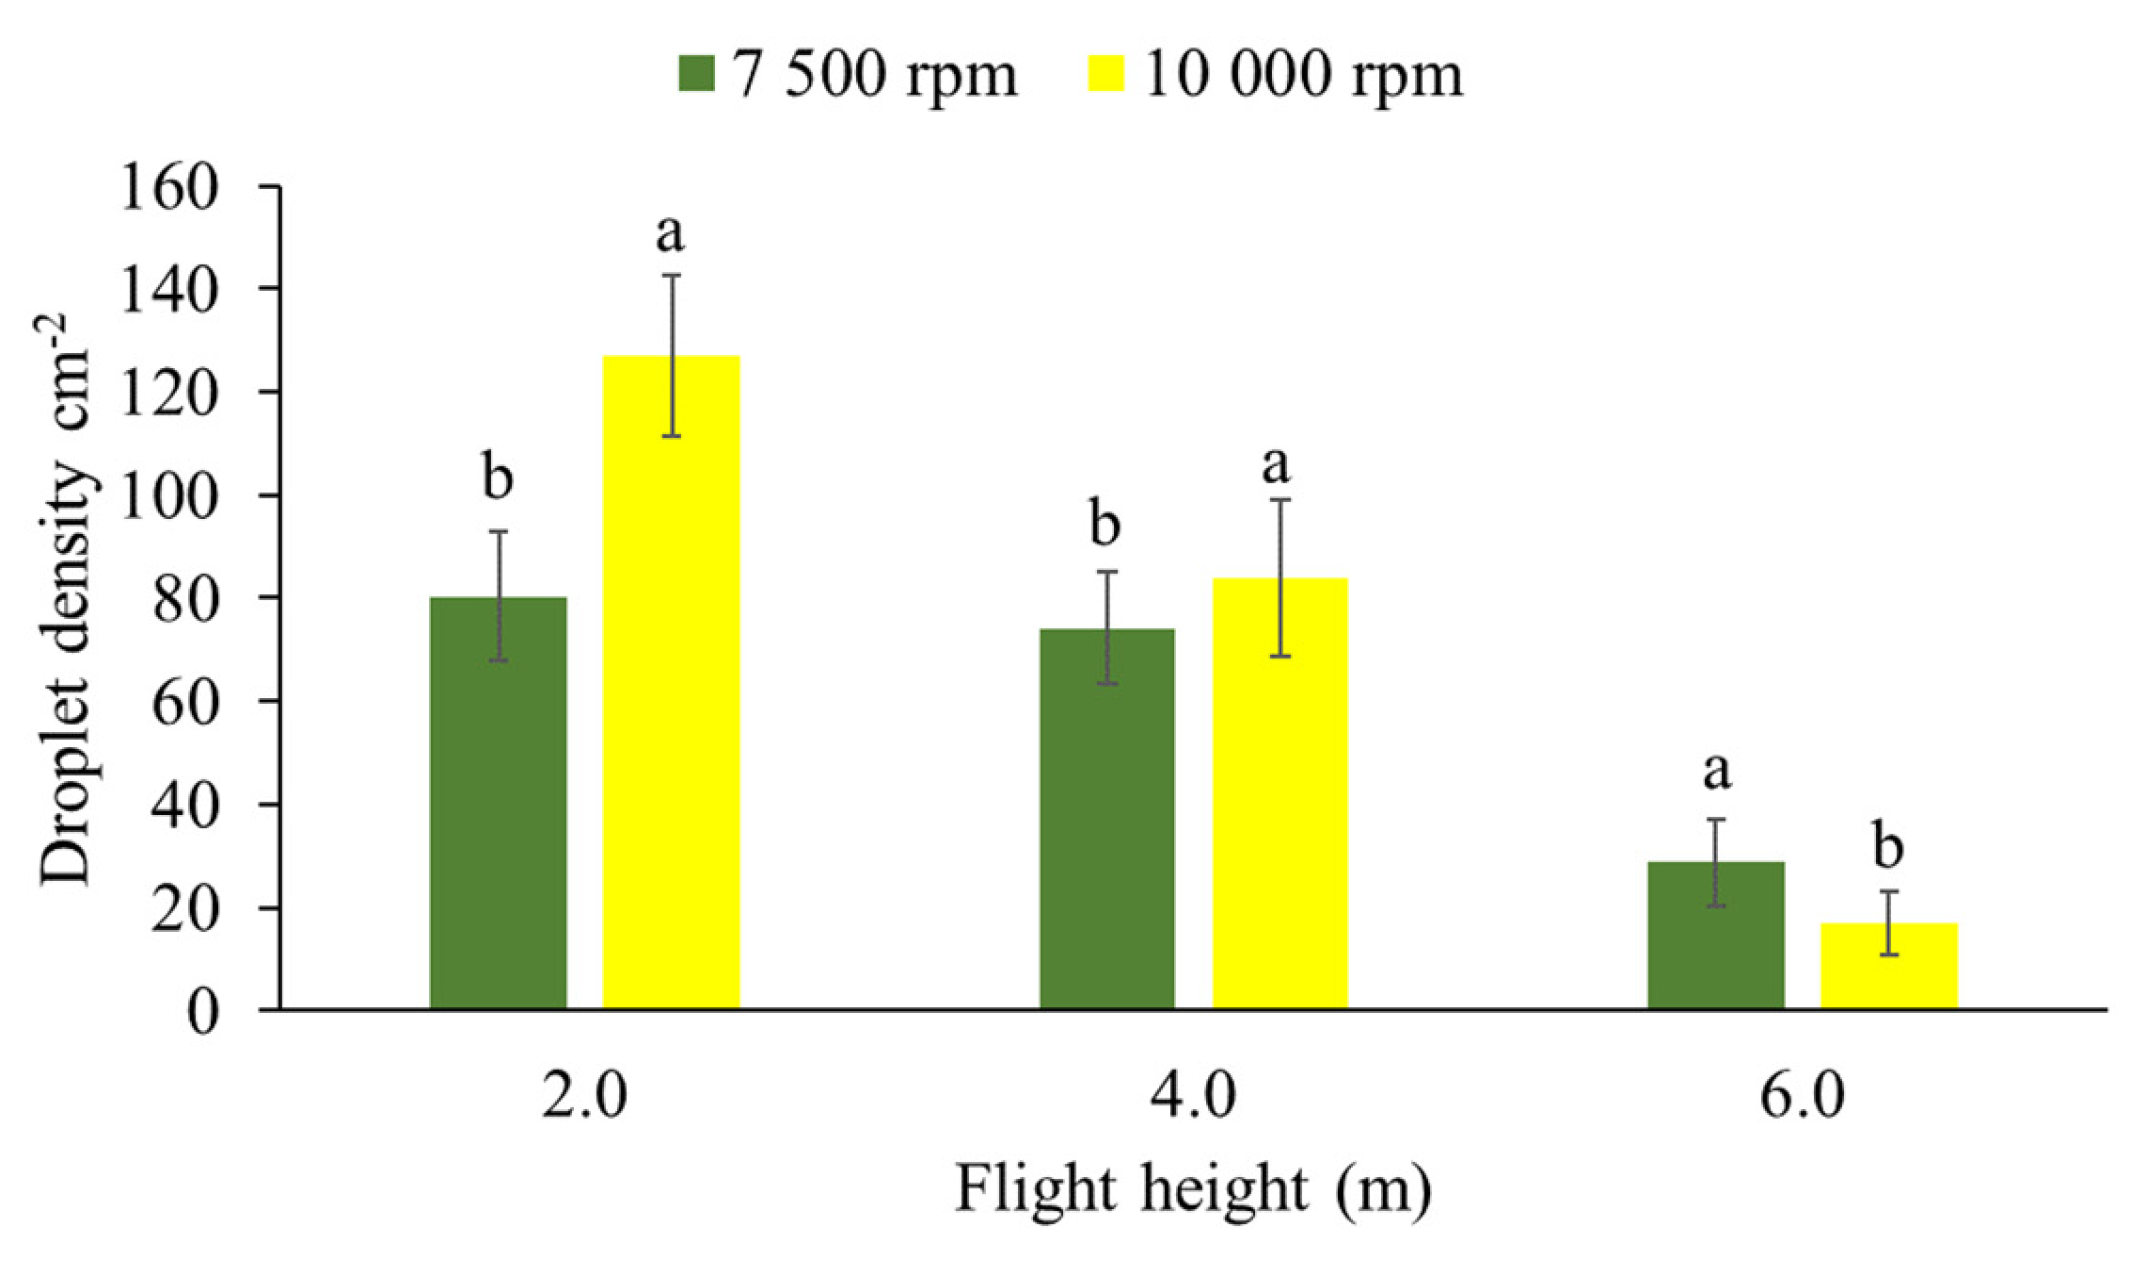
The means found for the density of droplets are shown in Figure 8.
The density of droplets in the rotation of 10,000 rpm and at the height of flight 2.0 (127.1 droplets cm−2) was significantly higher than that in the rotation of 7500 rpm in the same height (80.4 droplets cm−2). The height of flight of 4.0 m presented significant difference (9.7 droplets cm−2) in the density of droplets, with 83.9 and 74.2 droplets cm−2 in the rotations of 10,000 and 7500 rpm, respectively. However, a significant difference in density of droplets between nozzle rotations was found for the height of 6.0 m, with an inversion in the mean values; i.e., the density in the rotation of 7500 rpm (28.7 droplets cm−2) was 1.7-fold higher than that in the rotation of 10,000 rpm (16.9 droplets cm−2).
The density of droplets in the centrifugal nozzle rotation of 7500 rpm was not affected by the heights of flight, presenting 80.4 droplets cm−2 at 2.0 m and 74.2 droplets cm−2 4.0 m. However, the density of droplets in the height of 6.0 m (28.7 droplets cm−2) was significantly different, with 51.7 droplets cm−2 and 45.5 droplets cm−2 in the heights of 2.0 and 4.0 m, respectively. In the centrifugal nozzle rotation of 10,000 rpm, the density of droplets was significantly different in the three heights of flight, with 127.1, 83.9, and 16.9 droplets cm−2 for the heights of 2.0, 4.0, and 6.0 m, respectively.
Table 6 presents the means of coefficients of variation (CVs) of variables of efficacy (coverage, density, and deposition of spray droplets). The normality and homogeneity of variance tests carried out for the data of CV for coverage, density, and deposition of spray droplets (W = 0.994, 0.884, and 0.759, respectively; χ2 = 0.445, 0.449, and 0.477, respectively) allowed us to perform the analysis of variance. The mean CVs of coverage of droplets were affected by the centrifugal nozzle rotation (p-value = 0.03 *) and height of flight (p-value = 0.0055 **); the mean CV of the density of droplets was affected by the interaction between the factors (p-value = 0.017 *), as well as the mean CV of the deposition of solution (p-value = 0.017 *).
The CVs found denote the uniformity of distribution of droplets and depositions on water-sensitive paper tags (Figure 9) and artificial targets. The uniformity of coverage was significantly lower at the height of 4.0 (52.7%) compared to those at the heights of 2.0 m (47.0%) and 6.0 m (44.7%). The uniformity of coverage analyzed within the centrifugal nozzle rotations showed better uniformity in the rotation of 7500 rpm (45.4%) in comparison to the rotation of 10,000 rpm (50.5%).
The uniformity of density of droplets was statistically equal in the rotations of 7500 and 10,000 rpm in the heights of flight of 2.0 m (45.2% and 44.2%, respectively) and 6.0 m (55.4% and 52.7%, respectively). At the height of flight of 4.0 m, the uniformity of density was significantly higher in the rotation of 7500 rpm (38.9%) compared to the rotation of 10,000 rpm (48.7%).
The mean CVs of uniformity of deposition of the sprayed solution were statistically equal in the centrifugal nozzle rotations of 7500 and 10,000 in the height of flight of 2.0 m (39.7% and 37.5%, respectively). In the heights of flight of 4.0 and 6.0 m, the uniformity was significantly different between rotations, with 28.4% in the rotation of 7500 rpm and 32.5% in the rotation of 10,000 rpm.
The analysis of data referring to macronutrient contents (N, P, and K) applied by the unmanned aerial vehicle are shown in Table 7. Considering the asymmetry and kurtosis values of the data of macronutrient contents 15 days after application (DAA), they varied from −0.51 to 0.59 and from −0.98 to 1.38, respectively. Considering the Shapiro–Wilk (0.976 for N, 0.970 for P, and 0.985 for K) and Bartlett (11.87 for N, 11.82 for P, and 8.92 for K) test, the assumptions for the application of the test of variance were met. Similarly, macronutrient contents 30 DAA presented asymmetry varying from 0.02 to 0.48, kurtosis from −1.06 to −0.74, Shapiro–Wilk test results denoting normal distribution of the data, and the Bartlett homogeneity test denoting homogeneity of variances.
The ANOVA considered the six treatments formed by a combination of centrifugal nozzle rotations and heights of flight (Table 2), i.e., 7500 rpm × 2.0 m (T1), 10,000 rpm × 2.0 (T2), 7500 rpm × 4.0 (T3), 10,000 rpm × 4.0 (T4), 7500 rpm × 6.0 m (T5), and 10,000 rpm × 6.0 m (T6), and a control treatment. The ANOVA showed significant differences (p-value < 0.01 **) between the control treatment and each treatment for N, P, and K contents and a significant difference (p-value < 0.01 **) between contrasts of combined means between treatments.
Figure 10 shows the results of the N, P, and K contents at 15 and 30 DAA.
The values mean N, P, and K contents in the control treatment at 15 and 30 DAA were 12.135, 0.786, and 8.219 g kg−1 and 13.059, 0.987, and 8.110 g kg−1, respectively. All treatments presented a significant difference in N contents, presenting increases from 18.4% (T5: 14.372 g kg−1) to 41.7% (T1: 17.191 g kg−1) at 15 DAA and from 14.0% (T6: 14.890 g kg−1) to 42.5% (T1: 18.614 g kg−1) at 30 DAA. The P contents increased from 16.5% (T6: 0.916 g kg−1) to 70.0% (T3: 1.336 g kg−1) at 15 DAA and from 8.9% (1.075 g kg−1) to 34.4% (T1: 1.327 g kg−1) at 30 DAA. The K contents increased from 8.7% (T5: 8.931 g kg−1) to 54.3% (T1: 12.689 g kg−1) at 15 DAA and from 13.9% (T6: 9.238 g kg−1) to 60.6% (T1: 13.030 g kg−1) at 30 DAA. The only treatment that presented no significant difference by increases in percentage in relation to the control treatment was the T5 for K contents at 15 DAA. The highest increase at 15 DAA was found for P contents (52.4%), and the highest increase at 30 DAA was found for K contents (39.6%; Figure 9 and Table 8).
The mean N, P, and K contents in the control treatment at 15 and 30 DAA were 12.135, 0.786, and 8.219 g kg−1 and 13.059, 0.987, and 8.110 g kg−1, respectively.
Figure 11 shows the results of macronutrient (N, P, and K) contents at 15 and 30 DAA in a boxplot. The boxplot was used as a graphical tool for a visual analysis of possible different distributions of macronutrient contents and values. In addition, it allowed a comparative graphical distribution.
N contents at 15 and 30 DAA show different dispersions among treatments, with the highest dispersion in T1, which showed the largest interquartile differences (ΔQ), 1.101 g kg−1, and 2.5 g kg−1. The lowest variabilities in N contents were found for T6 (ΔQ = 0.315 g kg−1) and T4 (0.222 g kg−1) at 15 DAA. T1 showed the highest average N content at 15 DAA (17.111 g kg−1) and was significantly different from the other treatments. T2 (16.207 g kg−1), T3 (16.512 g kg−1), and T4 (16.706 g kg−1) showed no difference among them. T1 showed 1.19 times higher N contents than T6 (14.321 g kg−1; see Figure 11a,b).
Figure 11c,d show the comparative graphs of P contents at 15 DAA and 30 DAA, respectively. The treatment with the greatest variability in P contents was T2, which showed Q1 equal 1.263 g kg−1 and Q2 equal 1.385 g kg−1, i.e., ΔQ equal 0.122 g kg−1 at 15 DAA. The highest variability at 30 DAA was found for T1 (ΔQ = 0.093 g kg−1). The lowest interquartile values were found for T6 at 15 DAA (ΔQ = 0.011 g kg−1) and T3 at 30 DAA (ΔQ = 0.007 g kg−1). T1, T2, T3, and T4 showed no significant difference in P contents at 15 DAA, showing 1.294, 1.314, 1.323, and 1.304 g kg−1, respectively. T3 showed the highest average P content, being 31.4% higher than the treatment with the lowest average. The P contents at 30 DAA in T1 (1.308 g kg−1) and T2 (1.341 g kg−1) did not differ. T4, T5, and T6 showed the lowest mean P contents, 0.977, 1.082, and 1.040 g kg−1.
The results of the mean K contents are shown in Figure 11e,f. T2 showed variability in K contents at 15 and 30 DAA, with interquartile differences of 1.157 g kg−1 at 15 DAA and 0.599 g kg−1 at 30 DAA. T2 showed the highest mean K content (12.202 g kg−1) at 15 DAA, and T1, T3, T4, and T5 showed no significant difference among themselves, with P contents of 9.500, 9.433, 10.005, and 8.904 g kg−1. T3 showed the highest average K content at 30 DAA (13.113 g kg−1), which is statistically superior to the other treatments. T1 (11.800 g kg−1) and T5 (11.924 g kg−1) formed a second group of K averages, and T6 (9.009 g kg−1) showed the lowest average when compared to the others.
No discrepant value was found, regardless of the treatment and time (DAA); i.e., there was no value beyond the interval of interquartile detection.

4. Discussion

The result is justified because the effects of the heights of flight and centrifugal nozzle rotations on the distribution and deposition of droplets sprayed using the UAV on the canopy of Conilon coffee plants were evaluated in this study. The isolated factors and the interaction between the two factors had different impacts on the distribution and deposition of droplets. Considering the six possible combinations between the factors studied, with eighteen combinations between the height of flight and centrifugal nozzle rotations, for the three variables of application efficacy, only five presented significant differences between means. Thus, the mean values were considered for the coverage, density, and deposition of spray droplets in the two layers of the coffee plant canopy.
The coffee plants were pruned soon after annual harvest, and the leaf mass was reduced, facilitating the distribution and deposition of droplets in the two layers in which the data of efficacy were collected [23].
The distribution and deposition of droplets in the coffee plant canopy were significantly affected by the operational heights of flight. The applications of droplets, which were sprayed close to the coffee plant canopy, had little or no effect from wind that could cause a significant drift; however, the chance that the sprayed droplets could be affected by height increased as the spraying height was increased [11,24,25,26].
The heights of flight of the UAV, combined with the centrifugal nozzle rotations, had different effects on the distribution of droplets. When analyzing the variables of application efficacy, the combination of the height of flight of 2.0 m and rotation of 10,000 rpm was that that resulted in the best coverage, density, and deposition of spray droplets; the density and deposition was significantly affected by the height of flight within the centrifugal nozzles rotations, and the density of droplets was significantly affected by the interaction between these two factors. These differences can be attributed to the architecture of the canopy of plants after the harvest pruning and distance between plants in the planting rows; plants closer to each other avoid the slide of the solution to the soil and contribute to a better penetration of the sprayed droplets. The effect of the centrifugal nozzle rotations on the deposition and uniformity of droplets was found in other studies [13,14,15], as well as the effect of heights of flight [12,24,25].
The uniformity of coverage, density, and deposition of spray droplets on the canopy of coffee plants varied significantly according to the heights of flight and centrifugal nozzle rotations. The mean coefficient of variation increased when the height of flight and rotation was increased to 10,000 rpm and decreased when the height of flight was decreased to 2.0 m. These differences in coefficients of variation can be due to the lack of obstacles between the nozzles and upper canopy layer. In addition to height of flight and centrifugal nozzle rotation, the downwash effect of the UAV generated by the UAV rotors and structure may have had a significant effect on the distribution and uniformity of droplets [12,14,15].
Despite the different possible structural configurations of centrifugal nozzles according to the manufacturers, the droplet size and relative extension are usually similar [16]. In most cases, the volume of solution applied by UAV is very low, which requires decreasing the size of droplets to optimize the coverage of the crop. In this sense, varying the centrifugal nozzle rotations may enable us to obtain different sizes of droplets [14,25]; and this explains the highest coverage, density, and deposition of spray droplets found in this study.
The mean macronutrient retention and absorption in the combined treatments (heights of flight and centrifugal nozzle rotations) increased compared to the control treatment. The treatments that resulted in the highest mean coverage, density, and deposition of spray droplets also presented the best means of absorption and retention of macronutrients (N, P, and K), namely the treatments T1 (2.0 m and 7500 rpm) and T2 (2.0 m and 10,000). These treatments were the most efficient and presented uniformity of distribution and deposition of droplets of the leaf fertilizers applied; therefore, the mode of spraying and application is an important factor for the efficacy of absorption of macronutrients.
Although the application efficacy is important, the retention and absorption of macronutrients should be analyzed holistically, considering other factors, such as those related to the plant’s age, leaf structure, and quantity of deposition on new leaves, as well as external factors, such as soil water availability, light availability, and climatic conditions [15,16,17].
In addition to these factors, those related to the quality of spraying and application of leaf fertilizers should be considered, including the choice of fertilizers that have high dilution capacity in the mixture, and operational factors for the UAV calibration and adjusts, these factors were evident in treatments T1 and T2. Therefore, the height of flight and centrifugal nozzle rotations are important, but in addition to these factors, flight speed and the flow of the nozzles are important variables that define the quality of deposition and absorption of leaf fertilizers [12].
In the comparative analysis between the treatments, the macronutrients N and P showed higher absorption and retention in T1 and T2. N has a characteristic of fast translocation in coffee leaves, and the quantity absorbed in the first 15 days after application (DAA) is high; moreover, it is improved by an efficient deposition of sprayed droplets. The P contents were similar in T1 and T2; however, the absorption increased at 30 DAA. The results of K absorption were higher in these treatments at 15 DAA. A high coverage and deposition of leaf fertilizers is essential to make the highest quantity of macronutrients available to be absorbed by coffee plants [16,17].

5. Conclusions

A UAV sprayer was used in the applications of leaf fertilizers in Conilon coffee plants. The coverage, density, and deposition of sprayed droplets were the variables evaluated for the analysis of efficacy, and the retention and absorption of macronutrients (N, P, and K) were used to evaluate the application efficacy. The main conclusions were as follows:
The application of leaf fertilizers by UAV provided a uniform distribution between the canopy layers of Conilon coffee plants, mainly in newer leaves, in which the absorption of macronutrients is higher. The configuration of the factors with a height of flight of 2.0 m and centrifugal nozzle rotation of 10,000 rpm resulted in the best parameters of efficacy, since the coverage was 12.4%, and the density of droplets was 127 droplets cm−2. The best results of efficacy resulted in the best results for increases in retention and absorption of macronutrients: 41.7%, 64.1%, and 54.1% for N, P, and K, respectively.

Author Contributions

Conceptualization, D.H.C. and E.L.d.V.; methodology, D.H.C. and E.L.d.V.; software, E.L.d.V.; validation, D.H.C., F.d.A.F. and E.L.d.V.; formal analysis, E.L.d.V. and F.d.A.F.; investigation, D.H.C., L.F.O.R. and E.L.d.V.; resources, D.H.C., L.F.O.R. and E.L.d.V.; data curation, E.L.d.V.; writing—D.H.C.; writing—review and editing, D.H.C., P.C., Y.L. and E.L.d.V.; visualization, L.F.O.R., P.C., Y.L. and F.d.A.F.; supervision, E.L.d.V.; project administration, E.L.d.V.; funding acquisition, E.L.d.V. All authors have read and agreed to the published version of the manuscript.

Funding

This study was financed in part by the Coordenação de Aperfeiçoamento de Pessoal de (FAPES 140/2021)—Brazil. CAPES/FAPES Cooperation—Postgraduate Development Program—PDPG.

Data Availability Statement

Not applicable.

Conflicts of Interest

The authors declare no conflict of interest.

References

  1. United State Department of Agriculture (USDA). Coffee: World Markets and Trade. 2022. Available online: https://www.fas.usda.gov/commodities/coffee (accessed on 10 April 2023).
  2. Santos, M.M.D.; Silva, C.A.D.; Oza, E.F.; Gontijo, I.; Amaral, J.F.T.D.; Partelli, F.L. Concentration of nutrients in leaves, flowers, and fruits of genotypes of Coffea canephora. Plants 2021, 10, 2661. [Google Scholar] [CrossRef] [PubMed]
  3. Ferreira, G.F.P.; Lemos, O.L.; Soratto, R.P.; Perdoná, M.J. Spatial variability of leaf macronutrient concentration and fruit production of an Arabica coffee plantation using two sampling densities. Precis. Agric. 2022, 23, 1473–1488. [Google Scholar] [CrossRef]
  4. Santos, C.; Malta, M.R.; Gonçalves, M.G.M.; Borém, F.M.; Pozza, A.A.A.; Martinez, H.E.P.; Guelfi, D. Chloride Applied via Fertilizer Affects Plant Nutrition and Coffee Quality. Plants 2023, 12, 885. [Google Scholar] [CrossRef] [PubMed]
  5. Dantas, J.; Motta, I.O.; Vidal, L.A.; Nascimento, E.F.M.B.; Bilio, J.; Pupe, J.M.; Veiga, A.; Carvalho, C.; Lopes, R.B.; Rocha, T.L.; et al. A comprehensive review of the coffee leaf miner Leucoptera coffeella (Lepidoptera: Lyonetiidae)—A major pest for the coffee crop in brazil and others neotropical countries. Insects 2021, 12, 1130. [Google Scholar] [CrossRef] [PubMed]
  6. Jasim, M.A.; Shakhatreh, H.; Siasi, N.; Sawalmeh, A.H.; Aldalbahi, A.; Al-Fuqaha, A. A survey on spectrum management for unmanned aerial vehicles (uavs). IEEE Access 2021, 10, 11443–11499. [Google Scholar] [CrossRef]
  7. Uche, U.E.; Audu, S.T. UAV for agrochemical application: A review. Niger. J. Technol. 2021, 40, 795–809. [Google Scholar] [CrossRef]
  8. Aslan, M.F.; Durdu, A.; Sabanci, K.; Ropelewska, E.; Gültekin, S.S. A comprehensive survey of the recent studies with UAV for precision agriculture in open fields and greenhouses. Appl. Sci. 2022, 12, 1047. [Google Scholar] [CrossRef]
  9. Biglia, A.; Grella, M.; Bloise, N.; Comba, L.; Mozzanini, E.; Sopegno, A.; Pittarello, M.; Dicembrini, E.; Alcatrão, L.E.; Guglieri, G.; et al. VANT-spray application in vineyards: Flight modes and spray system adjustment effects on canopy deposit, coverage, and off-target losses. Sci. Total Environ. 2022, 845, 157292. [Google Scholar] [CrossRef]
  10. Martin, D.E.; Woldt, W.E.; Latheef, M.A. Effect of application height and ground speed on spray pattern and droplet spectra from remotely piloted aerial application systems. Drones 2019, 3, 83. [Google Scholar] [CrossRef]
  11. Nascimento, V.P.; Da Vitória, E.L. Spraying quality using unmanned aerial vehicle in citrus. Rev. Eng. Agric. 2022, 30, 214–221. [Google Scholar] [CrossRef]
  12. Su, D.; Yao, W.; Yu, F.; Liu, Y.; Zheng, Z.; Wang, Y.; Chen, C. Single-Neuron PID UAV Variable Fertilizer Application Control System Based on a Weighted Coefficient Learning Correction. Agriculture 2022, 12, 1019. [Google Scholar] [CrossRef]
  13. Hussain, S.; Masud Cheema, M.J.; Arshad, M.; Ahmad, A.; Latif, M.A.; Ashraf, S.; Ahmad, S. Spray uniformity testing of unmanned aerial spraying system for precise agro-chemical applications. Pak. J. Agric. Sci. 2019, 56, 897–903. [Google Scholar] [CrossRef]
  14. Chen, P.; Ouyang, F.; Zhang, Y.; Lan, Y. Preliminary Evaluation of Spraying Quality of Multi-Unmanned Aerial Vehicle (UAV) Close Formation Spraying. Agriculture 2022, 12, 1149. [Google Scholar] [CrossRef]
  15. Chen, P.; Ouyang, F.; Wang, G.; Qi, H.; Xu, W.; Yang, W.; Lan, Y. Droplet distributions in cotton harvest aid applications vary with the interactions among the unmanned aerial vehicle spraying parameters. Ind. Crops Prod. 2021, 163, 113324. [Google Scholar] [CrossRef]
  16. Zheng, Y.J.; Yang, S.H.; Zhao, C.J.; Chen, L.P.; Lan, Y.; Tan, Y. Modelling operation parameters of VANT on spray effects at different growth stages of corns. Int. J. Agric. Biol. Eng. 2017, 10, 57–66. [Google Scholar] [CrossRef]
  17. Wang, C.; Liu, Y.; Zhang, Z.; Han, L.; Li, Y.; Zhang, H.; Wongsuk, S.; Li, Y.; Wu, X.; He, X. Spray performance evaluation of a six-rotor unmanned aerial vehicle sprayer for pesticide application using an orchard operation mode in apple orchards. Pest Manag. Sci. 2022, 78, 2449–2466. [Google Scholar] [CrossRef]
  18. Hou, C.; Tang, Y.; Luo, S.; Lin, J.; He, Y.; Zhuang, J.; Huang, W. Optimization of control parameters of droplet density in citrus trees using VANTs and the Taguchi method. Int. J. Agric. Biol. Eng. 2019, 12, 1–9. [Google Scholar] [CrossRef]
  19. Llorens, J.; Gil, E.; Llop, J.; Escolà, A. Variable rate dosing in precision viticulture: Use of electronic devices to improve application efficiency. Crop Prot. 2010, 29, 239–248. [Google Scholar] [CrossRef]
  20. Miranda-Fuentes, A.; Llorens, J.; Gamarra-Diezma, J.L.; Gil-Ribes, J.A.; Gil, E. Towards an optimized method of olive tree crown volume measurement. Sensors 2015, 15, 3671–3687. [Google Scholar] [CrossRef] [PubMed]
  21. Crause, D.H.; Vitória, E.L.; Soela, D.M.; Oliveira, D.A.; Batista, A.G.; Lacerda, G. Derivative estimate in the application of agricultural defensives in conilon coffee. Braz. J. Prod. Eng. BJPE 2020, 1, 85–94. Available online: https://www.lareferencia.info/vufind/Record/BR_fbd0add9bbdd338b48082ab31e63a7e7 (accessed on 10 April 2023).
  22. Liu, X.; Lai, B.; Lin, B.; Leung, V.C.M. Joint Communication and Trajectory Optimization for Multi-UAV Enabled Mobile Internet of Vehicles. IEEE Trans. Intell. Transp. Syst. 2022, 23, 15354–15366. [Google Scholar] [CrossRef]
  23. Rahman, M.F.F.; Fan, S.; Zhang, Y.; Chen, L. A comparative study on application of unmanned aerial vehicle systems in agriculture. Agriculture 2021, 11, 22. [Google Scholar] [CrossRef]
  24. Susitra, D.; Jebaseeli, E.A.E.; Chitturi, V.K.; Chadalavada, V. Design and development of an Hexacopter for fertlizer spraying in agriculture fields. J. Phys. 2020, 1706, 12053. [Google Scholar] [CrossRef]
  25. Lan, Y.; Qian, S.; Chen, S.; Zhao, Y.; Deng, X.; Wang, G.; Qiu, X. Influence of the downwash wind field of plant protection UAV on droplet deposition distribution characteristics at different flight heights. Agronomy 2021, 11, 2399. [Google Scholar] [CrossRef]
  26. Guo, S.; Li, J.; Yao, W.; Zhan, Y.; Li, Y.; Shi, Y. Distribution characteristics on droplet deposition of wind field vortex formed by multi-rotor UAV. PLoS ONE 2019, 14, e0220024. [Google Scholar] [CrossRef]
Figure 1. Multirotor unmanned aerial vehicle (UAV) and centrifugal nozzle used in the spraying experiment.
Agronomy 13 01506 g001
Figure 2. Experimental design of the experiment.
Agronomy 13 01506 g002
Figure 3. Positioning of PVC stalks with water-sensitive paper.
Agronomy 13 01506 g003
Figure 4. Wireless DropScope System: (a) water-sensitive paper, (b) wireless scanner, (c) droplet deposition parameters report.
Agronomy 13 01506 g004
Figure 5. Comparison of means of coverage (a), deposition of droplets (b), and density of droplets (c) in upper and lower layers within each height of flight and centrifugal nozzle rotation. Bars with different letters are different from each other, and bars without letters are not different from each other, at a 5% significance level according to Student’s t-test.
Agronomy 13 01506 g005aAgronomy 13 01506 g005b
Figure 6. Coverage by sprayed droplets as a function of centrifugal nozzle rotation and height of flight. Bars with different letters are different from each other, and bars without letters are not different from each other, at a 5% significance level according to Student’s t-test.
Agronomy 13 01506 g006
Figure 7. Deposition of the sprayed solution as a function of centrifugal nozzle rotation and height of flight. Bars with different letters are different from each other, and bars without letters are not different from each other, at a 5% significance level according to Student’s t-test.
Agronomy 13 01506 g007
Figure 8. Density of sprayed droplets as a function of centrifugal nozzle rotation and height of flight. Bars with different letters are different from each other, and bars without letters are not different from each other, at a 5% significance level according to Student’s t-test.
Agronomy 13 01506 g008aAgronomy 13 01506 g008b
Figure 9. Effect of centrifugal nozzle rotations and height of flight on the coverage and density of sprayed droplets.
Agronomy 13 01506 g009
Figure 10. Mean macronutrient (N, P, and K) contents applied by unmanned aerial vehicle compared to the control treatment. * Treatments with significant difference by the Dunnett test at 5% significance level; ns = not significant.
Agronomy 13 01506 g010aAgronomy 13 01506 g010b
Figure 11. Comparative results of macronutrient (N, P, and K) contents. N 15 DAA (a), N 30 DAA (b), P 15 DAA (c), P 30 DAA (d), K 15 DAA (e), K 30 DAA (f). Means of macronutrient contents followed by the same letter are not different from each other by the Scott Knott test at 5% significance level.
Agronomy 13 01506 g011
Table 1. Specifications of the unmanned aerial vehicle (UAV) Joyance JT-10.
Number of rotors6
Flight speed0 to 12 m s−1
Operational speed0 to 8 m s−1
Tank capacity10 L
Endurance time10 to 25 min
Type of spray nozzleCentrifugal
Number of nozzles2
Table 2. Configuration of experimental treatments.
TreatmentCentrifugal Nozzle Rotation (rpm)Operational Height of Flight (m)Flow
(L min−1)
T175002.01.73
T210,0002.01.73
T375004.01.98
T410,0004.01.98
T575006.02.23
T610,0006.02.23
Table 3. Characteristics of the leaf fertilizers applied.
ProductFormulationRateConcentration
01Soluble powder2000 g ha−127% m v−1 K2O
02Water-soluble amino acid complex500 mL ha−12% v v−1 P2O5
03Water-soluble amino acid complex1 L ha−19% v v−1 N
Table 4. Climatic conditions at the time of application.
TreatmentRelative Air Humidity (%)Air Temperature (°C)Wind Speed (m s−1)Wind Direction
T168.0 ± 2.023.8 ± 1.21.0 ± 0.15Northeast
T267.0 ± 1.824.1 ± 1.01.2 ± 0.17Northeast
T367.0 ± 1.823.7 ± 0.80.9 ± 0.12Northeast
T469.0 ± 1.723.6 ± 1.01.0 ± 0.18Northeast
T568.0 ± 1.823.4 ± 0.91.2 ± 0.13Northeast
T668.0 ± 2.023.4 ± 1.11.1 ± 0.12Northeast
Table 5. Results of tests of normality, homogeneity, and ANOVA for the variables of application efficacy.
AnalyzesVariables of Application Efficacy
Droplet CoverageDroplet DepositionDroplet Density
Normality and homogeneity of variances
Asymmetry −0.260.02−0.26
Kurtosis −1.95−1.63−1.90
Shapiro test 0.895 ns0.934 ns0.876 ns
Bartlett test 0.345 ns0.608 ns0.253 ns
ANOVA
Source of variationDFMSp-valueMSp-valueMSp-value
R130.170.088 ns0.0030.603 ns2022.0<0.01 **
FH2213.74<0.01 **0.503<0.001 ***20.608.1<0.01 **
R × FH22.400.623 ns0.0180.064 ns2638.3<0.01 **
CV (%)
R 27.318.213.4
FH 33.420.717.3
R × FH 23.012.219.2
** significant at 1% level, *** significant at 0.1% level, ns non-significant; R = centrifugal nozzle rotation; FH = flight height.
Table 6. Mean coefficients of variation (CVs) of coverage, density, and deposition of droplets of the solution in the sprayed area.
Centrifugal Nozzle Rotation (rpm)
Flight Height (m)750010,000Mean
2.045.4 ± 4.848.6 ± 7.347.0 ± 6.1 b
Coverage4.051.4 ± 5.354.0 ± 5.052.7 ± 5.1 a
6.039.3 ± 5.648.9 ± 4.844.7 ± 5.6 b
Mean45.4 ± 5.26 B50.5 ±5.75 A
FR = 0.03 *; FFH = 0.005 ***; FR×FH = 0.202 ns; CVF = 10.38; W = 0.994 ns; χ2 = 0.445
2.045.2 ± 6.9 bA44.2 ± 6.7 aA44.7 ± 6.8
Density4.038.9 ± 2.8 bB48.7 ± 3.1 aA43.8 ± 3.0
6.055.4 ± 8.2 aA52.7 ± 8.1 aA
Mean46.5 ± 6.048.5 ± 6.0
FR = 0.454 ns; FFH = 0.017 *; FR×FH = 0.017 *; CVF = 9.37; W = 0.884; χ2 = 0.449
2.039.7 ± 3.1 aA37.5 ± 2.1 bA38.6 ± 2.6
Deposition4.028.4 ± 5.1 bB34.5 ± 4.3 bA31.5 ± 4.7
6.032.5 ± 5.6 bB44.3 ± 3.3 aA38.4 ± 4.4
Mean33.5 ± 4.638.8 ± 3.2
FR = 0.006 **; FFH = 0.0041 **; FR×FH = 0.018 *; CVF = 9.37; W = 0.759 ns; χ2 = 0.477 ns
Means followed by same lowercase letter in the columns or uppercase letters in the rows are not different from each other at 5% significance level. FR: p-value of F test for centrifugal nozzle rotation. FFH: p-value of F test for height of flight. FR×FH: p-value of F test for the interaction. W: Shapiro–Wilk test. χ2 = Bartlett test. * Significant at 5% level, ** significant at 1% level, and *** significant at 0.1% level, ns non-significant.
Table 7. Results of normality and homogeneity tests and ANOVA for macronutrients (N, P, and K) contents.
AnalyzesMacronutrient Contents 15 Days after Application
NPK
Normality and homogeneity of variances
Asymmetry −0.51−0.420.59
Kurtosis −0.551.38−0.98
Shapiro test 0.976 ns0.970 ns0.985 ns
Bartlett test 11.87 ns11.82 ns8.92 ns
ANOVA
Source of variationDFMSp-valueMSp-valueMSp-value
Treatments (T)57.85<0.01 **0.199<0.01 *14.96<0.01 **
T × control169.63<0.01 **0.873<0.01 **26.52<0.01 **
Error300.331<0.01 **0.002<0.01 **0.284<0.01 **
CV (%) 3.764.235.24
AnalyzesMacronutrient contents 30 days after application
NPK
Normality and homogeneity of variances
Asymmetry 0.020.440.48
Kurtosis −0.74−1.06−0.93
Shapiro test 0.925 *0.982 ns0.967 ns
Bartlett test 19.066 *10.607 ns3.102 ns
ANOVA
Source of variationDFMSp-valueMSp-valueMSp-value
Treatments (T)516.34<0.01 **0.124<0.01 *9.840<0.01 **
T × control167.45<0.01 **0.157<0.01 **53.128<0.01 **
Error300.618<0.01 **0.002<0.01 **0<0.01 **
CV (%) 4.863.815.24
* Significant at 5% level, ** significant at 1% level, ns non-significant.
Table 8. Result of increases (%) in macronutrient (N, P, and K) contents in relation to the control treatment.
Increases at 15 Days after ApplicationIncreases at 30 Days after Application
TreatmentsNPKNPK
T141.764.154.342.534.460.6
T233.667.249.336.436.248.0
T333.670.016.234.716.645.1
T435.666.720.127.44.635.6
T518.429.68.711.110.134.5
T619.116.517.114.08.913.9
Mean30.352.427.627.718.539.6
Standard deviation9.523.119.212.713.615.8
Disclaimer/Publisher’s Note: The statements, opinions and data contained in all publications are solely those of the individual author(s) and contributor(s) and not of MDPI and/or the editor(s). MDPI and/or the editor(s) disclaim responsibility for any injury to people or property resulting from any ideas, methods, instructions or products referred to in the content.