Article

Finding Phenotypic Biomarkers for Drought Tolerance in Solanum tuberosum

by
Karin I. Köhl
1,*,
Gedif Mulugeta Aneley
1 and
Manuela Haas
1,2
1
Max Planck-Institute of Molecular Plant Physiology, Am Mühlenberg 1, 14476 Potsdam OT Golm, Germany
2
Ministry for Agriculture, Environment and Climate Protection of the State Brandenburg, Henning-von-Trechkow-Straße 2-13, 14467 Potsdam, Germany
*
Author to whom correspondence should be addressed.
Agronomy 2023, 13(6), 1457; https://doi.org/10.3390/agronomy13061457
Submission received: 24 April 2023 / Revised: 15 May 2023 / Accepted: 17 May 2023 / Published: 25 May 2023

Abstract

:
Climate change models predict increased drought frequencies. Maintaining yield stability necessitates drought-tolerant crops. However, their breeding is challenging; drought tolerance is a multigene trait with significant environment interaction. Thus, the training of genomic selection models requires phenotyping a large genotype population under arid conditions. We aimed to identify phenotypic tolerance traits that facilitate the screening of large populations in the field. We performed three trials on 20 tetraploid Solanum tuberosum ssp. tuberosum genotypes with significant drought tolerance variation. Plants were subjected to early, late and long-term drought under variable climate conditions. For each stress scenario, the drought tolerance index DRYMp was calculated from the relative tuber starch yield. A laser scanner system measured canopy development continuously over the crop’s lifecycle and provided estimates of leaf movement and canopy growth features. Growth curves were evaluated by logistic regression. Different multiple regression approaches were compared for their ability to predict tolerance from phenotype data of optimally watered or stressed plants. We established that early short-term stress can be used as a proxy for long-term stress in the absence of genetic variation for drought stress recovery or memory. The gen-otypes varied significantly in most canopy features. Leaf-area-based features combined significant genotype effects with environmental stability. Multiple regression models based on single-day data outperformed those based on the regression curve parameter. The models included leaf area and leaf position parameters and partially reproduced prior findings on siblings in a genetically more diverse population.

1. Introduction

Climate change models predict an increased likelihood of extreme weather conditions, including prolonged drought periods and higher air temperatures [1,2]. Thus, reduced water supply will meet increased demand as a result of higher evapotranspiration. In addition, drought enhances the adverse effect of heat, as the cooling effect of water evaporation dwindles, when soil surfaces are dry and plants reduce transpiration. As a consequence, crop yields will decline more frequently as a result of drought or drought plus heat [3]. Drought and heat effects can be mitigated by irrigation. However, water availability for irrigation will decrease in many parts of the world, including regions of the US, China, and West, South, and Central Asia [4]. Altered precipitation patterns, increased evapotranspiration, and land-use change also reduce the refilling of ground water reserves [5]. In addition, agriculture competes with industry and a growing domestic demand for declining water reserves [6]. A solution is to breed drought-tolerant crop varieties that maintain yield at reduced water supply.
Drought tolerance is a challenging trait to breed for; it is controlled by many genes and is highly dependent on the drought pattern in the target environment and the management practices employed by the farmers [7,8]. Yield-based selection in arid environments has produced varieties with high yield stability, but the process took decades [9]. Marker-assisted selection could speed up the process. However, the development of genomic selection models for polygenic traits is challenging, as it requires drought tolerance data for a large genotype population. While costs of genotyping have decreased substantially in the last two decades, the phenotyping aspect of marker development remains a bottleneck [10,11]. Typically, the tolerance measurement is conducted by yield determination in multisite/multiyear trials in the target environment. This is logistically challenging and very labor-intensive due to the relatively high number of replicates required to obtain a stable tolerance estimate [12,13].
It has been suggested to replace yield determination in agro-environments by the measurement of secondary traits in controlled environments. However, these proxy methods suffer from a low correlation between the tolerance ranking obtained in controlled environments with the performance in agro-environments [1,13,14,15]. Secondary traits can be used to obtain a tolerance classification, if they are highly heritable and genetically correlated with yield [16,17]. Canopy development parameters, the stay-green trait, and canopy temperature depression are associated with yield and drought tolerance in crops such as maize, wheat, rice and potato [16,17,18,19,20,21,22]. The third prerequisite for a good secondary trait is being ‘easy to measure’ [16,17]. With the advancement of phenotyping technologies, ‘easy to measure’ translates to measurable automatically by remote sensing [23]. Sensors that take hyperspectral images or detect selected wavelength signals are mounted on phenotyping platforms, on unmanned aerial vehicles (UAV), or even on satellites [15,24]. Infrared and microwave sensors on satellites provide data for the assessment of vegetation cover and standardized vegetation index for drought prediction [25,26]. In spite of improved spatial resolution, the correlation between remotely measured vegetation indices and yield remains weak [26,27]. Thus, close-range measurements are still on the agenda for the development of phenotyping techniques, to gain ground-truth data for satellite monitoring, and as stand-alone techniques in decision support systems, for precision agriculture and for the phenotyping of breeding material [27,28]. Multispectral cameras on UAV were employed to monitor rust in turf grass or wheat [29,30]. The crop nitrogen content is assessed on the basis of vegetation indices that are related to the canopy cover and to the pigment or chlorophyll content; the respective information is derived from hyperspectral or RGB images. A sensor that combines measurements of vegetation cover and canopy nitrogen content has been commercialized in decision support systems for precision farming [31].
While nitrogen deficiency and many fungal diseases cause a change in canopy color, only severe drought stress causes leaf yellowing or necrosis. This stress range, in which survival rather than yield is at stake, is beyond the range for irrigation management, which has to prevent the crop from entering this stage. For breeders, the crop’s response to yield-reducing rather than lethal stress is in focus [32]. The drought monitoring tools for irrigation management have used vegetation indices and canopy temperature measurements [28]. However, the relationship between canopy temperature and established drought indicators such as plant water potential, stomatal aperture, and water content strongly depends on leaf age, crop maturity, and plant genotype [28]. Timing of the measurement in the diurnal cycle is critical for the measurement of vegetation indices and canopy temperature depression [33,34]. Furthermore, growth stage obviously impacts the measurement as it affects the degree of ground cover, the self-shading of the plant and the intermingling of adjacent plants. In addition, the weather conditions affect canopy reflectance, leaf position, and stomatal aperture. This is a problem especially for UAV measurements. In contrast to satellite data or data from phenotyping platforms, which produce time series, UAV-based measurements are restricted to a small number of data collection events. Thus, getting the timing right is pivotal when moving from continuous measurements on phenotyping platforms to applications in breeders’ fields.
This manuscript focuses on phenotypic biomarkers for drought tolerance in potato. Potato is an important food crop for subsistence farmers on marginal land, as well as a stable crop for agroindustry [35]. Potato has a high water productivity, but low drought stress tolerance [18]. Breeding drought-tolerant potatoes is, thus, important to maintain both food security for smallholders and economic perspectives in the agroindustry. Gen-otyping data and genomic selection models for potato are increasingly available [36,37,38]. The bottleneck is the phenotyping of the training population, as phenotyping for drought tolerance is laboriously conducted by yield measurements in field trials under optimal and restricted water supply [18,35,39,40]. There are also attempts to find secondary traits for drought tolerance in potato. Field phenotyping of morphological features in a highly variable potato population found an association between stolone and stolone root numbers and drought tolerance [41]. Khan et al. [42] modeled the canopy cover dynamics in a population segregating for maturity and found strong positive correlations among the duration of maximum canopy cover, the area under the growth curve A(sum), and the maximum canopy cover [42]. However, the correlation between A(sum) and radiation-use efficiency of tuber dry matter was negative, suggesting that there is a sweet spot in the relationship between drought tolerance and canopy development [43].
In a previous study, we analyzed the relationship between canopy feature dynamics and drought tolerance in a population of siblings that segregated for drought tolerance [21,44]. Canopy growth was analyzed by laser scanner measurement of plant height (PH), total leaf area (A3), and projected leaf area (A2) in long-term drought tolerance trials under variable climate conditions. Growth curves were analyzed by logistic regression on right-censored data. We found that tolerant genotypes increased leaf area for longer and achieved a higher maximum of A2 than sensitive genotypes. Additionally, tolerant genotypes had a lower maximum of plant height than sensitive genotypes and maintained the leaf movement pattern typical for optimally watered plants under stress [21]. These features were derived from time-series analysis on a genetically uniform population. Before we can employ the system to select for drought tolerance in breeding populations under field conditions, we like to address the below questions.
First, to be applicable in plant breeding, we have to find out whether the prediction model works for a population that is genetically different from the training population. To answer this question, we repeated the phenotyping with a population that contained six genotypes from a different gene pool in addition to the 14 genotypes from the first population. The second question was whether we can replace long-term drought stress trials by short-term drought stress experiments to save time. Third, we wanted to know whether additional phenotypic features such as leaf area index or light penetration depth provide a better prediction than the restricted set of features employed in the first study. The final question was whether we really need continuous measurements and a subsequent growth curve fitting to predict tolerance or whether measurements on single days—ideally early in development—would also provide a good tolerance estimate.

2. Materials and Methods

2.1. Potato Drought Trials

The drought stress trials on 20 Solanum tuberosum ssp. tuberosum (L.) genotypes were performed in 2017, 2018, and 2019 (Supplementary Table S1) under naturally variable climate conditions in a polytunnel screenhouse (52°23′55″ N, 13°3′56″ E). We used a previously established system [13]: chitted tubers were planted in 30 L bags filled with peat substrate and fertilized with 30 g Novatec classic per bag. The experimental design was a randomized block design with the treatments as blocks. The number of replicate plants per genotype and treatment was eight (2017 and 2018) or six (2019), with one tuber per replicate bag. The spatial design is shown in Supplementary Figure S1. Climate data (air temperature, humidity, and photosynthetically available radiation) were measure adjacent to the experiment as described in [44] and are available at e!DAL [45].
Drought stress was applied by reducing the volume of the irrigation water to 50% of the volume given to the optimally irrigated control. The reduction was achieved by increasing the time between irrigations rather than by reducing the volume at an irrigation event. The cumulative irrigation volume is displayed in Figure 1A. Thus, the drought treatment mimics the situation in the field where drought stress results from reduced precipitation, as discussed in [13]. Irrigation was performed with a magnetic valve-controlled drip irrigation system [21]. For the long-term drought stress treatment, named ‘ss’, plants were subjected to reduced watering from BBCH15 (Treatd1, Table S1) to harvest. At flowering time (Treatd3), long-term drought stress plants received an additional irrigation to increase the soil water content transiently to approximately 50% of field capacity. For early drought stress, named ‘sc’, watering was reduced from BBCH15 (Treatd2 = Treatd1) to flowering (Treatd3). For late drought stress, named ‘cs’, irrigation was reduced to 50% of control irrigation from flowering (Treatd3) to harvest. Soil water content and soil temperature were measured with Plantcare soil sensors (Plantcare, Russikon, Switzerland) in 32 pots (eight per treatment) every 60 min. The cumulative thermal sum was calculated as described in [13,44]. At a cumulative thermal sum of approximately 1400 °C·day, when control plants reached a BBCH of >89, the haulm was removed, and the tubers were harvested manually. Tuber number, size grading (diameter: S < 35 mm, M 35–60 mm, L > 60 mm), weight, and starch content were measured as described in [13].
The population of 20 potato genotypes (Supplementary Table S2) comprised 10 sibling lines selected from two crosses between one drought-tolerant and two drought-sensitive starch potato cultivars (details in [44] and Supplementary Figure S1 in [13]). The population furthermore contained the three parent cultivars, the check cultivar Desirée, and six additional cultivars from a panel of potato cultivars that had been previously characterized for drought tolerance in field trials [40]. These cultivars were selected for a contrasting response to early and late drought stress based on the previously published data [40].

2.2. Evaluation of Yield Data

Data evaluation was performed in SAS 9.4 (SAS institute, Cary, NC, USA). Starch yield SY was calculated for each plant as a product of tuber yield TY and tuber starch content. Relative SY was calculated as SY divided by the cultivar’s mean starch yield under optimal water supply in the given experiment. The drought tolerance index DRYMp was calculated for all three drought treatments (cs, sc, and ss) as the relative starch yield of a plant minus the median relative starch yield of the parent cultivars in the respective experiment and treatment [44]. DRYMp is positive for tolerant, but negative for drought-sensitive genotypes. The water-use efficiency of TY (WUE_TY) and SY (WUE_TY) of a plant is equal to the TY or SY of the plant divided by the volume of irrigation water received by the plant.
An analysis of variance (ANOVA) (Proc Glm, SS3) tested the effects of genotype, treatment, their interaction, and the year of the experiment on TY, starch content, SY, WUE_TY, WUE_SY, tuber number in the three fractions, and DRYMp. A comparison of the means was performed using the Ryan–Einot–Gabriel–Welch (REGW) test, which corrects for multiple testing (α = 0.05).

2.3. Phenotyping

2.3.1. Measurements and Quality Control

Shoot development was phenotyped with two IR laser scanners (PlantEye Model F400, Phenospex, Heerlen, The Netherlands) mounted on an automobile Fieldscan (Phenospex) system. The Fieldscan moved the PlantEyes with a speed of 35 mm/s over the plant canopy every 4 h, thus yielding six images per plant and day. Details on the measurement period for each experiment are provided in Supplementary Tables S1 and S3. From the images, the Hortcontrol software estimated the features plant height (PH), total leaf area (A3), projected leaf area (A2), leaf area index (LAI), digital biomass (DB), leaf inclination (LI), leaf angle (LA), and light penetration depth (LPD) for each plant and each timepoint. Image data were linked to plant metadata based on the spatial design information uploaded to Hortcontrol. In the metadata, the unique identifier of the plant cultivation database was entered to link to the genetic and treatment information [46]. For quality control, we downloaded the data as csv files, uploaded them to SAS, and joined the phenotype data with the treatment and pedigree information. The combined data of identifier, pedigree ID, treatment, and extracted feature are available at e!DAL [45]. Plant age (dfp_days) at a measurement was calculated as the difference between the date of the measurement timestamp and the tuber planting date. All features were plotted against the measurement time to define the time window for valid measurements [21], identify criteria for the outliers exclusion, and detect the time ranges, in which data were missing for treatment subsets. The exclusion criteria are listed in Supplementary Table S3. After quality control, median values (md) of all features were calculated for each plant and day. The effects of genotype, treatment interval, treatment, age, and their interaction were tested by analysis of variance (ANOVA) with Proc Glm, method SS3. Differences in means were tested using the REGW test. Genotypic medians (mdg) were calculated for each day and treatment on the basis of the median values of the individual plants of a genotype in a given treatment. In addition, we calculated genotypic median values of leaf angle, leaf inclination, and light penetration depth within six time intervals of the diurnal cycle [21]. Interval 2DW spanned the time of sunrise, while interval 5DK spanned the time of sunset. Interval 1DW and 6EN contained the last and first halves of the night, while 3AM and 4PM were day intervals before and after midday. The effects of age, diurnal interval, ge-notype, treatment interval, and their interaction on the genotypic median of LI, LA, and LPD was tested using Proc Glm; a comparison of the means was performed using the REGW test (α = 0.05).

2.3.2. Nonlinear Regression

We tested several approaches to model the growth curves of the features PH, DB, A2, A3, and LAI, which show a saturation curve-like relationship with plant age. The challenge is that, for short-term stress treatments, different growth responses are expected in the two different time intervals. Separate linear regression within each interval yielded large deviation from the predicted value at the beginning and end of each interval. Therefore, we modeled the growth curves over both intervals by nonlinear regression. We compared two methods, Gompertz function [47] and logistic regression [48]:
m d x = max X × e ( t m X × e d f p d a y s × k X ,
m d X = max X / ( 1 + e k X × d f p d a y s t m X ,
where X is feature X, max is the maximum value (upper asymptote), k is the initial slope, and tm is the turning point of the curve.
The values of max and tm that were predicted using the Gompertz model for the dataset from the 2017 experiment deviated considerably from the expected values gained from visual inspection of the curves. We, therefore, decided to continue using the established logistic regression approach. Logistic curves were separately fitted for the age effect on the daily median of each feature for each plant. We separately tested the effect of ge-notype and treatment of the three curve parameters for each feature and each experiment. We visualized the treatment effect on the growth curve of X (X = PH, A2, A3, DB, and LAI) by calculating the feature Xmod for each day on the basis of the median growth curve parameters for each treatment.

2.3.3. Correlation Analysis

For the correlation analysis on growth curve parameters, we calculated the genotypic median (mdg) of the parameters P = k, tm, and max for each plantline G, treatment E, and year Y from the values gained for the r replicate plants of each treatment. Thus, for each treatment and year, we obtained i = 20 values for k, tm, and max for
m d g P G i E j Y k = m e d i a n P n = 1   t o   r G i E i Y k .
For the correlation analysis on leaf movement features, we calculated the genotypic median of LA, LI, and LPD in the six diurnal intervals separately for each treatment interval (mmd) and each experiment. Thus, for each treatment, year, and diurnal interval, we obtained 20 median values, one for each genotype. The median rather than the mean was chosen as it is less affected by outliers. Subsequently, we calculated the Spearman correlation between these parameters and the genotypic median of DRYMp for all three stress scenarios and starch yield SY for all treatment and all three experiments. The resulting dataset was filtered for those entries, in which at least one of the seven correlations with either DRYMp or SY was significant (α = 0.05).

2.3.4. Multiple Regression Analysis

We tested two multiple regression approaches to predict tolerance to the three stress scenarios from phenotypic data. In both models, the median drought tolerance DRYMp was calculated for each stress scenario as a function of the starch yield data from all three experiments. For the modeling, we calculated the genotypic median of each phenotypic feature and each day, as well as the genotypic median of the nonlinear regression para-meters for each experiment and treatment. Tolerance, yield, and phenotyping data were z-transformed prior to the regression analysis.
In the first ‘fixed’ approach, we performed the variable selection using Proc Glmselect on the genotypic median of the regression parameters of the nonlinear regression (k, tm, and max) of A3, A2, LAI, PH, and DB plus the daily median for each genotype, treatment, and experiment for all phenotyping features on three selected days of each experiment. These days were selected on the basis of the plant phenology and the treatment intervals: d = 1 is 7 days after the start date of interval 2, d = 2 is two days before the start date of interval 3, and d = 3 is 12 days after the start date of interval 3. We performed a stepwise regression analysis using Proc Glmselect, with the predicted residual sum of squares (PRESS) as the stop criterion to select a subset of variables on the basis of a significance threshold of 0.15 (Supplementary Figures S6 and S7). The identified subset was then used in Proc Reg to perform a stepwise variable selection and calculate the regression weights for the prediction of the drought tolerance parameter DRYMp. For each of the three stress scenarios (ss, sc, and cs), we calculated two models. The modeling performed for features measured under the same stress as the tolerance determination yielded three ‘fixed models for stress phenotype’ for each experiment. The modeling performed on features measured under optimal water supply yielded three ‘fixed models for control phenotype’ for each experiment.
In the second, ‘random’ approach, the variable selection using Proc Glmselect was performed on all daily median features between the start day of the first drought stress interval and day 59. The variables selected by Proc Glmsselect were then used to determine the weights by Proc Reg as described for the fixed model. This approach was performed for phenotypic features measured under the same stress as the tolerance assessment and for phenotypic features measured under control conditions. This resulted again in a total of six models, two for each stress, for each experiment.

3. Results

3.1. Tolerance to Different Drought Scenarios

Drought stress was applied as long-term drought stress, named ss, from the early vegetative phase to harvest, early drought stress, named sc, from the early vegetative phase to flowering (interval 2), and late drought stress, named cs, from flowering to harvest (interval 3). During the stress treatment, plants frequently showed signs of wilting already a few hours after sunrise, while control plants received additional irrigation as soon as they showed signs of reduced turgor in the afternoon. During the stress treatment, the irrigation was performed with half the frequency (every second irrigation) compared to the optimal water supply (Figure 1A). In 2017, the late stress treatment was not different from the long-term drought stress treatment because of the very low water evaporation during interval 2. In the other years, plants from treatment cs received a higher volume of water during interval 2 than those from treatment sc and ss. The total irrigation water volume was higher in treatment sc than in treatment cs. Soil water contents (Figure 1B) in interval 2 were higher in cc and cs than in sc and ss. In interval 3, treatment cc and sc had similar soil water contents, while water contents were lower in cs and ss. This indicated that the irrigation pattern resulted in the intended change in soil water status.
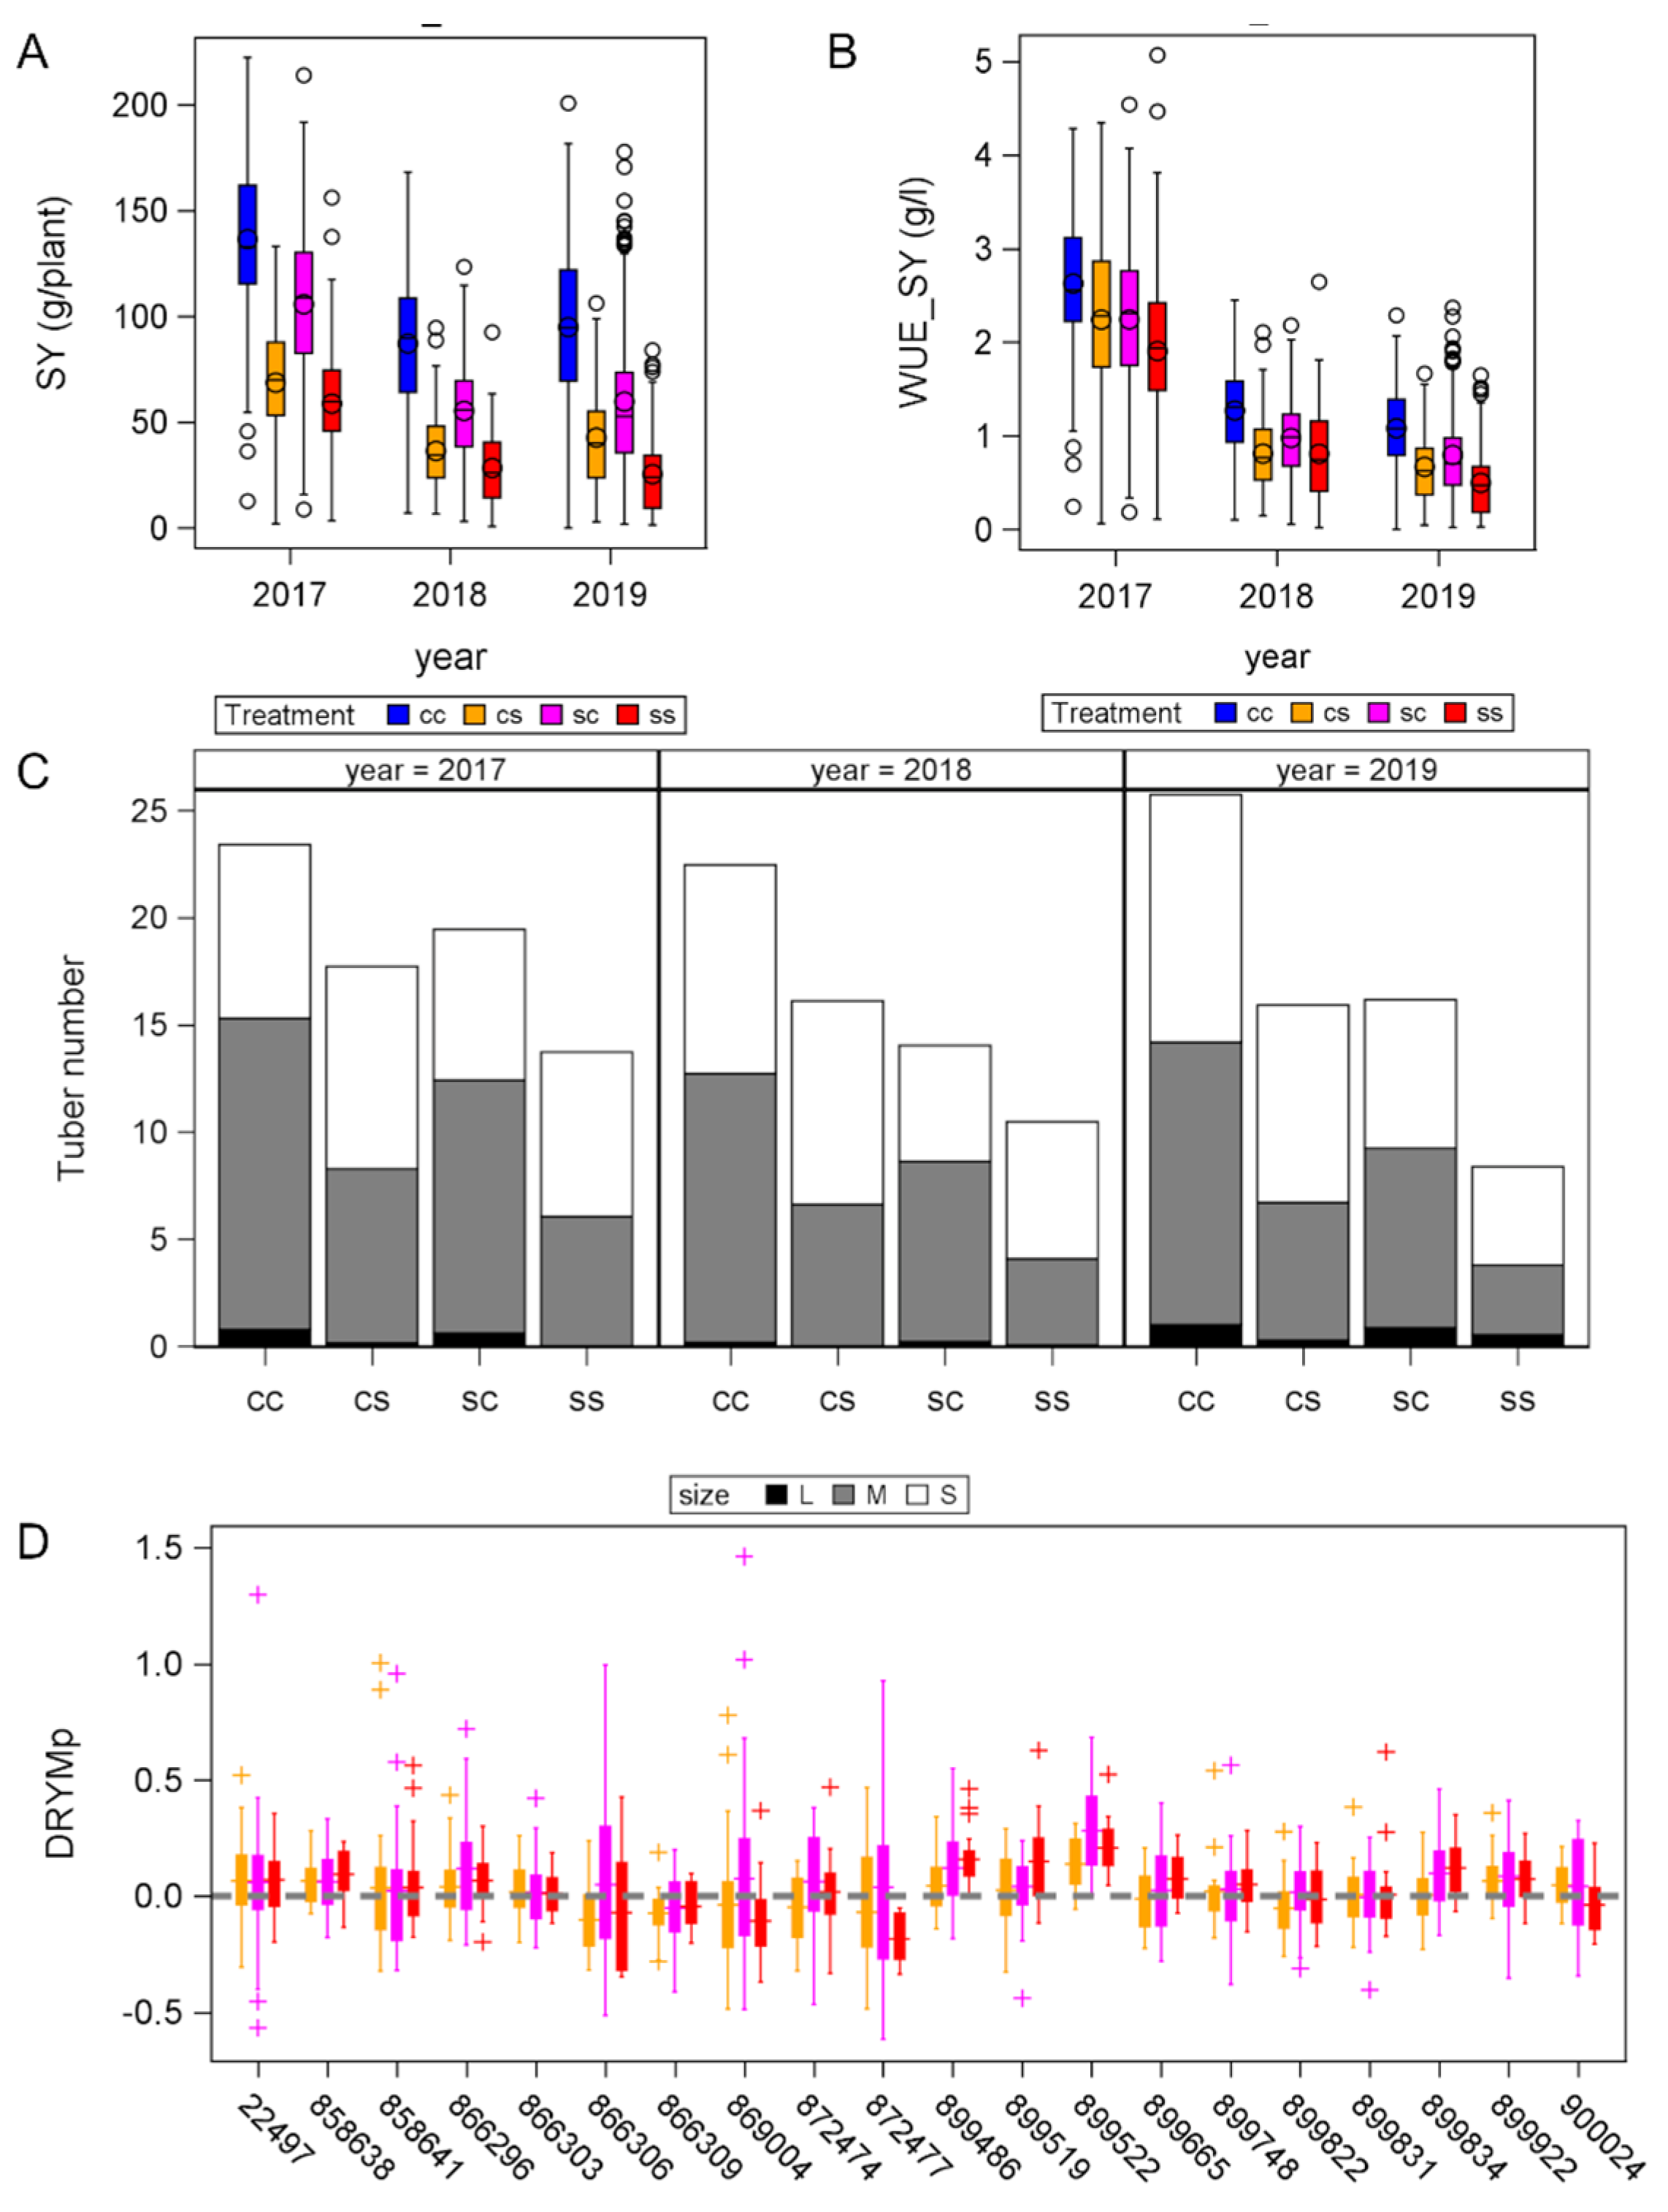
The fundamental prerequisite for identifying a biomarker for drought tolerance is genetic variation in drought tolerance within the training population in the experimental setup. This means that we have to test whether there is a significant effect of the treatment and a significant treatment × genotype interaction on the target trait starch yield. In the three experiments, the irrigation treatment indeed significantly affected tuber fresh weight (TY), starch content, and starch yield (SY) (Table 1, Figure 2A, and Supplementary Figure S2A,C).
In all three experiments, well-watered control (cc) plants had the highest tuber fresh weight, starch content, and SY. Plants on long-term drought stress consistently produced the lowest SY. Early-stress plants produced higher SY than late-stress plants. The difference in SY between ss and cc resulted predominantly from differences in tuber mass, while starch content was less affected by long-term drought stress (Supplementary Figure S2A,C). The effect of short-term drought stress on starch content differed between years. While starch contents were similar in cc, sc, and ss in 2017, starch contents were significantly lower in sc and cs compared to both cc and ss in 2018 (Figure S2C). As the treatment contrast on irrigation volumes was different in the three experiments (Figure 1A), we calculated the tuber yield and starch yield per volume irrigation water as the water-use efficiency of tuber yield WUE_TY (Supplementary Figure S2B) and water-use efficiency of starch yield WUE_SY (Figure 2B). The effect of the year on these two parameters was even higher than the effect of the year on TY and SY (Table 1).
In 2017, WUE_SY was about twice as high as in 2018 and in 2019. WUE_TY and WUE_SY were significantly affected by the treatment, with highest values in cc and lowest values in ss. The difference between WUE_SY(cs) and WUE_SY(sc) was much smaller than the difference between SY(cs) and SY(sc), suggesting that the difference in water supply explained most of the yield differences. The water supply also significantly affected tuber number and grading (Figure 2C and Table 1). Plants on optimal water supply consistently produced the highest number of tubers, whereas those on ss produced the lowest number. Treatments sc and cs differed predominantly in tuber grading. Plants on sc treatment produced more medium and large tubers, whereas plants on cs produced more small tubers. The difference in total number between cs and sc depended on the year; sc produced more tubers than cs in 2017, but less in 2018.
The potato genotype significantly (p < 0.0001) affected all yield parameters (starch content, TY, SY, and tuber numbers); the interaction between genotype and treatment was weakly significant (p < 0.05) (Table 1). To estimate the genotypic differences in drought tolerance, we calculated the drought tolerance index DRYMp based on SY separately for each stress pattern. We performed the normalization to the experimental median of relative starch yield median of the check cultivars for each year separately. Subsequently, we calculated the mean DRYMp for all three experiments together, as previous studies revealed a minimum number of three experiments for a reliable tolerance estimates [13]. The tolerance indices are shown for each genotype and each stress treatment in Figure 2D; the ANOVA results are shown in Table 1. The genotype affected the DRYMp significantly. The significantly lowest tolerance was observed in line 866309, and the significantly highest tolerance was observed in lines 899522 and 899486. Both tolerant lines were identified as tolerant in a previous study [44]. Between the extremes, the DRYMp values were evenly distributed, thus providing a sound basis for linear regression analysis of tolerance prediction.

3.2. Phenotyping

Shoot development was monitored continuously over several weeks using a laser scanner system, which produced six surface images for each plant in a dial. Image analysis, thus, yielded information on the diurnal leaf movement and growth curves of the plant features plant height (PH), total (A3) and projected (A2) leaf area, digital biomass (DM), leaf area index (LAI), light penetration depth (LPD), leaf inclination (LI), and leaf angle (LA). Supplementary Figure S3A–H shows the time-course of the different features by depicting the 90th percentile, 10th percentile, and median of the daily median of each feature for each genotype and day, thus illustrating the biological variation for all features over the plant growth period. LI and LA estimate the diurnal leaf movement of potato plants; both features changed during the dial (Supplementary Figures S3I and S4 and Supplementary Table S4). To remove the effect of leaf movement on the growth curve estimates, we used the daily median of all features for each plant for the growth analysis.
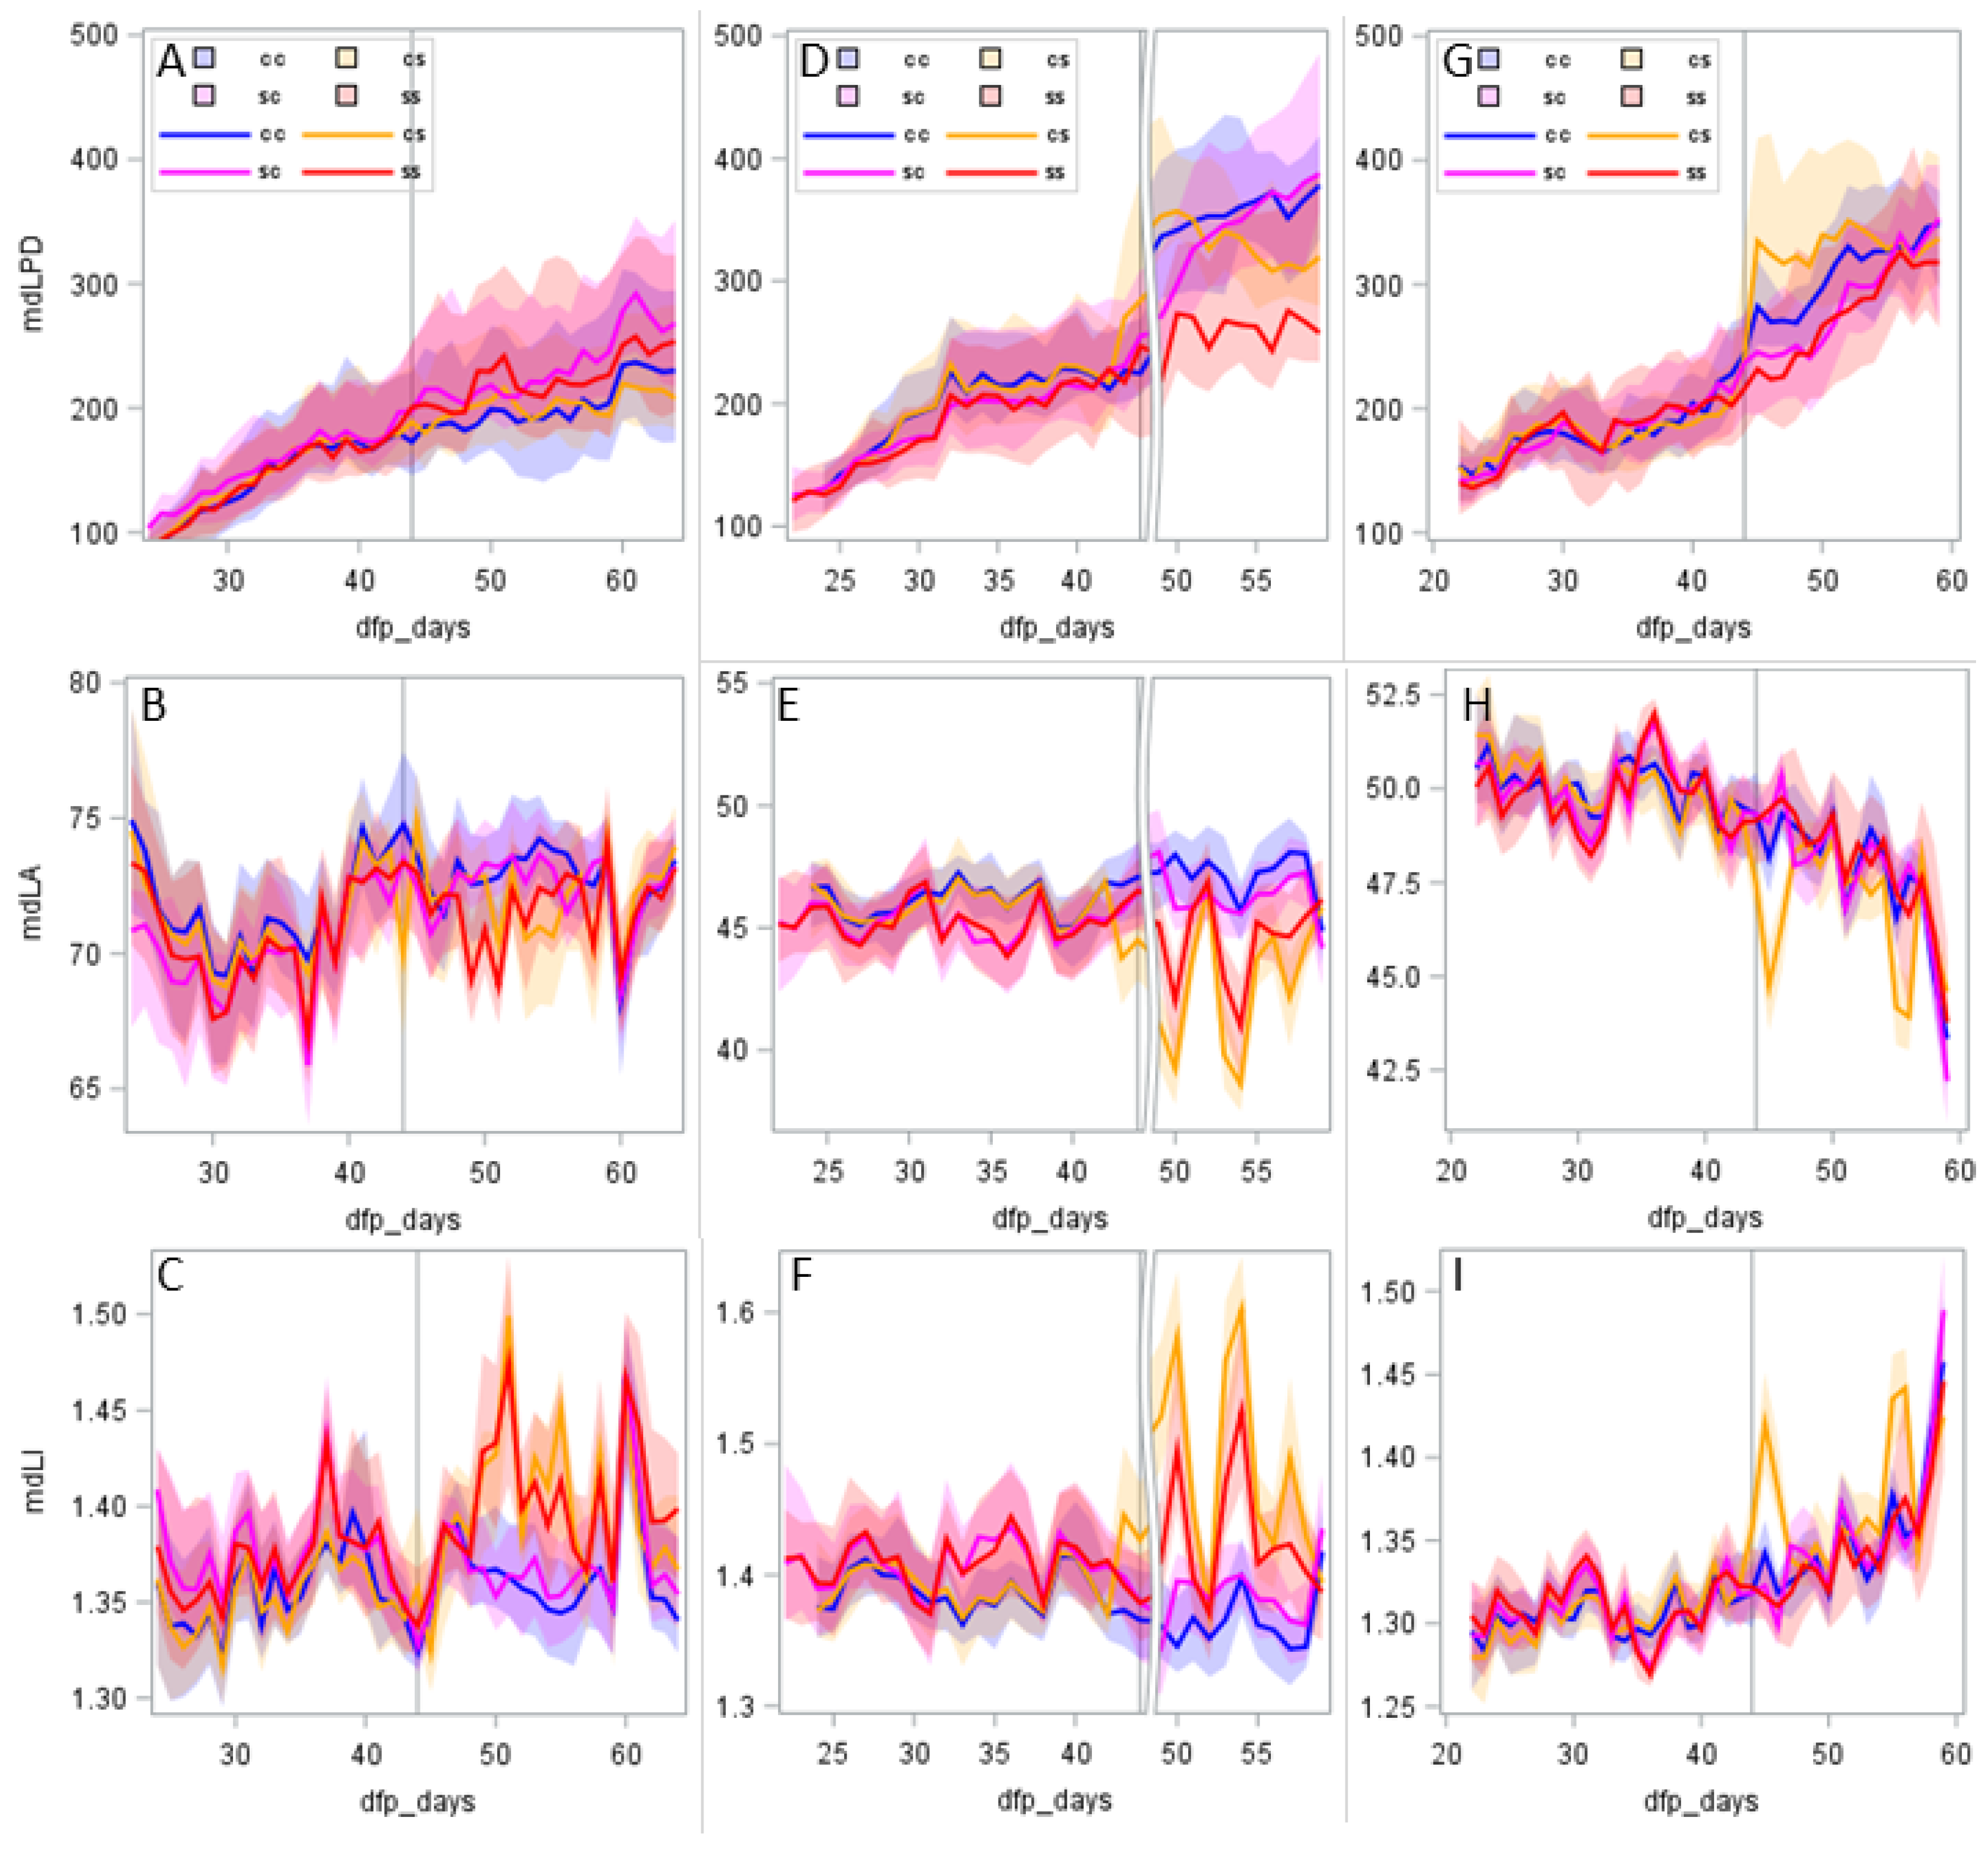
The medians of LI, LA, and LPD changed approximately linearly with plant age (Figure 3). LPD was significantly higher after flowering than before flowering (Figure 3, upper panels) as the canopy opened up due to the lodging of the shoot basis. The effect of the treatment on LPD was small and inconsistent between years. While LPD was higher in ss and sc plants than in cc plants in 2017, cc plants had higher LPD than ss and sc in 2018 and 2019. For LA (Figure 3 middle panel) and LI (Figure 3 lower panel), the difference between the treatment medians was small compared to the day-to-day change, unless the plants were wilting as on day 50 and 54 for cs and ss plants in 2018, and on day 54 for cs plants in 2019. Both LI and LA were significantly affected by the time of the day, as indicated by the significant effect of the diurnal time class (CT) (Supplementary Table S4 and Figure S4). Furthermore, the effect of CT interacted significantly with both the treatment and the treatment interval (Table S4: CT × E and CT × I). Before flowering, leaf angles in intervals 3AM, 4PM, and 5DK were lower in treatment SC and SS than under control conditions (Figure S4). After flowering, leaf angles in these time intervals were much lower in CS plants than in CC plants in all years and in SS plants in 2017 and 2018. Acute stress, thus, affected the leaf position predominantly in the second half of the light period, when the evaporative demand was highest.
The other five features, PH, DB, A2, A3, and LAI, increased to maximum values during the first treatment interval 2 and declined after flowering in interval 3 (Supplementary Figure S3A–E). The median md(PH) was strongly affected by the water supply; md(PH)sc was similar to md(PH)ss in the first treatment interval and approached md(PH)cc in the second interval, when the stress was released for the early stress plants. In contrast, irrigation treatments affected the leaf area parameters (A2, A3, and LAI) only during the first interval. The time courses of the different growth parameters were approximated by logistic regression. For each of these features and each plant, we estimated the parameters initial slope (k), inflection point (tm), and maximum (max) of the logistic regression curve. Figure 4 shows the modeled values PHmod (Figure 4D), A2mod (B), DBmod (C), and LAImod (A), which were calculated from the median values of the estimated values of k, tm, and max for each treatment and for all four features. The modeled curves illustrate how the growth of plant height, leaf area, and digital biomass responded to the treatment. The three drought stress treatments altered the shapes of the growth curves in a similar way in all 3 years (Figure 4A–D). To find out how reproducible the treatment effects were between experiments, we plotted the distribution of the parameters k, tm, and max separately for each year and treatment (Figure 4E–P). The effects of year, treatment, and genotype on the parameters were tested by ANOVA (Table 2). The effect of genotypes indicated whether there was genotypic variance for the feature, which is a prerequisite for it being a marker candidate. The result of the F test for year and treatment tells us, how much the features were affected by the environmental conditions (year) and the water supply (treatment). For example, drought stress affected the growth curve of plant height and digital biomass more than the curves of A2, A3 (not shown), or LAI. Concurrently, the F values for the treatment effects were much higher for the regression parameters of PH and DB than for the parameters of A2, A3, and LAI (Table 2).
Early stress delayed the increase in plant height and digital biomass, as illustrated by the significantly higher turning points tm(PH)sc and tm (DB)sc compared to control plants in 2018 and 2019 (Figure 4L,K). Early stress plants achieved a maximum plant height and a maximum digital biomass comparable to that of the control plants when they were well watered in interval 3 (Figure 4P,O). In contrast, late stress resulted in a significantly earlier turning point of the PH and DB growth curves than under control conditions (Figure 4L,K). In consequence, the max(PH) was significantly lower for late stress than for all other treatments (Figure 4P). Max(DB)cs was similar to max(DB)ss. In contrast, the drought stress affected the growth curves of both leaf area features much less than those of DB and PH. Both the turning point and the maximum value of A2 and A3 were remarkably similar between treatments (Figure 4J and Supplementary Figure S3D,G).
Interestingly, max(A2), max(A3), tm(A2), and tm(A3) had the highest F values for the genotype effect combined with very low G × E and Y × E × G effects (Table 2). Thus, genotypic differences between leaf area parameters were stable over environments. In Figure 4, the length of the box and whiskers indicates the genotypic variability. The genotypic variability for tm(DB) (Figure 4K), max(DB) (Figure 4O), tm(PH) (Figure 4L), and max(PH) (Figure 4P) was higher in the early stress treatment than in the control and long-term stress treatment. In contrast, these parameters showed a low variability in the late-stress treatment.

3.3. Relationship between Phenotype and Tolerance

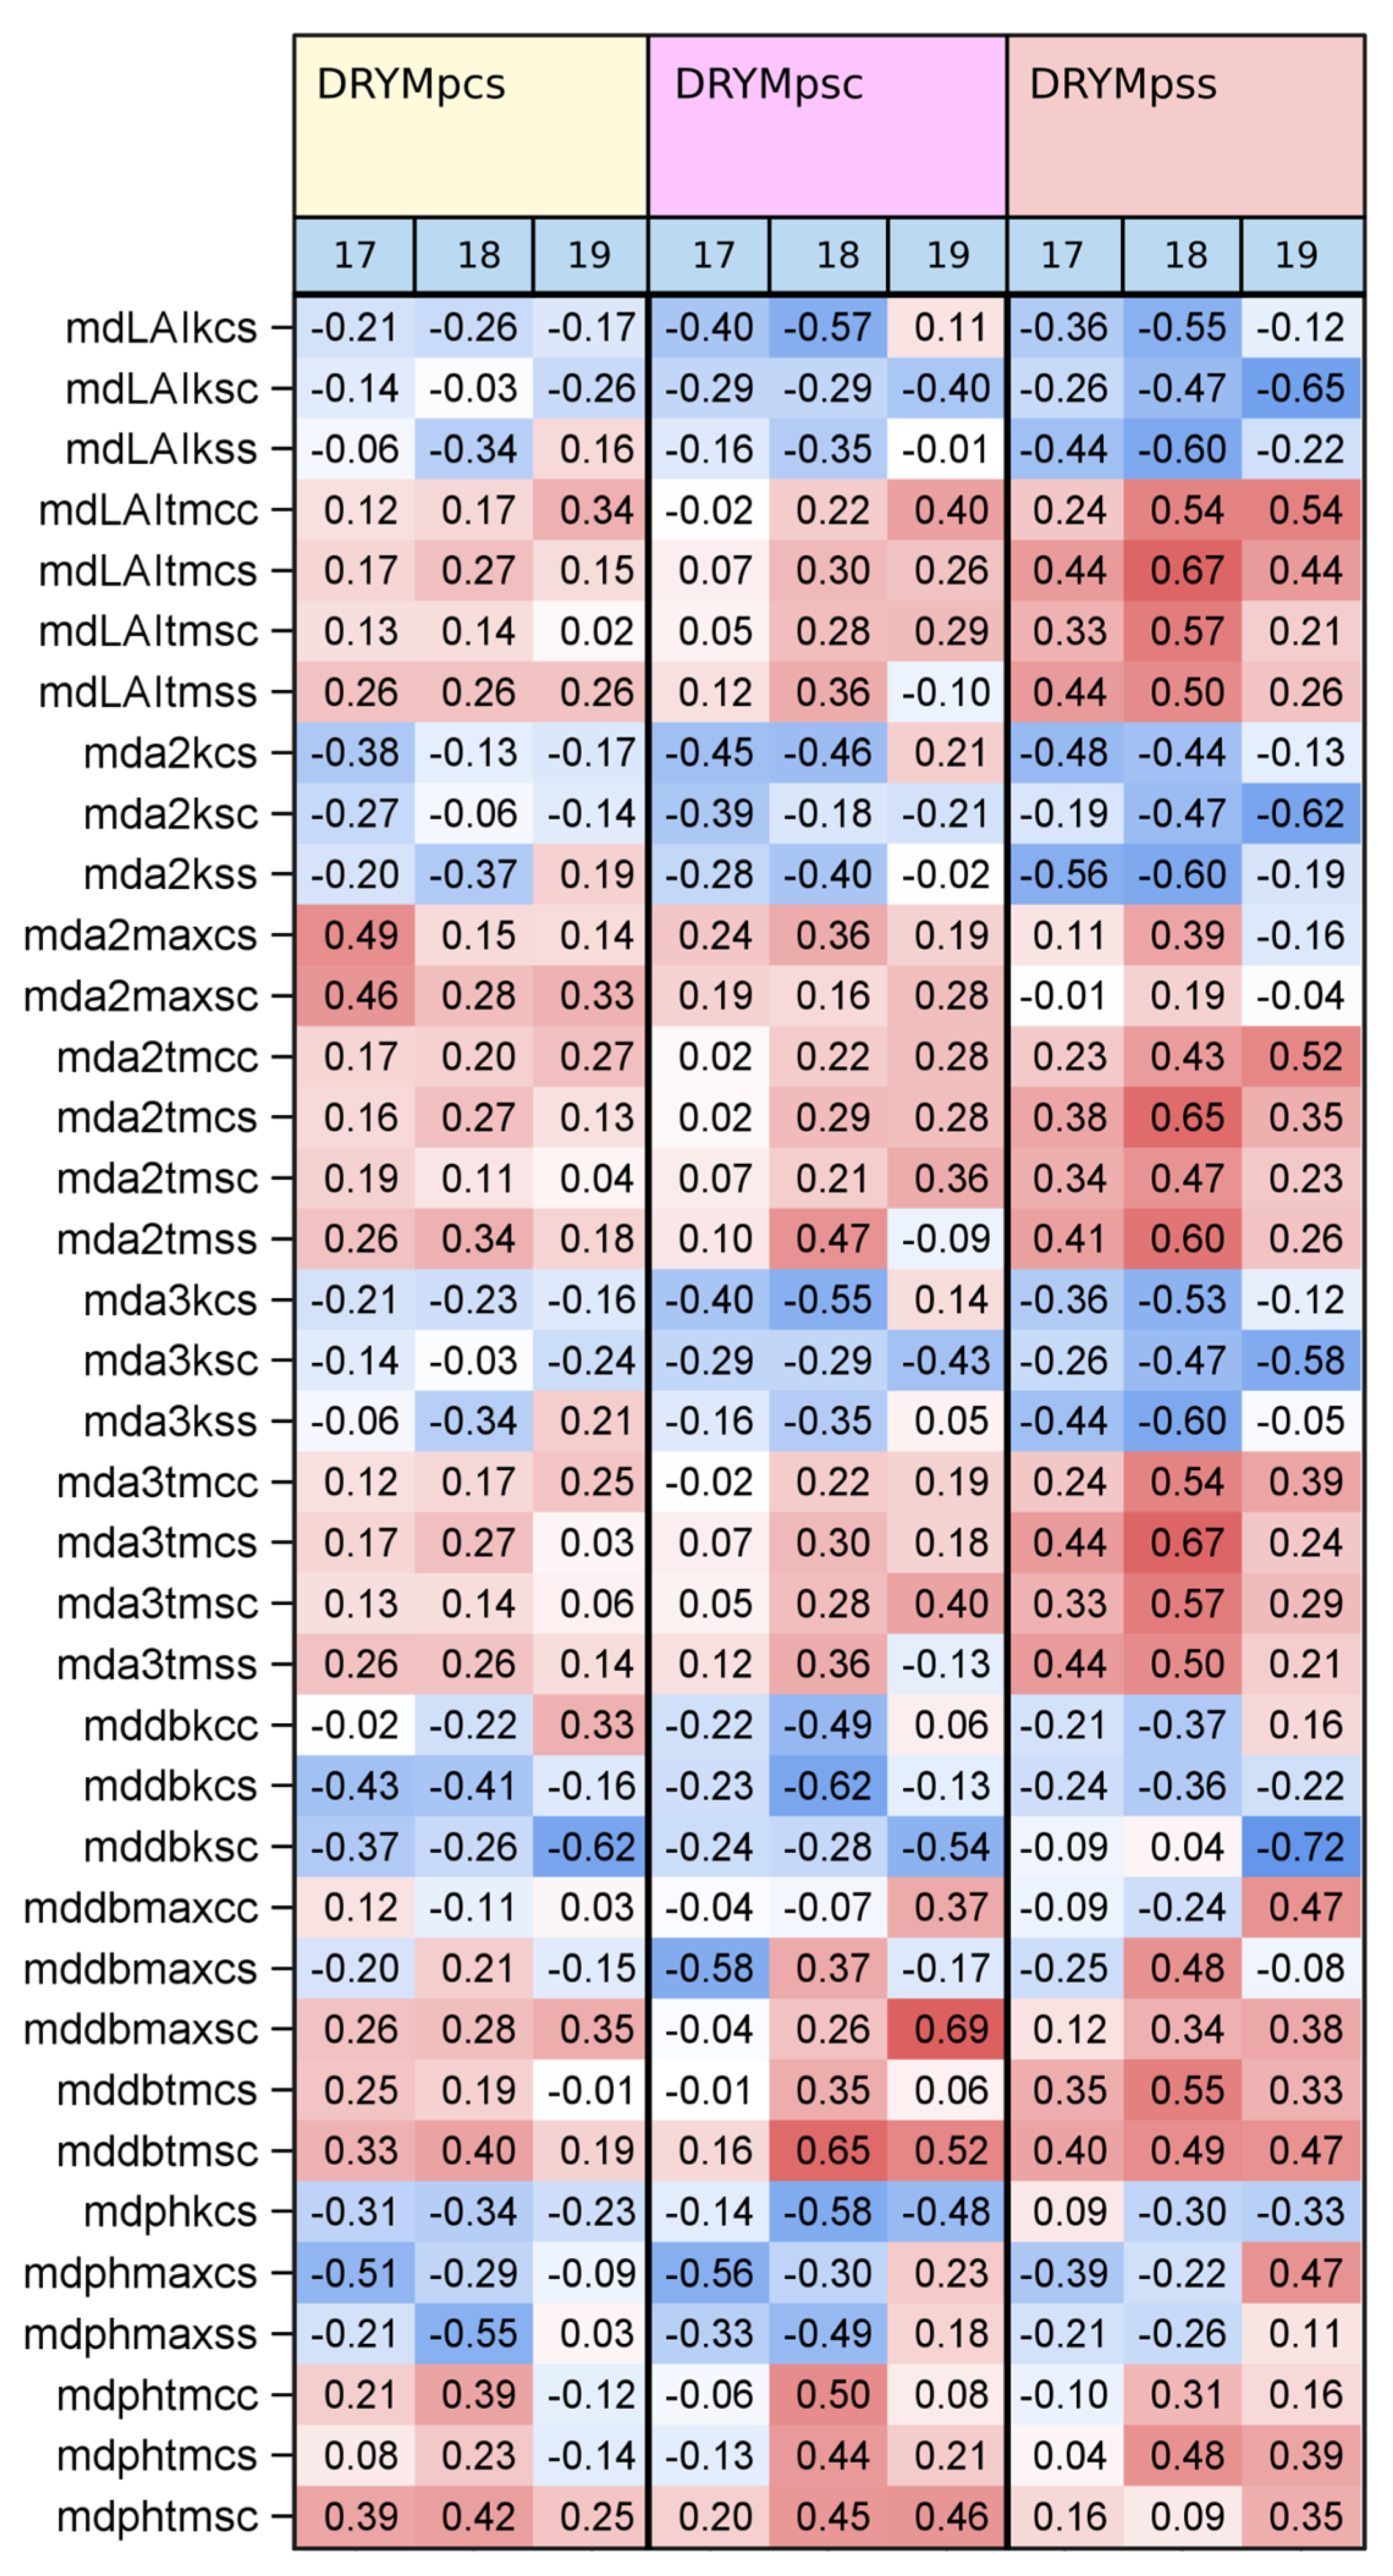
The correlations between phenotypic features and drought tolerance are depicted as heatmaps in Figure 5 for growth parameters and in Supplementary Figure S5 for leaf movement parameters. The drought tolerance indices for each genotype were determined from data of three trials. The phenotypic data were analyzed separately for each year to gain insights into the reproducibility of the correlations.
The correlation analysis between drought tolerance and the growth parameters (Figure 5) was strongly affected by the year in which the measurement was performed. In 2018, more significant correlations were found for tolerance under early stress and long-term stress than in the other two years. The correlations between phenotypic parameters and tolerance to a stress type were only weakly affected by the treatment, in which the phenotypic measurements were performed. However, there were only a few significant correlations between stress tolerance and phenotypic parameters under control conditions. The turning points tm of the growth curves for LAI, A2, A3, and DB were positively correlated with long-term stress tolerance and showed a positive trend with tolerance to early and late stress. This correlation was independent of the condition under which the measurements were performed.
The initial slope of the growth curves for LAI, A2, and A3 correlated negatively with long-term drought tolerance. There were only a few significant correlations with tolerance to late stress; max(LAI) and max(A2) correlated positively with DRYMp(cs). The correlation pattern for early stress resembled the pattern for long-term stress. This means that, if we were to predict tolerance to long-term stress tolerance from short-term stress experiments, we should impose the stress before flowering. Alternatively, this could mean that, in our long-term stress experiments, the decisive phase for the genotypic contrasts in tolerance was before flowering.
The correlations between drought tolerance and leaf movement parameters and light penetration depth (Supplementary Figure S5) were predominantly positive for leaf angle and predominantly negative for leaf inclination. As for growth parameters, the correlations differed considerably between years. Nocturnal leaf inclination (LI(1LN), LI(6EN)) was negatively correlated with drought tolerance even when the phenotyping was performed under control conditions. However, the correlations were stronger when the LI was measured on stressed plant, e.g., in treatment ss and sc in interval 2 before flowering. After flowering, leaf inclination correlated negatively with drought tolerance in all stress treatments in 2017 and 2018. In contrast, the correlations between drought tolerance and leaf inclination were positive for long-term-stressed plants in 2019. This year differed from the two previous experiments by the high number of days with heat stress, which interfered with the drought response of the plants. Significant correlations between stress tolerance and light penetration depth (LPD) were negative and mainly found after flowering. Light penetration depth measured on long-term stress plant correlated negatively with tolerance to early and late stress in 2017 and 2018 and to long-term stress in 2018, while no significant correlations were found in 2019. The environmental conditions, thus, seem to have a strong effect on the relationship between light penetration depth and tolerance. Thus, LPD is less suitable as a tolerance trait. In contrast, the more stable correlation between tolerance and nocturnal leaf inclination rendered the trait a marker candidate.

3.4. Multiple Regression Analysis

In the next step, we embarked on answering the question whether drought tolerance prediction from phenotypic markers can be improved by measuring several features and combining them in multiple regression analysis. In addition, we wanted to know whether we really need a full growth curve or whether measurements on single days may also yield a good prediction. Therefore, we performed two regression approaches, the fixed approach based on growth curve parameters and the random approach based on single-day data (see Section 2.3.4).
In the ‘fixed’ approach, multiple regression analysis was based on the three parameters k, tm, and max of the logistic regressions and on median features that were measured on three fixed days. These fixed days were early (d1) and late (d2) in the first stress interval and in the middle of the second stress interval (d3). The variable selection process and R2 values for the prediction of drought tolerance to the three stress scenarios by this approach are shown in Supplementary Figures S6 and S7.
Figure S6 shows the prediction from phenotypic features measured under stress. The R2 values were higher for the prediction of long-term stress tolerance than of early or late stress tolerance, for which no or only weak models were found in two out of three years. The overlap between the variables selected into the different prediction models between years was poor. The only variables selected in the two models were leaf inclination and leaf angle on d1, which were predictive for DRYMp(ss) and DRYMp(cs) in 2017. LAI at d3 and max(LAI) were selected in the 2019 and the 2017 prediction models for DRYMp(ss).
Supplementary Figure S7 shows the selection process and R2 for the prediction of drought tolerance from the phenotype measured under optimal water supply. The quality of prediction differed between years, being highest for 2017 and lowest for 2019. For short-term stress scenarios (sc and cs), prediction from phenotyping optimally watered plants was better than the prediction from stressed plants. The most frequently selected parameters for tolerance prediction were leaf angle and leaf inclination. In 2017, leaf inclination had a negative weight (on d1) and a positive weight on d2 for all three stress scenarios. Most models also contained leaf angle at d2 and d3. Plant height at d2 was selected with a negative weight in three of the models.
Figure 6 shows the regression weights obtained for the ‘random’ regression models. In the random regression models, drought tolerance was predicted from selected genotypic daily median values of all phenotypic features. The values on the x-axis code the median by the day of measurement dd and the parameter XX as ddXX. The length of the arrow indicates the weight of feature, the direction indicates whether it has a negative or a positive weight, and the symbol indicates the feature. As an example, in Figure 6A, in the 2017 model (black needle), leaf inclination measured on day 25 dfp and day 36 dfp had negative weights, and digital biomass measured on day 50 dfp had a positive weight, resulting in a regression equation of DRYMpss = −0.8 × 25LIss − 0.3 × 36LIss + 0.1 × 50DBss. Table 3 displays the respective R2 values and the number of independent variables included in the full model. To address the question of overfitting, we added the R2 values for a model with ≤4 independent variables. For each of three tolerance indices (DRYMp(i) mit i = ss, sc, and cs) we calculated a regression from parameters measured under the same stress condition i and a model from parameters measured under control conditions, resulting in six models per year.
Figure 6A–C summarize the models for the prediction of drought tolerance from parameters measured under the same stress condition as the tolerance assessment. For example, panel A shows the significant weights of features measured under long-term stress (Feature(ss)) in the regression model that predicts long-term stress tolerance (DRYMp(ss)). In contrast, Figure 6D–F show the significant weights for features measured on optimally watered plants (Feature(cc)). The more crowded x-axis of Figure 6C,F indicates that a much higher number of features were selected into the models that predicted the tolerance to late stress than for the prediction of tolerance to long-term stress or early stress. The models for the prediction of drought tolerance to short-term stress frequently selected more than six features, indicating a risk of overfitting. However, even when the number of parameters was restricted to four, all but two models had acceptable R2 values of ≥0.73.
When we compared at which times the selected features were measured, we noticed that the prediction model for long-term stress tolerance contained more features that were measured before flowering than the models for early or late stress tolerance. The models for long-term drought tolerance repeatedly included leaf inclination under stress and control conditions with a negative weight, while light penetration depth under stress had a positive weight (Figure 6A,D). The models for the prediction of tolerance to early stress contained early leaf inclination under stress and early leaf area under stress with negative weights in 2 years. Leaf area at 29 dfp under control conditions had a positive weight in tolerance prediction. The highest positive weight was found for plant height 52 dfp under stress conditions and 56 dfp under control conditions. The multiple regression models for late stress tolerance repeatedly selected digital biomass under stress with a negative weight. Leaf inclination and plant height under optimal conditions were included with negative weight.
Among the features measured under stress, digital biomass and light penetration depth were most frequently included into the regression models. The models based on features measured under control conditions most frequently contained digital biomass, leaf angle, and leaf inclination.

4. Discussion

4.1. Short-Term Stress Versus Long-Term Stress

In this study, we subjected plants to three types of stress scenarios: long-term stress from early vegetative phase until harvest or short-term stress, either before or after flowering. The first stress phase coincides with the canopy development and the tuber initiation, whereas the second coincides with the tuber filling [20,49]. Accordingly, early stress mainly affected tuber numbers, while late stress mainly affected tuber size (Figure 2C). Late stress reduced tuber starch yield more than early stress. This pattern was previously found in our own field trials [40], which also included several of the genotypes of this study. The two most tolerant lines, 899522 and 899486, were selected from a segregating population into the tolerant subpopulation S1 or S1 and S2, respectively [44]. The present study confirmed their classification as tolerant. The tuber filling phase is deemed to be the phase that is most sensitive to drought, as discussed in [40]. The soil moisture data indicate that, in our experiment, late stress plants suffered lower soil humidity than long-term stress plants in the phase after flowering in experiment 2017 and 2019. The substantial stress during this phase was also discernible in the phenotyping data; the local minima in leaf angle indicated wilting in the time after flowering in year 2018 and 2019. Late stress plants and long-term plants received the same volume of water between flowering and harvest. Late stress plants, however, had a larger shoot (Figure 4C) at flowering than long-term stress plants. They adjusted to decreased water supply by reducing further canopy growth, thus achieving similar max(PH) and max(DB) as long-term stressed plants (Figure 4O,P). The water-use efficiency of late stress starch yield was similar to long-term stress yield. The water supply, thus, seems to have a direct effect on the starch storage, independent of the timing. Altogether, there are no indications that late stress hitting an unprepared plant is more detrimental than long-term stress. Thus, we found no indication that the potato genotypes in this study varied in their stress priming response (see below).
We compared the response of potato to early stress with that to long-term stress to find out whether early stress response is a good proxy for long-term stress response. Studying early stress response avoids the potential interaction with differences in developmental speed when the study population segregates for maturity. The Spearman correlation between median genotype tolerance to long-term stress was similar for early stress tolerance (0.75) and late stress tolerance (0.71). The interaction of treatment and genotype was not significant (p = 0.44), indicating that the tolerance ranking is not affected by the stress pattern. Thus, we conclude that there is no genetic variation for drought recovery in the gene pool of our study population. This contrasts the findings published for maize and peanut [50,51]. The ability to recover from drought events is more important for seedling growth in maize and final yield in peanut then the response during the actual drought treatment. In both species, genetic variability for drought recovery was established. Our data also showed no genetic variability in the memory response of drought tolerance, which would result in higher DRYMp values of a genotype for long-term stress compared to late stress. The stress memory response to low temperature is also known as cold-hardening [52]. Memory has also been postulated for drought stress [53,54]. When potato cultivar Atlantic was exposed either to two stress periods (drought hardening) or to a single, late stress period (contrast), the former variant had higher leaf polyamine and abscisic acid contents and a higher net photosynthesis/transpiration ratio than the latter [55]. The final biomass of the hardening variant was higher, whereas the leaf area was lower than in the contrast plants. Thus, it is not entirely clear if the hardening process is of advantage to the cultivar. In our study, the genotypic variability was higher for DRYMp(sc) than for DRYMp(ss), suggesting an effect of emergence time or early vigor on response to early drought. Nevertheless, early stress treatment is a good proxy for long-term stress treatment. It also allows managing the co-occurrence of drought and heat stress by adjusting the planting date in the polytunnel screenhouse. Early planting increases the likelihood of a combination of early drought stress with low to optimal temperatures. Late planting makes the co-occurrence of drought with high temperatures or heat stress more likely.

4.2. Drought Tolerance Prediction from Phenotypic Traits

Tolerance prediction from secondary phenotypic traits requires genetic variability for the phenotypic marker in the population of interest and a low effect of the environment on the trait [16]. The analysis of variance on the growth curve parameters suggested that the maximum and the turning point of the leaf area and of the leaf area index meet these criteria. The maxima of A2 and LAI were very similar in 2018 and 2019 and much less affected by the water supply than the maxima of PH and DB. The turning points tm(A2) and tm(LAI) were not affected by the treatment. Both turning points were higher in 2017 than in 2018 and 2019. However, when we convert the calendric age into the thermal time (method described in [44]), the tm was at 290 °C·day in 2017, at 340 °C·day in 2018, and at 345 °C·day in 2019. The best time to measure LAI, A2, or A3 would, thus, be just after 350 °C·day, when the contrasts between genotypes should be highest. Shortly after the median tm, the leaf area contrast between genotypes with low and high tm would be highest; genotypes with a low tm would have already slowed down growth, while those with a high tm would have further increased their leaf area.
The correlation analysis found positive correlations predominantly for the turning point of LAI and A2, which correlated with drought tolerance independent of the treatment in which it was determined. This reproduces the finding for a population of 60 potato siblings [21]. In this population, highly tolerant genotypes had a later turning point than sensitive lines [21]. The finding could, thus, be reproduced for a population with additional genotypes that were genetically different from the parents of the segregating population (see genetic similarity tree in [56]). In the earlier study, we also found a significantly positive correlation between maximum leaf area and drought tolerance. Similar correlations were also reported for peanut, where leaf area explained a major portion of genotypic variation in yield under drought stress [50]. However, the correlation between leaf area and drought tolerance was much weaker for the population in this study. Likewise, we could only partially reproduce the negative correlation between maximum plant height and drought tolerance. The main difference between the segregating population and the population of this study is the higher genetic variability of the second population. In addition to the 10 genotypes from the segregating population that were included in both populations, the population studied in 2017 to 2019 also contained six cultivars of varying growth types. Thus, it seems as if the quality of the prediction model decreased when used on a population genetically different from the training population. We observed a similar problem for the metabolite/transcript marker model [44], for which the prediction quality also declined when the population was changed. Barbedo also reported that regression models for the prediction of drought stress from thermal images were affected by the genotype and depended on the conditions under which the measurements were performed [28].
To find out whether stable predictions can be gained from multiple regression models, we compared ‘fixed’ models based on regression parameters to ‘random’ models based on randomly selected parameters measured on single days. Both approaches used the PRESS criterion in the selection method to avoid overfitting (see Section 2.3.4). To our surprise, the random models based on single-day data outperformed the fixed models based on logistic regression parameters. This was especially true for the models based on phenotypic measurements under short-term stress conditions, which failed to fit in two out of three years. Our first hypothesis was that the logistic fit failed to capture the response of the plant to changing water supply. The increase in the growth in sc after rewatering and the transient collapse of the plant after the onset of late stress resulted in marked deviation between the observed and the modeled growth. However, even the fits on the control plants, for which the growth curve was very similar to a logistic curve, failed to deliver reliable estimates for drought tolerance. In contrast, we obtained significant models for the prediction of tolerance to all three stress scenarios in the random approach. This was the case for both data measured on stressed plants and data on control plants. Significant models were even obtained when the number of independent variables was restricted to four to avoid overfitting. The possibility to obtain predictions from data on control plants is good news, as this would remove the necessity to subject the plant to drought. Furthermore, measurements performed on control plants were less affected by wilting and lodging of plants. The main problem, however, was the lack of reproducibility between years. There were distinct features selected in models for different years, such as leaf area under control conditions on day 29 in the early stress model, or leaf angle under control conditions on day 53 in the long-term stress model. Both features are closely related to those features that were selected in the decision tree model published for the segregating population [21]. Furthermore, the models contained many features that were measured before flowering, which would help with a rapid assessment of genotypes by an early stress treatment. However, altogether, the multiple regression models are insufficiently robust to be employed in field screens under variable weather conditions. Barbedo reported a similar lack of robustness in multiple regression models and suggested machine learning methods to obtain more robust solutions [28]. John et al. performed a systematic comparison of linear models to machine learning methods for phenotype prediction from genomic data. They found no superiority of machine learning methods over linear regression with sparsity constraints and Bayes B when analyzing synthetic data [57]. However, they cautioned against an extrapolation to real-world data. Montesinos-Lopez et al. systematically compared different models to predict maize yield from single-wavelength data of hyperspectral images [58]. The found the best prediction by Bayesian and Fourier functional regression models and concluded that there are many challenges for future research. We agree and will look into machine learning methods.

5. Conclusions

Altogether, we found that early stress treatments can be a proxy for long-term stress in drought tolerance screens if there is no genetic variation for stress memory or recovery in the study population. Among the phenotypic features, leaf area growth parameters combined significant genotypic variability with high environmental stability. The previously established relationship between leaf area growth and drought tolerance was reproduced in a distinct population. When comparing multiple regression analyses based on logistic regression parameters (fixed) with those on single-day data (random), the random model outperformed the fixed model.

Supplementary Materials

The following supporting information can be downloaded at https://www.mdpi.com/2073-4395/13/6/1457/s1. Table S1. Experimental design for drought stress trials in bigbags in a poly-tunnel (52°23′55″ N 13°3′56″ E). Trial-Id = Trial-Identifier. Culture Id = experiment reference Id in the plant database [46]. Four treatments per experiment. n = number of replicate plants per treatment. Plantd = date of planting. Treat1 = start of drought stress treatment SS, Treatd2 = start of treatment SC, Treatd3 start of treatment CS, Harvestd = date of haulm destruction. Table S2. Pedigree for lines that were used in phenotyping experiments B2017 to B2019. Plant line reference Id in the MPI-MP plant database [46] (Sample_id), Genotype name of the crossings and cultivar names. Table S3. QC for laser scanner measurements. Measurement period, interruptions (break) due to power outage and QC criteria that lead to the exclusion of observation. Days 30 and 23 were excluded in 2018 as data were collected only for part of the diurnal cycle. Table S4. Result of an ANOVA on the effect of genotype (G), treatment interval (I), the diurnal time interval classtime (CT), treatment (E) and their interaction on leaf angle (LA), leaf inclination (LI) and light penetration depth (LPD). Bold: p < 0.001. Figure S1. Spatial design of the bigbag system that was used for phenotyping potato genotypes. The image shows one of eight subplots that consist of eight columns (left to right) and nine rows. Each column in a subplot is identified by the barcodes at the beginning and end of the column. Each treatment block consisted of two of these subplots. The green arrow indicates the direction, in which the laser scanner is moved. Figure S2. (A) Distribution of tuber fresh weight per plant in 20 potato genotypes cultivated at optimal water supply (cc), late drought (cs), early drought (sc) and long-term drought in experiments 2017, 2018 and 2019. (B) Distribution of water use efficiency of tuber fresh weight yield in 20 potato genotypes cultivated in different water regimes (see A). (C) Distribution of tuber starch content in 20 potato cultivars grown at different water regimes (see A). Result of ANOVA see Table 1. Figure S3. Effect of plant age, treatment and treatment interval on phenotypic features. Distribution of daily genotypic median of (A) leaf area index (mdLAI), (D)projected leaf area (mdA2_E3 = mdA2/103), (G) leaf area (mdA3_E3 = mdA3/103), (B) digital biomass (mdDB_E6 = mdDB/106), (E) plant height (mdPH), (H) light penetration depth (mdLPD), (C) leaf inclination (mdLI) and (F) leaf angle (mdLA) is plotted against plant age (DFP) for the experiment 2019. The left reference line in image A to H indicates the start of the first treatment interval (phase 2), the right reference line the start of the second treatment interval (phase 3). Image (I) shows the diurnal course of the leaf angle distribution for day 31. The line plot indicates the median, the shaded area between percentile10 and percentile90. Figure S4. Distribution of genotypic median of leaf angles in different diurnal time classes (classtime CT). Interval 2 is the first treatment period before flowering, interval 3 the second treatment period after flowering. (A) experiment 2017, (B) experiment 2018, (C) experiment 2019. The box indicates the interquartile range IQR, the whiskers the mean and +/− 1.5 IQR. Figure S5. Correlation between leaf position parameters measured before (left) and after (right) flowering and drought tolerance index for late (DRYMpcs), early (DRYMpsc) and long-term stress (DRYMpss). The tolerance index was determined from all three experiments. The number below the DRYMp value indicates the year, in which the phenotyping was performed. Only those variables are shown, for which at least one correlation was significant. Figure S6. Fixed model prediction of drought tolerance from regression parameters and phenotypes measured on fixed single day. Tolerance and phenotype measured under the same stress scenario. Long-term stress tolerance (A,B,E), early stress (C,F), late stress (D,G). R2 values in section (H). Figure S7. Fixed model prediction of drought tolerance from regression parameters and phenotypes measured on fixed single day. Phenotypes were measured under optimal water supply. Inset legend: First four digits indicate year of phenotyping, decimal number indicates R2. No significant model was found for the prediction of early stress tolerance from 2019 data.

Author Contributions

Conceptualization and project administration, K.I.K.; methodology, K.I.K. and M.H.; investigation, K.I.K., G.M.A. and M.H.; formal analysis and data curation, K.I.K., G.M.A. and M.H.; writing and visualization, K.I.K. All authors have read and agreed to the published version of the manuscript.

Funding

This research was funded by grant 107945 ‘Accelerating the Development of Early-Maturing Agile Potato for Food Security through a Trait Observation and Discovery Network’ of the Federal Ministry for Economic Cooperation and Development and by grant No. 22010913 of the Fachagentur Nachwachsende Rohstoffe (Federal Ministry of Food and Agriculture), Germany and the Gemeinschaft zur Förderung der Privaten Deutschen Pflanzenzüchtung (GFPi). Open Access funding provided by the Max Planck Society.

Data Availability Statement

All data are available at e!DAL: https://doi.ipk-gatersleben.de/DOI/10.5447/ipk/2023/9 (accessed on 22 May 2023).

Acknowledgments

The authors thank D. Zerning, L. Westphal, K. Kotzur, and M. Walenko for skilled technical assistance. The authors thank the breeders of the GFPi for the donation of planting material, and R. Peters, S. Seddig, R. Hofferbert, J. Strahwald, and B. Truberg for many enlightening discussions. The contribution of H. Lindqvist-Kreuze (International Centre for Potato, Peru), who initiated and coordinated the project ‘Accelerating the Development of Early-Maturing Agile Potato for Food Security through a Trait Observation and Discovery Network’, is gratefully acknowledged.

Conflicts of Interest

The authors declare no conflict of interest. The funders had no role in the design of the study; in the collection, analyses, or interpretation of data; in the writing of the manuscript, or in the decision to publish the results.

References

  1. Bowerman, A.F.; Byrt, C.S.; Roy, S.J.; Whitney, S.M.; Mortimer, J.C.; Ankeny, R.A.; Gilliham, M.; Zhang, D.; Millar, A.A.; Rebetzke, G.J.; et al. Potential abiotic stress targets for modern genetic manipulation. Plant Cell 2022, 35, 139–161. [Google Scholar] [CrossRef] [PubMed]
  2. Sheffield, J.; Wood, E.F. Projected changes in drought occurrence under future global warming from multi-model, multi-scenario, IPCC AR4 simulations. Clim. Dyn. 2008, 31, 79–105. [Google Scholar] [CrossRef]
  3. Lobell, D.B.; Field, C.B. Global scale climate–crop yield relationships and the impacts of recent warming. Environ. Res. Lett. 2007, 2, 014002. [Google Scholar] [CrossRef]
  4. Elliott, J.; Deryng, D.; Müller, C.; Frieler, K.; Konzmann, M.; Gerten, D.; Glotter, M.; Flörke, M.; Wada, Y.; Best, N.; et al. Constraints and potentials of future irrigation water availability on agricultural production under climate change. Proc. Natl. Acad. Sci. USA 2014, 111, 3239–3244. [Google Scholar] [CrossRef] [Green Version]
  5. Lerner, D.N.; Harris, B. The relationship between land use and groundwater resources and quality. J. Land Use Policy 2009, 26, S265–S273. [Google Scholar] [CrossRef]
  6. Wu, W.-Y.; Lo, M.-H.; Wada, Y.; Famiglietti, J.S.; Reager, J.T.; Yeh, P.J.F.; Ducharne, A.; Yang, Z.-L. Divergent effects of climate change on future groundwater availability in key mid-latitude aquifers. Nat. Commun. 2020, 11, 3710. [Google Scholar] [CrossRef]
  7. Tardieu, F. Any trait or trait-related allele can confer drought tolerance: Just design the right drought scenario. J. Exp. Bot. 2012, 63, 25–31. [Google Scholar] [CrossRef] [Green Version]
  8. Cooper, M.; Messina, C.D. Breeding crops for drought-affected environments and improved climate resilience. Plant Cell 2022, 35, 162–186. [Google Scholar] [CrossRef]
  9. Richards, R.A.; Hunt, J.R.; Kirkegaard, J.A.; Passioura, J.B. Yield improvement and adaptation of wheat to water-limited environments in Australia—A case study. Crop Pasture Sci. 2014, 65, 676–689. [Google Scholar] [CrossRef]
  10. Richards, R.A.; Rebetzke, G.J.; Watt, M.; Condon, A.G.; Spielmeyer, W.; Dolferus, R. Breeding for improved water productivity in temperate cereals: Phenotyping, quantitative trait loci, markers and the selection environment. Funct. Plant Biol. 2010, 37, 85–97. [Google Scholar] [CrossRef]
  11. Furbank, R.T.; Tester, M. Phenomics—Technologies to relieve the phenotyping bottleneck. Trend Plant Sci. 2011, 16, 635–644. [Google Scholar] [CrossRef]
  12. Stockem, J.E.; Korontzis, G.; Wilson, S.E.; de Vries, M.E.; van Eeuwijk, F.A.; Struik, P.C. Optimal Plot Dimensions for Performance Testing of Hybrid Potato in the Field. Potato Res. 2022, 65, 417–434. [Google Scholar] [CrossRef]
  13. Köhl, K.I.; Mulugeta Aneley, G.; Haas, M.; Peters, R. Confounding Factors in Container-Based Drought Tolerance Assessments in Solanum tuberosum. Agronomy 2021, 11, 865. [Google Scholar] [CrossRef]
  14. Simmons, C.R.; Lafitte, H.R.; Reimann, K.S.; Brugière, N.; Roesler, K.; Albertsen, M.C.; Greene, T.W.; Habben, J.E. Successes and insights of an industry biotech program to enhance maize agronomic traits. Plant Sci. Int. J. Exp. Plant Biol. 2021, 307, 110899. [Google Scholar] [CrossRef]
  15. Langstroff, A.; Heuermann, M.C.; Stahl, A.; Junker, A. Opportunities and limits of controlled-environment plant phenotyping for climate response traits. Theor. Appl. Genet. 2022, 135, 1–16. [Google Scholar] [CrossRef]
  16. Bänziger, M.; Setimela, P.S.; Hodson, D.; Vivek, B. Breeding for improved abiotic stress tolerance in maize adapted to southern Africa. Agric. Water Manag. 2006, 80, 212–224. [Google Scholar] [CrossRef]
  17. Lafitte, H.R.; Blum, A.; Atlin, G. Using secondary traits to help identify drought-tolerant genotypes. In Breeding Rice for Drought-Prone Environments; Fisher, K., Lafitte, R., Fukai, S., Atlin, G., Hardy, B., Eds.; IRRI: Los Banos, Philippines, 2003; pp. 37–48. [Google Scholar]
  18. Aliche, E.B.; Oortwijn, M.; Theeuwen, T.P.J.M.; Bachem, C.W.B.; Visser, R.G.F.; van der Linden, C.G. Drought response in field grown potatoes and the interactions between canopy growth and yield. Agric. Water Manag. 2018, 206, 20–30. [Google Scholar] [CrossRef]
  19. Bojaca, C.R.; Garcia, S.J.; Schrevens, E. Analysis of Potato Canopy Coverage as Assessed Through Digital Imagery by Nonlinear Mixed Effects Models. Potato Res. 2011, 54, 237–252. [Google Scholar] [CrossRef]
  20. Jensen, C.R.; Battilani, A.; Plauborg, F.; Psarras, G.; Chartzoulakis, K.; Janowiak, F.; Stikic, R.; Jovanovic, Z.; Li, G.; Qi, X.; et al. Deficit irrigation based on drought tolerance and root signalling in potatoes and tomatoes. Agric. Water Manag. 2010, 98, 403–413. [Google Scholar] [CrossRef]
  21. Mulugeta Aneley, G.; Haas, M.; Köhl, K. LIDAR-Based Phenotyping for Drought Response and Drought Tolerance in Potato. Potato Res. 2022. [Google Scholar] [CrossRef]
  22. Reynolds, M.; Skovmand, B.; Trethowan, R.; Pfeiffer, W. Evaluating a conceptual model for drought tolerance. In Molecular Approaches for the Genetic Improvement of Cereals for Stable Production in Water-Limited Environments; Ribaut, J.M., Poland, S.D., Eds.; CIMMYT: Texcoco, Mexico, 2000; pp. 49–53. [Google Scholar]
  23. Araus, J.L.; Cairns, J.E. Field high-throughput phenotyping: The new crop breeding frontier. Trend Plant Sci. 2014, 19, 52–61. [Google Scholar] [CrossRef] [PubMed]
  24. Berger, B.; de Regt, B.; Tester, M. High-throughput phenotyping of plant shoots. Methods Mol. Biol. 2012, 918, 9–20. [Google Scholar] [CrossRef] [PubMed]
  25. Jindo, K.; Kozan, O.; Iseki, K.; Maestrini, B.; van Evert, F.K.; Wubengeda, Y.; Arai, E.; Shimabukuro, Y.E.; Sawada, Y.; Kempenaar, C. Potential utilization of satellite remote sensing for field-based agricultural studies. Chem. Biol. Technol. Agric. 2021, 8, 58. [Google Scholar] [CrossRef]
  26. West, H.; Quinn, N.; Horswell, M. Remote sensing for drought monitoring & impact assessment: Progress, past challenges and future opportunities. Remote Sens. Environ. 2019, 232, 111291. [Google Scholar] [CrossRef]
  27. Kempenaar, C.; Been, T.; Booij, J.; van Evert, F.; Michielsen, J.-M.; Kocks, C. Advances in Variable Rate Technology Application in Potato in The Netherlands. Potato Res. 2017, 60, 295–305. [Google Scholar] [CrossRef] [PubMed] [Green Version]
  28. Barbedo, J. A Review on the Use of Unmanned Aerial Vehicles and Imaging Sensors for Monitoring and Assessing Plant Stresses. Drones 2019, 3, 40. [Google Scholar] [CrossRef] [Green Version]
  29. Zhang, J.; Virk, S.; Porter, W.; Kenworthy, K.; Sullivan, D.; Schwartz, B. Applications of Unmanned Aerial Vehicle Based Imagery in Turfgrass Field Trials. Front. Plant Sci. 2019, 10, 279. [Google Scholar] [CrossRef] [Green Version]
  30. Su, J.; Liu, C.; Coombes, M.; Hu, X.; Wang, C.; Xu, X.; Li, Q.; Guo, L.; Chen, W.-H. Wheat yellow rust monitoring by learning from multispectral UAV aerial imagery. Comput. Electron. Agric. 2018, 155, 157–166. [Google Scholar] [CrossRef]
  31. YARA. N-SensorTM, How Does It Work? Available online: https://www.yara.de/pflanzenernaehrung/pure-nutrient/info-3-intelligente-stickstoffdungung/funktion-nsensor/ (accessed on 3 March 2023).
  32. Passioura, J.B. Phenotyping for drought tolerance in grain crops: When is it useful to breeders? Funct. Plant Biol. 2012, 39, 851–859. [Google Scholar] [CrossRef]
  33. Bellvert, J.; Zarco-Tejada, P.J.; Girona, J.; Fereres, E. Mapping crop water stress index in a ‘Pinot-noir’ vineyard: Comparing ground measurements with thermal remote sensing imagery from an unmanned aerial vehicle. Precis. Agric. 2014, 15, 361–376. [Google Scholar] [CrossRef]
  34. Zhao, T.; Doll, D.; Wang, D.; Chen, Y. A new framework for UAV-based remote sensing data processing and its application in almond water stress quantification. In Proceedings of the 2017 International Conference on Unmanned Aircraft Systems (ICUAS), Miami, FL, USA, 13–16 June 2017; pp. 1794–1799. [Google Scholar]
  35. Monneveux, P.; Ramirez, D.A.; Pino, M.T. Drought tolerance in potato (S. tuberosum L.) Can we learn from drought tolerance research in cereals? Plant Sci. 2013, 205, 76–86. [Google Scholar] [CrossRef]
  36. Xu, X.; Pan, S.; Cheng, S.; Zhang, B.; Mu, D.; Ni, P.; Zhang, G.; Yang, S.; Li, R.; Wang, J.; et al. Genome sequence and analysis of the tuber crop potato. Nature 2011, 475, 189–195. [Google Scholar] [CrossRef] [Green Version]
  37. Caruana, B.M.; Pembleton, L.W.; Constable, F.; Rodoni, B.; Slater, A.T.; Cogan, N.O.I. Validation of Genotyping by Sequencing Using Transcriptomics for Diversity and Application of Genomic Selection in Tetraploid Potato. Front. Plant Sci. 2019, 10, 670. [Google Scholar] [CrossRef] [Green Version]
  38. Slater, A.T.; Cogan, N.O.I.; Forster, J.W.; Hayes, B.J.; Daetwyler, H.D. Improving genetic gain with genomic selection in autotetraploid potato. Plant Genome 2016, 9, 1–15. [Google Scholar] [CrossRef] [Green Version]
  39. Cabello, R.; Monneveux, P.; Bonierbale, M.; Khan, M.A. Heritability of yield components under irrigated and drought conditions in andigenum potatoes. Am. J. Potato Res. 2014, 91, 492–499. [Google Scholar] [CrossRef]
  40. Sprenger, H.; Rudack, K.; Schudoma, C.; Neumann, A.; Seddig, S.; Peters, R.; Zuther, E.; Kopka, J.; Hincha, D.K.; Walther, D.; et al. Assessment of drought tolerance and its potential yield penalty in potato. Funct. Plant Biol. 2015, 42, 655–667. [Google Scholar] [CrossRef]
  41. Wishart, J.; George, T.S.; Brown, L.K.; White, P.J.; Ramsay, G.; Jones, H.; Gregory, P.J. Field phenotyping of potato to assess root and shoot characteristics associated with drought tolerance. Plant Soil 2014, 378, 351–363. [Google Scholar] [CrossRef] [Green Version]
  42. Khan, M.S.; Struik, P.C.; van der Putten, P.E.L.; Jansen, H.J.; van Eck, H.J.; van Eeuwijk, F.A.; Yin, X.Y. A model-based approach to analyse genetic variation in potato using standard cultivars and a segregating population. I. Canopy cover dynamics. Field Crops Res. 2019, 242, 107581. [Google Scholar] [CrossRef]
  43. Khan, M.S.; Yin, X.; van der Putten, P.E.L.; Jansen, H.J.; van Eck, H.J.; van Eeuwijk, F.A.; Struik, P.C. A model-based approach to analyse genetic variation in potato using standard cultivars and a segregating population. II. Tuber bulking and resource use efficiency. Field Crops Res. 2019, 242, 107582. [Google Scholar] [CrossRef]
  44. Haas, M.; Sprenger, H.; Zuther, E.; Peters, R.; Seddig, S.; Walther, D.; Kopka, J.; Hincha, D.K.; Köhl, K.I. Can metabolite- and transcript-based selection for drought tolerance in Solanum tuberosum replace selection on yield in arid environments? Front. Plant Sci. 2020, 11, 1071. [Google Scholar] [CrossRef]
  45. Shoot Development of Twenty Potato Cultivars under Early, Late and Long-Term Drought Stress 2023. Available online: https://doi.ipk-gatersleben.de/DOI/10.5447/ipk/2023/9 (accessed on 22 May 2023).
  46. Köhl, K.I.; Basler, G.; Luedemann, A.; Selbig, J.; Walther, D. A plant resource and experiment management system based on the Golm Plant Database as a basic tool for omics research. Plant Methods 2008, 4, 11. [Google Scholar] [CrossRef] [PubMed] [Green Version]
  47. van Eeuwijk, F.A.; Bustos-Korts, D.; Millet, E.J.; Boer, M.P.; Kruijer, W.; Thompson, A.; Malosetti, M.; Iwata, H.; Quiroz, R.; Kuppe, C.; et al. Modelling strategies for assessing and increasing the effectiveness of new phenotyping techniques in plant breeding. Plant Sci. 2019, 282, 23–39. [Google Scholar] [CrossRef] [PubMed]
  48. Archontoulis, S.V.; Miguez, F.E. Nonlinear regression models and applications in agricultural research. Agron. J. 2014, 107, 786–798. [Google Scholar] [CrossRef] [Green Version]
  49. O’Brien, P.J.; Allen, E.J.; Firman, D.M. REVIEW A review of some studies into tuber initiation in potato (Solanum tuberosum) crops. J. Agric. Sci. 1998, 130, 251–270. [Google Scholar] [CrossRef]
  50. Puangbut, D.; Jogloy, S.; Toomsan, B.; Vorasoot, N.; Akkasaeng, C.; Kesmala, T.; Rachaputi, R.C.N.; Wright, G.C.; Patanothai, A. DROUGHT STRESS: Physiological Basis for Genotypic Variation in Tolerance to and Recovery from Pre-flowering Drought in Peanut. J. Agron. Crop Sci. 2010, 196, 358–367. [Google Scholar] [CrossRef]
  51. Chen, D.; Wang, S.; Cao, B.; Cao, D.; Leng, G.; Li, H.; Yin, L.; Shan, L.; Deng, X. Genotypic Variation in Growth and Physiological Response to Drought Stress and Re-Watering Reveals the Critical Role of Recovery in Drought Adaptation in Maize Seedlings. Front. Plant Sci. 2016, 6, 1241. [Google Scholar] [CrossRef] [Green Version]
  52. Hilker, M.; Schwachtje, J.; Baier, M.; Balazadeh, S.; Bäurle, I.; Geiselhardt, S.; Hincha, D.K.; Kunze, R.; Mueller-Roeber, B.; Rillig, M.C.; et al. Priming and memory of stress responses in organisms lacking a nervous system. Biol. Rev. 2015, 91, 1118–1133. [Google Scholar] [CrossRef] [Green Version]
  53. Jacques, C.; Salon, C.; Barnard, R.L.; Vernoud, V.; Prudent, M. Drought Stress Memory at the Plant Cycle Level: A Review. Plants 2021, 10, 1873. [Google Scholar] [CrossRef]
  54. Cavagnaro, J.B.; De Lis, B.R.; Tizio, R.M. Drought hardening of the potato plant as an aftereffect of soil drought conditions at planting. Potato Res. 1971, 14, 181–192. [Google Scholar] [CrossRef]
  55. Zhang, S.-H.; Xu, X.-F.; Sun, Y.-M.; Zhang, J.-L.; Li, C.-Z. Influence of drought hardening on the resistance physiology of potato seedlings under drought stress. J. Integr. Agric. 2018, 17, 336–347. [Google Scholar] [CrossRef] [Green Version]
  56. Schumacher, C.; Krannich, C.T.; Maletzki, L.; Köhl, K.; Kopka, J.; Sprenger, H.; Hincha, D.; Seddig, S.; Peters, R.; Hamera, S.; et al. Unravelling differences in candidate genes for drought tolerance in potato (Solanum tuberosum L.) by use of new functional microsatellite markers. Genes 2021, 12, 494. [Google Scholar] [CrossRef]
  57. John, M.; Haselbeck, F.; Dass, R.; Malisi, C.; Ricca, P.; Dreischer, C.; Schultheiss, S.J.; Grimm, D.G. A comparison of classical and machine learning-based phenotype prediction methods on simulated data and three plant species. Front. Plant Sci. 2022, 13, 932512. [Google Scholar] [CrossRef]
  58. Montesinos-López, O.A.; Montesinos-López, A.; Crossa, J.; de los Campos, G.; Alvarado, G.; Suchismita, M.; Rutkoski, J.; González-Pérez, L.; Burgueño, J. Predicting grain yield using canopy hyperspectral reflectance in wheat breeding data. Plant Methods 2017, 13, 4. [Google Scholar] [CrossRef] [Green Version]
Figure 1. Cumulative irrigation volume (A) and distribution of daily median of soil water content (B) for optimal water supply (cc), late stress (cs), early stress (sc), and long-term (ss) drought stress in experiments in 2017, 2018 and 2019. Interval 1: before stress, interval 2: early stress before flowering, interval 3: late stress after flowering. Symbols indicate data points outside the 1.5fold interquartile range indicated by the box-and-whisker plot.
Agronomy 13 01457 g001
Figure 2. (A) Distribution of tuber starch yield in 20 potato genotypes cultivated at optimal water supply (cc), late drought (cs), early drought (sc), and long-term drought in experiments in 2017, 2018, and 2019. (B) Distribution of water-use efficiency of starch yield in 20 potato genotypes cultivated in different water regimes (for color code, see (A)). (C) Average tuber numbers per plants in different size classes (see Section 2) in 20 potato cultivars grown at different water regimes. (D) Distribution of drought tolerance index DRYMp for potato cultivars grown under different water regimes (for color code, see (A) and (B)) in experiments in 2017, 2018, and 2019. The statistical evaluation is presented in Table 1. For the distribution of tuber yield and starch content data, see Supplementary Figure S2. For the meaning of the box and whiskers plot and symbols see Figure 1.
Agronomy 13 01457 g002
Figure 3. Distribution of the genotypic median of daily median of light penetration depth (A,D,G), leaf angle (B,E,H), and leaf inclination (C,F,I) by treatment (legend see (A,D,G)) against plant age in year 2017 (A,B,C), 2018 (D,E,F), and 2019 (G,H,I). The line indicates the median; the bands indicate the 10th percentile and 90th percentile. The gray reference line indicates the start of the third interval.
Agronomy 13 01457 g003
Figure 4. Effect of the treatment on the growth curve (AD) and the logistic regression parameters (EP) of canopy features. Model growth curves calculated from median regression parameters of the 2019 experiment for LAI (A), A2 (B), DB (C), and PH (D). Distribution of the regression parameters k, tm, and max by treatment (for color code, see panel (M)) and year for LAI, A2, DB, and PH. A2mod_E3= A2mod/103, DBmod_E6 = DBmod/106; A2_E3= A2/103, DB_E6 = DB/106.
Agronomy 13 01457 g004
Figure 5. Heatmap of Spearman correlation coefficients for the correlations between growth parameters and drought tolerance. Growth parameters are the genotype medians of the growth parameters slope (k), turning point (tm), and maximum (max) of the features leaf area index (LAI), leaf area (A3), projected leaf area (A2), digital biomass (DB), and plant height (PH) determined under control (cc), late stress (cs), early stress (sc), and long-term stress (ss). For details on the calculation for drought tolerance index DRYMp for the three stress variants and filtering of the results, see Section 2. The color visualizes the correlation coefficients as a heatmap with red for positive and blue for negative correlations.
Agronomy 13 01457 g005
Figure 6. Regression weights for the prediction of tolerance to long-term drought (ss: A,D), early drought stress (sc: B,E), or late drought stress (cs: C,F) from randomly selected daily medians of features measured under stress (AC) or measured under optimal conditions (DF) in experiments in 2017 (black needle), 2018 (dark-gray needle), and 2019 (light-gray needle). Symbols indicate that parameters differed across the six subfigures. The day on which the feature was measured is indicated by the first two numbers of the value names on the x-axis. For R2 values, see Table 3. LP = LPD, A2D = A2, and A3D = A3.
Agronomy 13 01457 g006
Table 1. ANOVA F values for the effect of genotype, treatment, their interaction (G × E), and experiment on the yield parameters tuber starch yield (SY), water-use efficiency (WUE) of SY (WUE(SY)), tuber yield (TY), WUE of TY, tuber starch content, tuber number in the size classes S, M, and L, and drought tolerance index DRYMp. Degrees of freedom (DF): genotype, 19; treatment, 3 (DRYMp 2); G × T, 57 (DRYMp 38). Bold type I error probability p < 0.0001; italic type I error probability p < 0.05.
Parameter.DF (Error)GenotypeTreatmentG × EYear
SY161966.3818.61.86703.6
WUE(SY)161969.9143.21.382030.3
TY161974.7675.41.59333.5
WUE (TY)161978.596.71.351372.0
Starch content161953.061.51.26280.9
Tuber number (S)158727.853.22.213.0
Tuber number (M)158540.1435.81.6192.1
Tuber number (L)158524.331.03.2752.1
DRYMp12016.07.11.027.5
Table 2. ANOVA F values for the effect of year (Y), genotype (G), treatment (E), and their interaction on the logistic regression parameters k, max, and tm. Logistic regression of daily plant median of features A2, A3, DB, PH, and LAI against plant age. Bold: p < 0.01.
ParameterYGY×GEY × EG × EY × E × G
a2k349.268.642.88167.6927.741.541.30
a2max924.6927.134.8575.5013.211.100.94
a2tm2285.420.637.085.761.161.010.75
a3k362.710.042.81182.8622.591.531.21
a3max1027.427.274.2852.009.191.090.97
a3tm2257.9822.676.634.271.021.040.79
dbk291.828.223.39691.4094.251.490.98
dbmax90.525.051.71305.7411.351.280.88
dbtm2003.519.586.06203.4411.211.780.84
phk267.2512.422.93726.15133.891.561.20
phmax122.675.552.24462.9834.761.861.31
phtm861.2517.116.77354.9951.822.321.41
LAIk356.819.992.96172.6122.971.451.32
LAImax523.9525.784.1250.209.381.170.98
LAItm2288.7922.376.254.021.070.970.77
Table 3. R2 for multiple regression with tolerance index DRYMp for long-term (ss), early (sc), and late (cs) stress as the dependent and N independent variables selected among the daily genotype median of features LA, LI, LPD, A2, A3, DB, PH, and LAI. The features were measured under the conditions given in the ‘phenotype’ column in the respective year. R2 (N ≤ 4) is the R2 for a model with the first four variables. Details of the modeling are described in Section 2.3.4.
TolerancePhenotypeYearR2 (Full Model)N (Full Model)R2 (n ≤ 4)
DRYMp(ss)cc20170.9860.95
20180.8760.79
20190.7540.75
ss20170.8830.88
20180.9660.88
20190.8250.78
DRYMP(sc)cc20170.9870.88
20180.8940.89
20190.8960.78
sc20170.7940.79
20180.3920.39
20190.997100.86
DRYMP(cs)cc20170.7850.75
20180.9470.85
20190.9880.83
cs20170.999120.89
20180.999140.73
20190.4420.44
Disclaimer/Publisher’s Note: The statements, opinions and data contained in all publications are solely those of the individual author(s) and contributor(s) and not of MDPI and/or the editor(s). MDPI and/or the editor(s) disclaim responsibility for any injury to people or property resulting from any ideas, methods, instructions or products referred to in the content.