Article

Effects of Nitrogen Application in Recovery Period after Different High Temperature Stress on Plant Growth of Greenhouse Tomato at Flowering and Fruiting Stages

1
School of Applied Meteorology, Nanjing University of Information Science & Technology, Nanjing 210044, China
2
School of Environment and Tourism, West Anhui University, Lu’an 237000, China
3
State Key Laboratory of Water Resources and Hydropower Engineering Science, Wuhan University, Wuhan 430072, China
*
Authors to whom correspondence should be addressed.
Agronomy 2023, 13(6), 1439; https://doi.org/10.3390/agronomy13061439
Submission received: 30 April 2023 / Revised: 21 May 2023 / Accepted: 21 May 2023 / Published: 23 May 2023
(This article belongs to the Special Issue Crop and Vegetable Physiology under Environmental Stresses)

Abstract

:
High temperatures have become a severe factor limiting growth and yield for tomatoes (Lycopersicon esculentum Mill.) due to unfavorable, above-optimum temperatures. Temperature and nitrogen application were the main regulatory factors in tomato plant cultivation. This research was undertaken to evaluate the effects of nitrogen application and high temperature on tomato morphology, dry matter accumulation and distribution, root vitality and nitrogen content of the above ground. Tomato variety “Jinfen No. 1” was planted and exposed to 4 day/night temperature levels (25 °C/15 °C as control CKT; 30 °C/20 °C, lightly high-temperature LHT; 35 °C/25 °C, moderate high-temperature MHT; 40 °C/30 °C, severe high temperature SHT) for 7 days after five nitrogen supply levels (N1–N5: 0, 1.3, 1.95, 2.6 and 3.75 g/plant, respectively; 2.6 g/plant is the recommended nitrogen-application rate, as control CKTN4). Within conditions, there was an extremely significant difference (p < 0.01) in all tomato plant parameters and an extremely significant interaction (p < 0.01) between high temperatures and nitrogen supply levels, except for plant height sampling on the 1st day in the recovery period. Dry matter accumulation decreased, and the accumulation rate slowed down. Dry matter accumulation under low nitrogen treatment was higher than in high nitrogen treatment. The proportion of dry matter in leaves decreased, the proportion of dry matter in stems increased and the difference in dry matter accumulation and proportion of dry matter between different nitrogen treatments decreased. Under LHT, the root activity of the tomato was increased under all nitrogen levels, while under MHT and SHT, high nitrogen and low nitrogen supply significantly inhibited root activity. Lightly high-temperature stress can increase root activity, and LHTN4 can increase by 5.15% compared with CKTN4. Appropriate nitrogen application can alleviate the damage caused by high-temperature stress on tomato plants and enhance the resistance of tomato plants, while excessive nitrogen application will aggravate the damage degree of tomato plants. In this study, the optimal nitrogen application rates under CKT-SHT treatment were 2.6, 2.6, 1.95 and 1.3 g/plant, respectively.

1. Introduction

High-temperature stress is likely to become more problematic as global warming causes more adverse climatic changes [1]. Plants have evolved a variety of temperature-response mechanisms [2]. Tomato (Lycopersicon esculentum Mill.) belongs to the genus Solanaceae and is one of the most cultivated crops in the world. Temperature and nitrogen application rate are the main regulating factors in protected tomato cultivation. Tomato is a thermophilic vegetable [3,4] sensitive to environmental temperature. The optimum temperature for tomato plant growth and development during the day is 24 °C–26 °C and during the night is 15 °C–17 °C. The growth is poor when the temperature is higher than 35 °C [5], and at temperatures > 45 °C, the plant suffers burning [6] and death due to physiologic drought. Under high-temperature stress, the relative growth rate of tomato plants is reduced, the structure and morphology of the thylakoid membrane are changed [7] and the growth of the root system is suppressed, thereby adversely affecting the growth and development [8,9], flowering and pollination [10], carbon and nitrogen metabolism [11], fruit setting [12] and fruit quality [13,14].
Nitrogen application is essential for crops to withstand stress [15], and optimization of nitrogen management can alleviate plant high-temperature stress. Few studies have explored the effect of nitrogen on alleviating high-temperature stress in plants, and these studies mainly focused on field crops, such as wheat, rice and corn. Under high-temperature stress, nitrogen nutrition plays a key role in alleviating wheat senescence [16,17] and changing the degree of heat stress on wheat grain weight [18,19]. Continuous exposure of tomato ‘Trust’ to high temperatures (day/night temperatures of 32 °C/26 °C) markedly reduced the number of pollen grains per flower and decreased viability [20]. High ambient temperature has adverse effects on plant vegetative and reproductive development and reduces crop yield. STHS negatively affected vegetative traits concerning seedling survival and membrane stability [21]. The functional activities of the photosynthetic apparatus of tomato cultivars of different thermotolerance were different after a short period of high temperature treatment. Heat led to a sun-type adaptation response of the photosynthesis pigment apparatus for the Nagcarlang genotype, but not for Campbell-28, and thus an increase in chlorophyll a/b [22]. Abiotic stresses can cause a substantial decline in fruit quality due to negative impacts on plant growth, physiology and reproduction. The effect of biostimulants depends on the genotype applied. These creature stimulants used in tomato plants can make better plants at high temperatures, which can be attributed to stronger antioxidant defense systems and better nutritional quality fruit [23]. Under high-temperature stress, nitrogen application reduced panicle temperature by increasing the net photosynthetic rate and stomatal conductance of flag leaves, with the effect of high nitrogen application being better than that of medium nitrogen application [24,25].
Nitrogen-application rate also affects plant growth, nitrogen utilisation efficiency, nitrogen metabolism, yield and fruit quality [26,27,28,29,30,31]. Nitrogen is an essential nutrient for tomato growth and development. The leaf area and dry matter accumulation of tomatoes increased exponentially with nitrogen application, whereas nitrogen use efficiency, yield and nitrogen fertiliser contribution rate increased first and then decreased with nitrogen application. This suggests that only an appropriate amount of nitrogen can promote the growth of tomato plants, while excessive or small amounts of nitrogen can limit the growth and development of tomato plants [32]. The greenhouse vegetable industry represents 20% of the total vegetable production area in China yet produces 35% of output and 60% of economic value. However, the nitrogen (N) fertiliser input is estimated to exceed crop requirements by a factor of five to six. The nutrient use efficiency (NUE), including apparent recovery efficiency (ARE) and partial factor productivity (PFP) under conventional practices, ranged from 2.6% to 5.7% and 48.3–84.7 kg·kg−1 [33]. Nitrogen metabolism is an important physiological metabolic process that plants must carry out during growth and development [34]. Nitrogen levels affect the nitrogen metabolism of tomato plants by affecting the activities of major nitrogen metabolising enzymes, thereby affecting their ability to assimilate amino acids [35]. Under constant light conditions, increasing nitrogen fertiliser could promote the ability of tomato plants to absorb nitrogen [36].
Adequate nitrogen application is the basis and guarantee for a high yield of tomato plants. However, excessive nitrogen application will cause waste of resources, environmental pollution and many other adverse consequences. Therefore, the timely and effective monitoring of the nitrogen nutrition status in tomato plants and reasonable fertilisation based on such monitoring can not only balance the supply and demand of nitrogen in each growth stage of the plant but also reduce the production cost and degree of environmental pollution [37].
Therefore, in this research, artificial control experiments were performed in an experimental facility considering two factors, high temperature and nitrogen level. Through these experiments, tomato plant growth characteristics under different high-temperature and nitrogen conditions were examined. These data were used to determine the optimal amount of nitrogen to be applied under different high-temperature conditions, providing a basis for tomato nitrogen nutrient diagnosis and utilisation efficiency evaluation.

2. Materials and Methods

2.1. The Plant Materials and Growth Conditions

The experiment was carried out in the Venlo-type experimental greenhouse of the Agricultural Meteorological Laboratory of Nanjing University of Information Science and Technology. The greenhouse has a roof height of 5.0 m, a shoulder height of 4.5 m, a width of 9.6 m and a length of 30.0 m. It runs north–south and adopts automatic skylights and side vents for ventilation. The tested soil was medium loam, with uniform soil fertility, pH 7.4, an organic matter content of 18.32 g × kg−1, a total nitrogen content of 0.86 g × kg−1, a total phosphorus content of 0.75 g × kg−1 and a soil volumetric water content of 32.45% [38].
Tomato variety ‘Jinfen No. 1’ was used in the test. Plants grown to about 15 cm were planted on 10 September 2021 in flower pots of size 28 cm (height) × 34 cm (upper diameter) × 18 cm (bottom diameter). After the tomato plants took root and grew, different levels of fertilisation treatments were performed on 16 September. After the fertiliser began to be absorbed by the tomato plants, the temperature treatment test was started on 20 September. The tomato plants in the climate chamber and greenhouse are shown in Figure 1.
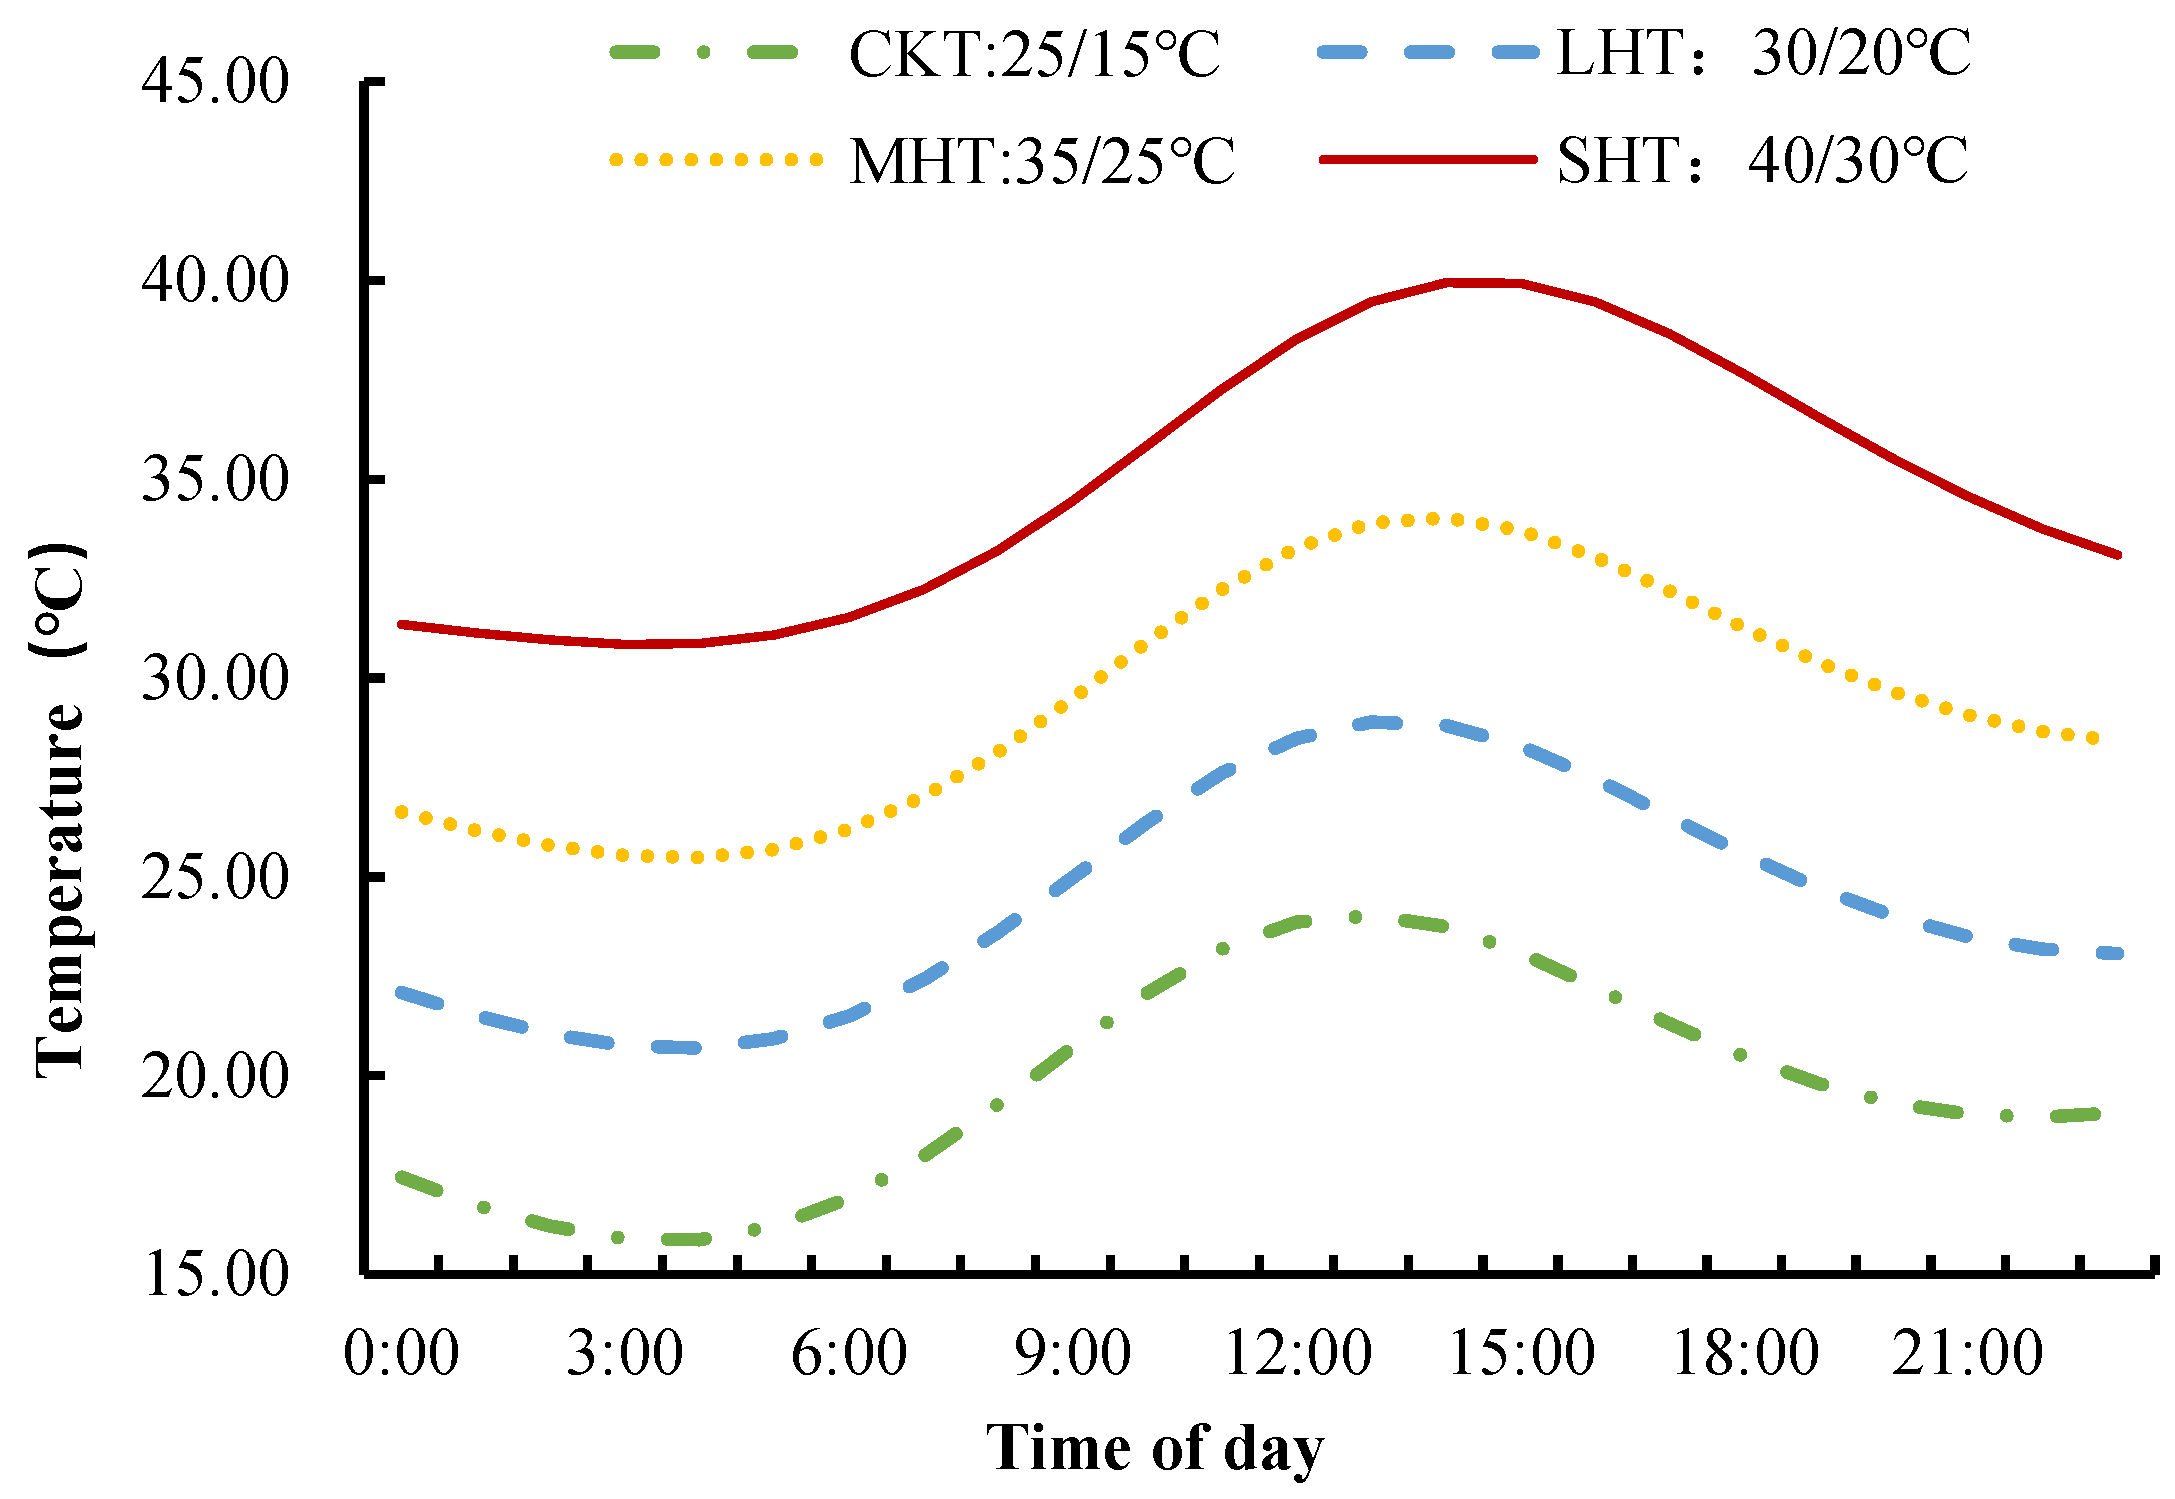
Test design temperature and nitrogen were the two factors considered in the experiments. Four levels of day temperature/night temperature were applied: normal temperature control CKT (25 °C/15 °C), lightly high-temperature LHT (30 °C/20 °C), moderate high-temperature MHT (35 °C/25 °C) and severe high-temperature SHT (40 °C/30 °C). The day and night temperatures represent the highest temperature during the day and the lowest at night, respectively. With reference to the hourly temperature simulation study of the Nanjing Glass greenhouse [39], the temperature of the artificial climate chamber is set to be close to the daily variation of temperature in Nanjing, with the lowest temperature at 5.00 and the highest temperature at 14.00, as shown in Figure 2. Five levels of nitrogen application in the soil were applied. The purpose of adopting different levels was to control the nitrogen content in the plant through the amount of fertiliser and form the necessary nitrogen content gradient. Taking the recommended nitrogen-application rate (2.6 g/plant) as control (CK) [40], the other treatments were the following: no nitrogen fertiliser (N1, 0 g/plant) treatment, 0.5 times the recommended fertiliser rate (N2, 1.3 g/plant), 0.75 times the recommended fertiliser rate (N3, 1.95 g/plant), normal recommended fertiliser rate (CKN4, 2.6 g/plant), 1.25 times the recommended fertiliser rate (N5, 3.25 g/plant). A total of 20 treatments were designed combining temperature and nitrogen (Table 1), and each treatment was repeated 3 times. The relative humidity of the air is set at 65~75%. The light period is 12 h/2 h (6:00–18:00 in the day/18:00–6:00 at night). The light intensity was set at 800 μmol m−2 s−1 at 6:00–18:00 in the artificial climate chamber. Water was supplied every three days at 80% field capacity to avoid water deficiency.
The treatment started at 18.00 h on 20 September 2021. The potted tomatoes were kept in an artificial climate chamber (Conviron 6050, Canada) and treated at different temperatures and then taken out of the chamber 7 days later (i.e., 27 September 2021). Thereafter, the tests were continued in the Venlo test greenhouse at room temperature, and on the next day (i.e., 28 September 2021), 8.00–11.00 h, each index was measured, and samples were taken; three strains were considered for each treatment. Subsequently, samples were taken and measured every 7 days for six samples.

2.2. Measurement of Tomato Plant Growth Parameters

Plant height measurement. Plant height is the natural height (cm) from the base of the plant to the growth point of the main stem, as measured with a ruler (Shanghai Instrument Co., Ltd., Shanghai, China).
Stem thickness measurement. The stem thickness is the diameter (mm) of the main stem at the height of 3 cm from the soil surface, measured in two directions (with an angle of 90°) with a vernier caliper (0–100 mm, Shanghai Instrument Factory), and the average value was taken [41].
Determination of dry matter above the ground. After the treatment, destructive sampling was carried out every 7 days, and all the stems and leaves above the soil surface of the tomato plants were removed. Each treatment was repeated three times for a total of six samples. After sampling, the stems and leaves of the tomato were washed with tap water and deionised water, deactivated at 105 °C for 15 min, and then dried at 80 °C to a constant weight. An electronic balance with an accuracy of 0.001 g was used to determine the dry matter of the tomato plants, and the average of three replicates was taken.

2.3. Measurement of Tomato Root Vitality

Root vitality can be expressed by the amount of TTC (Triphenyltetrazolium chloride) reduction. The root hair area was selected for sampling when root activity was measured.
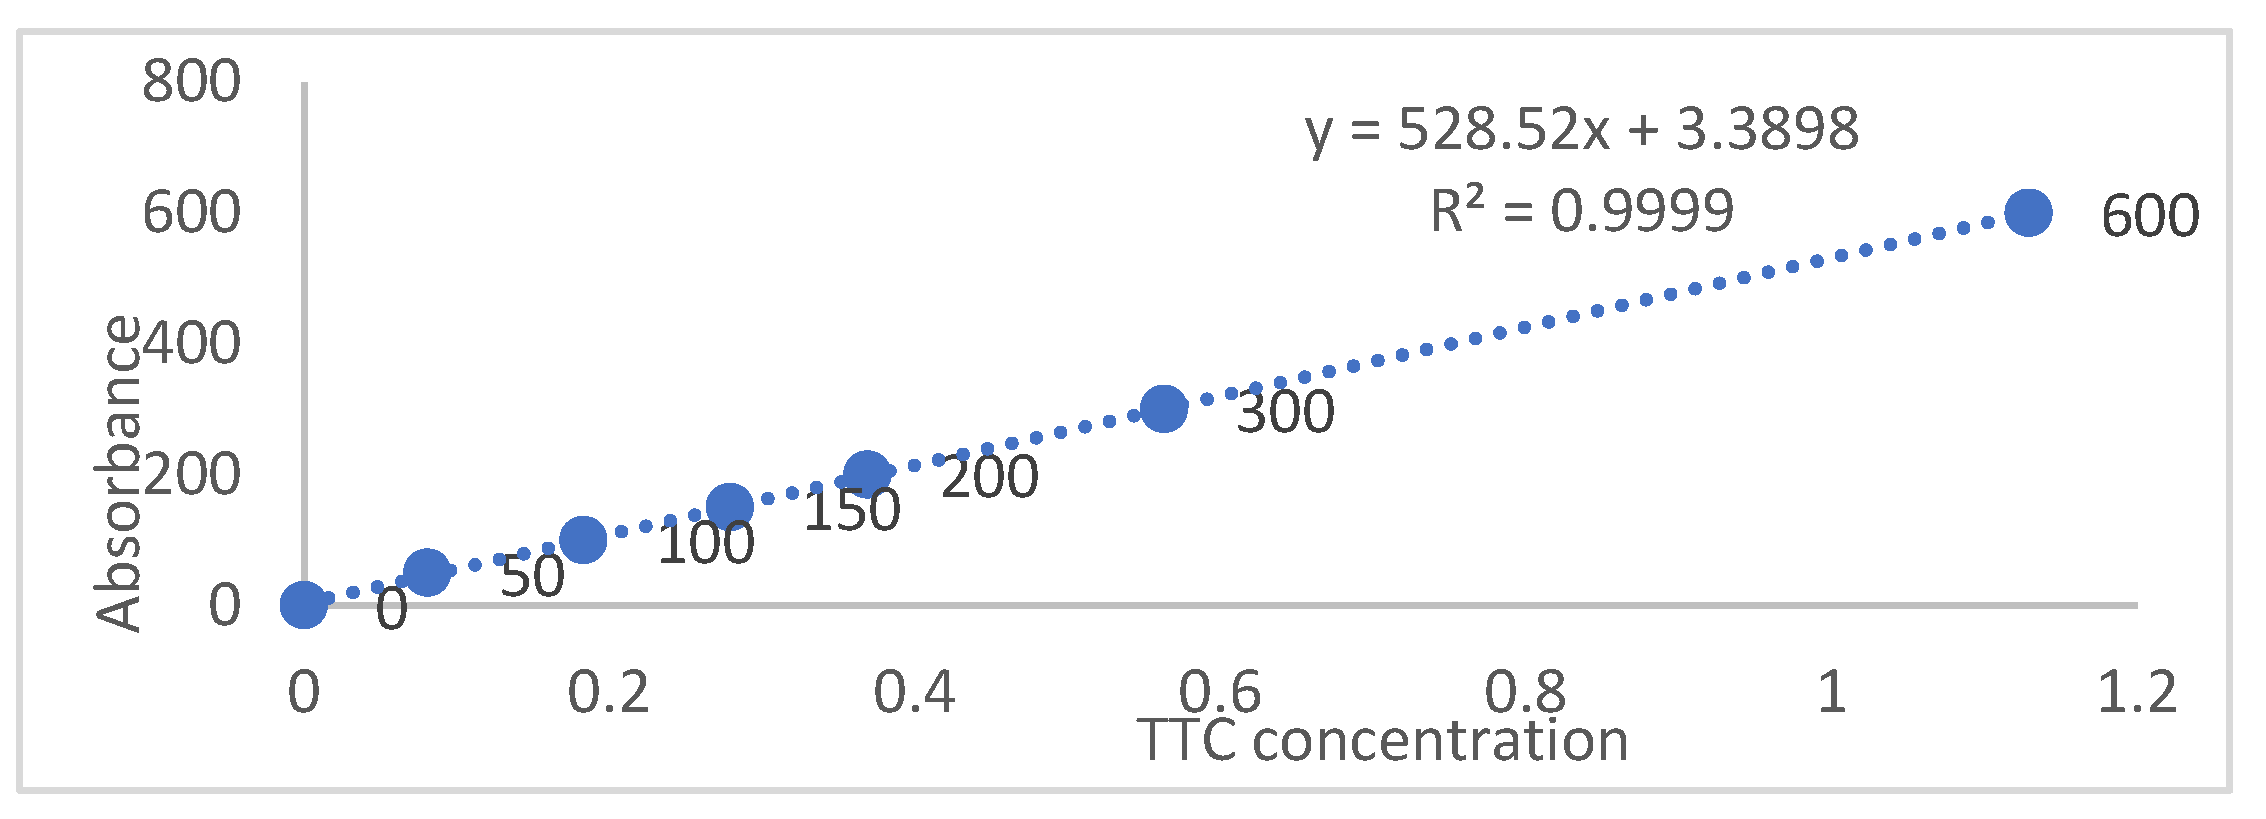
Making TTC standard curves: Prepare TTC solutions with concentrations of 0, 0.4, 0.3, 0.2, 0.1, and 0.05 g/L; take 5 mL of each solution and place them in calibration tubes. Take 5 mL of ethyl acetate and a small amount of Na2S2O4 (about 2 mg, the amount in each tube should be consistent), shake thoroughly, and produce red formaldehyde. Transfer it to the ethyl acetate layer. After the colored liquid layer is separated, add 5 mL of ethyl acetate, shake and let it stand for layering. Take the upper layer of ethyl acetate solution and use the blank as a reference. Measure the absorbance values of each solution at 485 nm on a spectrophotometer and then draw a standard curve with the TTC concentration as the x-axis and the absorbance value as the y-axis (Figure 3).
The formula for calculating the reduction intensity of tetrazole per unit of fresh root weight is as follows:
R e d u c t i o n   i n t e n s i t y   o f   t e t r a z o l i u m   p e r   u n i t   r o o t   f r e s h   w e i g h t = T e t r a z o l i u m r e d u c t i o n R o o t   w e i g h × T i m e   [ m g   ( g   h ) 1 ]

2.4. Statistical Analysis

Microsoft® Excel for Mac 16.44 was used for data processing and graphing. The index value for each processing was the arithmetic mean of three replicates. SPSS Statistics 26 (SPSS, Chicago, IL, USA) was used to analyse the differences in the data, and Duncan’s test was performed for multiple comparisons (α = 0.05). We used Matlab to plot 3D plots of sampling time, temperature and nitrogen content of tomato aboveground plants.

2.5. Logistic Model

According to the principle of the Logistic growth model, the Logistic model can be used to quantitatively describe the dynamic changes of above-ground biomass accumulation in tomatoes. The model expression is as follows:
Y = D M M / ( 1 + a e b t )
where, Y is the aboveground biomass accumulation of tomato (g/plant); Independent variable t is the days after tomato colonization (day); DMM was the theoretical maximum of aboveground biomass accumulation (g/plant); a and b are model fitting growth parameters; ‘e’ is a natural constant whose value is about 2.718281828459045.
The Logistic model is obtained by a simple algebraic transformation, and the parameters are fitted out with the least square method. The bias in the total difference between simulation and measurement was determined by calculating the correlation coefficient (R2) and the root mean square error (RMSE).
The root mean square error (RMSE) reflects a measure (%) of the relative difference between estimated and observed data. The root mean square error is defined by the function
R M S E = i = 1 n ( P i O i ) 2 N
In the formula, Pi is the measured value, Oi is the corresponding simulated value, and N is the sample size.
The estimations are considered to be excellent when the normalized RMSE is less than 10%, good if the normalized RMSE is between 10 and 20%, fair if the normalized RMSE is between 20 and 30%, and poor if the normalized RMSE is greater than 30%.
The correlation coefficient (R2) is another method for evaluating the magnitude of the difference between the measured values and the predictions generated using a model. The greater the R2 value, the lower the deviation between the model results and the observation.
R 2 = 1 i 1 n ( P i O i ) 2 i = 1 n ( O i M O ) 2

3. Results

The analysis of variance revealed significant effects for high temperatures and nitrogen supply levels and their interactions on all recorded traits (Table 1). There were significant differences (p < 0.01) among the responses of high temperatures to nitrogen supply levels (Table 2). On the 1st day in the recovery period, neither HT nor N had a significant effect on plant height; however, their interaction is significant (p < 0.05). HT and N for dry matter accumulation had no significant interaction effects on the 8th day of the recovery period.

3.1. Tomato Growth Parameters

3.1.1. The Tomato Plant Height

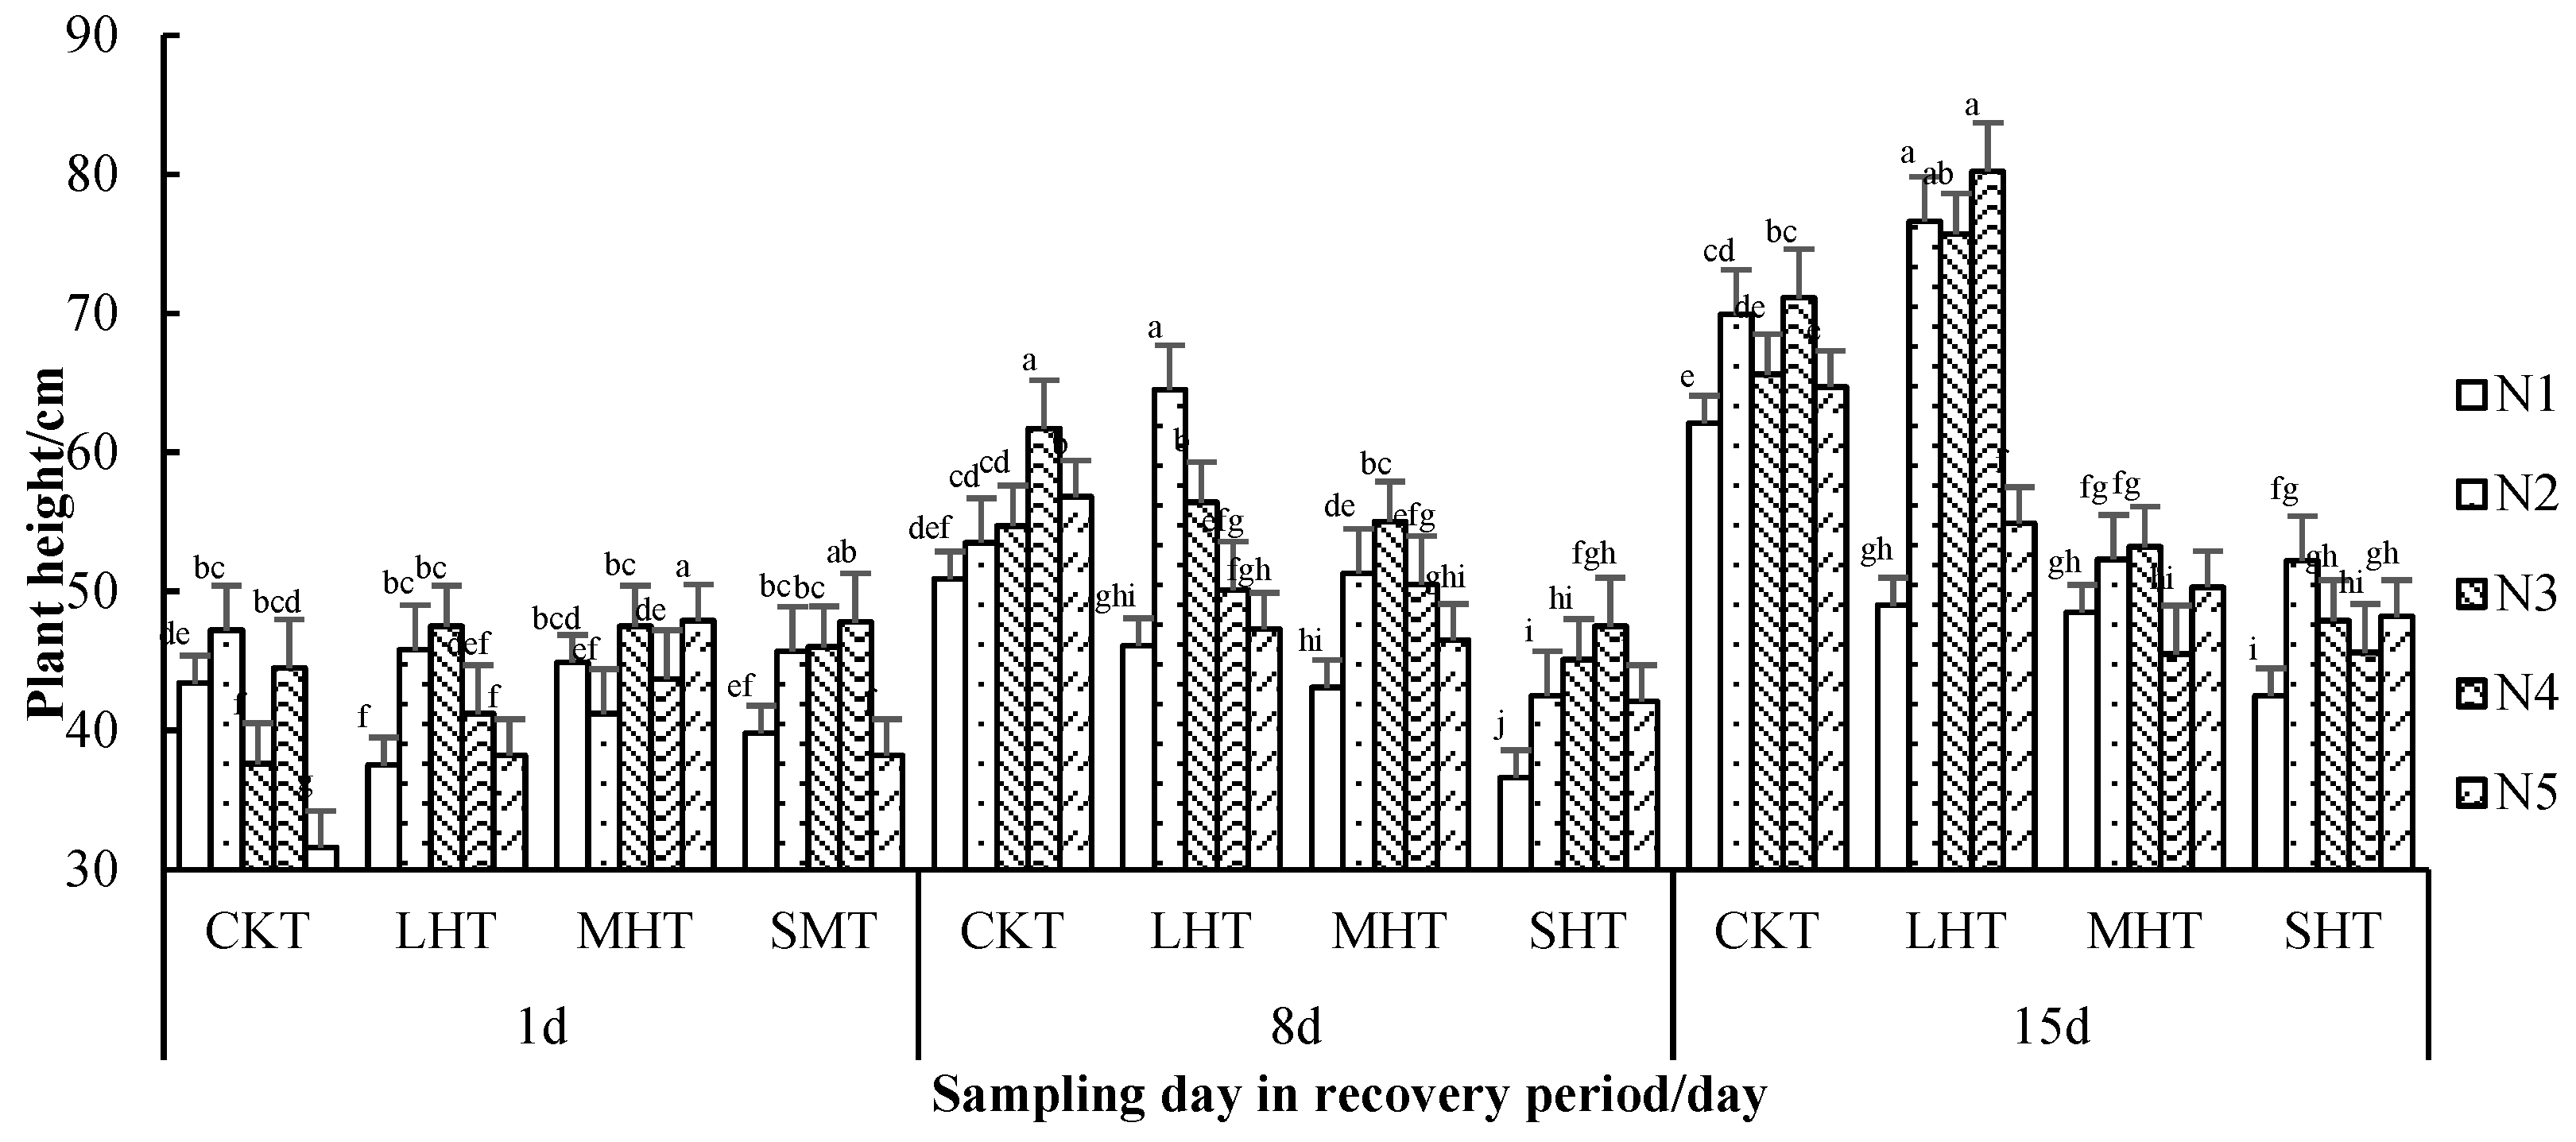
Within conditions, there was a significant difference in all tomato plant parameters and significant interaction between high temperatures and nitrogen supply levels except for plant height sampling on the 1st day in the recovery period (Figure 4). In general, under control temperature CKT (25 °C/15 °C) and lightly high temperature LHT, the tomato plant height was increased compared to moderately high temperature MHT (35 °C/25 °C) and severe high temperature SHT (40 °C/30 °C) in the recovery period.
In general, under CKT, LHT, MHT and SHT, nitrogen in the early recovery stage had no significant effect on tomato plant height. From the 8th to 15th days, with the increase of nitrogen application, tomato plant height showed a trend of increasing in line with the gradient of nitrogen application under CKT. Under LHT, the plant height of the tomato increased with the increase of nitrogen gradient under the best-recommended nitrogen application level N4. The plant height of tomatoes under high N5 decreased significantly compared with that under recommended N application. Under MHT, plant height decreased (low nitrogen/high nitrogen stress) in both N1 and N5 on the 8th of the recovery stage and increased on the 15th day. N2 increased the most, only by 11.1 cm. The plant height of N3 and N4 decreased on the 8th to 15th day, and the increase of N2 was the largest. Under SHT, low N and high N significantly increased tomato plant height on the 8th and 15th days. The height of the tomato plant was significantly reduced from day 1 to day 15 under the optimal nitrogen application rate. Under N1–N4 treatment, plant height tended to decrease on day 8, while under N5 treatment, plant height increased. On day 15, only the N4-treated plant height decreased.

3.1.2. The Tomato Plant Stem Thickness

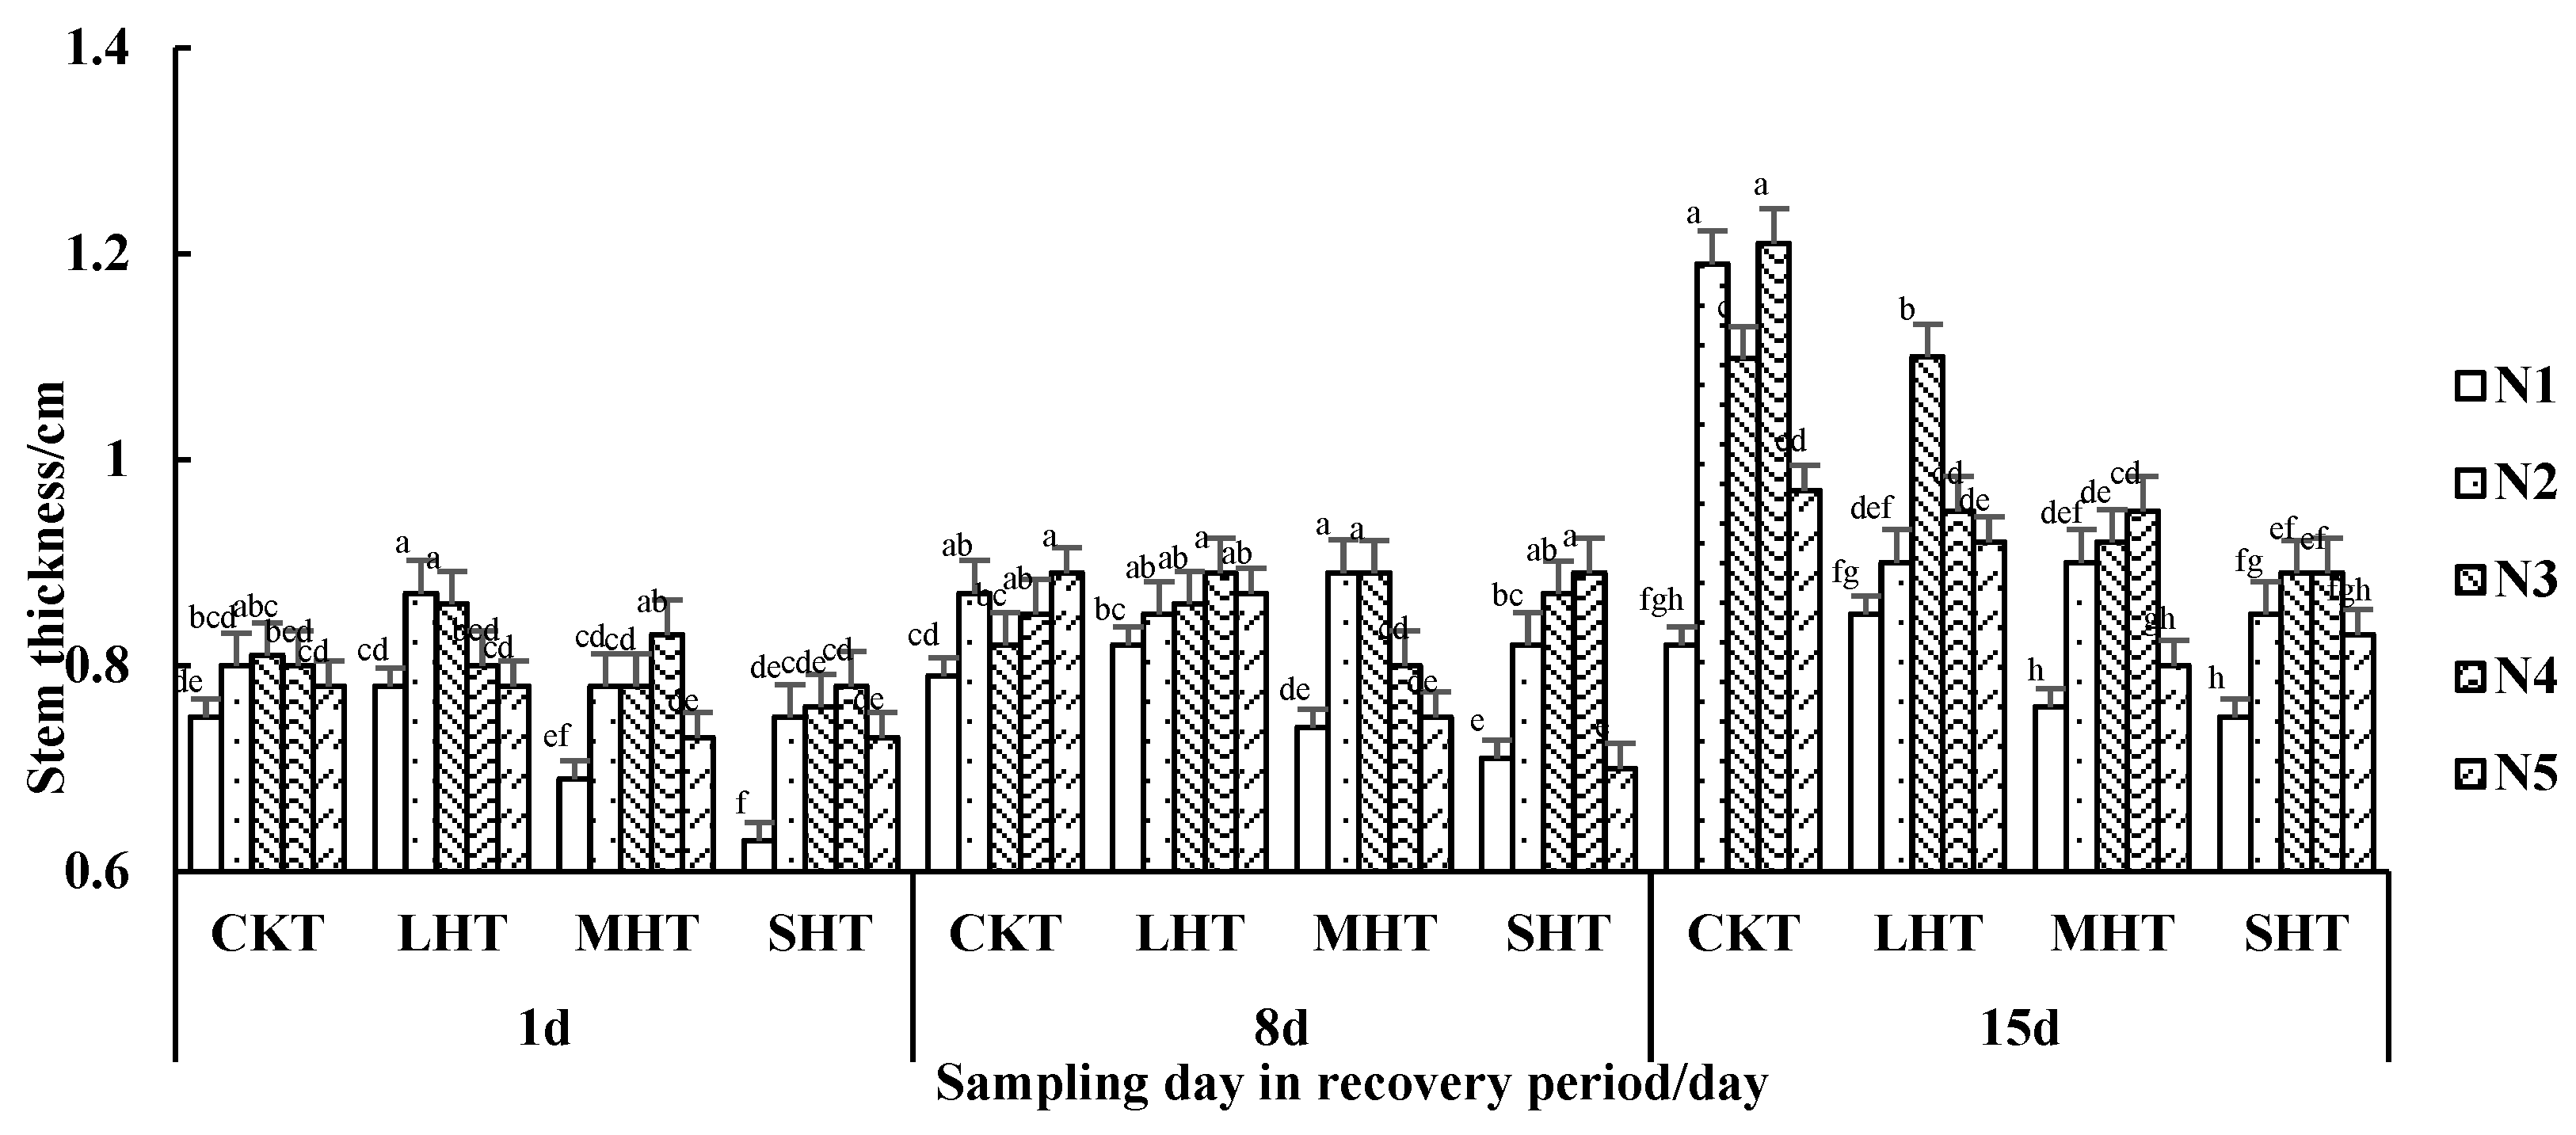
The effect of different high-temperature/nitrogen combinations on tomato plant stem thickness is shown in Figure 5. Figure 5 shows that as the number of sampling days increases, the thickness of the tomato stem increases gradually under all treatments, and the differences between the four temperature treatments gradually increase during the same sampling period.
In general, the stem thickness under CKT at room temperature was the largest. With an increase in the high-temperature stress, the tomato stem thickness gradually decreased, indicating that high-temperature stress adversely affects the growth of tomato stem thickness. Under CKT, the stem thickness was the largest under N4 treatment; under LHT, it was the largest under N3 treatment; under MHT, N2–N4 treatments all resulted in large stem thickness; under SHT, plants under N3 and N4 treatments had larger stem thickness.

3.2. Dry Matter Accumulation and Distribution of Tomato Plants

3.2.1. Dry Matter Accumulation of Tomato Plants

The observation results of dry matter accumulation in the aerial parts of tomato plants under different high-temperature/nitrogen combination conditions are listed in Table 3.
Under normal temperature treatment CKT, the dry matter accumulation amount was 9.95–18.96 g/plant; the dry matter accumulation under N1 treatment was the least, and that under N5 treatment was the highest. The differences among N2, N3 and N4 treatments were significant, and the difference between N4 and N5 treatments was not significant, indicating that the proper application of nitrogen fertiliser can increase the dry matter accumulation to assess tomato quality. However, applying too much nitrogen fertiliser will cause wastage. Under LHT, the differences among various nitrogen treatments were reduced, and the dry matter accumulation was between 12.35 and 16.98 g/plant. The dry matter accumulation under the N3 treatment was the largest, and that under the N5 treatment was the smallest. This finding shows that excessive nitrogen application is unfavorable for tomato growth under high-temperature conditions. Compared with CKT-N1 treatment, LHT-N1 treatment led to an increase in 52.96% of dry matter accumulation, indicating that an appropriate increase in temperature can promote the growth of tomato plants. Under MHT, there was no significant difference among the various nitrogen fertiliser treatments. The dry matter accumulation was between 11.30 and 13.20 g/plant, and the dry matter accumulation was less under MHT than the values under CKT and LHT—the high temperature restricted tomato plant growth. Under severe high-temperature treatment SHT, the plants were severely stressed by the high temperature, and the dry matter accumulation was only between 9.12 and 12.05 g/plant. The dry matter accumulation under each nitrogen treatment was significantly lower than that under CKT, LHT or SHT with N2 treatment. The accumulation of dry matter was the largest in the lower part of the plant, but there were no significant differences among N2, N3 and N4 treatments.

3.2.2. Dry Matter Ratio of Tomato Plants

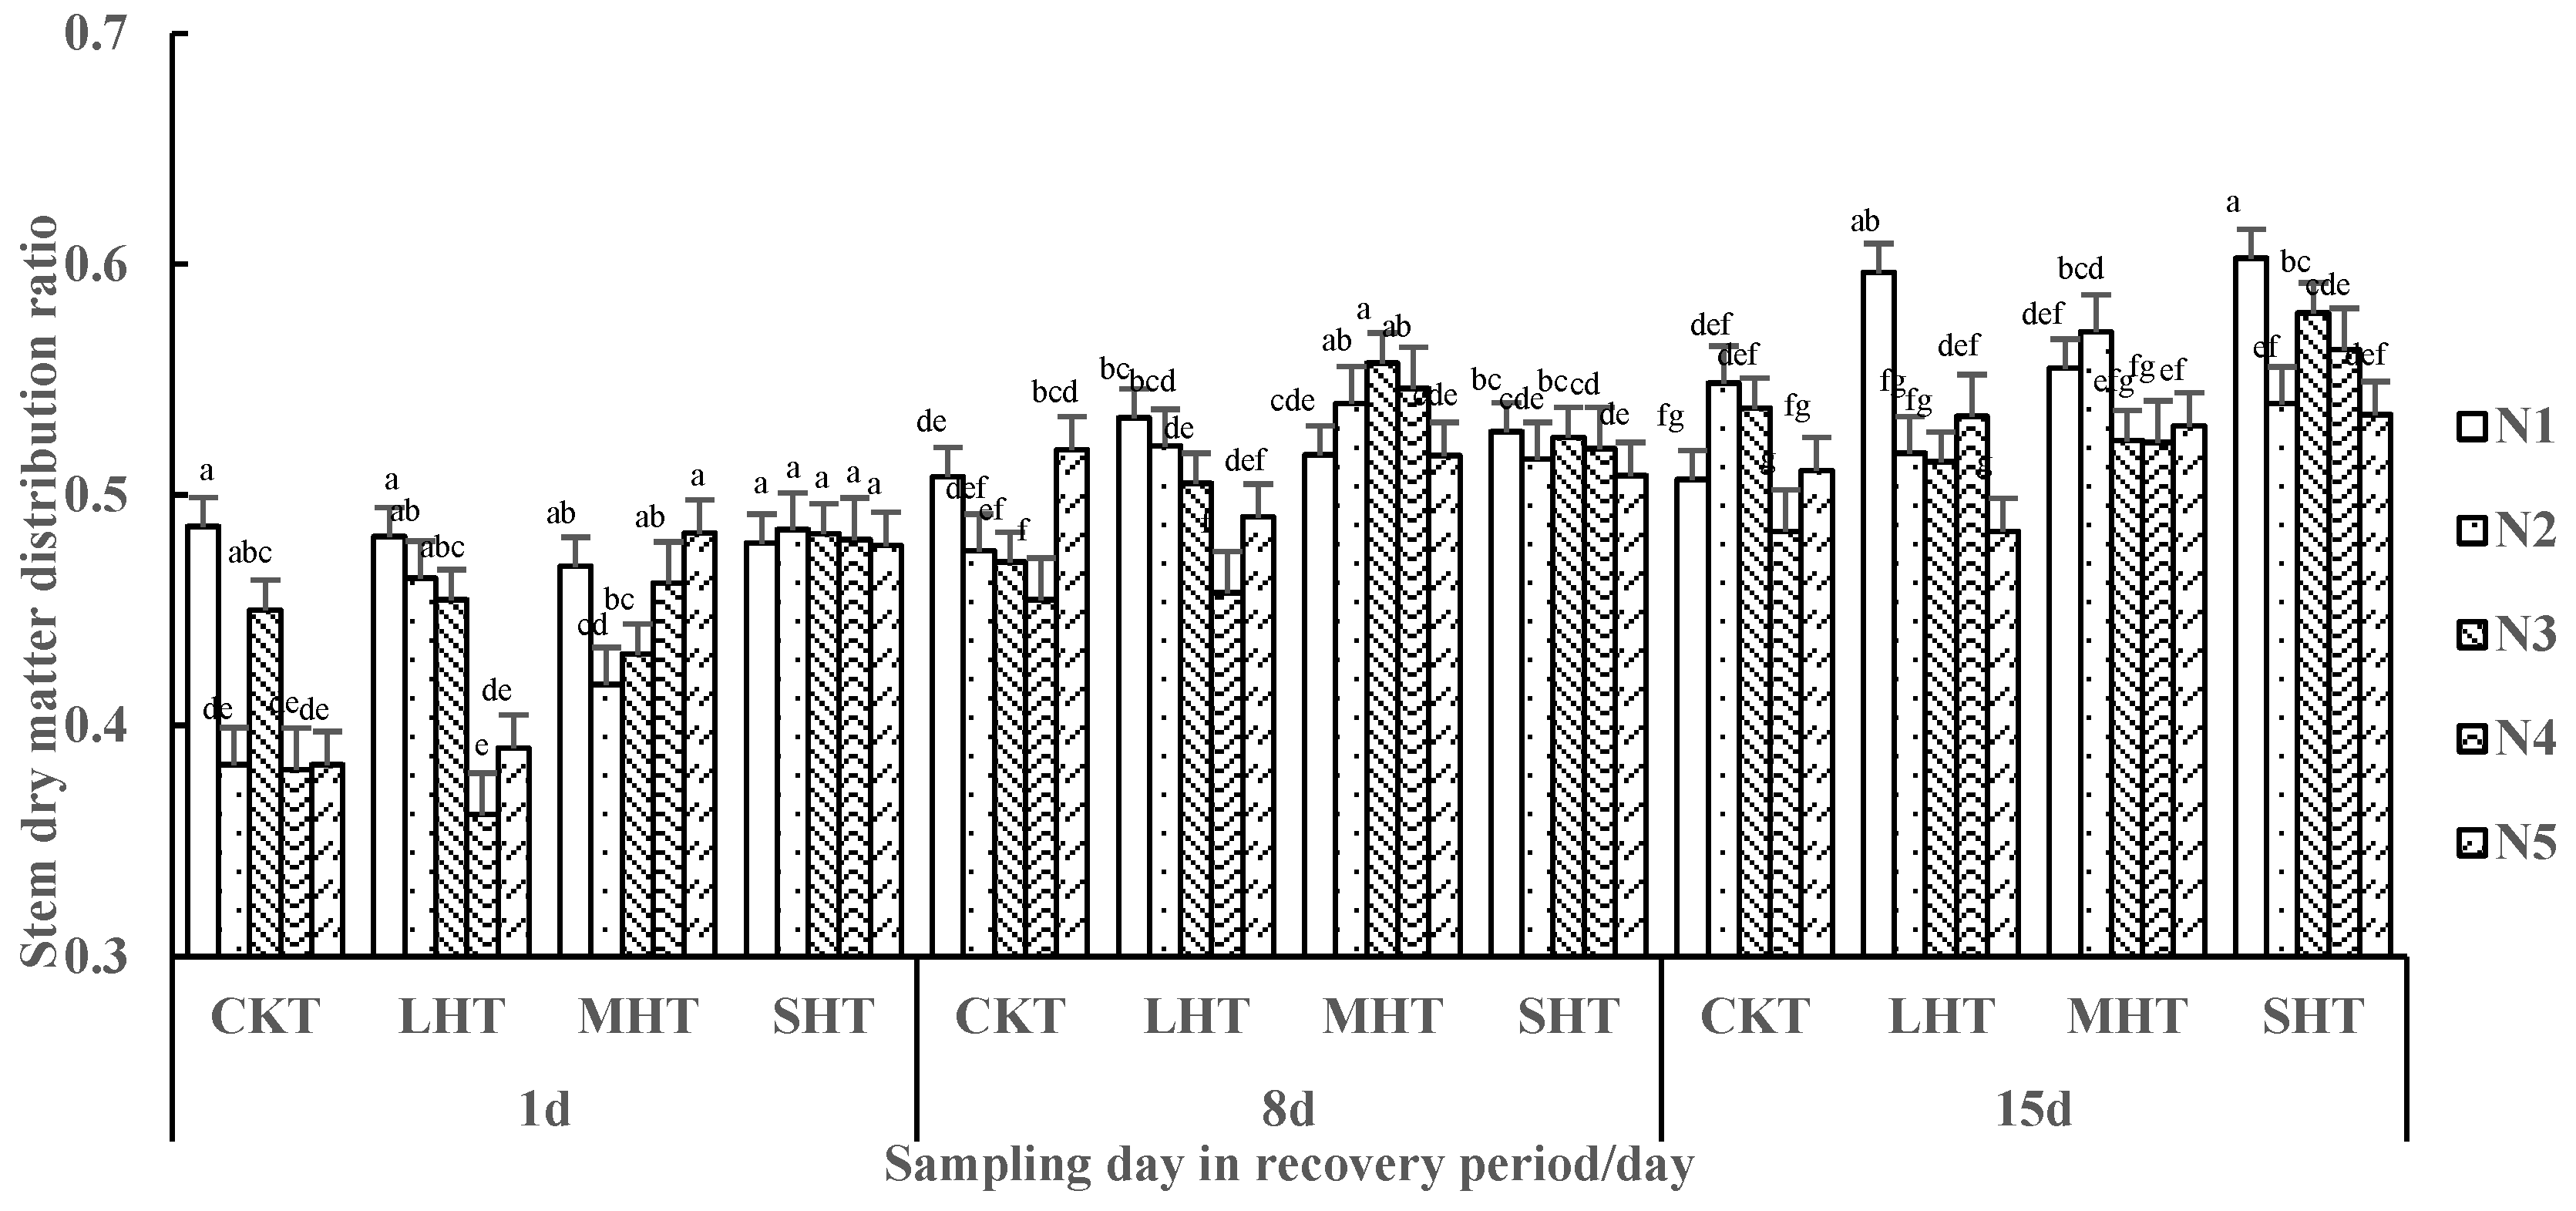
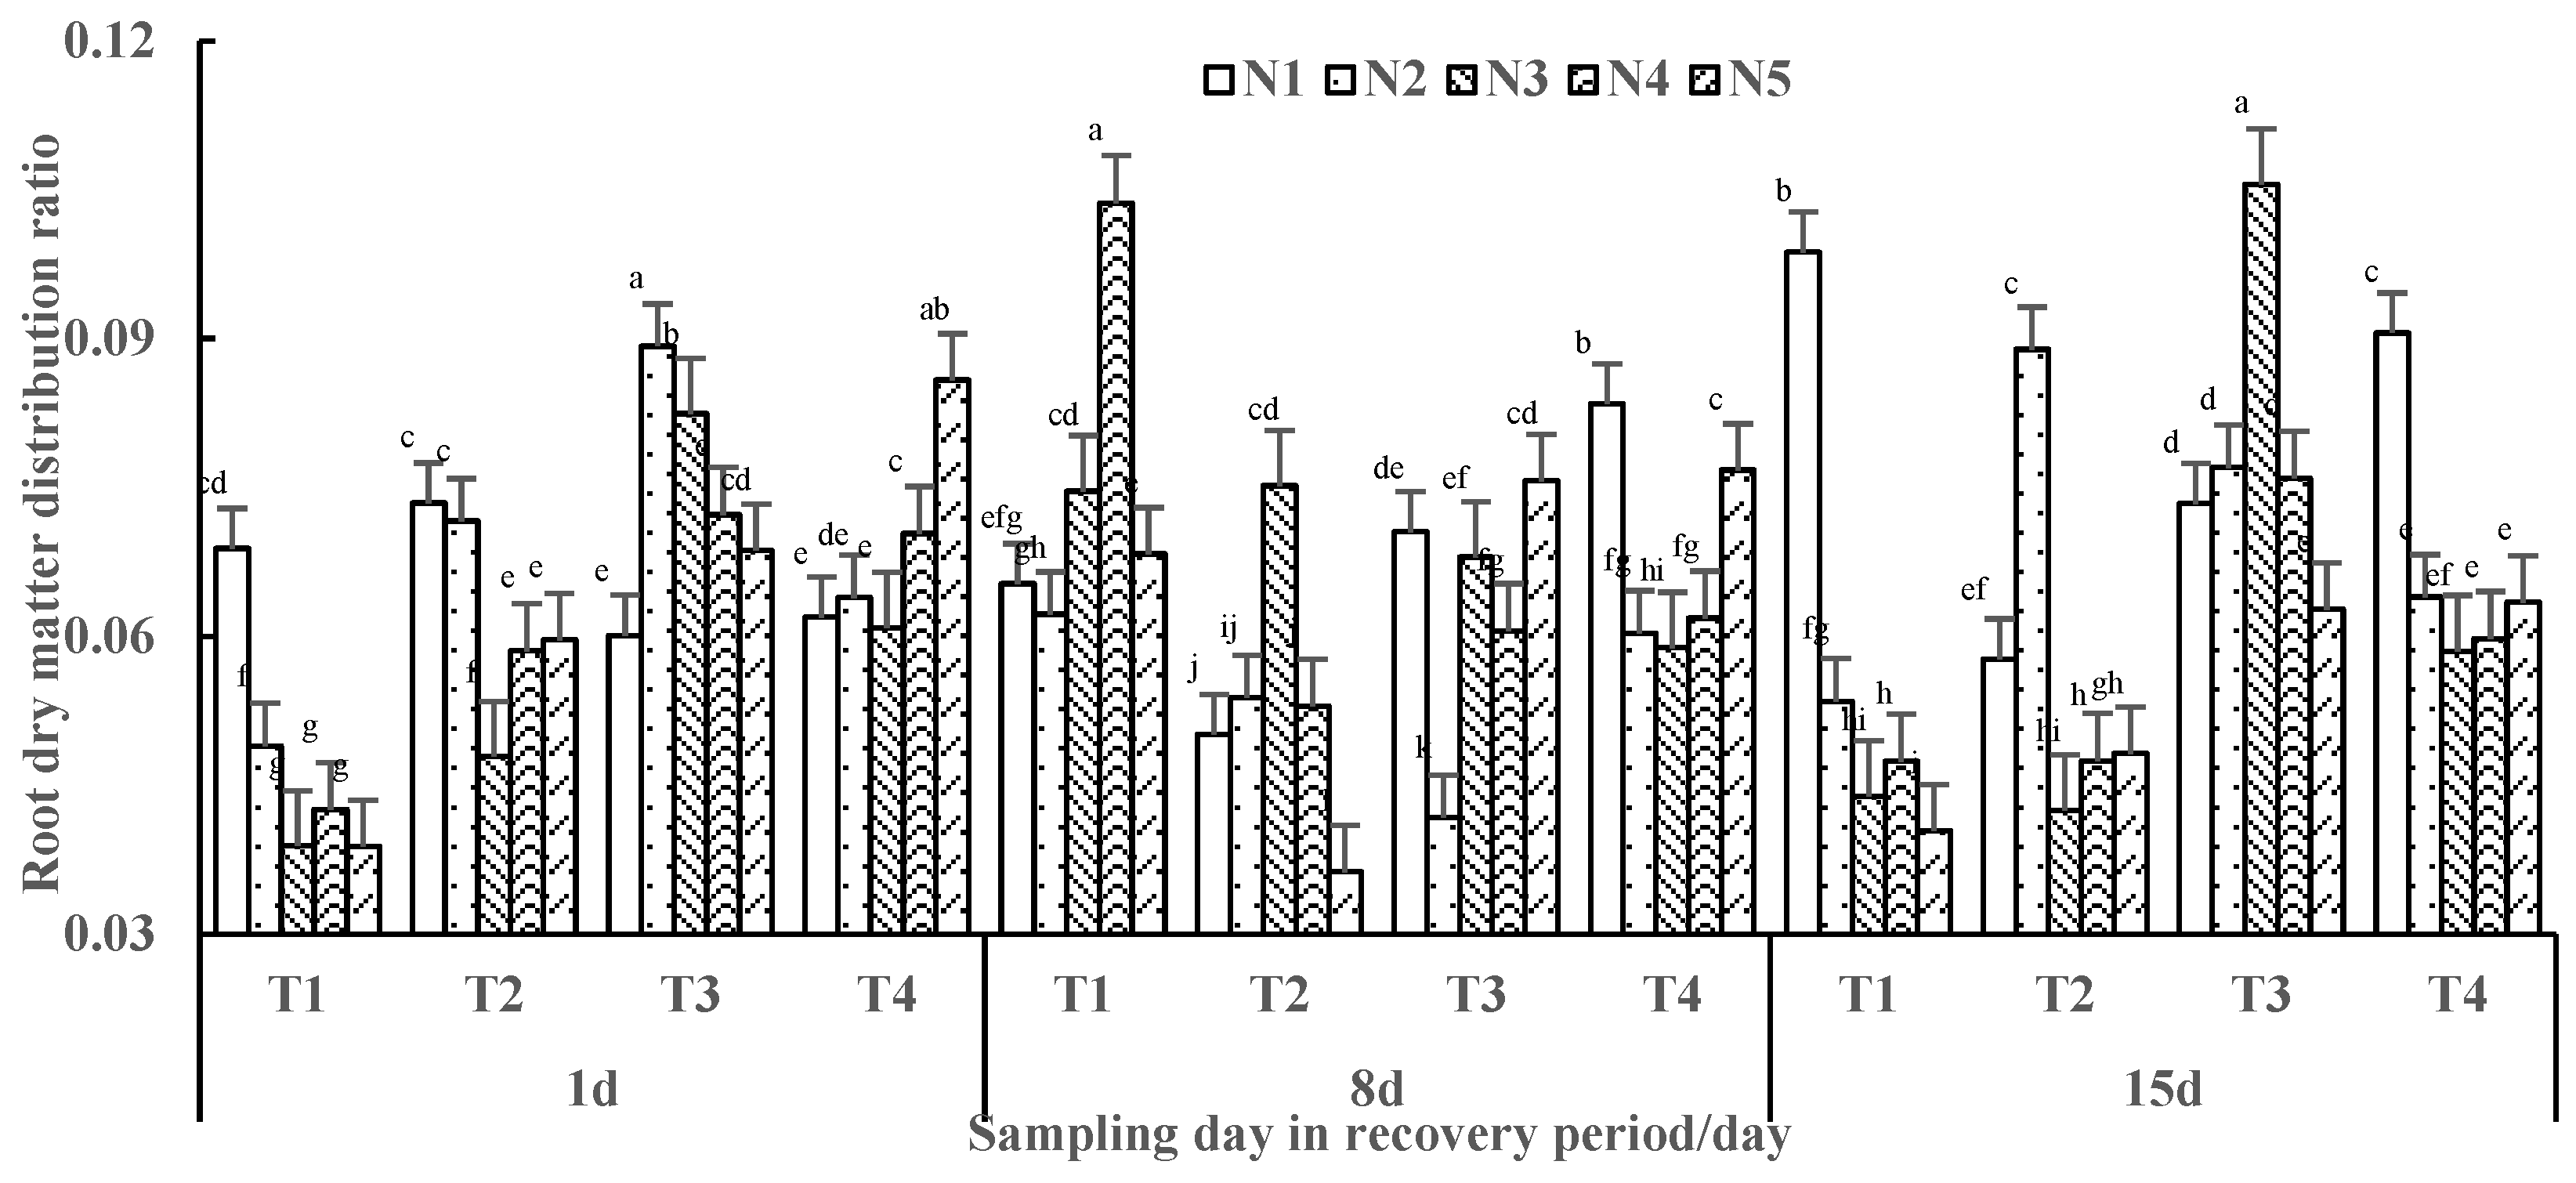
The effect of different high-temperature/nitrogen combinations on the dry matter ratio of tomato plants is shown in Figure 6. The dry matter ratios of leaves, stems and roots were 0.31–0.58, 0.36–0.60 and 0.04–0.11, respectively.
On the first day in the recovery period, as seen in Figure 6, the dry matter ratio of leaves under CKT and LHT treatments was higher than that under MHT and SHT treatments, and the dry matter ratio of the stems and roots under CKT and LHT treatments was lower than that under MHT and SHT treatments. As the degree of high-temperature stress increased, the ratio of dry matter in leaves decreased, and that of the dry matter of the stems and roots increased. Under CKT, the dry matter ratio of N1 treatment was considerably lower than the ratios of N2–N5 treatments and the ratio of N1 was only 0.44, but the dry matter ratio of roots was 0.07, which was significantly higher than the ratios of N2–N5 treatments. The difference in the dry matter ratio of leaves under N2, N4 and N5 treatments is very small, and the average ratio of the three N treatments for N2, N4 and N5 is about 0.56. Under LHT, with an increase in the nitrogen-application rate, the dry matter ratio of leaves first increased and then decreased. Under the N4 treatment, the leaf dry matter ratio was the largest (0.58), while the root dry matter ratio was smaller (0.06). Under MHT and SHT treatments, there was little difference between N1–N5 treatments, the dry matter ratio of leaves was small, and the dry matter ratio of stems was large. This result shows that when the high-temperature stress is serious, the difference in nitrogen content has little effect on the proportion of dry matter distribution of tomato plants.
It can be seen from Figure 7 that on the 8th day in the recovery period, compared with the previous sampling, the dry matter ratio of leaves under each treatment decreased, and that of stems increased. Under CKT, the dry matter ratio of leaves and roots under N4 treatment was larger, and the dry matter ratio of the stems was smaller. The dry matter ratio of the stems was the largest under the N5 treatment, while the dry matter ratio of the leaves was the largest under the N2 treatment. Under LHT, the leaf dry matter ratio under the N1 treatment was the smallest, and the stem dry matter ratio was the largest, and the leaf dry matter ratio under the N4 treatment was the largest, and the stem dry matter ratio was the smallest. Under MHT, the leaf dry matter ratio under the N3 treatment was the smallest, and the differences among the four treatments were small. The root dry matter ratio under the N2 treatment was the smallest, and the ratios under the four treatments showed little difference. Under SHT, except for the N1 treatment, the leaf dry matter ratio is the smallest, and the root dry matter ratio is the largest. The difference between the ratios was very small.
It can be seen from Figure 8 that on the 15th day of the recovery period, the differences between treatments with different nitrogen-application rates increased. Under CKT, with an increase in the nitrogen-application rate, the dry matter ratio of leaves first increased and then decreased, and the dry matter ratio of roots gradually decreased. The dry matter ratio of leaves was the largest under the N4 treatment (0.47), and the dry matter ratio of roots under the N1 treatment was the largest (0.10). Under LHT, the leaf dry matter ratio under the N1 treatment was the smallest, the stem dry matter ratio was the largest, and the root dry matter ratio under the N2 treatment was the largest (0.60). The difference between the other four nitrogen treatments was small. With an increase in the nitrogen-application rate, the dry matter ratio of leaves generally increased first and then decreased. The dry matter ratios of leaves under the N3 and N5 treatments were larger, and the stem dry matter ratio under the N5 treatment was the smallest (0.48). Under MHT, the root dry matter ratio first increased and then decreased with an increase in the nitrogen-application rate. The root dry matter ratio under the N3 treatment was the largest, and the dry matter ratios of leaves and stems did not change significantly. Under SHT with N2, the dry matter ratio of the leaves was the largest, and the dry matter ratios of the other four treatments were relatively smaller.

3.3. Effects of Different High-Temperature/Nitrogen Combinations on the Vitality of Tomato Plant Roots

At four day/night temperature levels and five nitrogen application levels in our experiment, the main effect and interaction of high temperature and nitrogen supply level on root vitality were extremely significant (p < 0.01) in the whole recovery period (Table 2).
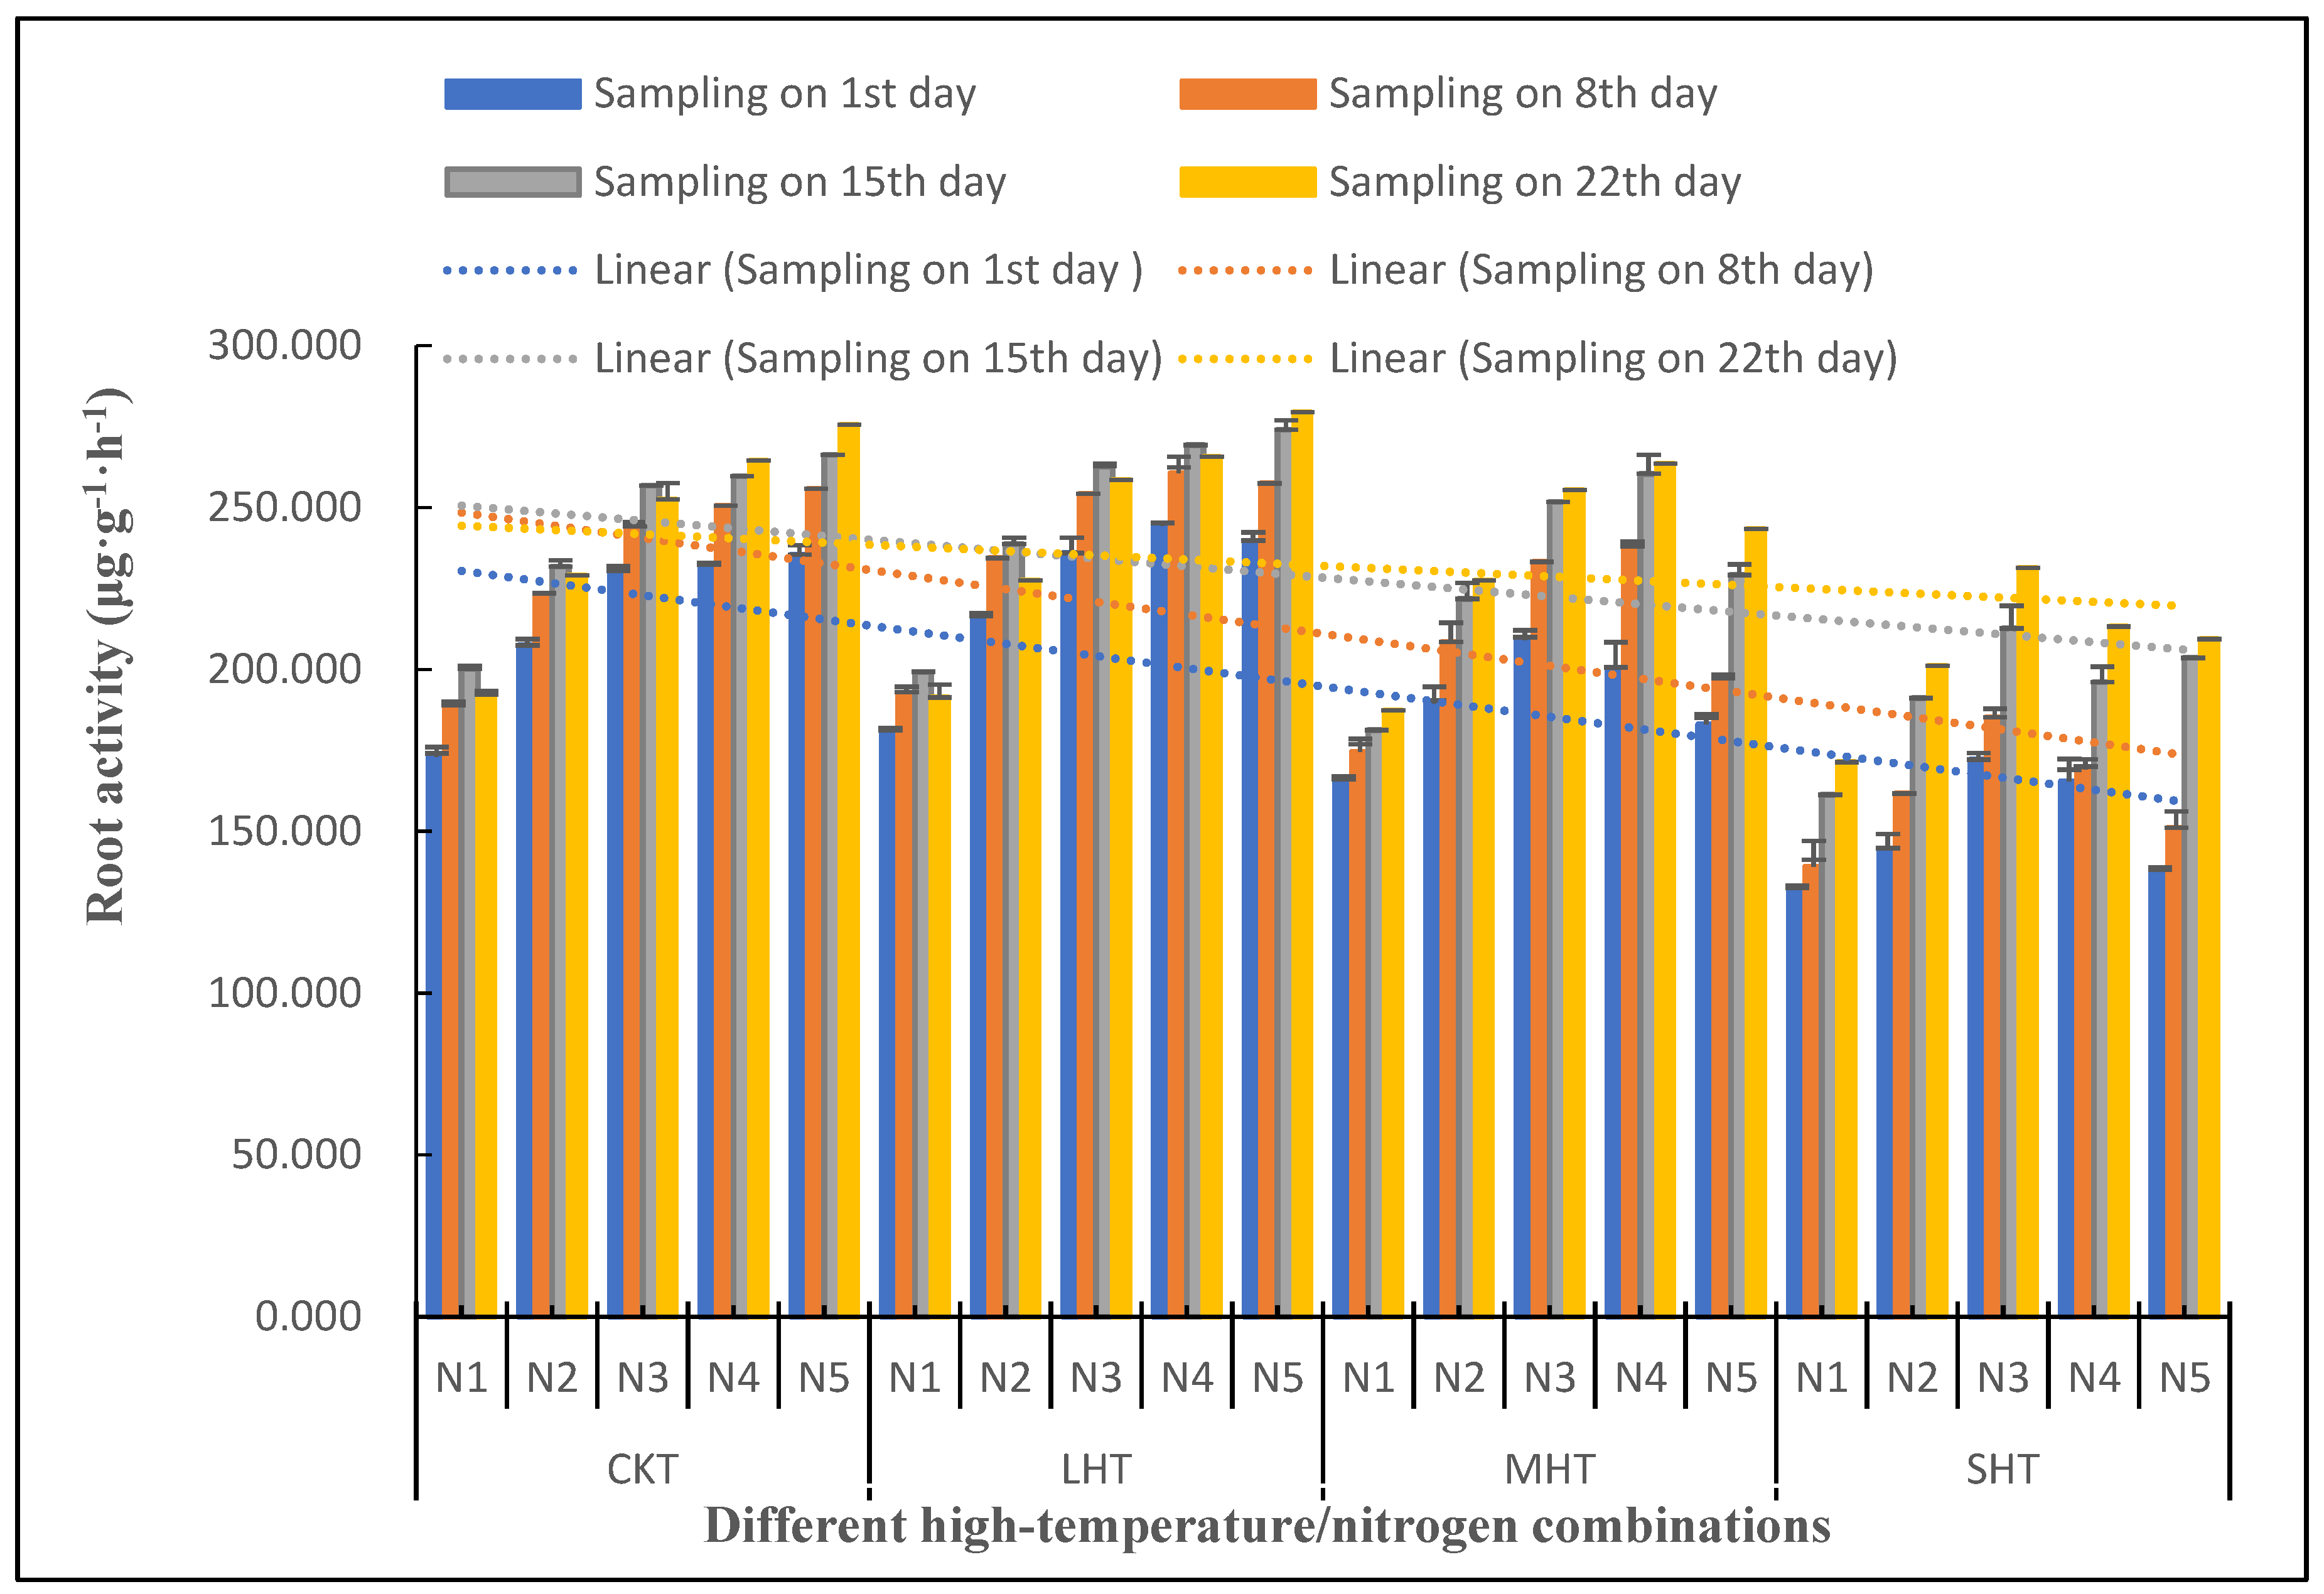
The effect of different high-temperature/nitrogen combinations on tomato plant root vitality is shown in Figure 9. Under CKT condition, the root vitality increased gradually during the whole recovery period, and with the increase in nitrogen supply, the root vitality also increased uniformly at different times in recovery periods. The root vitality under N1 treatment was the lowest with value 170–200 μg·g−1·h−1, compared to N5 with value 235–276 μg·g−1·h−1. Under LHT, the root vitality of tomato was increased under all nitrogen levels, while under MHT and SHT, high nitrogen and low nitrogen supply significantly inhibited root vitality. Lightly high-temperature stress can increase root vitality, and LHTN4 can increase by 5.15% compared with CKTN4. Under MHT, the root vitality under the five nitrogen treatments was significantly lower than under CKT and LHT. In general, the root vitality of the five nitrogen treatments decreased in the following order of treatments: N4 > N3 > N5 > N2 > N1. Under SHT, as the high-temperature stress became further severe, the root vitality under the five nitrogen treatments further decreased. On the 1st day of the recovery period, the root vitality decreased in the following order of treatments: N3 > N4 > N2 > N5 > N1. With an increase in the sampling days, the root vitality gradually increased. On the 22nd day of sampling, the root vitality decreased in the following order of treatments: N3 > N4 > N5 > N2 > N1. The root vitality under the MHT treatment was always the largest.

4. Discussion

Increased temperatures caused by climate change constitute a significant threat to agriculture and food security. High-temperature stress and nitrogen application levels had significant effects on the growth and development of tomato plants [42,43,44], which were embodied in such indicators as plant height, stem diameter, dry matter accumulation and distribution and root vitality. Dry matter accumulation and distribution affect the formation of tomato organs and provide the basis for yield [45,46]. The tomato root system is also an active absorptive and synthetic organ.
Our results reveal several key points. We found that high-temperature stress can inhibit the growth of tomato plants, thereby reducing plant height and stem diameter, and reducing nitrogen application can alleviate growth inhibition to a certain extent. High temperatures and changes in nitrogen application affect the distribution of dry matter in tomato plants. There are optimal nitrogen-application rates for the nitrogen content of tomato shoots under different high-temperature stress.
Dry matter accumulation and distribution provide a material basis for the formation of tomato yield and quality. Previous investigations have studied some prediction models suitable for dry matter accumulation [47,48]. Before fruiting, dry matter is distributed to tomato plant leaves to form a photosynthetic leaf area, and the dry matter then affects the vegetative growth of the plant [49,50]; after fruiting, dry matter is distributed in the fruit and directly affects the tomato plant yield and fruit quality [51]. High temperatures and changes in nitrogen application will affect the distribution of dry matter in tomato plants. In summary, the treatments with a larger proportion of dry matter in leaves had a smaller proportion in stems (Figure 4). Under CKT-SHT treatment, the treatments with a larger proportion of dry matter in leaves were N4, N5, N4 and N2, respectively. Under CKT and LHT treatments, the proportion of dry matter in leaves of tomato plants under the N1 treatment was significantly lower than that under the other four treatments, and the proportion of dry matter in stems under the N1 treatment was significantly higher than that under the other four treatments. Under MHT and SHT, due to more serious high-temperature stress, the dry matter allocation of tomato plants was less affected by nitrogen application, and there was no significant difference between N1–N5 treatments. Compared with CKT and LHT treatments, the dry matter proportion of stems and roots increased, while that of leaves decreased.
Then, we used the logistic equation to fit quantitatively the above-ground biomass of tomatoes and the growth process (day). The theoretical maximum of the aboveground biomass of tomatoes showed a trend of first increasing and then decreasing, indicating that MHT treatment can promote the quality of tomato dry matter accumulation. However, under LHT, MHT and SHT treatments, with an increase in the nitrogen-application rate, theoretic maximum aboveground biomass first increased and then decreased, indicating that under high-temperature treatment, appropriately reducing the amount of nitrogen fertiliser applied can alleviate the inhibitive effect of high-temperature stress on the dry matter accumulation in tomato plants.
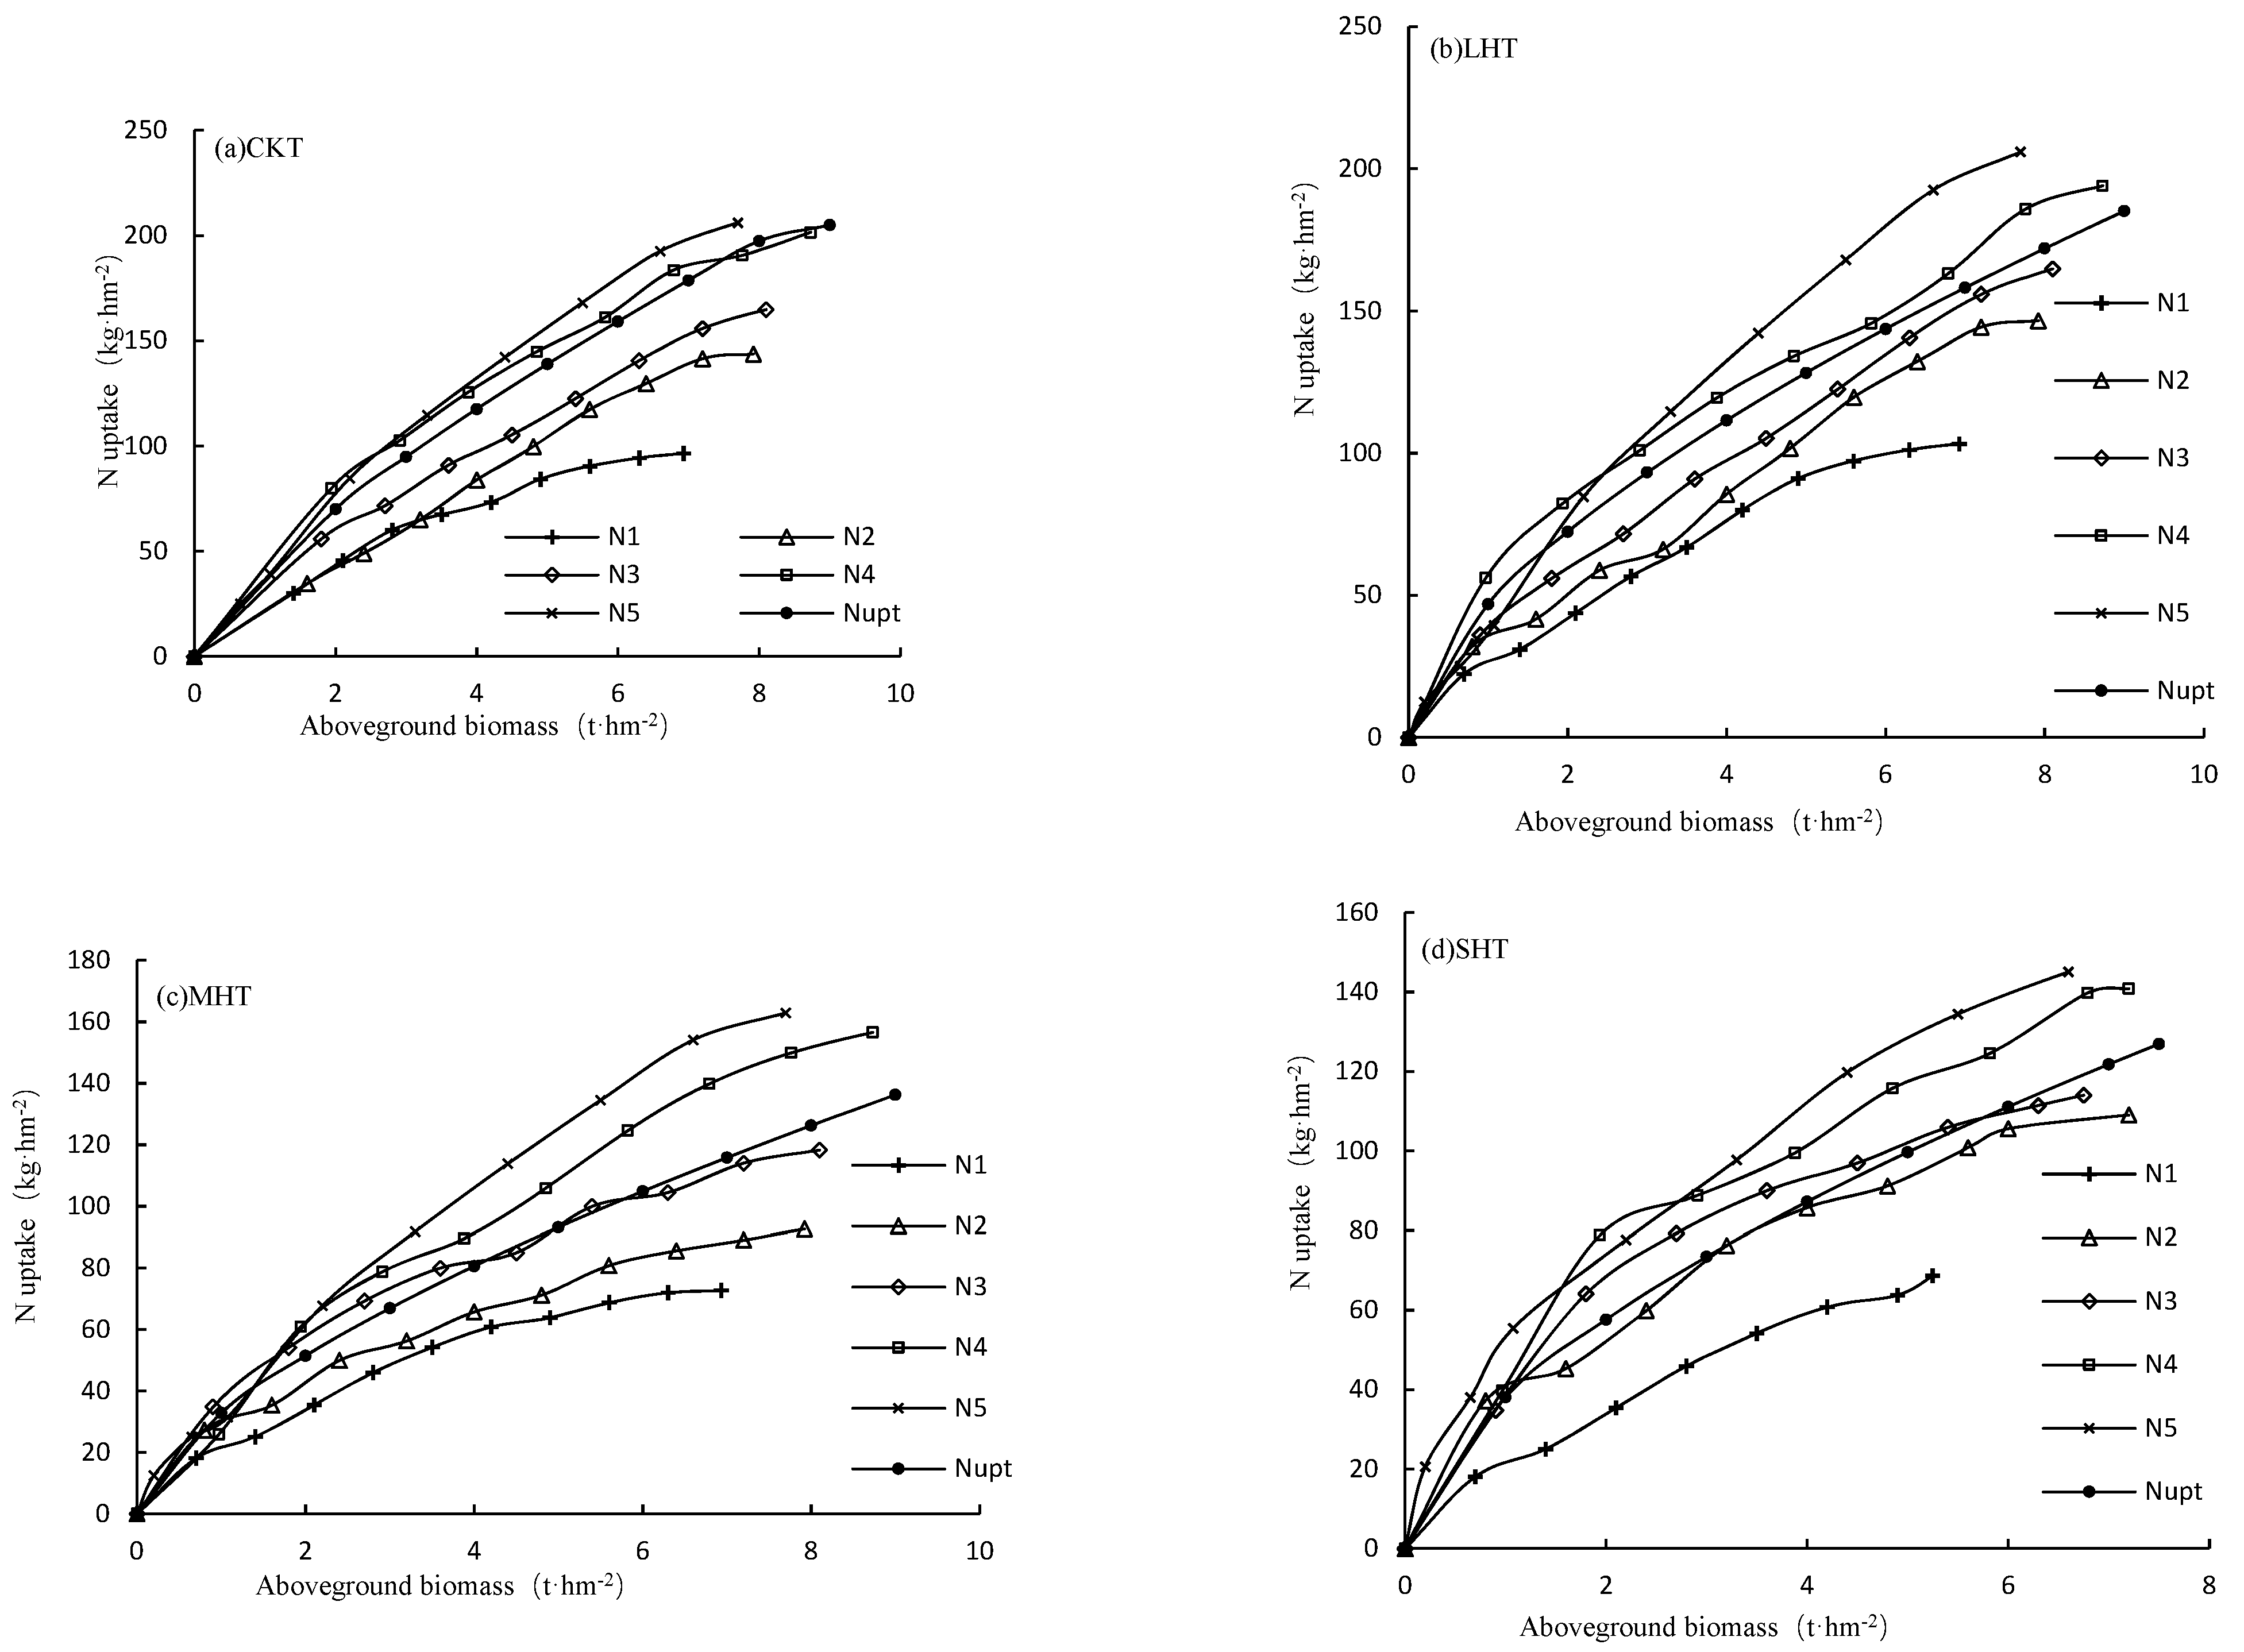
As the growth progresses, the nitrogen content of tomato plants gradually decreases, showing the phenomenon of nitrogen concentration dilution (Figure 10). With the increase in temperature, the nitrogen content of tomato shoots increased first and then decreased. Under the same temperature treatment, the nitrogen content of above-ground tomato plants in the N1 treatment in Figure 10a at any time was significantly lower than that of the other four nitrogen fertilisation treatments. With the increase in nitrogen fertilisation, the Nitrogen content of above-ground tomato plants also increased.
Under the same nitrogen treatment, CKT and LHT tomato shoots had higher nitrogen content, MHT and SHT tomato shoots had lower nitrogen content, and the nitrogen concentration dilution was lower than that of CKT and LHT treatments, indicating that the high-temperature stress was more severe. Nitrogen uptake of tomatoes in the soil was significantly reduced. Under the CKT and LHT treatments, the nitrogen content of above-ground tomato plants in the N4 and N5 treatments remained at a high level in the early stage of plant growth, and the difference was not significant. In the later stage, with the dilution of the nitrogen concentration in the soil, the nitrogen content of the tomato shoots in the N5 treatment began to increase. Under MHT and SHT treatments, the nitrogen content of tomato shoots in the N5 treatment was significantly higher than in the other four treatments.
Under the MHT and SHT treatments, although the Nitrogen content of above-ground tomato plants was higher in the N5 treatment, the tomato plants had weaker plant growth and less dry matter accumulation, while the N2, N3 and N4 treatments with lower nitrogen content could accumulate a higher amount of nitrogen. High dry matter content indicates that high nitrogen content in tomato plants is not conducive to the accumulation of dry matter under high-temperature stress. From the three-dimensional map, it can be observed that regardless of the combination of high temperature/nitrogen, there is a peak of nitrogen content in the tomato shoots, which is the optimal ratio. This finding can serve as a basis for further establishing the nitrogen diagnostic model of tomatoes under high-temperature stress. The establishment of a critical nitrogen concentration model can accurately and conveniently grasp the status of nitrogen nutrition in crops, thus providing ideas for the timely and precise application of nitrogen fertilisers.
So far, few studies have been conducted at home and abroad on the diagnosis of nitrogen nutrition in plants under high-temperature conditions, and a few studies have been conducted on the diagnosis of nitrogen nutrition in plants under different water and nitrogen conditions, which showed that under water stress, the nitrogen uptake capacity of wheat [52], grape [53] and tomato plants decreased and the amount of nitrogen required to be applied decreased, which is consistent with the results of this study that tomato plants under high-temperature stress had increased nitrogen uptake capacity. Ru, C. et al. [54] evaluated the role of nitrogen (N) in modulating the effects of post-anthesis short-term heat, drought and their combination stress on photosynthesis, N metabolism-related enzymes, the accumulation of N and protein and growth, as well as on the yield and water (WUE) and N use efficiency (NUE) of wheat after stress treatment. They revealed that N1 application was conducive to improving the productivity, WUE and NUE of wheat when exposed to post-anthesis combined stress. The current data indicated that under short-term individual heat and drought stress after anthesis, appropriately increasing N application effectively improved the growth and physiological activity of wheat compared with N1, alleviating the reduction in yield, WUE and NUE. However, under combined stress conditions, reducing N application (N1) may be a suitable strategy to compensate for the decrease in yield, WUE and NUE. This is consistent with the results of the present study that tomato plants under high-temperature stress had increased nitrogen uptake and reduced nitrogen application. This is probably due to the fact that high temperatures accelerated transpiration in tomatoes, and water is a carrier for transporting nitrogen, and the accelerated nitrogen transport resulted in an increased nitrogen uptake capacity of the tomato plants. Under high-temperature conditions at MHT and SHT, some N4 and N5 treatments even showed seedling burn due to excessive nitrogen uptake, resulting in restricted growth and reduced aboveground biomass accumulation in tomato plants. Therefore, although the level of nitrogen content in tomato plants was high, it still seemed unfavorable for nitrogen accumulation overall due to too little biomass accumulation.
Our result shows that at the same level of N application, the theoretical maximum value of the above-ground biomass of tomatoes tended to increase and then decrease as the degree of high-temperature treatment increased, indicating that MHT treatment could promote the accumulation of dry matter mass of tomatoes. At the same time, higher temperature was not conducive to the accumulation of dry matter mass of tomatoes (Table 4). Under CKT, the theoretical maximum aboveground biomass of tomato increased with increasing N application, while under LHT, MHT and SHT, it showed a trend of increasing and then decreasing with increasing N application, indicating that the inhibition of tomato’s dry matter mass accumulation caused by high-temperature stress could be alleviated by appropriately reducing N fertiliser application under high-temperature treatment.
The regulation mechanism and period of nitrogen on tomato growth in a greenhouse under different degrees of high-temperature stress were different. Our results showed that mild high-temperature stress could make a tomato obtain a certain resistance to high-temperature stress, and an appropriate amount of nitrogen application can promote plant recovery, and make tomato plant growth better than the control group, for example, a plant height of 80.21 cm under LHT-N4 is higher than that of 71.11 cm under CKT-N4 on 15th day of the recovery period, while at the four temperature treatments, nitrogen at the beginning of recovery period had no significant effect on plant height and other growth indexes.
The growth and activity level of the root system directly affects the nutrient status and yield level of the shoot. Roots play an important role in plant nutrient and water acquisition. Under CKT, root activity increased with the increase in nitrogen application rate. On the 15th day, the root activity of N4 was the highest, with a value of 264.480. Compared with CKT, axial roots and lateral roots grow more under the condition of short-term nitrogen supply [55]. However, long-term chronic nitrogen deficiency can inhibit lateral root growth [56]. Lateral roots (LRs) are more sensitive to changes in nitrogen supply and other environmental signals than primary roots [57]. Under SHT, the root activity of N3 was the highest (172.090 to 231.433 μg·g−1·h−1), and that of N4 was 165.407–213.244 μg·g−1·h−1. Below N3, the root activity was significantly reduced by nitrogen reduction, and the root activity of N1 was 23.26% lower than that of N3. Above N3, high nitrogen significantly inhibited root activity, and the root activity of N5 was 19.77% lower than that of N3. In general, root activity under low nitrogen was greater than that under high nitrogen, and the maximum value of root activity shifted below the recommended value.

5. Conclusions

In a certain temperature range, increasing the amount of nitrogen can increase the vitality of tomato roots in the flowering and fruiting stages. Under certain high-temperature conditions (MHT, SHT), tomato plants in the high nitrogen treatments (N4, N5) showed seedling burn due to excessive nitrogen uptake, at which time. However, the above-ground nitrogen levels of the tomato plants were high, the growth of the tomato plants was restricted and the above-ground biomass accumulation was low. Therefore, the high nitrogen treatment under high-temperature stress appeared to be detrimental to tomato growth overall. In the case of facility tomatoes, a reduction in N application above certain high-temperature conditions (MHT and SHT) would be beneficial to the recovery of tomatoes from heat stress. Both low and high nitrogen supplies were not conducive to the recovery of greenhouse tomatoes after high-temperature stress. Appropriate nitrogen application can alleviate the damage caused by high-temperature stress on tomato plants and enhance the resistance of tomato plants, while excessive nitrogen application will aggravate the damage degree of tomato plants. In this study, the optimal nitrogen application rates under CKT-SHT treatment were 2.6, 2.6, 1.95 and 1.3 g/plant, respectively.

Author Contributions

Conceptualization, C.L. and Z.Y.; methodology, Z.Y.; software, C.L. and J.L.; validation, Z.Y., C.Z. and R.Q.; formal analysis, Z.Y. and F.Z.; investigation, C.L.; resources, Z.Y.; data curation, C.L.; writing—original draft preparation, C.L. and Z.Y.; writing—review and editing, C.L., C.Z. and Z.Y.; visualization, C.Z.; supervision, Z.Y.; project administration, J.L.; funding acquisition, Z.Y. All authors have read and agreed to the published version of the manuscript.

Funding

This research was funded by the National Natural Science Foundation of China, grant number 41975142. This research was funded by the National Key Research and Development Plan of China, grant number 2019YFD1002202.

Data Availability Statement

All data are presented in this article in the form of figures and tables.

Acknowledgments

We thank the anonymous reviewers for their constructive comments and suggestions on revising the manuscript. We also thank Funian Zhao for his kind help in the English editing of the manuscript.

Conflicts of Interest

The authors declare no conflict of interest.

References

  1. Tubiello, F.N.; Soussana, J.F.; Howden, S.M. Crop and pasture response to climate change. Proc. Natl. Acad. Sci. USA 2007, 104, 19686–19690. [Google Scholar] [CrossRef] [PubMed]
  2. Kotak, S.; Larkindale, J.; Lee, U.; von Koskull-Döring, P.; Vierling, E.; Scharf, K.-D. Complexity of the heat stress response in plants. Curr. Opin. Plant Biol. 2007, 10, 310–316. [Google Scholar] [CrossRef]
  3. El-Gizawy, A.; Gomaa, H.; El-Habbasha, K.; Mohamed, S. Effect of different shading levels on tomato plants 1. Growth, flowering and chemical composition. Acta Hortic. 1993, 323, 341–348. [Google Scholar] [CrossRef]
  4. Johnson, R.C.; Kanemasu, E.T. Yield and Development of Winter Wheat at Elevated Temperatures. Agron. J. 1983, 75, 561. [Google Scholar] [CrossRef]
  5. De Koning, A. Development and Dry Matter Distribution in Glasshouse Tomato: A Quantitative Approach; Wageningen Agricultural University: Wageningen, The Netherlands, 1994; pp. 102–240. [Google Scholar]
  6. Bertin, N.; Guichard, S.; Leonardi, C.M.; Longuenesse, J.J.; Langlois, D.; Navez, B. Seasonal Evolution of the Quality of Fresh Glasshouse Tomatoes under Mediterranean Conditions, as Affected by Air Vapour Pressure Deficit and Plant Fruit Load. Ann. Bot. 2000, 85, 741–750. [Google Scholar] [CrossRef]
  7. Adams, S.R.; Cockshull, K.E.; Cave, C. Effect of temperature on the growth and development of tomato fruits. Ann. Bot. 2001, 5, 869–877. [Google Scholar] [CrossRef]
  8. Amarjeet, B.; Mohini, S.; Sangeeta, S. Allelopathic effects of Parthenium hysteron phorus on the chlorophyll nitrogen, protein and ascorbic acid content of Lantana camara. Alleopathy J. 2005, 15, 305–310. [Google Scholar]
  9. Rohn, S.; Rawel, H.M.; Kroll, J. Inhibitory Effects of Plant Phenols on the Activity of Selected Enzymes. J. Agric. Food Chem. 2002, 50, 3566–3571. [Google Scholar] [CrossRef]
  10. Cruz, R.; Ayala, C.G.; Anaya, A.L. Allelochemical stress pro-duced by the aqueous leachates of Callicarpa acuminata: Effection roots of beans, maize and tomato. Physiol. Piantarum 2002, 116, 20–27. [Google Scholar] [CrossRef]
  11. Mary, M.; Peet, D.H.; Willits, R. Response of ovule development and post-pollen production processes in male-sterile tomatoes to chronic, sub-acute high-temperature stress. J. Exp. Bot. 1997, 48, 67–74. [Google Scholar]
  12. Holder, R.; Cockshull, K.E. Effects of humidity on the growth and yield of glasshouse tomatoes. J. Hortic. Sci. 1990, 65, 31–39. [Google Scholar] [CrossRef]
  13. Lingling, X.; Fangying, T. The impact of climate on agricultural production in the spring of 2015. Chin. Agric. Meteorol. 2015, 36, 372–373. [Google Scholar]
  14. El Ahmadi, A.B.; Stevens, M.A. Reproductive Responses of Heat-tolerant Tomatoes to High Temperatures1. J. Am. Soc. Hortic. Sci. 1979, 104, 686–691. [Google Scholar] [CrossRef]
  15. James, D.; Borphukan, B.; Fartyal, D.; Ram, B. Concurrent overexpression of OsGS1; 1 and OsGS2 Genes in transgenic rice (Oryza sativa L.): Impact on tolerance to abiotic stresses. Front. Plant Sci. 2018, 9, 786–804. [Google Scholar] [CrossRef] [PubMed]
  16. Zhu, R.; Mu, Y.; Kang, J.; Zhao, J.; Wu, H. Effects of different nitrogen application rates on chlorophyll content and fluorescence characteristics of spring wheat with high temperature after anthesis. South J. Agric. Sci. 2017, 48, 609–615. [Google Scholar]
  17. Jingjing, Z.D. Effect Mechanism of Different Nitrogen Application Rates on Yield Formation of Spring Wheat under High Temperature Stress after Anthesis. Ph.D. Thesis, Ningxia University, Yinchuan, China, 2015. [Google Scholar]
  18. Dupont, F.M.; Hurkman, W.J.; Vensel, W.H.; Tanaka, C.; Kothari, K.M.; Chung, O.K.; Altenbach, S.B. Protein accumulation and composition in wheat grains: Effects of mineral nutrients and high temperature. Eur. J. Agron. 2006, 25, 96–107. [Google Scholar] [CrossRef]
  19. Zahedi, M.; McDonald, G.; Jenner, C.F. Nitrogen supply to the grain modifies the effects of temperature on starch and protein accumulation during grain filling in wheat. Aust. J. Agric. Res. 2004, 55, 551–564. [Google Scholar] [CrossRef]
  20. Pressman, E.; Peet, M.M.; Pharr, D.M. The Effect of Heat Stress on Tomato Pollen Characteristics is Associated with Changes in Carbohydrate Concentration in the Developing Anthers. Ann. Bot. 2002, 90, 631–636. [Google Scholar] [CrossRef]
  21. Xu, J.; Wolters-Arts, M.; Mariani, C.; Huber, H.; Rieu, I. Heat stress affects vegetative and reproductive performance and trait correlations in tomato (Solanum lycopersicum). Euphytica 2017, 213, 156. [Google Scholar] [CrossRef]
  22. Camejo, D.; Rodríguez, P.; Morales, M.A.; Dell’Amico, J.M.; Torrecillas, A. High temperature effects on photosynthetic activity of two tomato cultivars with different heat susceptibility. J. Plant Physiol. 2005, 162, 281–289. [Google Scholar] [CrossRef]
  23. Francesca, S.; Arena, C.; Hay Mele, B.; Schettini, C.; Ambrosino, P.; Barone, A.; Rigano, M.M. The Use of a Plant-Based Biostimulant Improves Plant Performances and Fruit Quality in Tomato Plants Grown at Elevated Temperatures. Agronomy 2020, 10, 363. [Google Scholar] [CrossRef]
  24. Changfu, R.; Anhe, C.; Baoguo, L. Physiological and biochemical basis of the effect of high temperature on flowering and fruiting of hybrid rice. J. Southwest Univ. (Nat. Sci. Ed.) 1990, 5, 440–443. [Google Scholar]
  25. Naiyao, M.D. Mitigation Effect and Physiological Mechanism of Nitrogen Fertilizer on High Temperature Stress in the Early Stage of Grain Filling in Rice. Ph.D. Thesis, Nanjing Agricultural University, Nanjing, China, 2016. [Google Scholar]
  26. Xuejun, Z.; Ying, Z.; Xiaoqun, C.; Lishu, W.; Chengxiao, H. Effects of nitrogen application rate in drip irrigation on vegetable yield, nitrogen balance and soil nitrate accumulation in two years. China Agric. Sci. 2007, 11, 2535–2545. [Google Scholar]
  27. Huimin, J.; Jianfeng, Z.; Juncheng, Y.; Xiaozong, S.; Zhaohui, L.; Lihua, J. Effects of different nitrogen fertilizer dosages on the yield, quality and soil nitrate nitrogen accumulation of facility tomato. J. Agric. Environ. Sci. 2010, 29, 2338–2345. [Google Scholar]
  28. Xin, W.; Fuyu, M.; Ming, D.; Huam, F. Dynamic simulation of plant growth, nitrogen accumulation and utilization of processed tomato under different nitrogen application levels. Chin. J. Appl. Ecol. 2014, 25, 1043–1050. [Google Scholar]
  29. Jiqing, W.; Sheping, L. Effects of nitrogen application rate on tomato growth and nitrogen utilization efficiency. Henan Agric. Sci. 2015, 44, 94–97. [Google Scholar]
  30. Zhongliang, L.; Junjie, G.; Duanyin, G.; Yanyan, Z.; Juan, J.; Shiqi, L.; Xiaofei, T. Effects of nitrogen application rate on quality, yield and nutrient uptake of tomato cultivated in facility substrates. Resour. Environ. Arid. Reg. 2019, 33, 163–167. [Google Scholar]
  31. Bo, J.; Ning, N.; Wenlong, Z.; Ming, D. Effects of different nitrogen application rates on the growth and soil nitrogen balance of processed tomato. Xinjiang Agric. Sci. 2020, 57, 1830–1838. [Google Scholar]
  32. Jin, Z.; Yanghuan, W.; Fang, C.; Xuejie, M. Effects of nitrogen application on the growth and development, quality and yield of tomato under drip irrigation. Xinjiang Agric. Sci. 2020, 57, 498–506. [Google Scholar]
  33. Liang, L.; Ridoutt, B.; Lal, R.; Wang, D.; Wu, W.; Peng, P.; Hang, S.; Wang, L.; Zhao, G. Nitrogen footprint and nitrogen use efficiency of greenhouse tomato production in North China. J. Clean. Prod. 2018, 208, 285–296. [Google Scholar] [CrossRef]
  34. Yi, Z.; Yu, S.; Xiaohui, H.; Zhirong, Z.; Kai, C.; Hao, Z. Effects of exogenous Spd on nitrogen metabolism and content of main mineral elements in tomato seedlings under saline-alkali stress. Chin. J. Appl. Ecol. 2013, 24, 1401–1408. [Google Scholar]
  35. Lam, H.-M.; Coschigano, K.T.; Oliveira, I.C.; Melo-Oliveira, R.; Coruzzi, G.M. The molecular-genetics of nitrogen assimilation into amino acids in higher plants. Annu. Rev. Plant Physiol. Plant Mol. Biol. 1996, 47, 569–593. [Google Scholar] [CrossRef] [PubMed]
  36. Ye, Y. Effects of Light-Nitrogen Interaction on Tomato Carbon and Nitrogen Metabolism. Master’s Thesis, Northeast Agricultural University, Harbin, China, 2008. [Google Scholar]
  37. Jaynes, D.B.; Colvin, T.S. Corn Yield and Nitrate Loss in Subsurface Drainage from Midseason Nitrogen Fertilizer Application. Agron. J. 2006, 98, 1479–1487. [Google Scholar] [CrossRef]
  38. Li, J.S.; Yang, Z.Q.; Li, Y.X. Establishment of critical nitrogen dilution curve model and nitrogen nutrition diagnosis of grapes under different water conditions. Chin. J. Agric. Meteorol. 2019, 40, 523–533. [Google Scholar]
  39. Lin, W.; Zaiqiang, Y.; Mingtian, W.; Shiqiong, Y.; Xia, C.; Jie, Z. The effect of relative air humidity on the nutrient content and dry matter distribution of tomato seedlings under high temperature. Chin. J. Agric. Meteorol. 2018, 39, 304–313. [Google Scholar]
  40. Wei, T.T.; Yang, Z.Q.; Wang, L. Hourly temperature simulation model in glass and plastic greenhouses. Chin. J. Agric. Meteorol. 2018, 39, 26–37. [Google Scholar]
  41. Lin, M.-Y.; Chai, K.-H.; Ko, S.-S.; Kuang, L.-Y.; Lur, H.-S.; Charng, Y.-Y. A Positive Feedback Loop between HEAT SHOCK PROTEIN101 and HEAT STRESS-ASSOCIATED 32-KD PROTEIN Modulates Long-Term Acquired Thermotolerance Illustrating Diverse Heat Stress Responses in Rice Varieties. Plant Physiol. 2014, 164, 2045–2053. [Google Scholar] [CrossRef]
  42. Heuvelink, E. Effect of temperature on biomass allocation in tomato (Lycopersicon esculentum). Physiol. Plant. 1995, 94, 447–452. [Google Scholar] [CrossRef]
  43. Heuvelink, E. Growth, development and yield of a tomato crop: Periodic destructive measurements in a greenhouse. Sci. Hortic. 1995, 61, 77–99. [Google Scholar] [CrossRef]
  44. Heuvelink, E. Effect of fruit load on dry matter partitioning in tomato. Sci. Hortic. 1997, 69, 51–59. [Google Scholar] [CrossRef]
  45. Heuvelink, E.; Marcelis, L. Dry matter distribution in tomato and cucumber. Acta Hortic. 1989, 260, 149–180. [Google Scholar] [CrossRef]
  46. Heuvelink, E.; Buiskool, R.P. Influence of Sink-Source Interaction on Dry Matter Production in Tomato. Ann. Bot. 1995, 75, 381–389. [Google Scholar] [CrossRef]
  47. Heuvelink, E. Dry Matter Production in a Tomato Crop: Measurements and Simulation. Ann. Bot. 1995, 75, 369–379. [Google Scholar] [CrossRef]
  48. Heuvelink, E. Dry Matter Partitioning in Tomato: Validation of a Dynamic Simulation Model. Ann. Bot. 1996, 77, 71–80. [Google Scholar] [CrossRef]
  49. Dong, Q.; Louarn, G.; Wang, Y.; Barczi, J.F.; de Reffye, P. Does the structure–function model greenlab deal with crop phenotypic plasticity induced by plant spacing? A case study on tomato. Ann. Bot. 2008, 101, 1195–1206. [Google Scholar] [CrossRef]
  50. Magaña, R.H.; Adamowicz, S.; Pagès, L. Diel changes in nitrogen and carbon resource status and use for growth in young plants of tomato (Solanum lycopersicum). Ann. Bot. 2009, 103, 1025–1037. [Google Scholar] [CrossRef]
  51. Wiechers, D.; Kahlen, K.; Stützel, H. Dry matter partitioning models for the simulation of individual fruit growth in greenhouse cucumber canopies. Ann. Bot. 2011, 108, 1075–1084. [Google Scholar] [CrossRef]
  52. Fan, Y.; Lv, Z.; Li, Y.; Qin, B.; Song, Q.; Ma, L.; Wu, Q.; Zhang, W.; Ma, S.; Ma, C.; et al. Salicylic Acid Reduces Wheat Yield Loss Caused by High Temperature Stress by Enhancing the Photosynthetic Performance of the Flag Leaves. Agronomy 2022, 12, 1386. [Google Scholar] [CrossRef]
  53. Stafne, E.T.; Carroll, B.L. Simulated Abiotic Injury Alters Yields of Southern Interspecific Hybrid Grape Cultivars. Horticulturae 2019, 5, 44. [Google Scholar] [CrossRef]
  54. Ru, C.; Hu, X.; Chen, D.; Song, T.; Wang, W.; Lv, M.; Hansen, N.C. Nitrogen Modulates the Effects of Short-Term Heat, Drought and Combined Stresses after Anthesis on Photosynthesis, Nitrogen Metabolism, Yield, and Water and Nitrogen Use Efficiency of Wheat. Water 2022, 14, 1407. [Google Scholar] [CrossRef]
  55. Tian, Q.; Chen, F.; Zhang, F.; Mi, G. Possible Involvement of Cytokinin in Nitrate-mediated Root Growth in Maize. Plant Soil 2005, 277, 185–196. [Google Scholar] [CrossRef]
  56. Wang, Y.; Mi, G.; Chen, F.; Zhang, J.; Zhang, F. Response of root morphology to nitrate supply and its contribution to nitrogen accumulation in maize. J. Plant Nutr. 2005, 27, 2189–2202. [Google Scholar] [CrossRef]
  57. Tian, H.; De Smet, I.; Ding, Z. Shaping a root system: Regulating lateral versus primary root growth. Trends Plant Sci. 2014, 19, 426–431. [Google Scholar] [CrossRef] [PubMed]
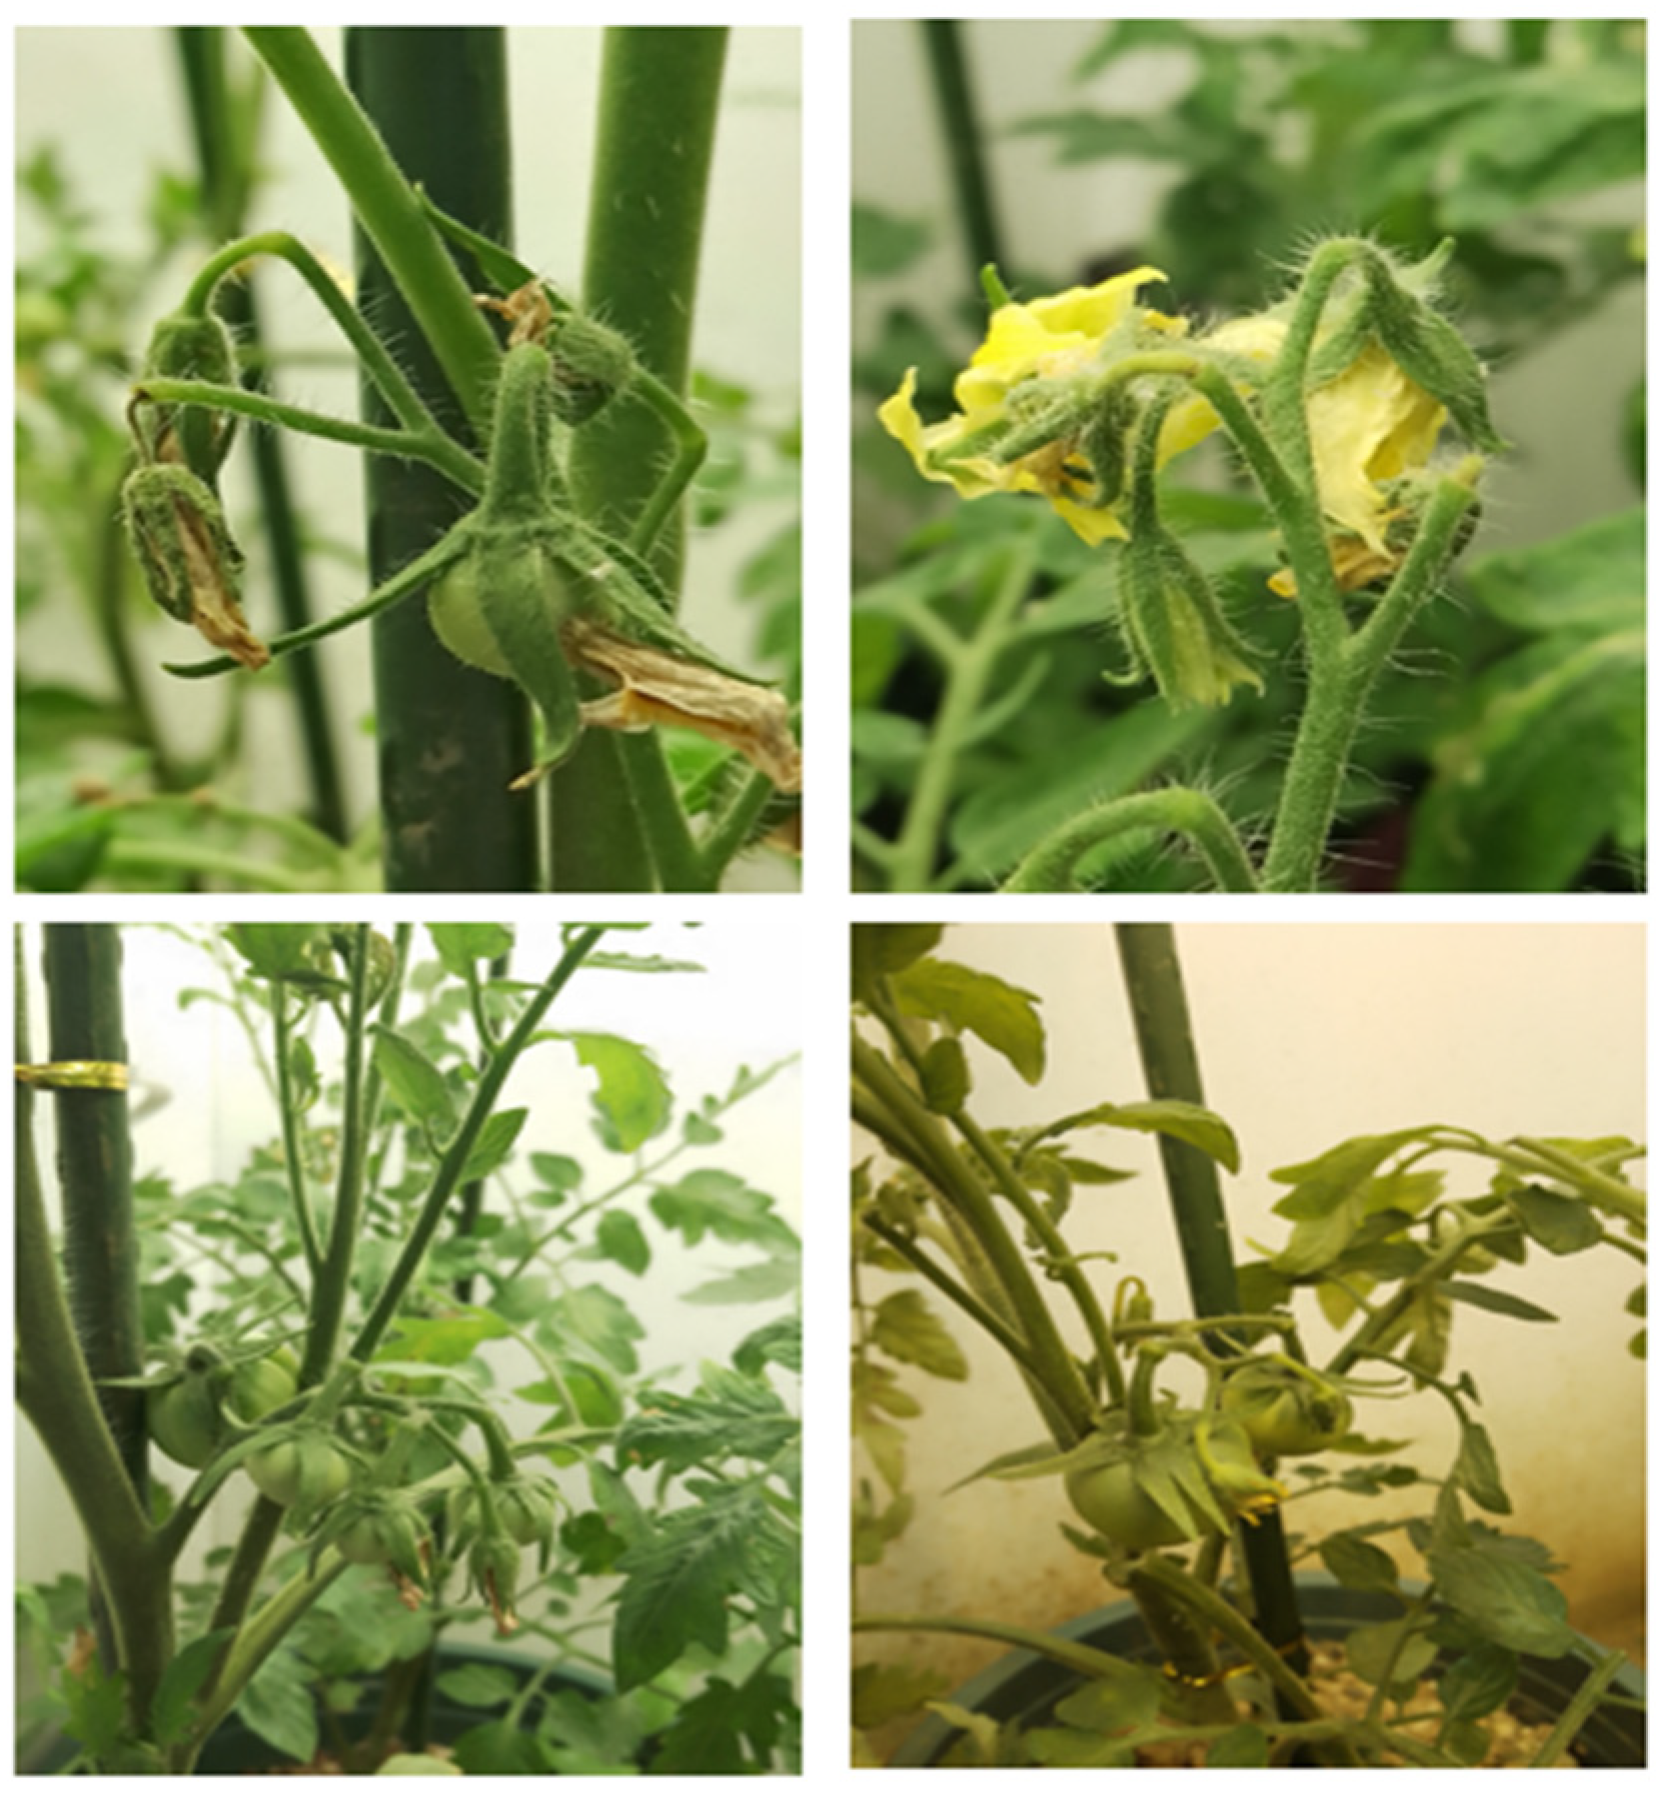
Figure 1. Tomato plants in the artificial climate chamber.
Agronomy 13 01439 g001
Figure 2. Dynamic changes of temperature in the artificial climate chamber.
Agronomy 13 01439 g002
Figure 3. TTC standard curves.
Agronomy 13 01439 g003
Figure 4. Tomato plant height under different high-temperature/nitrogen combinations in the recovery period. Different letters within a column indicate significant difference at p < 0.05 by Duncan’s multiple range tests.
Agronomy 13 01439 g004
Figure 5. Effects of different high-temperature/nitrogen combinations on stem thickness of tomato plant. Different letters within a column indicate significant difference at p < 0.05 by Duncan’s multiple range tests.
Agronomy 13 01439 g005
Figure 6. Leaf dry matter distribution ratio of different high-temperature/nitrogen combinations sampling on the 1st day, 8th day and 15th day in the recovery period. Different letters within a column indicate significant difference at p < 0.05 by Duncan’s multiple range tests.
Agronomy 13 01439 g006
Figure 7. Stem dry matter distribution ratio of different high-temperature/nitrogen combinations sampling on the 1st day, 8th day and 15th day in the recovery period. Different letters within a column indicate significant difference at p < 0.05 by Duncan’s multiple range tests.
Agronomy 13 01439 g007
Figure 8. Root dry matter distribution ratio of different high-temperature/nitrogen combinations sampling on the 1st day, 8th day and 15th day in the recovery period. Different letters within a column indicate significant difference at p < 0.05 by Duncan’s multiple range tests.
Agronomy 13 01439 g008
Figure 9. Root activity of tomato plant under different high-temperature/nitrogen combinations in recovery periods.
Agronomy 13 01439 g009
Figure 10. Nitrogen content of above-ground tomato plants treated with different high-temperature nitrogen levels. (a) is nitrogen content of above-ground tomato plants under CKT (g·100 g−1); (b) is nitrogen content of above-ground tomato plants under LHT (g·100 g−1); (c) is nitrogen content of above-ground tomato plants under MHT (g·100 g−1); (d) is nitrogen content of above-ground tomato plants under SHT (g·100 g−1).
Agronomy 13 01439 g010
Table 1. Treatment combination of nitrogen level and temperature level for potted tomato.
Nitrogen Treatment (g/plant)High-Temperature Treatment (Day/Night)
CKT
(25 °C/15 °C)
LHT
(30 °C/20 °C)
MHT
(35 °C/25 °C)
SHT
(40/°C 30 °C)
N1: 0 N (0 g/plant)T1N1T2N1T3N1T4N1
N2: 0.5 N (1.3 g/plant)T1N2T2N2T3N2T4N2
N3: 0.75 N (1.95 g/plant)T1N3T2N3T3N3T4N3
N4: 1 N (2.6 g/plant,CKN4)T1N4T2N4T3N4T4N4
N5: 1.25 N (3.25 g/plant)T1N5T2N5T3N5T4N5
Table 2. Significance, analysis of variance effects of main and interaction effects for greenhouse tomato growth parameters under different high temperature and nitrogen supply levels.
SourcedfPlant MorphologyDry Matter AccumulationDry Matter Distribution of Various OrgansRoot Vitality
Plant HeightStem DiameterLeafStemRoot
Sample Times 1d8d15d1d8d15d1d8d15d1d8d15d1d8d15d1d8d15d1d8d15d22d
High Temperature (HT)4NS****************************************
Nitrogen (N)5NS************0.023 ***************************
HT × Nitrogen20************NS**************************
*, ** Significant at 0.05 and 0.01 probability (p) levels, respectively; df: Degrees of freedom; NS: non-significant.
Table 3. Observation results of dry matter accumulation in the shoots of tomato plants under different combinations of high temperature and nitrogen (g/plant).
TreatmentDays after Treatment
1 d8 d15 d22 d29 d36 d
CKTN12.44 ± 0.3231 fg3.51 ± 0.309 ij5.37 ± 0.546 ij6.98 ± 0.398 ij8.11 ± 0.687 h9.95 ± 1.051 h
CKTN24.00 ± 0.475 a5.38 ± 0.554 cd7.48 ± 0.481 f10.11 ± 1.011 cd11.15 ± 0.704 d14.39 ± 1.537 d
CKTN34.06 ± 0.379 a5.87 ± 0.615 b6.42 ± 0.331 gh9.75 ± 0.717 cd13.28 ± 1.021 c16.70 ± 1.842 c
CKTN43.33 ± 0.112 bc5.20 ± 0.628 d7.63 ± 0.789 f12.02 ± 0.948 a15.84 ± 1.117 a18.29 ± 2.002 a
CKTN53.23 ± 0.153 c3.70 ± 0.794 hij9.16 ± 0.511 ab12.63 ± 0.889 a16.16 ± 0.925 a18.96 ± 1.918 a
LHTN12.52 ± 0.398 ef4.01 ± 0.177 fgh8.15 ± 0.478 de10.47 ± 0.812 bc13.37 ± 1.089 c15.22 ± 1.261 c
LHTN22.22 ± 0.099 gh4.59 ± 0.225 e8.97 ± 0.630 bc11.15 ± 0.952 b14.35 ± 1.225 b16.79 ± 1.731 b
LHTN32.93 ± 0.108 d5.59 ± 0.487 bcd9.66 ± 0.622 a12.21 ± 1.011 a15.27 ± 0.889 ab16.98 ± 1.453 ab
LHTN42.90 ± 0.178 d4.17 ± 0.457 efg5.90 ± 0.323 hi6.67 ± 0.695 j11.03 ± 1.151 de14.78 ± 1.231 de
LHTN52.24 ± 0.121 gh3.40 ± 0.209 j4.52 ± 0.481 k6.44 ± 0.446 j10.00 ± 0.797 efg12.35 ± 1.007 efg
MHTN12.67 ± 0.046 def5.32 ± 0.225 cd6.72 ± 0.665 g7.83 ± 0.709 gh9.56 ± 1.019 fg11.30 ± 1.271 fg
MHTN22.71 ± 0.452 def6.36 ± 0.287 a8.44 ± 0.583 cd8.93 ± 0.818 ef10.44 ± 1.218 def13.20 ± 1.447 def
MHTN33.53 ± 0.409 b5.46 ± 0.877 bcd8.50 ± 0.908 cd8.89 ± 0.786 ef10.22 ± 0.998 defg12.96 ± 1.114 defg
MHTN43.56 ± 0.438 b6.55 ± 0.704 a7.45 ± 0.823 f8.89 ± 0.690 f9.33 ± 0.753 g12.65 ± 0.969 g
MHTN52.77 ± 0.164 de5.72 ± 0.526 bc8.44 ± 0.692 cd9.4 ± 0.986 de10.02 ± 0.996 efg12.40 ± 1.043 efg
SHTN12.12 ± 0.067 h3.85 ± 0.321 hi4.80 ± 0.342 jk6.63 ± 0.623 j7.37 ± 0.762 h9.12 ± 0.958 h
SHTN22.44 ± 0.021 fg4.10 ± 0.442 fgh6.13 ± 0.644 gh8.55 ± 0.776 fg10.15 ± 0.901 def12.05 ± 1.221 def
SHTN32.67 ± 0.146 def3.53 ± 0.225 ij6.30 ± 0.522 gh7.90 ± 0.487 gh9.23 ± 0.692 g11.14 ± 1.491 g
SHTN42.75 ± 0.125 de4.17 ± 0.304 efg6.00 ± 0.659 h7.54 ± 0.745 hi9.25 ± 0.683 g11.29 ± 0.948 g
SHTN52.42 ± 0.294 fg4.33 ± 0.263 ef5.31 ± 0.569 ij6.50 ± 0.691 j7.67 ± 0.730 h9.38 ± 0.795 h
Note: Lowercase letters indicate the significance of p < 0.05 by Duncan’s test. Results are presented as mean ± SD (n = 3).
Table 4. Fitting equation of the accumulation process of the dry matter content of the shoots of tomato plants(Y) with the growth days(t) under different high temperature/nitrogen combination conditions.
TreatmentFitted EquationR2TreatmentFitted EquationR2
T1N1Y = 12.14/(1 + 7.12e−0.080t)0.992 **T3N1Y = 13.65/(1 + 5.41e−0.075t)0.979 **
T1N2Y = 16.20/(1 + 10.55e−0.099t)0.982 **T3N2Y = 14.42/(1 + 5.22e−0.084t)0.935 **
T1N3Y = 23.91/(1 + 17.42e−0.088t)0.998 **T3N3Y = 15.69/(1 + 4.84e−0.070t)0.956 **
T1N4Y = 28.71/(1 + 21.23e−0.065t)0.971 **T3N4Y = 21.39/(1 + 5.28e−0.046t)0.933 **
T1N5Y = 30.72(1 + 22.59e−0.064t)0.972 **T3N5Y = 12.09/(1 + 6.28e−0.118t)0.960 **
T2N1Y = 16.88/(1 + 13.36e−0.113t)0.977 **T4N1Y = 12.19/(1 + 6.70e−0.069t)0.992 **
T2N2Y = 18.56/(1 + 13.68e−0.112t)0.981 **T4N2Y = 14.74/(1 + 7.21e−0.046t)0.993 **
T2N3Y = 35.06/(1 + 16.39e−0.054t)0.976 **T4N3Y = 19.28/(1 + 8.94e−0.034t)0.986 **
T2N4Y = 37.69/(1 + 19.10e−0.058t)0.966 **T4N4Y = 15.05/(1 + 7.99e−0.045t)0.992 **
T2N5Y = 27.81/(1 + 19.27e−0.066t)0.993 **T4N5Y = 14.44/(1 + 7.23e−0.036t)0.993 **
Note: ** is p < 0.01.
Disclaimer/Publisher’s Note: The statements, opinions and data contained in all publications are solely those of the individual author(s) and contributor(s) and not of MDPI and/or the editor(s). MDPI and/or the editor(s) disclaim responsibility for any injury to people or property resulting from any ideas, methods, instructions or products referred to in the content.