Article

Effect of Biochar on Labile Organic Carbon Fractions and Soil Carbon Pool Management Index

1
School of Environment and Surveying Engineering, Suzhou University, Suzhou 234000, China
2
Research Center of Non-Point Source Pollution Control and Ecological Remediation of Tuohe River Basin, Suzhou University, Suzhou 234000, China
3
Suzhou Academy of Agricultural Sciences, Suzhou 234000, China
*
Author to whom correspondence should be addressed.
These authors contributed equally to this work.
Agronomy 2023, 13(5), 1385; https://doi.org/10.3390/agronomy13051385
Submission received: 10 April 2023 / Revised: 9 May 2023 / Accepted: 15 May 2023 / Published: 17 May 2023
(This article belongs to the Section Agricultural Biosystem and Biological Engineering)

Abstract

:
Biochar is useful for soil organic carbon (SOC) sequestration. However, the effects of biochar aging and addition rates on SOC stabilization are unclear. A field experiment with four biochar application rates (0% (control), 1% (LB), 2% (MB), and 4% (HB) of dry fluvo-aquic soil) was conducted. Soil samples were sampled after 8, 12, and 24 months of its application to clarify the question. In general, SOC gradually increased with the biochar application rate. SOC with HB was higher than that in other treatments, while the ratio of microbial biomass carbon (MBC)/SOC and readily oxidizable carbon (ROC)/SOC with HB was lower than that in other treatments (p < 0.05), indicating a positive effect of HB for C stabilization over time. The effects of biochar on the soil carbon pool management index (CPMI) changed from negative to positive after 8 and 24 months of biochar application. The activities of β-D-glucosidase (βG), cellobiohydrolase (CBH), and β-N-acetylglucosaminidase (NAG) under HB were higher than with other treatments after 12 and 24 months of biochar application (p < 0.05) and negatively correlated with the ratio of MBC/SOC and ROC/SOC over time. The CPMI was positively related with βG and CBH activities after 8 and 24 months of biochar application, respectively (p < 0.05). HB increased the relative abundance of oligotrophs, including Acidobacteria, Actinobacteria, and Chloroflexi, but decreased the relative abundance of copiotrophs, including γ-Proteobacteria and Bacteroidetes over time (p < 0.05). The ratio of dissolved organic carbon (DOC)/SOC was positively correlated with the bacterial oligotroph/copiotroph ratio and significantly affected the oligotrophic and copiotrophic bacterial communities, especially after 8 and 12 months of biochar application (p < 0.05). These findings reinforce that increasing the biochar application rate and time enhances SOC stabilization by decreasing the proportions of labile organic carbon and making oligotrophic/copiotrophic communities and enzyme activities more conducive to C sequestration.

1. Introduction

The loss of soil organic carbon (SOC) in cultivated soils is affected by agricultural practices [1,2]. Recycling agricultural wastes (such as crop residues, manure from different animals, and biochar) used as organic fertilizer in agricultural systems is helpful for an improvement in soil quality (fertility), carbon restoration, and environmental sustainability [3].
Biochar application is considered a strategy for rapid SOC sequestration because of its high content of stable C [4,5,6]. However, the application of biochar has been found to exert different effects on SOC stabilization, depending on the biochar characteristics, soil type, and biotic and abiotic environments [7]. Yang et al. (2018) [8] found that biochar increases C sequestration rates after 3 years of application to the Hapli-Udic Cambisol. However, N-enriched biochar application reduces SOC stabilization in paddy soils at 3 and 6 months after its addition [9]. Maestrini et al. (2015) [10] found that fresh biochar accelerated the mineralization of native SOC during the first 20 days after application and had a negative effect after 200 days of incubation. In contrast, Wang et al. (2016) [11] found that part of the studies in their meta-analysis showed improved stabilization of SOC on soils with biochar addition within 0.5 years, with this effect disappearing over time. Clearly, there is a great deal of confusion regarding the time effects of biochar application on soil C stabilization. A single observation in time is insufficient to detect the function of biochar on SOC stability.
Soil extracellular enzymes produced by microorganisms are proximate agents that degrade soil organic matter (SOM) [12]. Hydrolytic enzymes, such as β-D-glucosidase (βG), cellobiohydrolase (CBH), and β-N-acetylglucosaminidase (NAG), are responsible for the decomposition of medium to simple organic molecules [13,14,15]. However, the effects of biochar application on the activity of soil hydrolases involved in organic matter decomposition are uncertain [16,17]. Elzobair et al. (2016) [18] found that biochar had no effect on the potential activities of βG and NAG within 36 days after application. Foster et al. (2018) [19] considered that the sorption and masking of active sites of enzymes by biochar lead to a decrease in βG activity with increasing biochar application rates. In contrast, Song et al. (2019) [20] determined that a high biochar addition rate increased βG and NAG activities by changing soil properties after 1 or 2 years. Overall, the response of soil extracellular hydrolytic enzymes to biochar is likely dependent on the biochar application rate and time. However, the exact mechanism has yet to be elucidated [18,21]. Moreover, soil enzymatic reactions regulate the formation and stabilization of labile organic carbon fractions [13]. A study on the effect of biochar on the relations between organic carbon stabilization and C-cycle enzyme activities over time can explore the underlying mechanism of SOC transformation [22,23].
Microorganisms affect organic carbon fractions by a series of carbon-degrading enzymes and regulate SOC stabilization via their carbon-use trophic strategist [24,25]. Copiotrophs, such as β- and γ-Proteobacteria, Bacteroidetes, and Firmicutes, are typical bacteria responsible for the turnover of labile organic carbon, while oligotrophs, such as α- and δ-Proteobacteria and Acidobacteria, can degrade recalcitrant substrates [26,27]. Previous studies have shown that the effect of biochar on soil microbial communities is complex because of differences in biochar and soil conditions [28,29]. Gomez et al. (2014) [30] found that the addition of biochar stimulated the growth of Gram-positive bacteria (G+ bacteria). The relative abundances of Proteobacteria, Bacteroidetes, and Firmicutes responsible for the degradation of recalcitrant C compounds decreased after 96 days of biochar application, as reported by Wu et al. (2016) [31], but increased in the studies of Ding et al. (2013) [32] and Hu et al. (2014) [33] under short-term biochar application. Cheng et al. (2019) [34] found that biochar increased the relative abundance of Proteobacteria but decreased the abundance of Bacteroidetes in bulk soils after 6 years of application. Previous studies have shown that biochar affects the change in microorganisms over time [35]. However, the responses of microbial attributes to biochar at different time scales remain unclear.
The application of biochar to agricultural soils is considered a promising strategy for C sequestration because of its high carbon content, chemical recalcitrance, and stability [36,37]. Notably, the long-term application of biochar to soils leads to different effects on SOC stabilization compared to short-term application because of the biochar aging process [28,38,39]. However, the underlying effect of the biochar aging process on the links between SOC stabilization, C-cycle hydrolase activities, and bacterial groups involved in C-use trophic strategies remains uncertain [40,41]. Moreover, previous studies lacked the continuous time-scale effects of biochar on SOC stability. Thus, our objectives were to make clear the (i) changes over time in the stabilization of SOC under different biochar application rates; (ii) the interaction of biochar and time with the changes in the activities of βG, CBH, and NAG; and (iii) the regulation of soil bacterial carbon-use trophic strategies in SOC stabilization, considering the biochar aging process.

2. Materials and Methods

2.1. Site Description and Field Experiment

The field experimental site is located in Niutun Town, Anyang, China (35°16′57″ N, 114°24′29″ E). This site has a sub-humid continental monsoon climate; the mean annual air temperature and average annual precipitation are 13.4 °C and 634.3 mm, respectively. The local planting system is wheat–maize rotation. The soil taxonomy system is fluvo-aquic soil, the texture is sandy loam soil with pH of 7.80, and the contents of organic carbon, total nitrogen (TN), phosphorous (TP), potassium (TK) were 10.90, 0.91, 1.01, 14.08 g·kg−1, respectively.
In this experiment, four treatments with four levels of biochar rates, such as 0% (control), 1% (LB), 2% (MB), and 4% (HB) of dry fluvo-aquic soil, were applied to topsoil (0–20 cm depth) before winter wheat seeding in October 2020, each with three replicate plots (4 × 4 m2). The biochar was made from peanut shell under 500 °C for 10 h, with contents of organic carbon, nitrogen, phosphorous, potassium of 447.0, 12.3, 7.0, and 25.8 g·kg−1, respectively, and had a pH of 10.08.

2.2. Soil Sampling and Analysis

2.2.1. Soil Sampling and Initial Treatment

Soil sampling was performed after 8 months (June 2021), 12 months (October 2021), and 24 months (October 2022) of biochar addition. Bulk soil (depth: 0–20 cm) was collected from each plot by using a five-point sampling method with soil sampler. The soil cores were passed through 2 mm sieve, homogenized, and divided into three parts. One part was frozen and stored at −80 °C for bacterial community diversity analysis; the second part was used for the analysis of DOC, microbial biomass carbon (MBC), and enzyme activities (βG, CBH, and NAG); and the other part was air-dried at room temperature for physicochemical analysis.

2.2.2. Analysis of Soil Physicochemical Properties

SOC was determined by using oil bath-K2CrO7 oxidation method [42]. Total nitrogen (TN) was analyzed by using the Kjeldahl procedure [43]. The available nitrogen (AN) was determined using the alkaline hydrolysis diffusion method [44]. Available phosphorus (Olsen-P) was extracted using sodium bicarbonate Olsen method [45]. Soil pH was measured at a soil-to-water ratio of 1:2.5 (w/v) suspension with pH meter (PHS-2F). Soil moisture (SM) was measured using gravimetric method at 105 °C.
The readily oxidizable carbon (ROC) was determined by the potassium permanganate oxidation colorimetric method [46]. DOC was extracted using 0.5 M potassium sulfate (soil–water ratio of 1:4) and analyzed using a TOC analyzer (TOC Vwp; Shimadzu Corp., Tokyo, Japan) [25]. MBC was determined and calculated using the fumigation–extraction method [47].

2.2.3. Analysis of Soil Enzyme Activities

The βG, CBH, and NAG activities were measured fluorometrically using 4-methylumbelliferone (MUB)-linked model substrates (4-MUB-β-D-glucoside, 4-MUB-β-D-cellobioside, and 4-MUB-N-acetyl-b-D-glucosaminide, respectively) [48,49,50].

2.2.4. High-Throughput Sequence Processing

The primers 338F and 806R were used to amplify the bacterial 16S rRNA gene (V3–V4 region) (GeneAmp 9700, ABI, Waltham, MA, USA). PCR was conducted using 20 μL reaction mixtures containing 4 μL of 5 × FastPfu Buffer, 2 μL of 2.5 mM dNTPs, 0.8 μL of each primer (5 μM), 0.4 μL of FastPfu Polymerase, and 10 ng of template DNA. Thermal cycling programs were as follows: denaturation at 95 °C for 3 min, 27 cycles at 95 °C for 30 s, annealing at 55 °C for 30 s, elongation at 72 °C for 45 s, and extension at 72 °C for 10 min. The PCR mixture (20 μL) and PCR products were purified and quantified using QuantiFluor™-ST (Promega, Inc., Madison, WI, USA). Sequencing was conducted on an Illumina MiSeq platform (San Diego, CA, USA). For details on sequence data processing, refer to Qiu et al. (2023) [25].

2.3. Calculation and Statistical Analysis

One-way ANOVA was used to test the difference in soil carbon components, soil enzyme activities, relative abundance of the bacterial community, and carbon pool management index (CPMI). Two-way ANOVA was used to detect the effects of biochar and time on soil labile organic carbon fractions, carbon pool activity, and CPMI. Non-metric multidimensional scaling (NMDS) was used to analyze the effects of biochar rate and time on bacterial groups. The links between the bacterial community structure and labile organic carbon, carbon pool dynamics, extracellular enzyme activities, and soil physicochemical properties were identified by using R (v.4.2.1).
The carbon pool management index (CMPI) was calculated by the following formulas (Blair et al., 1995) [46]:
Carbon pool index (CPI) = (treatment SOC/control SOC) × 100
Carbon pool activity (A) = ROC/(SOC − ROC) × 100
Carbon pool activity index (AI) = (A/control SOC pool activity) ×100
CMPI = CPI × AI × 100.

3. Results

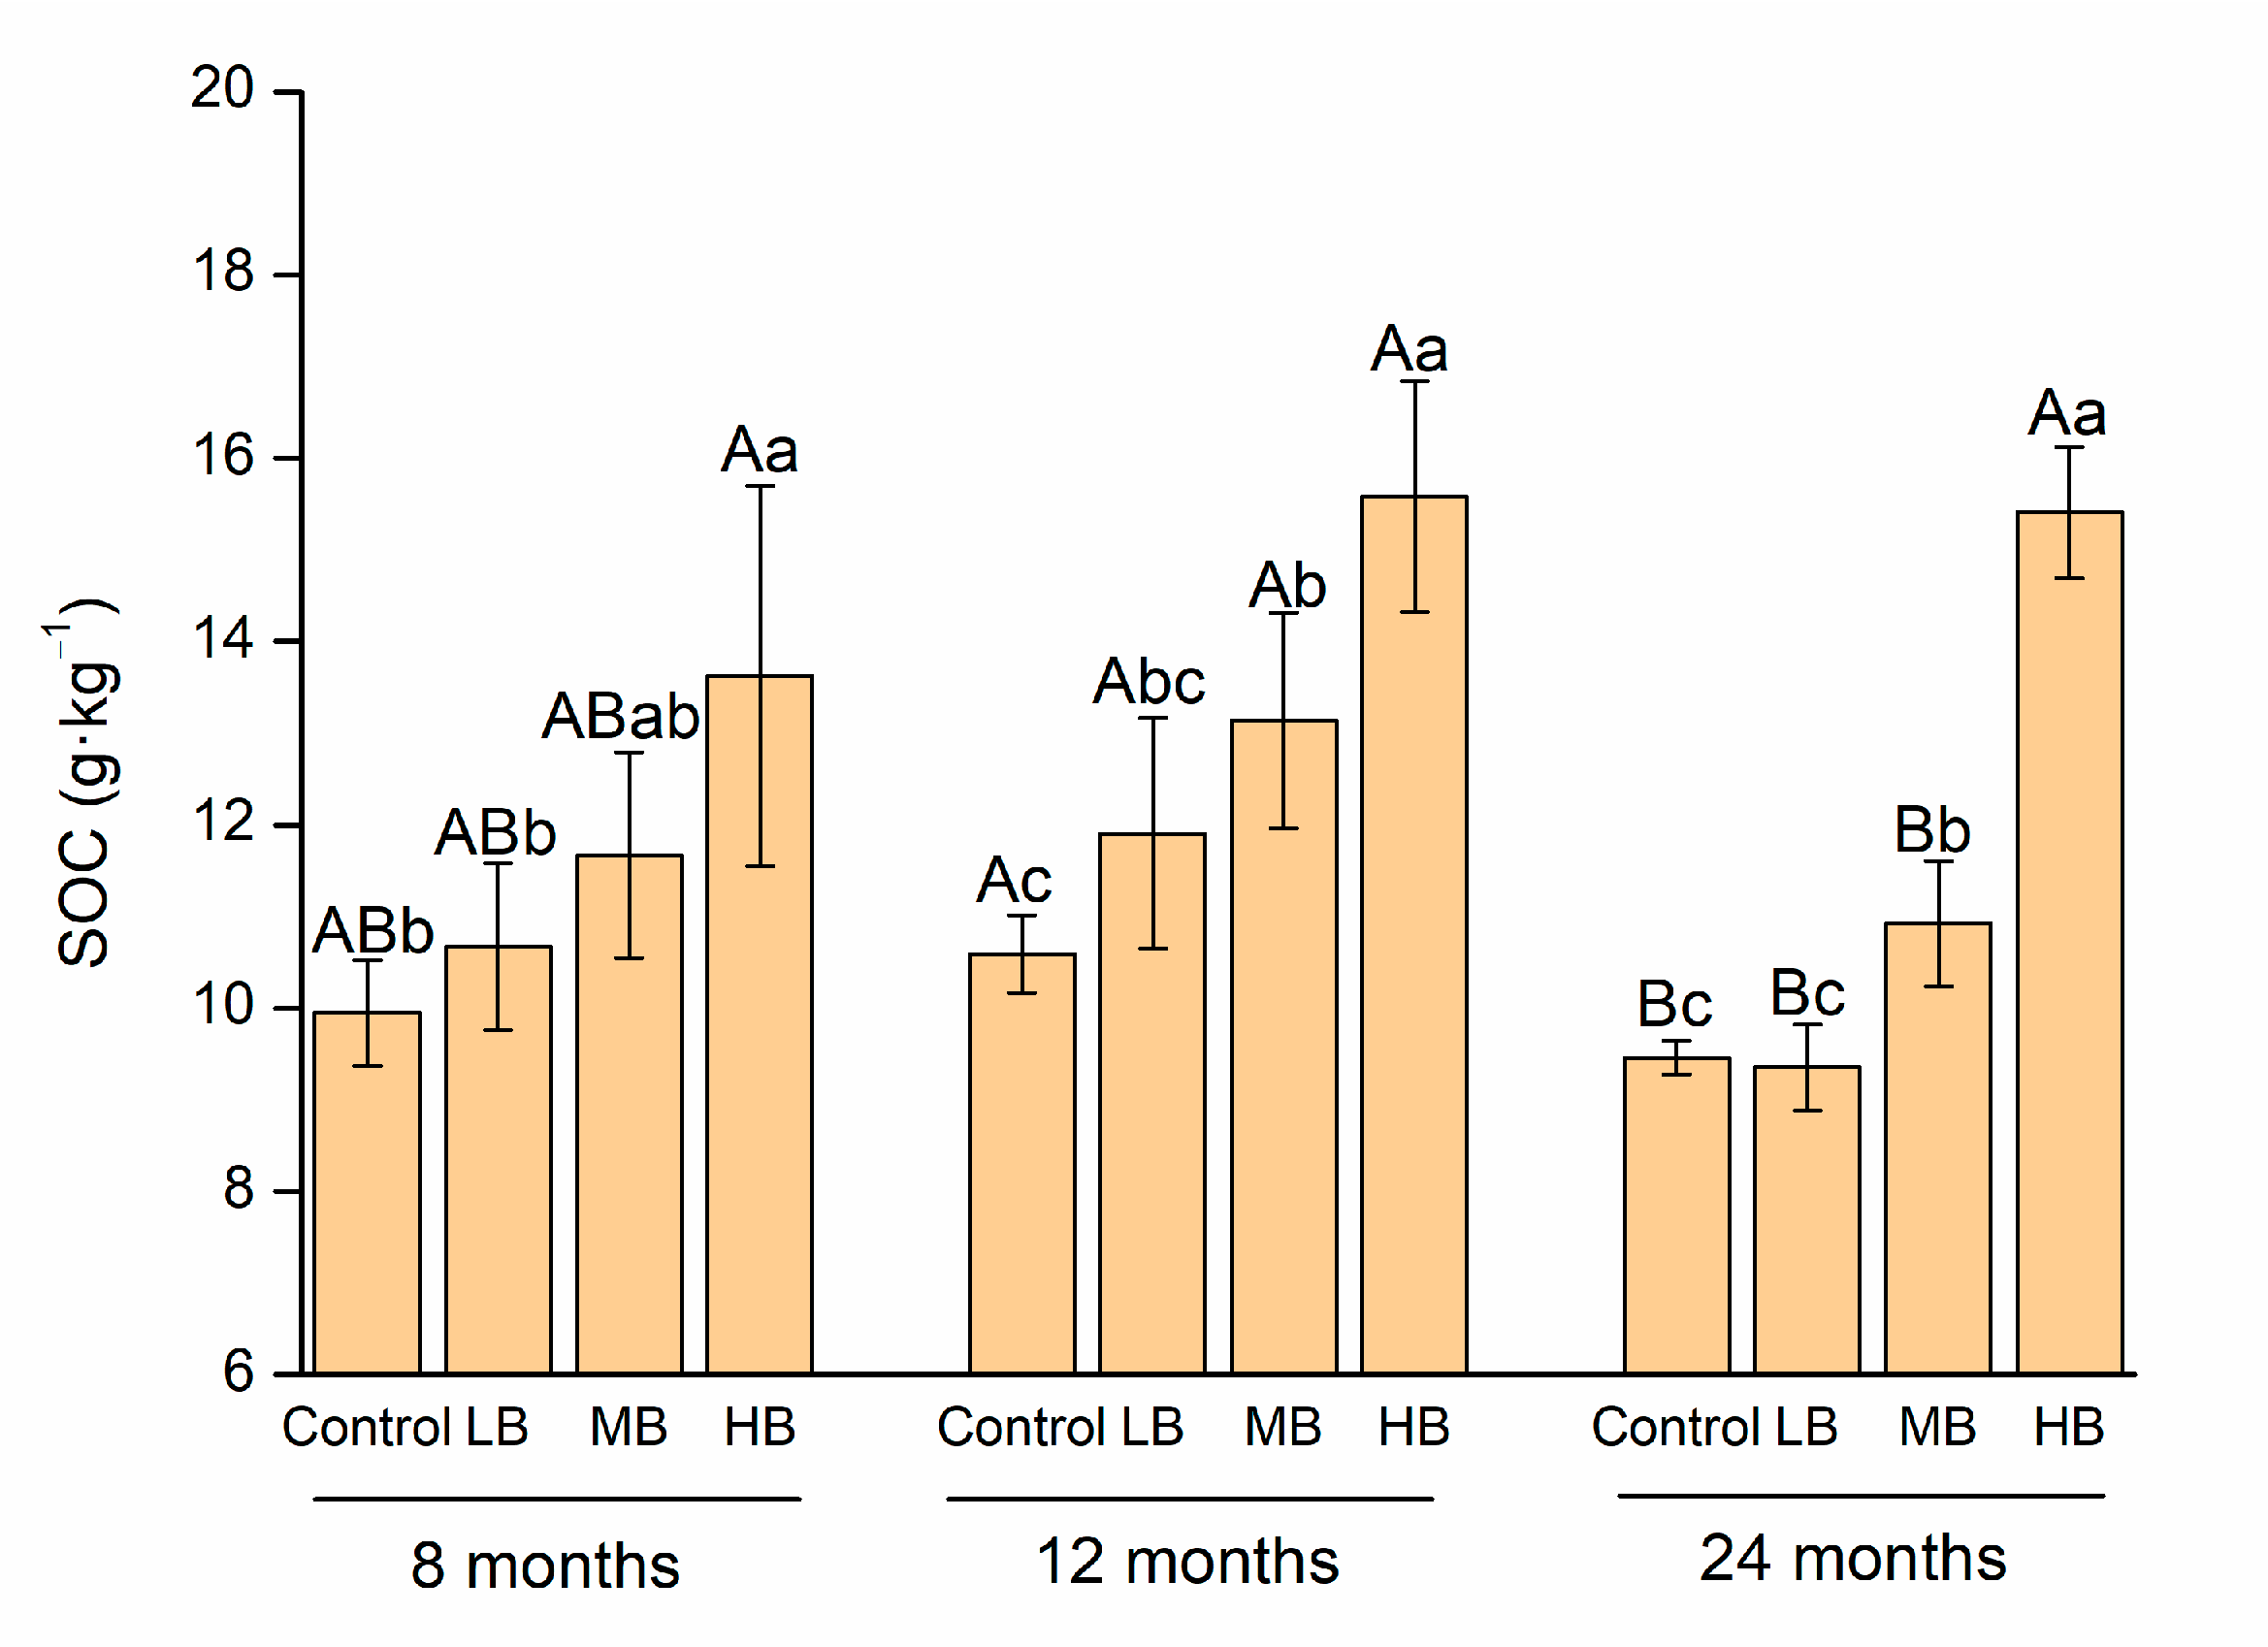
3.1. Soil Organic Carbon and Labile Organic Carbon Components

The biochar application rate had a significant effect on the SOC content based on the two-way ANOVA. The SOC content, DOC/SOC ratio, and MBC/SOC ratio changed over time. The ROC/SOC ratio was affected by the main and interactive effects of the biochar application rate and time (p < 0.05, Table S1). Specifically, the SOC contents in HB were 36.9%, 47.1%, and 62.9% more than that in the control after 8, 12, and 24 months of biochar application, respectively (p < 0.05, Figure 1). Compared to the control, MB increased SOC after 12 and 24 months of biochar application. LB had no effect on the SOC content over time (p < 0.05). Furthermore, HB decreased the ratios of MBC/SOC and ROC/SOC over time compared to the control (p < 0.05, Table 1). Compared to the control, the decreases in MBC/SOC with HB were 37.9%, 27.2%, and 38.9%, and the decreases in ROC/SOC with HB were 42.8%, 24.7%, and 24.0% (p < 0.05).
Regarding carbon pool management, the CPMI was influenced by the main and interactive effects of the biochar application rate and the time after application (p < 0.05, Table S1). Compared to the control, LB, MB, and HB decreased the CPMI% by 32.8%, 22.3%, and 33.5%, respectively, after 8 months of biochar application. However, these differences disappeared after 12 months, and MB and HB significantly increased the CPMI after 24 months (p < 0.05, Table 2).

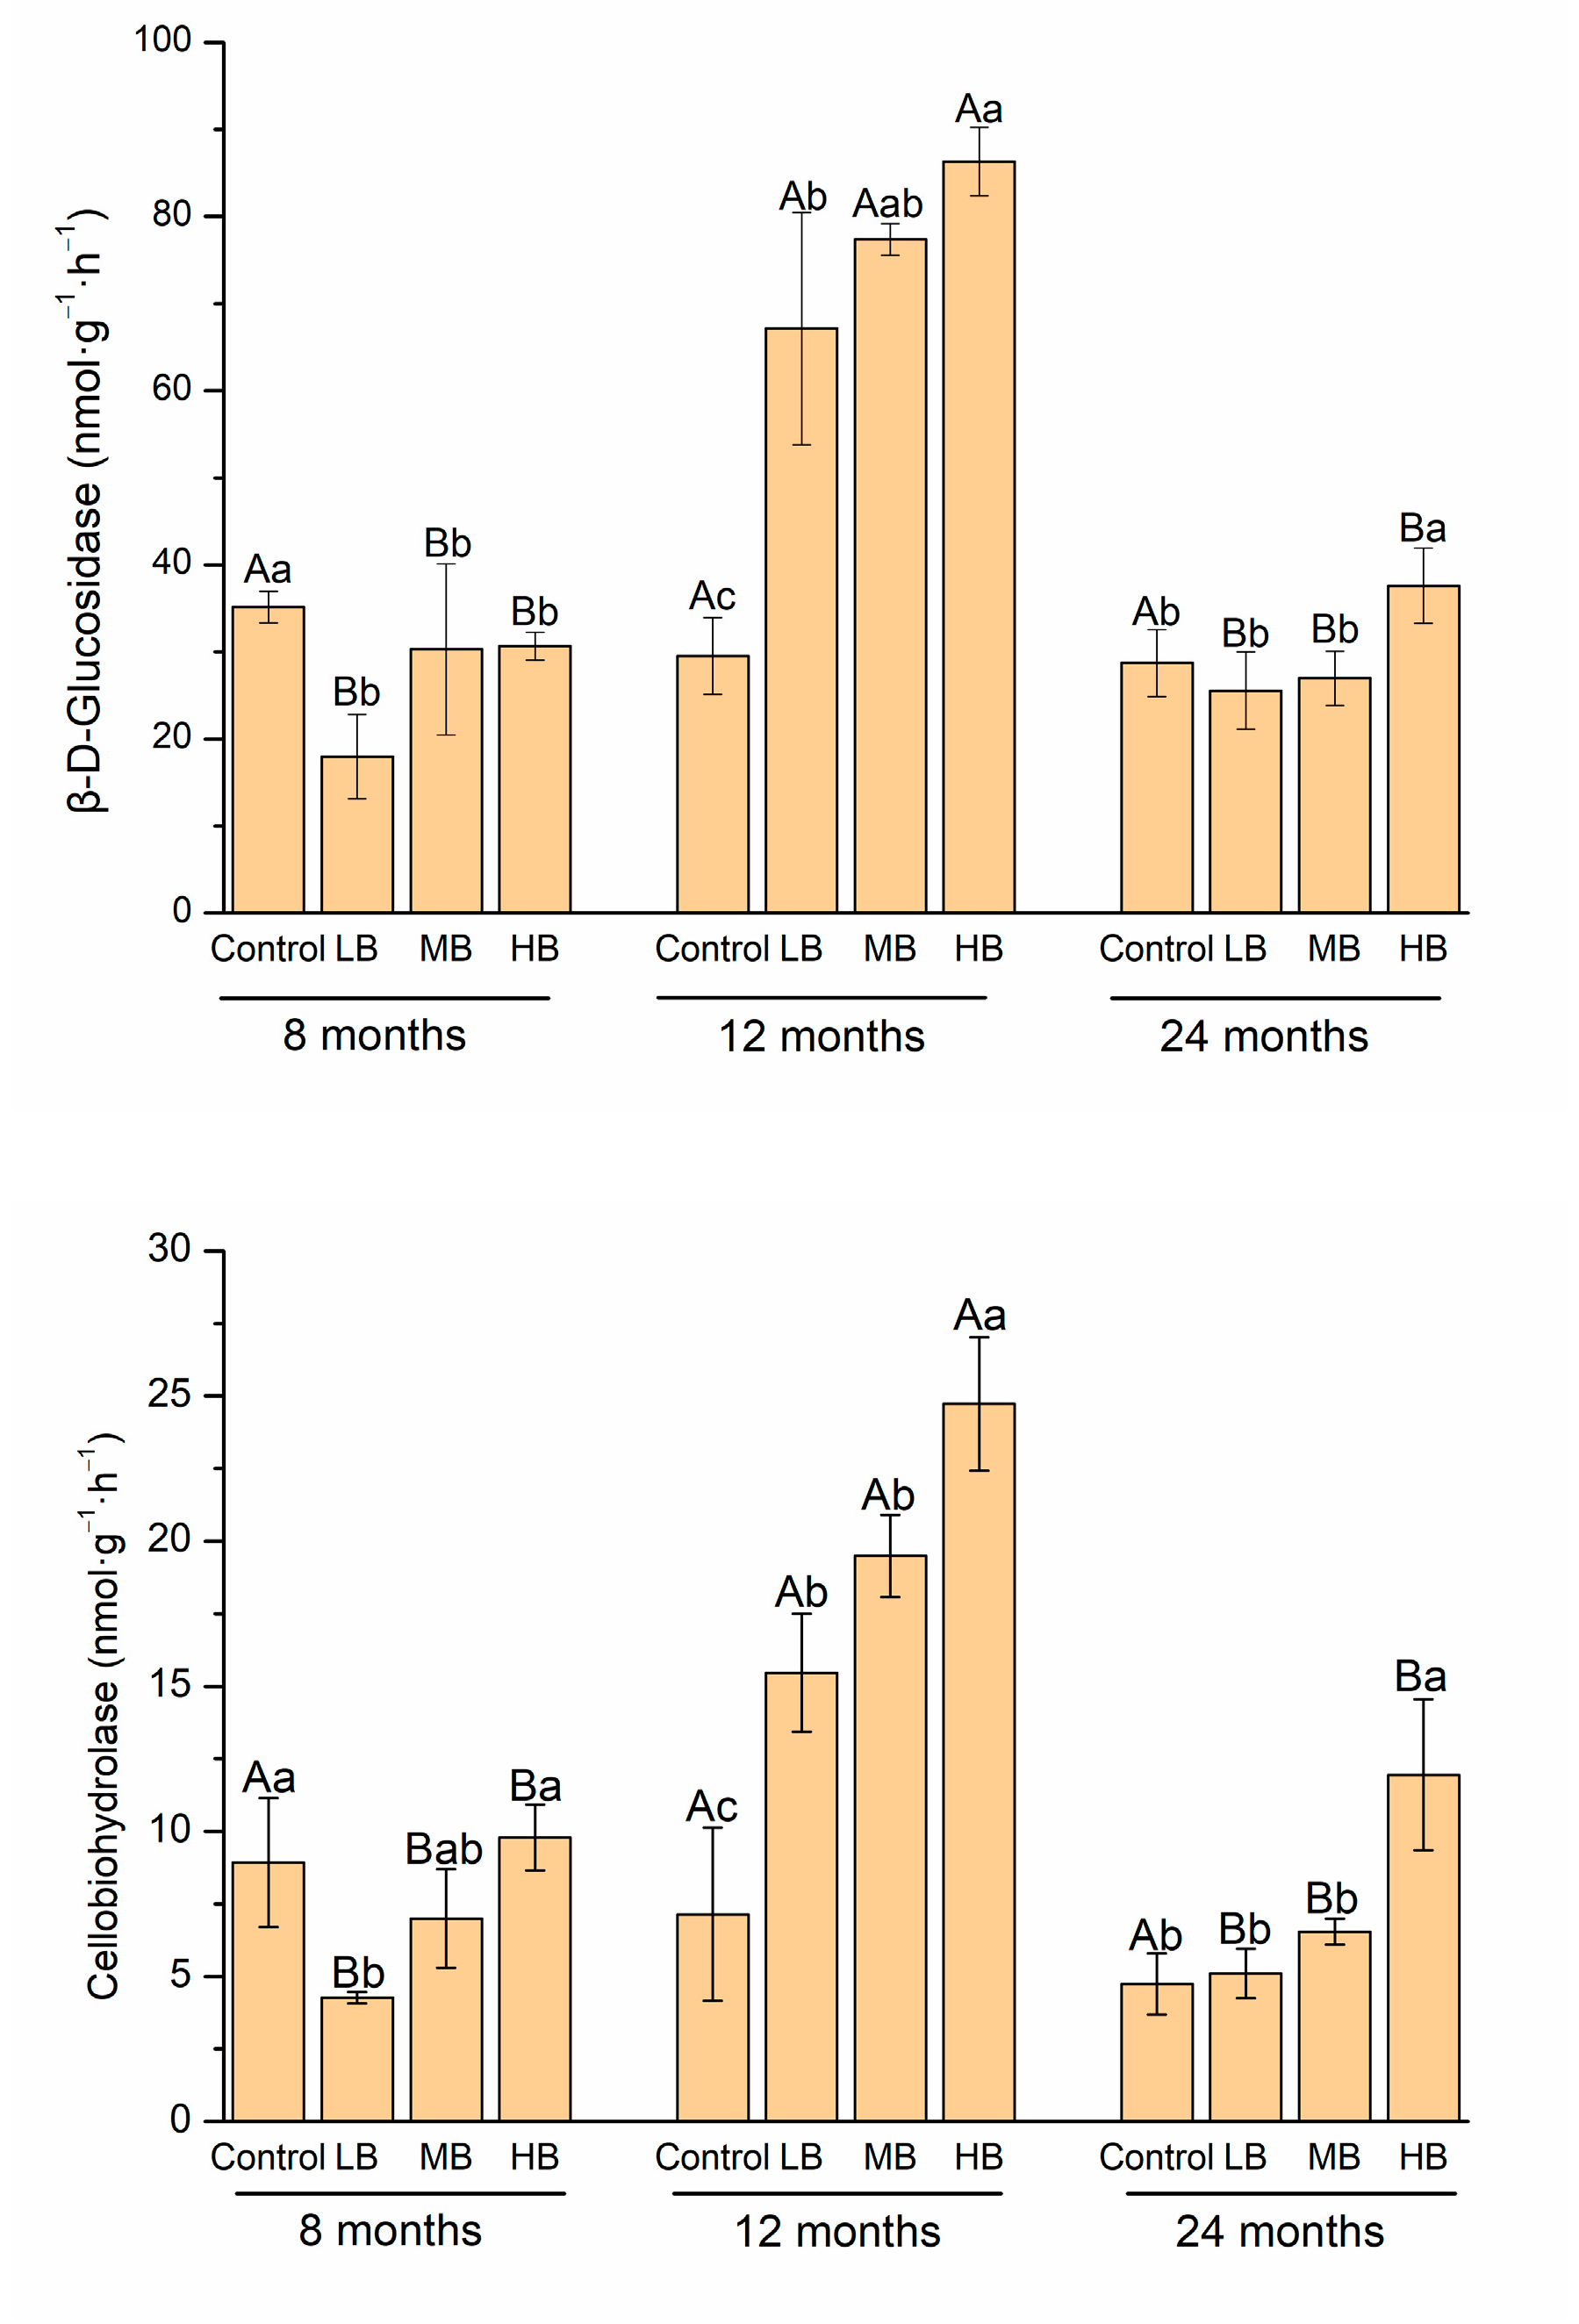
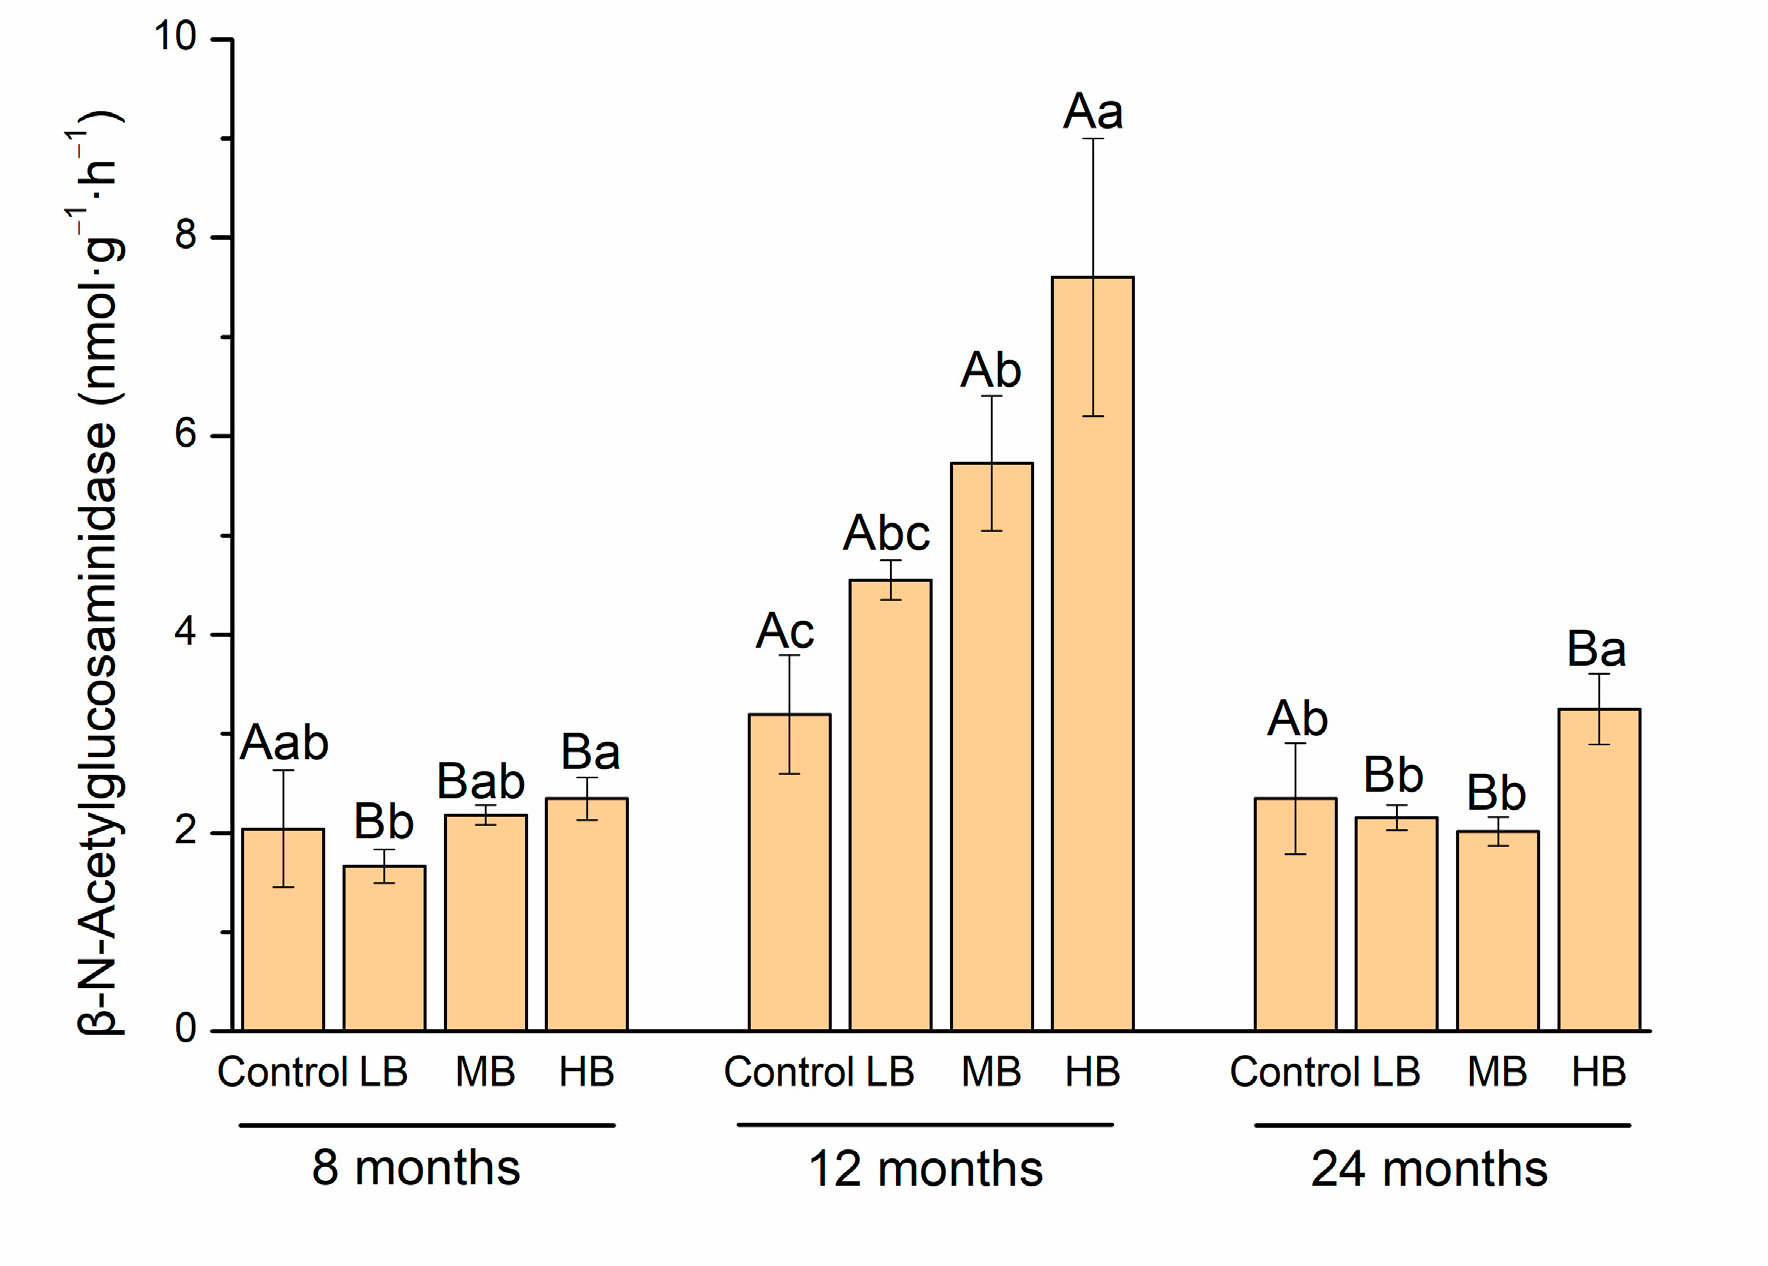
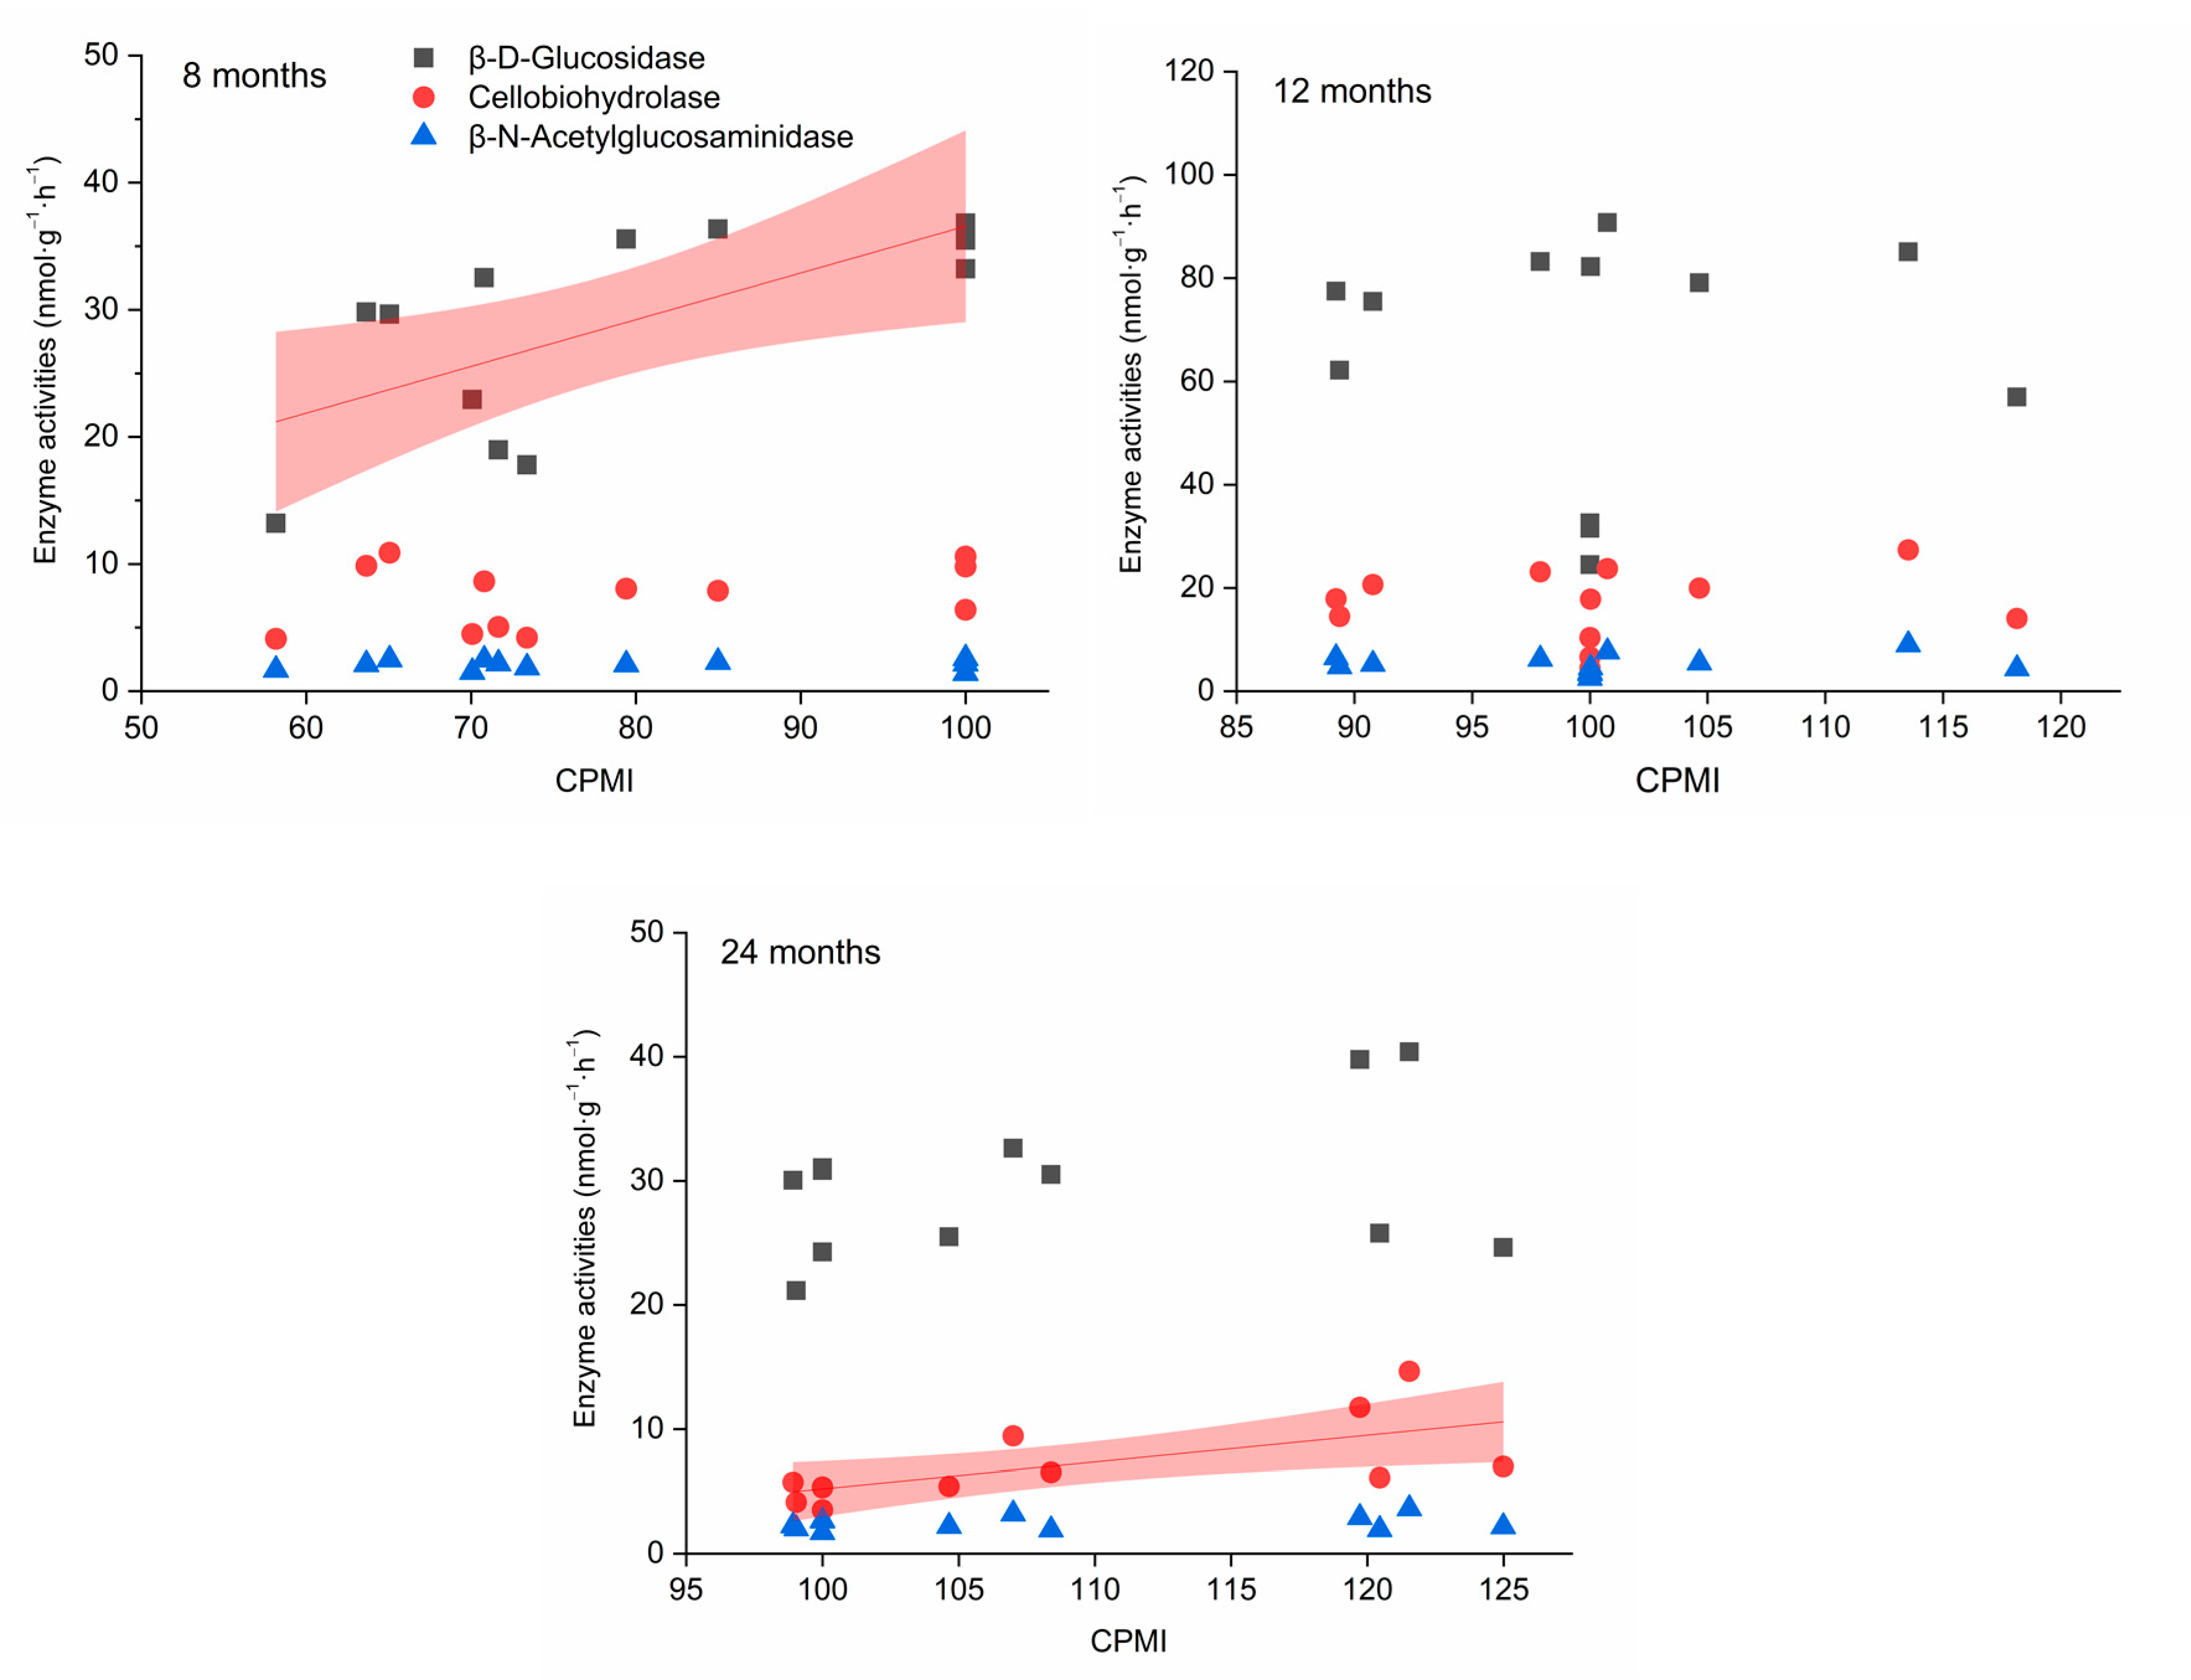
3.2. Carbon-Degrading Enzyme Activity

Compared to the control, LB significantly decreased βG and CBH activities after 8 months of biochar application (p < 0.05, Figure 2). After 12 months, LB, MB, and HB significantly increased βG and CBH activities, and MB and HB significantly increased NAG activity (p < 0.05). After 24 months, βG, CBH, and NAG activities were higher than those under the control treatment (p < 0.05). Notably, carbon-degrading extracellular enzyme activities in the control were stable during the whole incubation period, and the activities of βG, CBH, and NAG after 12 months were higher than those after 8 and 24 months (p < 0.05).

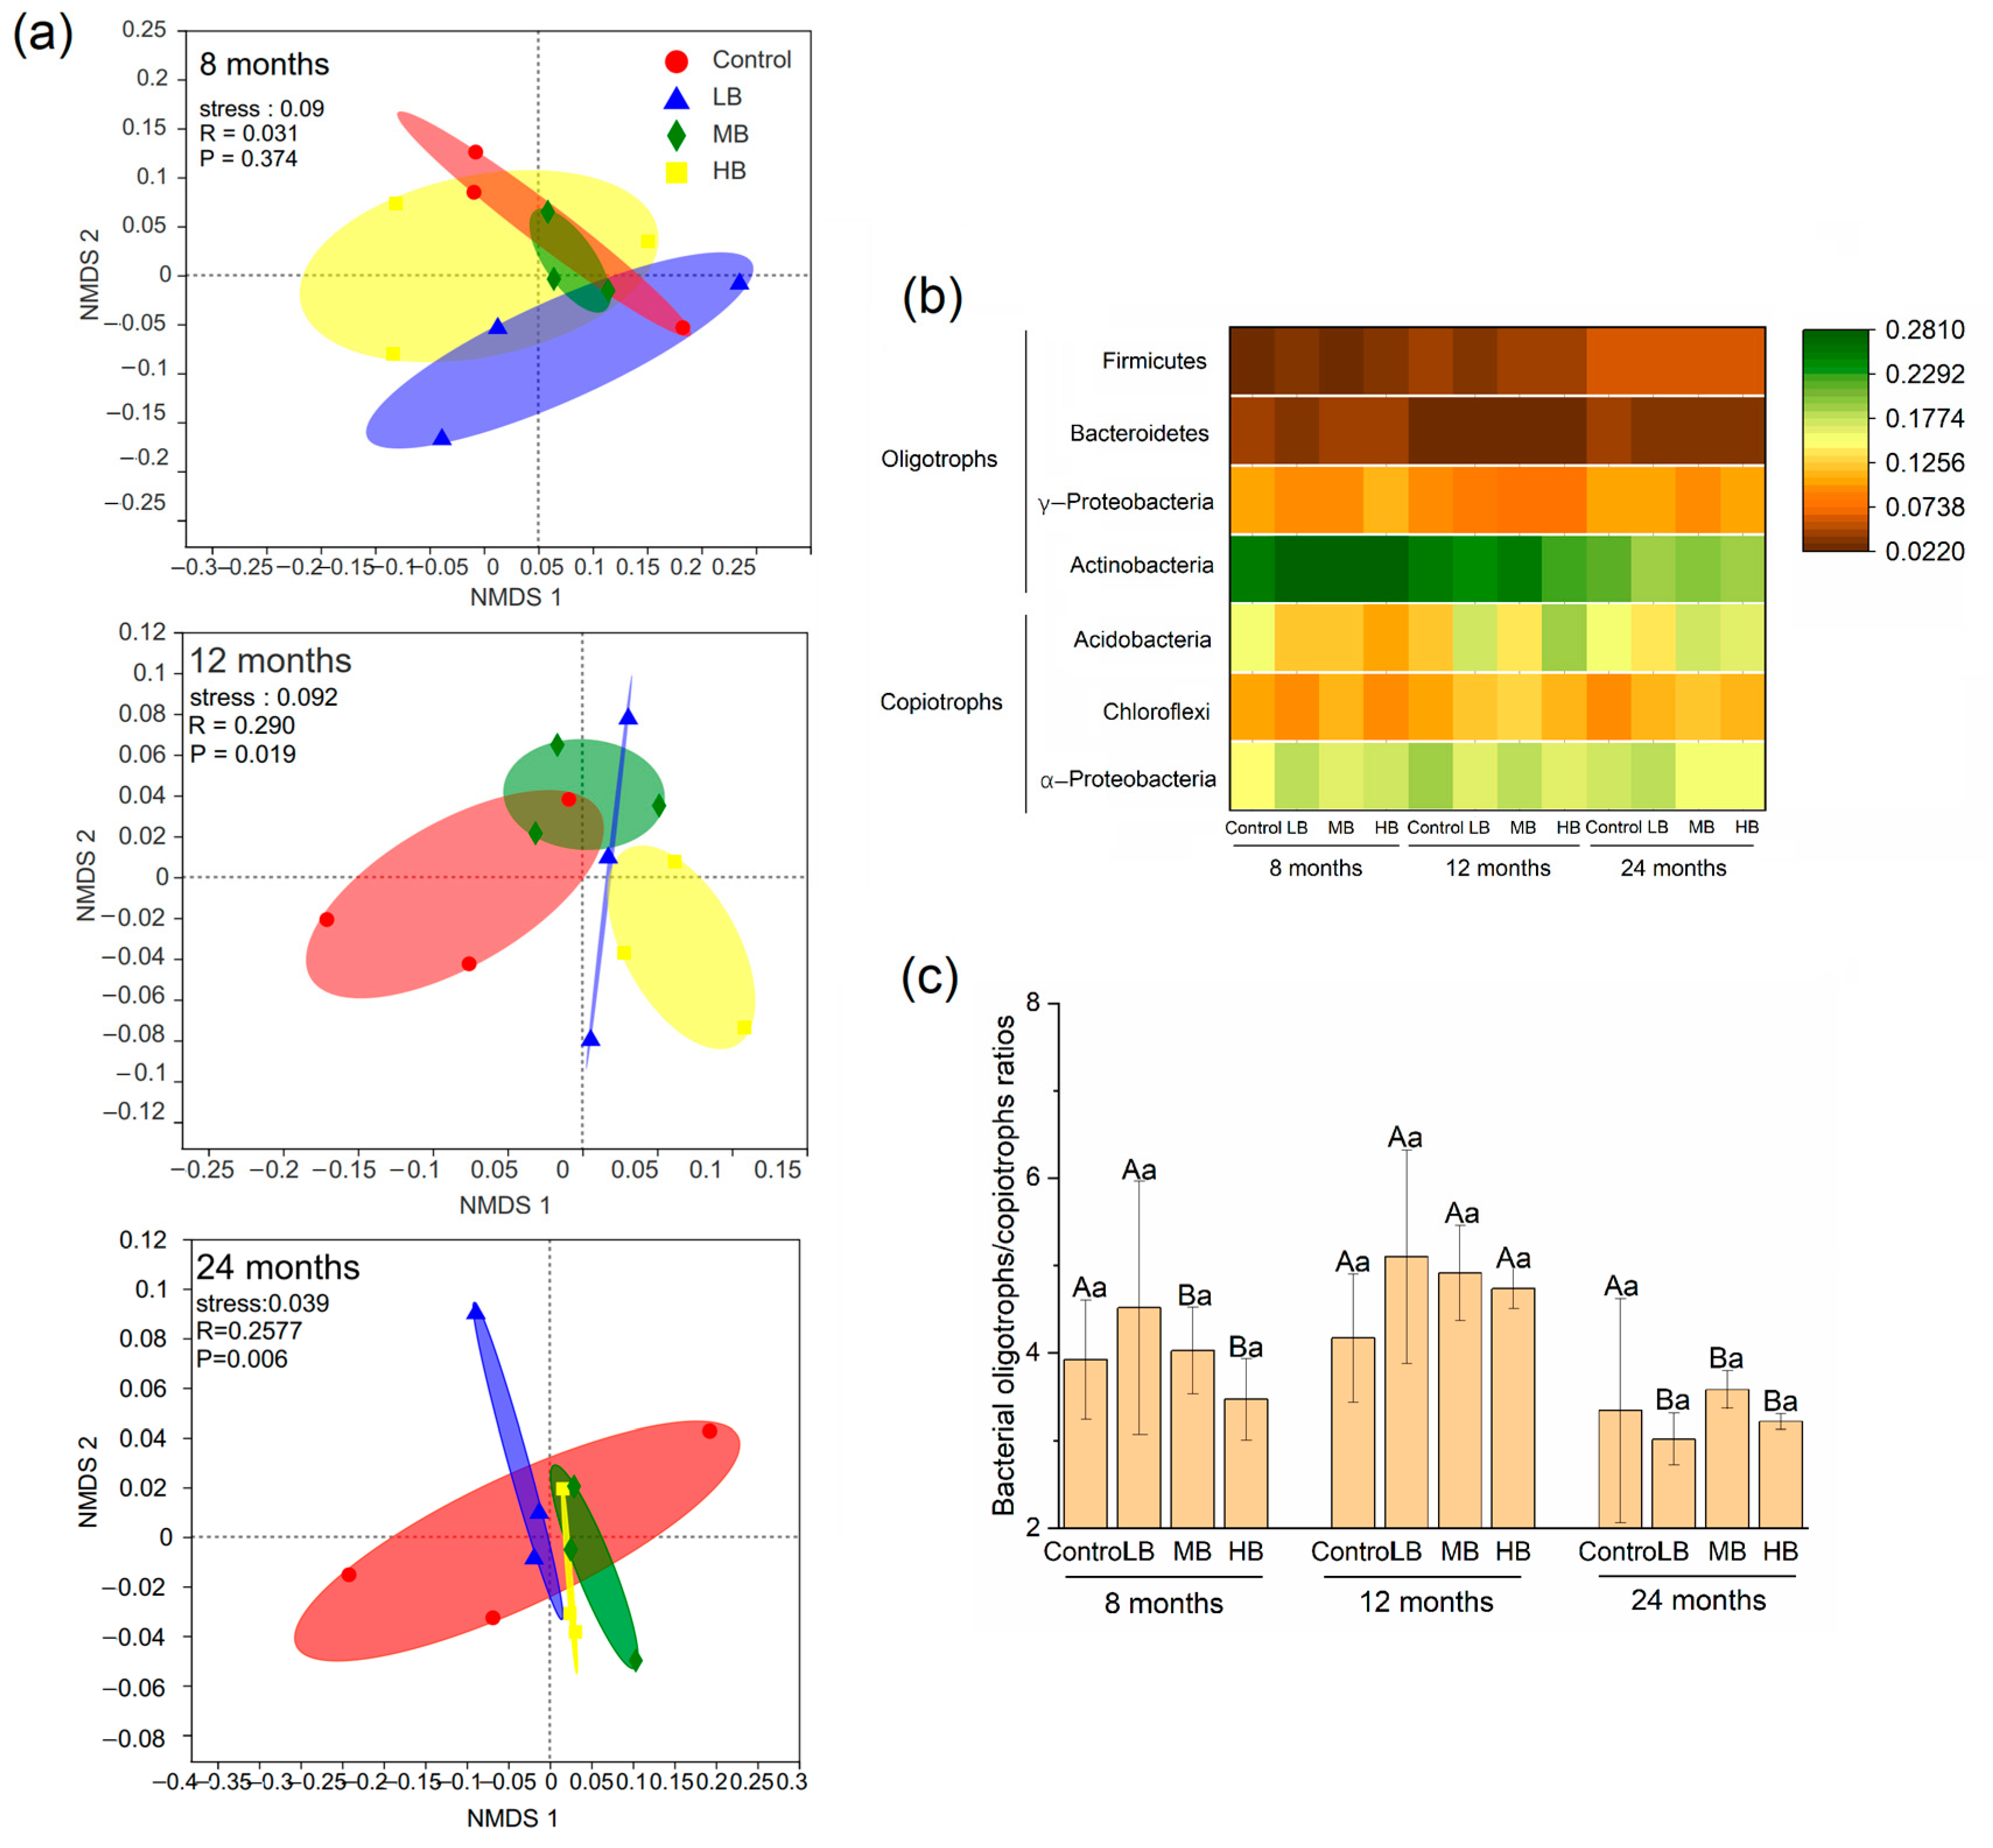
3.3. Bacterial Community Composition

The biochar application rate significantly altered the bacterial groups after 12 and 24 months (p < 0.05; Figure 3a). The predominant bacterial components under different treatments were similar. The total relative abundance of Actinobacteria, Proteobacteria, Acidobacteria, Chloroflexi, and Firmicutes accounted for approximately 83% (Figure S1). Specifically, compared with the control, HB increased the relative abundance of the oligotrophs, Acidobacteria and Actinobacteria, after 12 months of biochar application (p < 0.05; Figure 3b). After 24 months, the relative abundance of Chloroflexi was higher under HB than in the control group (p < 0.05). Over time, the relative abundance of Firmicutes, which are copiotrophs, significantly increased after 24 months of biochar application in all treatments (p < 0.05). The relative abundance of γ-Proteobacteria and Bacteroidetes under MB and HB decreased over time (p < 0.05). The relative abundance of Actinobacteria decreased with an increase in the biochar application rate and time (p < 0.05). The relative abundance of Acidobacteria with MB and HB increased over time (p < 0.05). The bacterial oligotroph/copiotroph ratio was not affected by biochar treatment but was higher after 12 months of MB and HB application than after 8 and 24 months (p < 0.05).

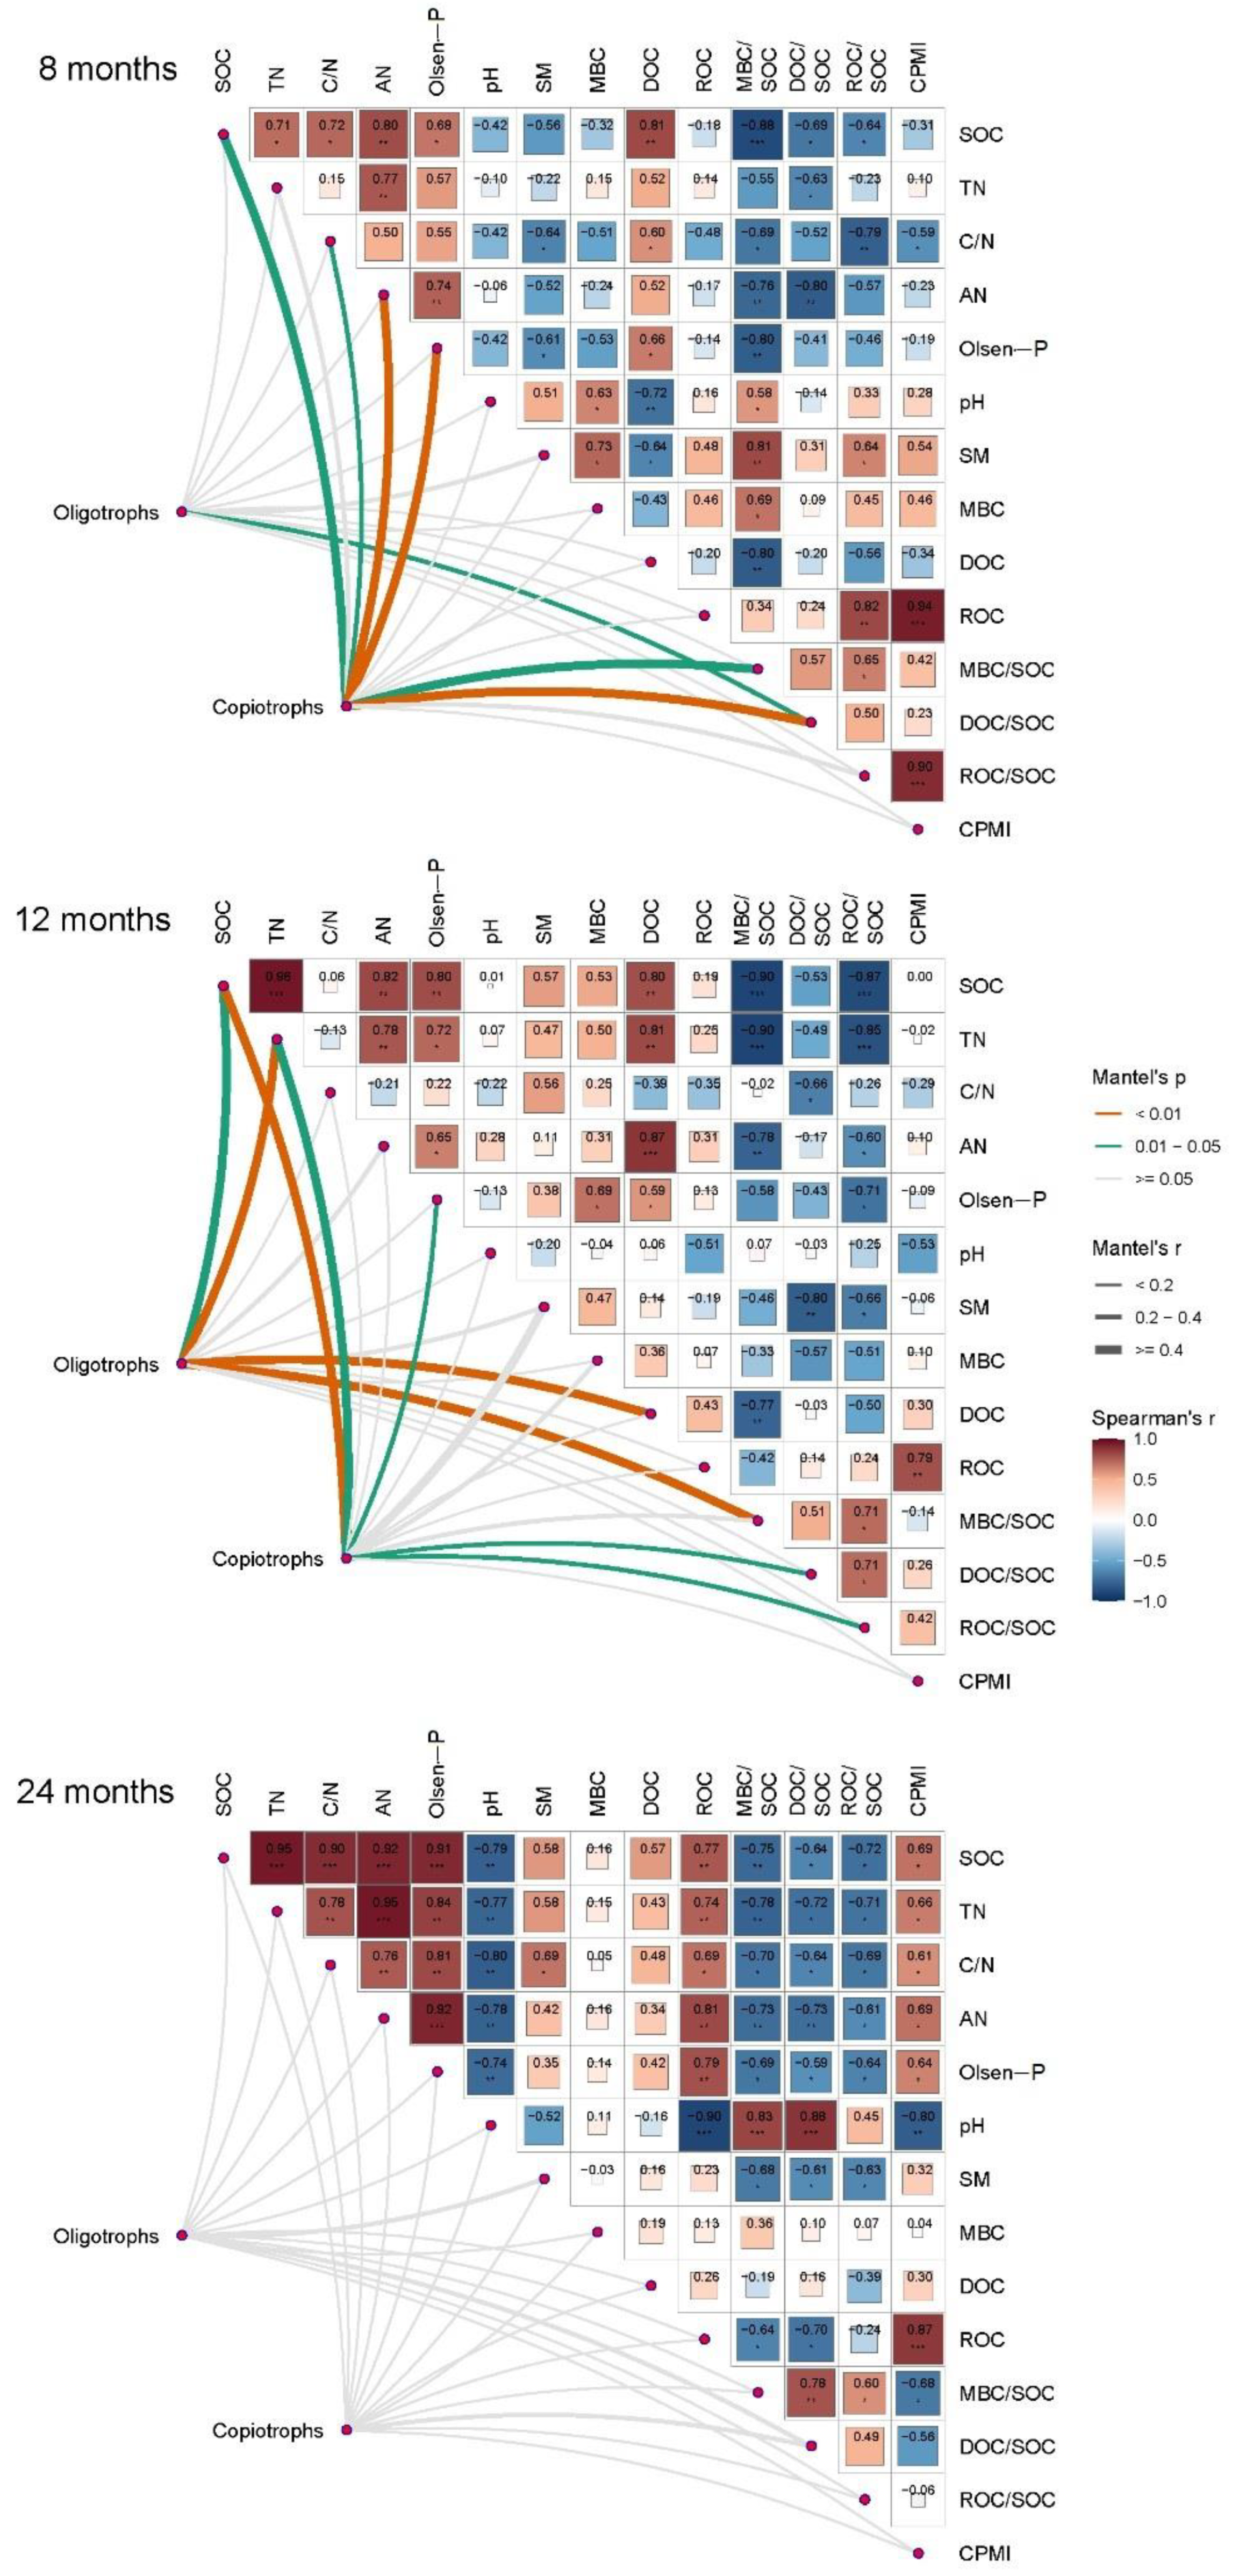
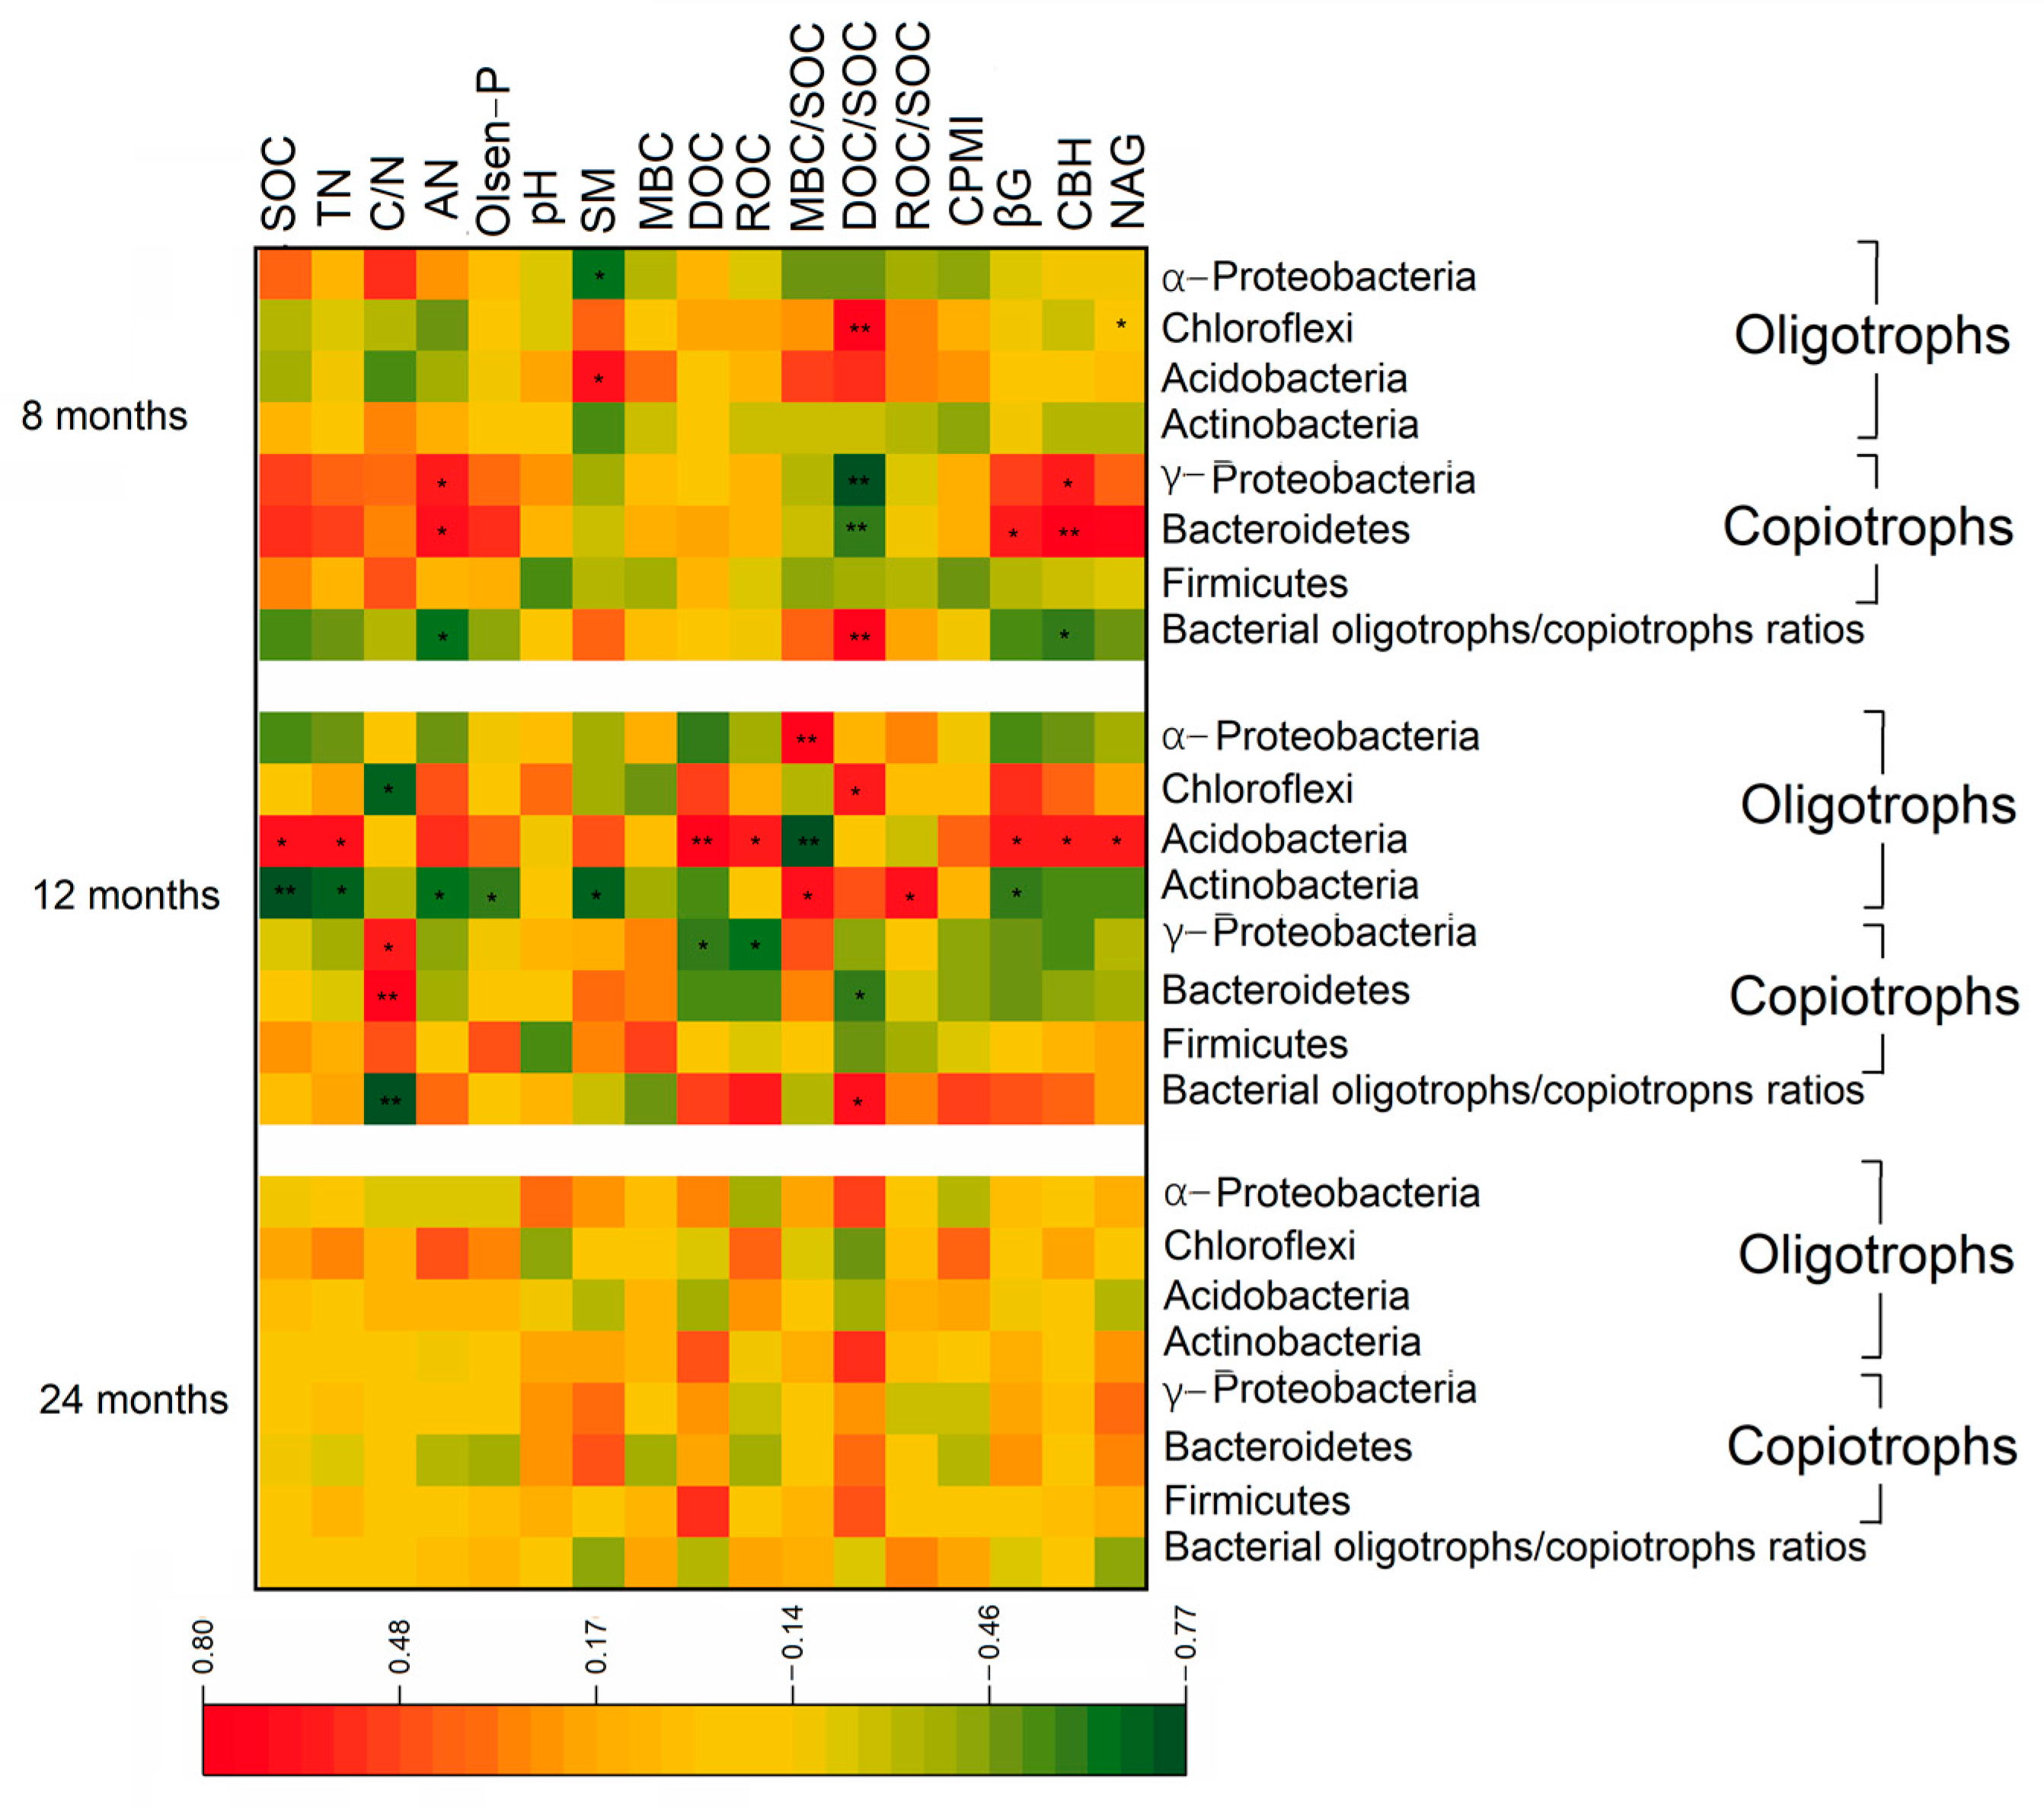
3.4. Relationship of Enzyme Activities and Bacterial Community to Soil Physiochemical Properties and Organic Carbon Stabilization

The links between soil physicochemical properties, enzyme activities, and bacterial groups changed over time. The activities of βG, CBH, and NAG were negatively correlated with the MBC/SOC and ROC/SOC ratios during the entire incubation period (p < 0.05, Table 2). The CPMI had a positive correlation with βG activity after 8 months of biochar application and had a positive correlation with CBH activity after 24 months of treatment (Figure 4, p < 0.05).
From the mantel test, there was a positive relation between the oligotroph composition and DOC/SOC ratio after 8 months of biochar application. After 12 months, the oligotroph composition had a positive correlation with SOC, TN, DOC, and the MBC/SOC ratio. SOC, Olsen-P, and the ratio of DOC/SOC always had a positive relationship with the composition of copiotrophs after 8 and 24 months (Figure 5, p < 0.05). The DOC/SOC ratio had a negative correlation with the relative abundance of Bacteroidetes but positive correlations with the relative abundance of Chloroflexi and the bacterial oligotroph/copiotroph ratio after 8 and 12 months (Figure 6, p < 0.05). The relative abundance of Actinobacteria was negatively affected by SOC, TN, the C/N ratio, and Olsen-P and positively correlated with the MBC/SOC and ROC/SOC ratios after 12 months of biochar application (p < 0.05). There were positive relationships between enzyme activities (βG, CBH, and NAG) and the relative abundance of Bacteroidetes and Acidobacteria after 8 and 12 months, respectively (p < 0.05).

4. Discussion

4.1. Change in Soil Organic Carbon Stabilization with Increase in Biochar Application Rate and Time

The increase in the biochar application rate increased soil SOC storage because of the high carbon content in the biochar [7,51,52]. Moreover, the functional groups such as phenolic and carbonyl C in biochar help to adsorb organic compounds [53,54]. Notably, the SOC content in HB did not change over time, which suggests that a high amount of biochar application was positive for C sequestration over time (Figure 1), while SOC in the control, LB, and MB decreased from 12 to 24 months after biochar application (p < 0.05). The possible reasons include (i) an extension of the disturbance time in agricultural production, such as fertilizing, irrigating, and plowing, led to more SOC losses [55]; (ii) the amount of carbon fixed by the high amount of biochar application was much higher than the carbon loss caused by the aging process of biochar [56]; and (iii) a high amount of biochar application may decrease SOC losses by increasing the formation of macro-aggregates, which protects the internal organic carbon from decomposition by microorganisms [57].
Generally, the ratio of soil labile organic carbon (such as DOC, MBC, and ROC) to SOC is used to evaluate the activity of SOC [58]. In this study, the DOC/SOC ratio decreased with time, indicating that the SOC in the soil was likely stable and difficult for soil microorganisms to decompose [59]. Biochar absorbs organic matter into its pore network and inhibits microbial access to carbon sources and growth in soil [60]. Therefore, the MBC/SOC ratio under HB was lower than that in other treatments (p < 0.05, Table 1), indicating that a high amount of biochar could improve the stabilization of SOC [61]. Similar to the results of Yang et al. (2018) [8], the ROC/SOC ratio in HB was lower than that in the other treatments (p < 0.05), indicating that HB can slow the turnover rate of SOC [62].
The CPMI reflects the C stabilization of the soil system [46]. In general, compared with the control, the effect of biochar on CPMI changed from negative to positive over time. The possible reasons are as follows: (i) the amount of organic compounds and nutrients in biochar increases the contents of labile organic fractions, enhances soil microbial activity and co-metabolism, and stimulates the turnover rate of organic C during the first several months of its application [63,64], and (ii) over time, biochar could enhance soil C stabilization by adsorbing organic C [9,63], forming organic–mineral complexes and aggregates [65] and regulating enzyme activities and the amount of some microbes involved in organic C decomposition and synthesis [17,66]. Generally, a higher CPMI value means an enhancement in organic C stabilization [67]. Our results demonstrate that the application of high amounts of biochar improved the stabilization of SOC over time.

4.2. Link between Carbon-Degrading Enzyme Activities and Organic Carbon Stabilization

In this study, biochar decreased βG activities after 8 months of application (p < 0.05). The possible reasons are as follows: (i) Biochar could inhibit some soil enzyme activities by adsorbing enzymes and reaction substrates or blocking the reaction sites via their porosity and surface [18,68,69]. Moreover, (ii) the input of available organic compounds may supply enough nutrients for microbes and lead to a decrease in some enzyme activities [49]. In contrast, an increase in carbon-degrading enzyme activities in response to the biochar application rate after 12 months of incubation may be due to the change in soil properties [20,70], such as the limitation in available N increasing the production of enzymes involved in C-degrading from microorganisms [41]; the significant correlations of soil TN, AN, and Olsen-P contents with βG, CBH, NAG, and bacterial communities in this experiment may indirectly support this suggestion (p < 0.05, Figure 5). Notably, after 12 and 24 months, the C-degrading enzyme activities in biochar treatments, especially in HB, were higher than those in the control (p < 0.05), which may be due to the reason that sufficiently high rates of biochar could increase enzyme activities by stimulating enzyme production and protecting enzymes from being degraded [18].
Soil-carbon-degrading enzymes play a key role in catalyzing SOC decomposition [71]. The negative correlations between the activities of βG, CBH, and NAG and the MBC/SOC and ROC/SOC ratios demonstrate that an increase in the proportion of recalcitrant C could stimulate the decomposition process by increasing carbon-degrading enzyme activity (Table 2). However, the roles of carbon-degrading enzymes in the decomposition of organic matter differ. CBH breaks down cellulose, while βG can further decompose cellobiose [14,72]. Therefore, the positive correlations between CPMI and βG and CBH activities after 8 and 24 months of treatment (p < 0.05) indicate an increase in recalcitrant C and an enhancement in organic carbon stability over time, respectively.

4.3. Regulation of Bacterial Oligotrophs and Copiotrophs for Organic Carbon Stabilization

A change in soil properties stimulates the dissimilarity of microbial groups [20,73]. The biochar application rate and aging process affect microbial community composition by altering microbial growth habitat, such as the proportion of soil aggregates, nutrient availability, and soil moisture [28,39]. Yao et al. (2017) [38] considered that the long-term “aged” biochar is likely to lead to different equilibriums for physicochemical exchange and enzyme and microbial activities than those of “fresh” biochar. Therefore, biochar significantly altered the bacterial community structure 12 and 24 months after application.
Based on carbon-use trophic strategies, copiotrophs tend to grow by utilizing labile organic carbon; oligotrophs tend to use recalcitrant organic carbon [26,41]. DOC can be used by microorganisms as a carbon source and is produced by the decomposition of enzymes released by oligotrophs and copiotrophs [24,41]. Therefore, the DOC content and ratio of DOC/SOC were positively correlated with the oligotrophic and copiotrophic bacterial communities, especially after 8 and 12 months of treatments (p < 0.05). Most oligotrophs can degrade recalcitrant C substrates by releasing C-degrading enzymes, whereas copiotrophs can use low-molecular-weight organic substances directly [24,41]; therefore, an increase in the bacterial oligotroph/copiotroph ratio means an increase in the DOC/SOC ratio (Figure 6), while the decreasing tendency of the bacterial oligotroph/copiotroph ratio after 24 months of treatment indicates an increase in the stabilization of organic C.
As the dominant phyla, the relative abundance of Acidobacteria and Actinobacteria after 12 months of biochar application and Chloroflexi after 24 months of biochar application, with HB, was higher than those in the control (p < 0.05), while the relative abundance of γ-Proteobacteria and Bacteroidetes with MB and HB decreased over time (p < 0.05). As in previous studies, with the prolongation of biochar application and the exhaustion of available organic carbon [52], recalcitrant carbon from soil and biochar provided competitive living species, such as slow-growing oligotrophs, with a degradation capacity for complex carbon sources [26,74]. The negative relationship between the DOC/SOC ratio and the relative abundance of Bacteroidetes and the positive relationship with Chloroflexi after 8 and 12 months of treatments support this viewpoint. Moreover, the increase in the relative abundance of Acidobacteria with MB and HB over time in our study means an increase in the proportion of recalcitrant organic carbon in soil.

5. Conclusions

Our study revealed that a high biochar application rate significantly increased SOC content, while the effect of biochar on the stabilization of SOC changed from negative to positive over time based on the CPMI. In general, the positive correlations between CPMI and βG and CBH activities indicate an increase in recalcitrant C and an enhancement in organic carbon stability over time. Compared with the control, HB always significantly decreased the soil DOC/SOC ratio on time scales, and its negative relation with bacterial oligotroph/copiotroph ratio means a high biochar application rate was useful for the stabilization of organic C. Our research suggests that an appropriate amount of biochar application is helpful to improve the stability of soil organic carbon on time scales and reduce agricultural carbon emissions.

Supplementary Materials

The following supporting information can be downloaded at: https://www.mdpi.com/article/10.3390/agronomy13051385/s1. Table S1. The main and interactive effects of biochar application rate and time on soil organic carbon (SOC), soil labile organic carbon components, carbon pool activity (A) and carbon pool management index (CPMI) based on two-way ANOVAs (p < 0.05). Figure S1. Change of the relative abundance of bacterial community under different biochar application on time scales.

Author Contributions

H.Q. responsible for the writing of the manuscript. Z.H. responsible for the analysis of soil properties. J.L. and H.Z. responsible for the experiment design and data analysis. W.S. responsible for the management of the field experiment. All authors have read and agreed to the published version of the manuscript.

Funding

This research was financially supported by the National Natural Science Foundation of China (42007089); the Research Foundation of Education Bureau of Anhui Province (2022AH030137, 2022AH051383, and 2022AH040211); the Doctoral Scientific Research Start-up Foundation of Suzhou University (2020BS022 and 2020BS023); the Development Fund of Suzhou University (2021fzjj26); and the Quality Engineering Project of Suzhou University (szxy2021cyxy06).

Data Availability Statement

The data that support the findings of this study are available from the corresponding author upon reasonable request.

Conflicts of Interest

The authors declare no conflict of interest.

References

  1. Das, S.; Chatterjee, S.; Rajbanshi, J. Responses of soil organic carbon to conservation practices including climate-smart agriculture in tropical and subtropical regions: A meta-analysis. Sci. Total Environ. 2022, 805, 150428. [Google Scholar] [CrossRef] [PubMed]
  2. Garnier, J.; Billen, G.; Tournebize, J.; Barré, P.; Mary, B.; Baudin, F. Storage or loss of soil active carbon in cropland soils: The effect of agricultural practices and hydrology. Geoderma 2022, 407, 115538. [Google Scholar] [CrossRef]
  3. Raza, S.T.; Wu, J.; Rene, E.R.; Ali, Z.; Chen, Z. Reuse of agricultural wastes, manure, and biochar as an organic application: A review on its implications for vermicomposting technology. J. Clean. Prod. 2022, 360, 132200. [Google Scholar] [CrossRef]
  4. Ventura, M.; Alberti, G.; Panzacchi, P.; Delle Vedove, G.; Miglietta, F.; Tonon, G. Biochar mineralization and priming effect in a poplar short rotation coppice from a 3-year field experiment. Biol. Fertil. Soils 2019, 55, 67–78. [Google Scholar] [CrossRef]
  5. Yang, Q.; Zhou, H.; Bartocci, P.; Fantozzi, F.; Masek, O.; Agblevor, F.A.; Wei, Z.; Yang, H.; Chen, H.; Lu, X.; et al. Prospective contributions of biomass pyrolysis to China’s 2050 carbon reduction and renewable energy goals. Nat. Commun. 2021, 12, 1698. [Google Scholar] [CrossRef]
  6. Zhou, Y.; Qin, S.; Verma, S.; Sar, T.; Sarsaiya, S.; Ravindran, B.; Liu, T.; Sindhu, R.; Patel, A.K.; Binod, P.; et al. Production and beneficial impact of biochar for environmental application: A comprehensive review. Bioresour. Technol. 2021, 337, 125451. [Google Scholar] [CrossRef]
  7. Majumder, S.; Neogi, S.; Dutta, T.; Powel, M.A.; Banik, P. The impact of biochar on soil carbon sequestration: Meta-analytical approach to evaluating environmental and economic advantages. J. Environ. Manag. 2019, 250, 109466. [Google Scholar] [CrossRef]
  8. Yang, X.; Wang, D.; Lan, Y.; Meng, J.; Jiang, L.; Sun, Q.; Cao, D.; Sun, Y.; Chen, W. Labile organic carbon fractions and carbon pool management index in a 3-year field study with biochar application. J. Soils Sediments 2018, 18, 1569–1578. [Google Scholar] [CrossRef]
  9. Liu, X.; Wang, W.; Peñuelas, J.; Sardans, J.; Chen, X.; Fang, Y.; Alrefaei, A.F.; Zeng, F.; Tariq, A. Effects of nitrogen-enriched biochar on subtropical paddy soil organic carbon pool dynamic. Sci. Total Environ. 2022, 851, 158322. [Google Scholar] [CrossRef]
  10. Maestrini, B.; Nannipieri, P.; Abiven, S. A meta-analysis on pyrogenic organic matter induced priming effect. Glob. Chang. Biol. Bioenergy 2015, 7, 577–590. [Google Scholar] [CrossRef]
  11. Wang, J.; Xiong, Z.; Kuzyakov, Y. Biochar stability in soil: Meta-analysis of decomposition and priming effects. Glob. Chang. Biol. Bioenergy 2016, 8, 512–523. [Google Scholar] [CrossRef]
  12. Luo, L.; Meng, H.; Gu, J. Microbial extracellular enzymes in biogeochemical cycling of ecosystems. J. Environ. Manag. 2017, 197, 539–549. [Google Scholar] [CrossRef] [PubMed]
  13. Bowles, T.M.; Acosta-Martínez, V.; Calderón, F.; Jackson, L.E. Soil enzyme activities, microbial communities, and carbon and nitrogen availability in organic agroecosystems across an intensively-managed agricultural landscape. Soil Biol. Biochem. 2014, 68, 252–262. [Google Scholar] [CrossRef]
  14. Liang, Q.; Gao, R.; Xi, B.; Zhang, Y.; Zhang, H. Long-term effects of irrigation using water from the river receiving treated industrial wastewater on soil organic carbon fractions and enzyme activities. Agric. Water Manag. 2014, 135, 100–108. [Google Scholar] [CrossRef]
  15. Meier, I.C.; Finzi, A.C.; Phillips, R.P. Root exudates increase N availability by stimulating microbial turnover of fast-cycling N pools. Soil Biol. Biochem. 2017, 106, 119–128. [Google Scholar] [CrossRef]
  16. Elzobair, K.A.; Stromberger, M.E.; Ippolito, J.A.; Lentz, R.D. Contrasting effects of biochar versus manure on soil microbial communities and enzyme activities in an Aridisol. Chemosphere 2015, 142, 145–152. [Google Scholar] [CrossRef]
  17. Li, Q.; Song, X.; Yrjälä, K.; Lv, J.; Li, Y.; Wu, J.; Qin, H. Biochar mitigates the effect of nitrogen deposition on soil bacterial community composition and enzyme activities in a Torreya grandis orchard. For. Ecol. Manag. 2020, 457, 117717. [Google Scholar] [CrossRef]
  18. Elzobair, K.A.; Stromberger, M.E.; Ippolito, J.A. Stabilizing effect of biochar on soil extracellular enzymes after a denaturing stress. Chemosphere 2016, 142, 114–119. [Google Scholar] [CrossRef]
  19. Foster, E.J.; Fogle, E.J.; Cotrufo, M.F. Sorption to biochar impacts β-glucosidase and phosphatase enzyme activities. Agriculture 2018, 8, 158. [Google Scholar] [CrossRef]
  20. Song, D.; Xi, X.; Zheng, Q.; Liang, G.; Zhou, W.; Wang, X. Soil nutrient and microbial activity responses to two years after maize straw biochar application in a calcareous soil. Ecotoxicol. Environ. Saf. 2019, 180, 348–356. [Google Scholar] [CrossRef]
  21. Gul, S.; Whalen, J.K.; Thomas, B.W.; Sachdeva, V.; Deng, H. Physico-chemical properties and microbial responses in biochar-amended soils: Mechanisms and future directions. Agric. Ecosyst. Environ. 2015, 206, 46–59. [Google Scholar] [CrossRef]
  22. Li, S.; Zhang, S.; Pu, Y.; Li, T.; Xu, X.; Jia, Y.; Deng, O.; Gong, G. Dynamics of soil labile organic carbon fractions and C-cycle enzyme activities under straw mulch in Chengdu Plain. Soil Tillage Res. 2016, 155, 289–297. [Google Scholar] [CrossRef]
  23. Burns, R.G.; DeForest, J.L.; Marxsen, J.; Sinsabaugh, R.L.; Stromberger, M.E.; Wallenstein, M.D.; Weintraub, M.N.; Zoppini, A. Soil enzyme in changing environment: Current knowledge and future directions. Soil Biol. Biochem. 2013, 58, 216–234. [Google Scholar] [CrossRef]
  24. Wang, C.; Xue, L.; Jiao, R. Soil organic carbon fractions, C-cycling associated hydrolytic enzymes, and microbial carbon metabolism vary with stand age in Cunninghamia lanceolate (Lamb.) Hook plantations. For. Ecol. Manag. 2021, 482, 118887. [Google Scholar] [CrossRef]
  25. Qiu, H.; Liu, J.; Boorboori, M.R.; Li, D.; Chen, S.; Ma, X.; Cheng, P.; Zhang, H. Effect of biochar application rate on changes in soil labile organic carbon fractions and the association between bacterial community assembly and carbon metabolism with time. Sci. Total Environ. 2023, 855, 158876. [Google Scholar] [CrossRef] [PubMed]
  26. Fierer, N.; Bradford, M.A.; Jackson, R.B. Toward an ecological classification of soil bacteria. Ecology 2007, 88, 1354–1364. [Google Scholar] [CrossRef] [PubMed]
  27. Razanamalala, K.; Razafimbelo, T.; Maron, P.A.; Ranjard, L.; Chemidlin, N.; Lelièvre, M.; Dequiedt, S.; Ramaroson, V.H.; Marsden, C.; Becquer, T.; et al. Soil microbial diversity drives the priming effect along climate gradients: A case study in Madagascar. ISME J. 2018, 12, 451–462. [Google Scholar] [CrossRef]
  28. Burrell, L.D.; Zehetner, F.; Rampazzo, N.; Wimmer, B.; Soja, G. Long-term effects of biochar on soil physical properties. Geoderma 2016, 282, 96–102. [Google Scholar] [CrossRef]
  29. Wu, P.; Ata-Ul-Karim, S.T.; Singh, B.P.; Wang, H.; Wu, T.; Liu, C.; Fang, G.; Zhou, D.; Wang, Y.; Chen, W. A scientometric review of biochar research in the past 20 years (1998–2018). Biochar 2019, 1, 23–43. [Google Scholar] [CrossRef]
  30. Gomez, J.D.; Denef, K.; Stewart, C.E.; Zheng, J.; Cotrufo, M.F. Biochar addition rate influences soil microbial abundance and activity in temperate soils. Eur. J. Soil Sci. 2014, 65, 28–39. [Google Scholar] [CrossRef]
  31. Wu, H.; Zeng, G.; Liang, J.; Chen, J.; Xu, J.; Dai, J.; Li, X.; Chen, M.; Xu, P.; Zhou, Y.; et al. Responses of bacterial community and functional marker genes of nitrogen cycling to biochar, compost and combined applications in soil. Appl. Microbiol. Biotechnol. 2016, 100, 8583–8591. [Google Scholar] [CrossRef] [PubMed]
  32. Ding, G.C.; Pronk, G.J.; Babin, D.; Heuer, H.; Heister, K.; Kogel-Knabner, I.; Smalla, K. Mineral composition and charcoal determine the bacterial community structure. in artificial soils. FEMS Microbiol. Ecol. 2013, 86, 15–25. [Google Scholar] [CrossRef] [PubMed]
  33. Hu, L.; Cao, L.X.; Zhang, R.D. Bacterial and fungal taxon changes in soil microbial community composition induced by short-term biochar application in red oxidized loam soil. World J. Microbiol. Biotechnol. 2014, 30, 1085–1092. [Google Scholar] [CrossRef] [PubMed]
  34. Cheng, J.; Lee, X.; Tang, Y.; Zhang, Q. Long-term effects of biochar application on rhizosphere and bulk soil microbial communities in a karst region, southwest China. Appl. Soil Ecol. 2019, 140, 126–134. [Google Scholar] [CrossRef]
  35. Palansooriya, K.N.; Wong, J.T.F.; Hashimoto, Y.; Huang, L.; Rinklebe, J.; Chang, S.X.; Bolan, N.; Wang, H.; Ok, Y.S. Response of microbial communities to biochar- amended soils: A critical review. Biochar 2019, 1, 3–22. [Google Scholar] [CrossRef]
  36. Kavitha, B.; Reddy, P.V.L.; Kim, B.; Lee, S.S.; Pandey, S.K.; Kim, K.H. Benefits and limitations of biochar application in agricultural soils: A review. J. Environ. Manag. 2018, 227, 146–154. [Google Scholar] [CrossRef]
  37. Zhang, X.; Zhang, Q.; Zhan, L.; Xu, X.; Bi, R.; Xiong, Z. Biochar addition stabilized soil carbon sequestration by reducing temperature sensitivity of mineralization and altering the microbial community in a greenhouse vegetable field. J. Environ. Manag. 2022, 313, 114972. [Google Scholar] [CrossRef]
  38. Yao, Q.; Liu, J.; Yu, Z.; Li, Y.; Jin, J.; Liu, X.; Wang, G. Changes of bacterial community compositions after three years of biochar application in a black soil of northeast China. Appl. Soil Ecol. 2017, 113, 11–21. [Google Scholar] [CrossRef]
  39. Yang, Y.; Sun, K.; Han, L.; Chen, Y.; Liu, J.; Xing, B. Biochar stability and impact on soil organic carbon mineralization depend on biochar processing, aging and soil clay content. Soil Biol. Biochem. 2022, 169, 108657. [Google Scholar] [CrossRef]
  40. Li, H.; Yang, S.; Semenov, M.V.; Yao, F.; Ye, J.; Bu, R.; Ma, R.; Lin, J.; Kurganova, I.; Wang, X.; et al. Temperature sensitivity of SOM decomposition is linked with a K-selected microbial community. Glob. Chang. Biol. 2021, 27, 2763–2779. [Google Scholar] [CrossRef]
  41. Chen, X.; Luo, M.; Liu, Y.; Tan, J.; Zhang, C.; Tan, F.; Huang, J. Linking carbon-degrading enzyme activity to microbial carbon-use trophic strategy under salinization in a subtropical tidal wetland. Appl. Soil Ecol. 2022, 174, 104421. [Google Scholar] [CrossRef]
  42. Nelson, D.W.; Sommers, L.E. Total carbon, organic carbon and organic matter. In Methods of Soil Analysis, Part 2, Chemical and Microbiological Properties, 2nd ed.; Page, A.L., Miller, R.H., Keeney, D.R., Eds.; American Society of Agronomy, Inc.: Madison, WI, USA, 1982; pp. 539–579. [Google Scholar] [CrossRef]
  43. Bremner, J.M. Nitrogen–total. In Methods of Soil Analysis: Chemical Methods, Part 3; Sparks, D.L., Ed.; Soil Science Society of America, Inc.: Madison, WI, USA, 1996; pp. 1085–1087. [Google Scholar] [CrossRef]
  44. Cambardella, C.A.; Moorman, T.B.; Novak, J.M.; Parkin, T.B.; Karlen, D.L.; Turco, R.F.; Konopka, A.E. Field-scale variability of soil properties in central lowa soils. Soil Sci. Soc. Am. J. 1994, 58, 1501. [Google Scholar] [CrossRef]
  45. Sun, Q.; Qiu, H.; Hu, Y.; Wei, X.; Chen, X.; Ge, T.; Wu, J.; Su, Y. Cellulose and lignin regulate partitioning of soil phosphorus fractions and alkaline phosphomonoesterase encoding bacterial community in phosphorus-deficient soils. Biol. Fertil. Soils 2019, 55, 31–42. [Google Scholar] [CrossRef]
  46. Blair, G.J.; Lefroy, R.D.; Lisle, L. Soil carbon fractions based on their degree of oxidation, and the development of a carbon management index for agricultural systems. Aust. J. Agric. Res. 1995, 46, 1459–1466. [Google Scholar] [CrossRef]
  47. Wu, J.; Joergensen, R.G.; Pommerening, B.; Chaussod, R.; Brookes, P.C. Measurement of soil microbial biomass C by fumigation-extraction–an automated procedure. Soil Biol. Biochem. 1990, 22, 1167–1169. [Google Scholar] [CrossRef]
  48. Marx, M.C.; Wood, M.; Jarvis, S.C. A microplate fluorimetric assay for the study of enzyme diversity in soils. Soil Biol. Biochem. 2001, 33, 1633–1640. [Google Scholar] [CrossRef]
  49. Qiu, H.; Liu, J.; Chen, X.; Hu, Y.; Su, Y.; Ge, T.; Li, D.; Wu, J. Rice straw carbon mineralization is affected by the timing of exogenous glucose addition in flooded paddy soil. Appl. Soil Ecol. 2022, 173, 104374. [Google Scholar] [CrossRef]
  50. DeForest, J.L. The influence of time, storage temperature, and substrate age on potential soil enzyme activity in acidic forest soils using MUB-linked substrates and L-DOPA. Soil Biol. Biochem. 2009, 41, 1180–1186. [Google Scholar] [CrossRef]
  51. Yang, H.; Shelton, S.; Guo, W.; van Groenigen, K.J. Differential responses of carbon-degrading enzyme activities to warming: Implications for soil respiration. Glob. Chang. Biol. 2018, 24, 4816–4826. [Google Scholar] [CrossRef]
  52. Jiang, X.; Tan, X.; Cheng, J.; Haddix, M.L.; Cotrufo, M.F. Interactions between aged biochar, fresh low molecular weight carbon and soil organic carbon after 3.5 years soil-biochar incubations. Geoderma 2019, 333, 99–107. [Google Scholar] [CrossRef]
  53. Yi, Q.; Liang, B.; Nan, Q.; Wang, H.; Zhang, W.; Wu, W. Temporal physicochemical changes and transformation of biochar in a rice paddy: Insights from a 9-year field experiment. Sci. Total Environ. 2020, 721, 137670. [Google Scholar] [CrossRef] [PubMed]
  54. Zheng, H.; Liu, D.; Liao, X.; Miao, Y.; Li, Y.; Li, J.; Yuan, J.; Chen, Z.; Ding, W. Field-aged biochar enhances soil organic carbon by increasing recalcitrant organic carbon fractions and making microbial communities more conducive to carbon sequestration. Agric. Ecosyst. Environ. 2022, 340, 108177. [Google Scholar] [CrossRef]
  55. Bohoussou, Y.N.; Kou, Y.; Yu, W.; Lin, B.; Latif Virk, A.; Zhao, X.; Dang, Y.P.; Zhang, H.L. Impacts of the components of conservation agriculture on soil organic carbon and total nitrogen storage: A global meta-analysis. Sci. Total Environ. 2022, 842, 156822. [Google Scholar] [CrossRef] [PubMed]
  56. Woolf, D.; Lehmann, J. Modelling the long-term response to positive and negative priming of soil organic carbon by black carbon. Biogeochemistry 2012, 111, 83–95. [Google Scholar] [CrossRef]
  57. Han, L.; Sun, K.; Yang, Y.; Xia, X.; Li, F.; Yang, Z.; Xing, B. Biochar’s stability and effect on the content, composition and turnover of soil organic carbon. Geoderma 2020, 364, 114184. [Google Scholar] [CrossRef]
  58. Sheng, H.; Zhou, P.; Zhang, Y.; Kuzyakov, Y.; Zhou, Q.; Ge, T.; Wang, G. Loss of labile organic carbon from subsoil due to land-use changes in subtropical China. Soil Biol. Biochem. 2015, 88, 148–157. [Google Scholar] [CrossRef]
  59. Huang, R.; Lan, T.; Song, X.; Li, J.; Ling, J.; Deng, O.; Wang, C.; Gao, X.; Li, Q.; Tang, X.; et al. Soil labile organic carbon impacts C:N:P stoichiometry in urban park green spaces depending on vegetation types and time after planting. Appl. Soil Ecol. 2021, 163, 103926. [Google Scholar] [CrossRef]
  60. El-Naggar, A.; El-Naggar, A.H.; Shaheen, S.M.; Sarkar, B.; Chang, S.X.; Tsang, D.C.W.; Rinklebe, J.; Ok, Y.S. Biochar composition-dependent impacts on soil nutrient release, carbon mineralization, and potential environmental risk: A review. J. Environ. Manag. 2019, 241, 458–467. [Google Scholar] [CrossRef]
  61. Sun, T.; Wang, Y.; Hui, D.; Jing, X.; Feng, W. Soil properties rather than climate and ecosystem type control the vertical variations of soil organic carbon, microbial carbon, and microbial quotient. Soil Biol. Biochem. 2020, 148, 107905. [Google Scholar] [CrossRef]
  62. Ma, L.; Lv, X.; Cao, N.; Wang, Z.; Zhou, Z.; Meng, Y. Alterations of soil labile organic carbon fractions and biological properties under different residue-management methods with equivalent carbon input. Appl. Soil Ecol. 2021, 161, 103821. [Google Scholar] [CrossRef]
  63. Chagas, J.K.M.; Figueiredo, C.C.D.; Ramos, M.L.G. Biochar increases soil carbon pools: Evidence from a global meta-analysis. J. Environ. Manag. 2022, 305, 114403. [Google Scholar] [CrossRef]
  64. Zimmerman, A.R.; Gao, B.; Ahn, M.Y. Positive and negative carbon mineralization priming effects among a variety of biochar-amended soils. Soil Biol. Biochem. 2011, 43, 1169–1179. [Google Scholar] [CrossRef]
  65. Han, L.; Zhang, B.; Chen, L.; Feng, Y.; Yang, Y.; Sun, K. Impact of biochar application on soil aggregation varied with incubation duration and biochar pyrolysis temperature. Biochar 2021, 3, 339–347. [Google Scholar] [CrossRef]
  66. Zhang, S.; Fang, Y.; Luo, Y.; Li, Y.; Ge, T.; Wang, Y.; Wang, H.; Yu, B.; Song, X.; Chen, J.; et al. Linking soil carbon availability, microbial community composition and enzyme activities to organic carbon mineralization of a bamboo forest soil amended with pyrogenic and fresh organic matter. Sci. Total Environ. 2021, 801, 149717. [Google Scholar] [CrossRef] [PubMed]
  67. Gami, S.K.; Lauren, J.G.; Duxbury, J.M. Soil organic carbon and nitrogen stocks in Nepal long-term soil fertility experiments. Soil Tillage Res. 2009, 106, 95–103. [Google Scholar] [CrossRef]
  68. Lammirato, C.; Miltner, A.; Kaestner, M. Effects of wood char and activated carbon on the hydrolysis of cellobiose by β-glucosidase from Aspergillus Niger. Soil Biol. Biochem. 2011, 43, 1936–1942. [Google Scholar] [CrossRef]
  69. Liao, X.; Kang, H.; Haidar, G.; Wang, W.; Malghani, S. The impact of biochar on the activities of soil nutrients acquisition enzymes is potentially controlled by the pyrolysis temperature: A meta-analysis. Geoderma 2022, 411, 115692. [Google Scholar] [CrossRef]
  70. Li, S.; Wang, S.; Fan, M.; Wu, Y.; Shangguan, Z. Interactions between biochar and nitrogen impact soil carbon mineralization and the microbial community. Soil Tillage Res. 2020, 196, 104437. [Google Scholar] [CrossRef]
  71. Zhao, S.; Li, K.; Zhou, W.; Qiu, S.; Huang, S.; He, P. Changes in soil microbial community, enzyme activities and organic matter fractions under long-term straw return in north-central China. Agric. Ecosyst. Environ. 2016, 216, 82–88. [Google Scholar] [CrossRef]
  72. Wickings, K.; Grandy, A.S.; Reed, S.C.; Cleveland, C.C. The origin of litter chemical complexity during decomposition. Ecol. Lett. 2012, 15, 1180–1188. [Google Scholar] [CrossRef]
  73. Wang, C.; Lu, X.; Mori, T.; Mao, Q.; Zhou, K.; Zhou, G.; Nie, Y.; Mo, J. Responses of soil microbial community to continuous experimental nitrogen additions for 13 years in a nitrogen-rich tropical forest. Soil Biol. Biochem. 2018, 121, 103–112. [Google Scholar] [CrossRef]
  74. Zhu, X.; Mao, L.; Che, B. Driving forces linking microbial community structure and functions to enhanced carbon stability in biochar-amended soil. Environ. Int. 2019, 133, 105211. [Google Scholar] [CrossRef] [PubMed]
Figure 1. Change in soil organic carbon (SOC) with biochar application rate and time extension. Different capital letters mean the difference in SOC contents with time under the same treatment (p < 0.05). Different lowercase letters mean the difference in SOC contents with different treatments over the same time (p < 0.05).
Agronomy 13 01385 g001
Figure 2. Change in C-degradation enzyme activities with biochar application rate and time extension. Different capital letters mean the differences in SOC contents with time under the same treatment (p < 0.05). Different lowercase letters mean the differences in SOC contents with different treatments over the same time (p < 0.05).
Agronomy 13 01385 g002aAgronomy 13 01385 g002b
Figure 3. Effect of biochar applications on soil bacterial community composition with time. (a) Non-metric multidimensional scaling (NMDS) of bacterial communities among different biochar additions. (b) The relative abundance of bacterial communities belonging to copiotrophs and oligotrophs at the phylum level. (c) Change in bacterial oligotroph/copiotroph ratios. Different lower letters mean the differences in bacterial oligotroph/copiotroph ratios with different treatments under the same time (p < 0.05). Different capital letters mean the differences in bacterial oligotroph/copiotroph ratios with time under the same treatment (p < 0.05).
Agronomy 13 01385 g003
Figure 4. Relationship of C-degrading enzyme activities with change in carbon pool management index (CPMI). The pink area means confidence bands.
Agronomy 13 01385 g004
Figure 5. Effect of soil physiochemical properties on C-degrading enzyme activities and bacterial communities belonging to copiotrophs and oligotrophs with time. * is significant at p < 0.05; ** is significant at p < 0.01; *** is significant at p < 0.005.
Agronomy 13 01385 g005
Figure 6. Pearson correlations between soil physiochemical properties, C-degrading enzyme activities, and specific bacterial oligotrophs and copiotrophs. * is significant at p < 0.05; ** is significant at p < 0.01.
Agronomy 13 01385 g006
Table 1. Change in labile organic C fractions, including dissolved organic C (DOC), microbial biomass C (MBC), and readily oxidizable carbon C (ROC), accounting for total SOC (%), carbon pool management index (CPMI) in different biochar treatments with time.
TimeTreatmentsDOC/SOCMBC/SOCROC/SOCCPMI
8 monthsControl1.25 ± 0.10 Aa2.99 ± 0.31 Ba25.70 ± 5.32 Aa100.00 ± 0.00 a
LB1.25 ± 0.17 Aa2.68 ± 0.30 Bab17.98 ± 0.96 Ab67.21 ± 8.01 Bc
MB1.25 ± 0.07 Aa2.37 ± 0.05 Bb19.05 ± 0.83 Bb78.69 ± 6.69 Cb
HB1.09 ± 0.11 Aa1.86 ± 0.22 Bc14.70 ± 1.98 Ab66.50 ± 3.79 Bc
12 monthsControl0.53 ± 0.03 Ba6.14 ± 0.66 Aa19.20 ± 1.75 Aa100.00 ± 0.00 a
LB0.59 ± 0.08 Ba5.14 ± 0.35 Ab17.99 ± 3.55 Aab102.51 ± 14.54 Aa
MB0.53 ± 0.03 Ba5.19 ± 0.42 Ab15.44 ± 1.27 Cab94.89 ± 8.49 Ba
HB0.49 ± 0.05 Ba4.47 ± 0.31 Ab14.46 ± 1.76 Ab104.05 ± 8.33 Aa
24 monthsControl0.38 ± 0.05 Ca2.24 ± 0.18 Ba21.55 ± 1.05 Aa100.00 ± 0.00 b
LB0.34 ± 0.02 Ca2.27 ± 0.26 Ba21.92 ± 1.30 Aa100.87 ± 3.27 Ab
MB0.33 ± 0.02 Ca2.07 ± 0.18 Ba21.97 ± 2.29 Aa117.95 ± 8.58 Aa
HB0.25 ± 0.05 Cb1.37 ± 0.14 Cb16.37 ± 0.34 Ab116.09 ± 7.93 Aa
Note: Different capital letters mean the differences in labile organic C fractions with time under the same treatment (p < 0.05). Different lowercase letters mean the differences in labile organic C fractions with different treatments over the same time (p < 0.05).
Table 2. Correlations among the C-degrading enzyme activities and soil labile organic carbon components with time.
Time DOC/SOCMBC/SOCROC/SOC
8 monthsβG−0.348−0.051−0.275
CBH−0.571−0.283−0.117
NAG−0.308−0.320−0.267
12 monthsβG−0.045−0.843 **−0.660 *
CBH−0.140−0.863 **−0.617 *
NAG−0.207−0.705 *−0.595 *
24 monthsβG−0.499−0.772 **−0.803 **
CBH−0.607 *−0.889 **−0.777 **
NAG−0.402−0.788 **−0.783 **
Note: DOC/SOC—the ratio of DOC to SOC; MBCC/SOC—the ratio of MBC to SOC; ROC/SOC—the ratio of ROC to SOC; βG—β-D-glucosidase; CBH—cellobiohydrolase; NAG—β-N-acetylglucosaminidase; * is significant at p < 0.05; ** is significant at p < 0.01.
Disclaimer/Publisher’s Note: The statements, opinions and data contained in all publications are solely those of the individual author(s) and contributor(s) and not of MDPI and/or the editor(s). MDPI and/or the editor(s) disclaim responsibility for any injury to people or property resulting from any ideas, methods, instructions or products referred to in the content.

