

Configuration of Strawberry Yield, Nutritional and Functional Traits in Response to LPE Application in a Two-Year Study

 ,
,  ,
,  ,
, 

Abstract
1. Introduction
2. Materials and Methods
2.1. Plant Materials and Trial Conditions
2.2. Trial Set-Up and Experimental Design
2.3. Yield Parameters
2.4. Fruit Quality Parameters
2.5. Statistical Analysis
3. Results
4. Discussion
5. Conclusions
Author Contributions
Funding
Data Availability Statement
Acknowledgments
Conflicts of Interest
References
- Consentino, B.B.; Vultaggio, L.; Iacuzzi, N.; La Bella, S.; De Pasquale, C.; Rouphael, Y.; Ntatsi, G.; Virga, G.; Sabatino, L. Iodine Biofortification and Seaweed Extract-Based Biostimulant Supply Interactively Drive the Yield, Quality, and Functional Traits in Strawberry Fruits. Plants 2023, 12, 245. [Google Scholar] [CrossRef] [PubMed]
- Sarıdaş, M.A.; Ağçam, E.; Akbaş, F.C.; Akyıldiz, A.; Kargı, S.P. Comparison of superior bred strawberry genotypes with popular cultivars in terms of fruit bioactive compounds during the wide harvest dates. S. Afr. J. Bot. 2022, 147, 142–152. [Google Scholar] [CrossRef]
- ISTAT. Available online: https://www.istat.it/ (accessed on 20 February 2023).
- Tesi, R. Orticoltura Mediterranea Sostenibile; Pàtron Editore: Bologna, Italy, 2010. [Google Scholar]
- Galati, A.; Sabatino, L.; Prinzivalli, C.S.; D’Anna, F.; Scalenghe, R. Strawberry fields forever: That is, how many grams of plastics are used to grow a strawberry? J. Environ. Manag. 2020, 276, 111313. [Google Scholar] [CrossRef]
- Sabatino, L.; La Bella, S.; Ntatsi, G.; Iapichino, G.; D’Anna, F.; De Pasquale, C.; Consentino, B.B.; Rouphael, Y. Selenium biofortification and grafting modulate plant performance and functional features of cherry tomato grown in a soilless system. Sci. Hortic. 2021, 285, 110095. [Google Scholar] [CrossRef]
- Consentino, B.B.; Rouphael, Y.; Ntatsi, G.; De Pasquale, C.; Iapichino, G.; D’Anna, F.; La Bella, S.; Sabatino, L. Agronomic performance and fruit quality in greenhouse grown eggplant are interactively modulated by iodine dosage and grafting. Sci. Hortic. 2022, 295, 110891. [Google Scholar] [CrossRef]
- D’Anna, F.; Sabatino, L. Morphological and agronomical characterization of eggplant genetic resources from the Sicily area. J. Food Agri. Environ. 2013, 11, 401–404. [Google Scholar]
- Virga, G.; Licata, M.; Consentino, B.B.; Tuttolomondo, T.; Sabatino, L.; Leto, C.; La Bella, S. Agro-morphological characterization of sicilian chili pepper accessions for ornamental purposes. Plants 2020, 9, 1400. [Google Scholar] [CrossRef]
- Consentino, B.B.; Aprile, S.; Rouphael, Y.; Ntatsi, G.; De Pasquale, C.; Iapichino, G.; Alibrandi, P.; Sabatino, L. Application of PGPB Combined with Variable N Doses Affects Growth, Yield-Related Traits, N-Fertilizer Efficiency and Nutritional Status of Lettuce Grown under Controlled Condition. Agronomy 2022, 12, 236. [Google Scholar] [CrossRef]
- Consentino, B.B.; Sabatino, L.; Mauro, R.P.; Nicoletto, C.; De Pasquale, C.; Iapichino, G.; La Bella, S. Seaweed Extract Improves Lagenaria siceraria Young Shoot Production, Mineral Profile and Functional Quality. Horticulturae 2021, 7, 549. [Google Scholar] [CrossRef]
- Sabatino, L.; Consentino, B.B.; Ntatsi, G.; La Bella, S.; Baldassano, S.; Rouphael, Y. Stand-Alone or Combinatorial Effects of Grafting and Microbial and Non-Microbial Derived Compounds on Vigour, Yield and Nutritive and Functional Quality of Greenhouse Eggplant. Plants 2022, 11, 1175. [Google Scholar]
- La Bella, S.; Consentino, B.B.; Rouphael, Y.; Ntatsi, G.; De Pasquale, C.; Iapichino, G.; Sabatino, L. Impact of Ecklonia maxima Seaweed Extract and Mo Foliar Treatments on Biofortification, Spinach Yield, Quality and NUE. Plants 2021, 10, 1139. [Google Scholar] [CrossRef]
- Sabatino, L.; Consentino, B.B.; Rouphael, Y.; De Pasquale, C.; Iapichino, G.; D’Anna, F.; La Bella, S. Protein Hydrolysates and Mo-Biofortification Interactively Modulate Plant Performance and Quality of ‘Canasta’ Lettuce Grown in a Protected Environment. Agronomy 2021, 11, 1023. [Google Scholar] [CrossRef]
- Amaro, A.L.; Almeida, D.P. Lysophosphatidylethanolamine effects on horticultural commodities: A review. Postharvest Biol. Technol. 2013, 78, 92–102. [Google Scholar] [CrossRef]
- Arteca, R.N. Plant Growth Substances: Principles and Applications; Chapman & Hall: New York, NY, USA, 1996. [Google Scholar]
- Farag, K.M.; Palta, J.P. Stimulation of ethylene production by urea, thidiazuron, and lysophosphatidylethanolamine and possible sites of stimulation. Plant Physiol. 1989, 89, 568. [Google Scholar]
- Farag, K.M.; Palta, J.P. Enhancing effectiveness of ethephon on cranberry fruit by natural products (ethanol, urea and lysophosphatidylethanolamine (LPE)). In Proceedings of the 16th Annual Meeting Plant Growth Regulation Society of America, Arlington, VA, USA, 6–10 August 1989. [Google Scholar]
- Özgen, M.; Palta, J.P. Using natural lipids to accelerate ripening (uniform color development) and promote shelf life of cranberries. In Proceedings of the Wisconsin State Growers Association. Summer Growers Meeting and Field Day, 1999; Available online: https://fruit.wisc.edu/wp-content/uploads/sites/36/2011/05/Using-natural-lipids-to-accelerate-ripening-and-uniform-color-development-and-promote-shelf-life-of-cranberries.pdf (accessed on 20 February 2023).
- Farag, K.M.; Palta, J.P. Use of lysophosphatidylethanolamine, a natural lipid, as an aid for fruit ripening and improving keeping quality. In Proceedings of the 17th Annual Meeting, Plant Growth Regulator Society of America, St. Paul, MN, USA, 5–9 August 1990. [Google Scholar]
- Farag, K.M.; Palta, J.P. Enhancing ripening and keeping quality of apple and cranberry fruits using lysophosphatidylethanolamine, a natural lipid. HortScience 1991, 26, 67. [Google Scholar]
- Farag, K.M.; Palta, J.P. Use of lysophosphatidylethanolamine, a natural lipid, to retard tomato leaf and fruit senescence. Physiol. Plant. 1993, 87, 515–521. [Google Scholar] [CrossRef]
- Farag, K.M.; Palta, J.P. Use of natural lipids to accelerate ripening and enhance storage life of tomato fruit with and without ethephon. HortTechnology 1993, 3, 62–65. [Google Scholar] [CrossRef]
- Hong, J.H.; Chung, G.; Cowan, A.K. Delayed leaf senescence by exogenous lyso-phosphatidylethanolamine: Towards a mechanism of action. Plant Physiol. Biochem. 2009, 47, 526–534. [Google Scholar] [CrossRef]
- Özgen, M.; Park, S.; Palta, J.P. Mitigation of ethylene-promoted leaf senescence by a natural lipid, lysophosphatidylethanolamine. HortScience 2005, 40, 1166–1167. [Google Scholar] [CrossRef]
- Hong, J.H.; Hwang, H.K.; Chung, G.H.; Cowan, A.K. Influence of lysophosphatidylethanolamine application on fruit quality of Thompson seedless grapes. J. Appl. Hort. 2007, 9, 112–114. [Google Scholar]
- Özgen, M.; Farag, K.M.; Özgen, S.; Palta, J.P. Lysophosphatidylethanolamine accelerates color development and promotes shelf-life of cranberries. HortScience 2004, 40, 127–130. [Google Scholar] [CrossRef]
- Kaur, N.; Palta, J.P. Prolonging the vase life of snapdragons and carnations with a natural lipid, lysophosphatidylethanolamine. HortScience 1996, 31, 636. [Google Scholar] [CrossRef]
- Kaur, N.; Palta, J.P. Postharvest dip in a natural lipid, lysophosphatidylethanolamine, may prolong vase life of Snapdragon flowers. HortScience 1997, 32, 888–890. [Google Scholar] [CrossRef]
- Snider, A.; Palta, J.P.; Peoples, T. The potential use of lysophosphatidylethanolamine (LPE), a natural lipid, to lengthen the vase life of short-lived ‘Lavande’ and ‘Sensation’ roses. Acta Hortic. 2003, 624, 419–426. [Google Scholar] [CrossRef]
- Sabatino, L.; De Pasquale, C.; Aboud, F.; Martinelli, F.; Busconi, M.; D’Anna, E.; Panno, S.; Iapichino, G.; D’Anna, F. Properties of new strawberry lines compared with well-known cultivars in winter planting system conditions. Not. Bot. Horti Agrobot. 2017, 45, 9–16. [Google Scholar] [CrossRef]
- Slinkard, K.; Singleton, V.L. Total phenol analysis: Automation and comparison with manual methods. Am. J. Enol. Vitic. 1997, 28, 49–55. [Google Scholar] [CrossRef]
- Rabino, I.; Mancinell, A. Light, temperature, and anthocyanins production. J. Plant Physiol. 1986, 81, 922–924. [Google Scholar] [CrossRef]
- Han, C.; Zhao, Y.; Leonard, S.W.; Traber, M. Edible coatings to improve storability and enhance nutritional value of fresh and frozen strawberries (Fragaria × ananassa) and raspberries (Rubus ideaus). Postharvest Biol. Technol. 2004, 33, 67–78. [Google Scholar]
- Brand-Williams, W.; Cuvelier, M.E.; Berset, C. Use of a Free Radical Method to Evaluate Antioxidant Activity. LWT Food Sci. Technol. 1995, 28, 25–30. [Google Scholar] [CrossRef]
- Sorrenti, V.; Salerno, L.; Di Giacomo, C.; Acquaviva, R.; Siracusa, M.A.; Vanella, A. Imidazole derivatives as antioxidants and selective inhibitors of nNOS. Nitric Oxide 2006, 14, 45–50. [Google Scholar] [CrossRef]
- Çeler, A.G.; Gündüz, K.; Serçe, S. Effect of Lysophosphatidylethanolamine (LPE) for strawberry pomological and phytochemical quality characteristics during storage. Mustafa Kemal Univ. Tarim Bilim. Derg. 2019, 24, 188–197. [Google Scholar]
- Kern, R.; Joseleau-Petit, D.; Chattopadhyay, M.K.; Richarme, G. Chaperonelike properties of lysophospholipids. Biochem. Biophys. Res. Commun. 2001, 289, 1268–1274. [Google Scholar] [CrossRef] [PubMed]
- Smirnoff, N.; Wheeler, G.L. Ascorbic acid in plants: Biosynthesis and function. Crit. Rev. Plant Sci. 2000, 19, 267–290. [Google Scholar] [CrossRef]
- Cowan, A.K.; Leung, C.; Santori, C.H. Lyso-phosphatidylethanolamine (LPE) as a plant bioregulator. Acta Hortic. 2006, 727, 527–536. [Google Scholar] [CrossRef]
- Ergin, S.; Aydogan, C.; Ozturk, N.; Turhan, E. Effects of ascorbic acid application in strawberry plants during heat stress. Türk Tarım Doğa Bilim. Derg. 2014, 2, 1486–1491. [Google Scholar]
- Mullineaux, P.M.; Rausch, T. Glutathione, photosynthesis and the redox regulation of stress-responsive gene expression. Photosynth. Res. 2005, 86, 459–474. [Google Scholar] [CrossRef] [PubMed]
- de Pascual-Teresa, S.; Sanchez-Ballesta, M.T. Anthocyanins: From plant to health. Phytochem. Rev. 2008, 7, 281–299. [Google Scholar]
- Matsushita, K.; Ikeda, T. The effect of high air temperature on anthocyanin concentration and the expressions of its biosynthetic genes in strawberry ‘Sachinoka’. Environ. Control. Biol. 2016, 54, 101–107. [Google Scholar] [CrossRef]
- Chalker-Scott, L. Environmental significance of anthocyanins in plant stress responses. Photochem. Photobiol. 1999, 70, 1–9. [Google Scholar] [CrossRef]
- Laura, A.; Moreno-Escamilla, J.O.; Rodrigo-García, J.; Alvarez-Parrilla, E. Phenolic compounds. In Postharvest Physiology and Biochemistry of Fruits and Vegetables; Woodhead Publishing: Sawston, UK, 2019. [Google Scholar]
- Ozgen, M.; Serçe, S.; Akca, Y.; Hong, J.H. Lysophosphatidylethanolamine (LPE) improves fruit size, color, quality and phytochemical contents of sweet cherry cv ‘0900 Ziraat’. Hortic. Sci. Technol. 2015, 33, 196–201. [Google Scholar]
- Kołton, A.; Długosz-Grochowska, O.; Wojciechowska, R.; Czaja, M. Biosynthesis regulation of folates and phenols in plants. Sci. Hortic. 2022, 291, 110561. [Google Scholar] [CrossRef]
- Rivero, R.M.; Ruiz, J.M.; Garcıa, P.C.; Lopez-Lefebre, L.R.; Sánchez, E.; Romero, L. Resistance to cold and heat stress: Accumulation of phenolic compounds in tomato and watermelon plants. Plant Sci. 2001, 160, 315–321. [Google Scholar] [CrossRef] [PubMed]
- Król, A.; Amarowicz, R.; Weidner, S. The effects of cold stress on the phenolic compounds and antioxidant capacity of grapevine (Vitis vinifera L.) leaves. J. Plant Physiol. 2015, 189, 97–104. [Google Scholar] [CrossRef] [PubMed]
- Chalker-Scott, L.; Fuchigami, L. The role of phenolic compounds in plant stress responses. In Low Temperature Stress Physiology in Crops; CRC Press: Boca Raton, FL, USA, 2018; pp. 67–80. [Google Scholar]
- Wesche-Ebeling, P.; Montgomery, M.W. Strawberry polyphenoloxidase: Its role in anthocyanin degradation. J. Food Sci. 1990, 55, 731–734. [Google Scholar] [CrossRef]
- Wang, S.Y.; Zheng, W. Effect of plant growth temperature on antioxidant capacity in strawberry. J. Agric. Food Chem. 2001, 49, 4977–4982. [Google Scholar] [CrossRef]
- Dolatabadian, A.; Jouneghani, R.S. Impact of exogenous ascorbic acid on antioxidant activity and some physiological traits of common bean subjected to salinity stress. Not. Bot. Horti Agrobot. 2009, 37, 165–172. [Google Scholar]
- Altwies, J.; Guelzow, M.; Hong, J.H.; Rademacher, M.; Towse, J. Potential use of lysophosphatidylethanolamine, a natural lipid, as a post-harvest dip to accelerate ripening of mature green tomatoes packed for fresh-market. In Proceedings of the XXVI International Horticultural Congress, Toronto, ON, Canada, 11–17 August 2002. [Google Scholar]
- Amaro, A.L.; Fundo, J.; Beaulieu, J.C.; Stein, R.E.; Fernández-Trujillo, J.P.; Almeida, D.P.F. Lysophosphatidylethanolamine effects upon volatiles and quality of fresh-cut cantaloupe melon. Acta Hortic. 2012, 934, 959–965. [Google Scholar] [CrossRef]
- Farag, K.M.; Palta, J.P. Plant and Fruit Treatment with Lysophosphatidylethanolamine. U.S. Patent US 5126155, 30 June 1992. [Google Scholar]
- Mangat, N.K.; Palta, J.P. Inhibition of polygalacturonase in tomato pericarp tissue by lysophosphatidylethanolamine: Implications in fruit shelf-life. HortScience 1995, 30, 889. [Google Scholar] [CrossRef]


| Treatments | NMF (Fruits Plant−1) | DP (%) | ||
|---|---|---|---|---|
| LPE | ||||
| Control | 18.5 | A | 14.0 | a |
| LPE | 18.6 | A | 13.6 | a |
| Year | ||||
| I | 18.5 | A | 12.4 | b |
| II | 18.6 | A | 15.2 | a |
| Significance | ||||
| LPE | NS | NS | ||
| Y | NS | *** | ||
| LPE × Y | NS | NS | ||
| Treatments | Antioxidant Capacity (% Inhibition) | TA (% Citric Acid) | Firmness (N) | b* | L* | SSC (°Brix) | ||||||
|---|---|---|---|---|---|---|---|---|---|---|---|---|
| LPE | ||||||||||||
| Control | 81.9 | b | 0.52 | a | 6.3 | b | 33.37 | a | 41.15 | a | 7.6 | b |
| LPE | 86.2 | a | 0.50 | a | 6.8 | a | 23.30 | b | 35.03 | b | 8.8 | a |
| Year | ||||||||||||
| I | 84.9 | a | 0.53 | a | 6.5 | a | 28.67 | a | 38.68 | a | 8.2 | a |
| II | 83.2 | a | 0.48 | a | 6.6 | a | 28.00 | a | 37.50 | b | 8.1 | a |
| Significance | ||||||||||||
| LPE | * | NS | *** | *** | *** | *** | ||||||
| Y | NS | NS | NS | NS | ** | NS | ||||||
| LPE × Y | NS | NS | NS | NS | NS | NS | ||||||
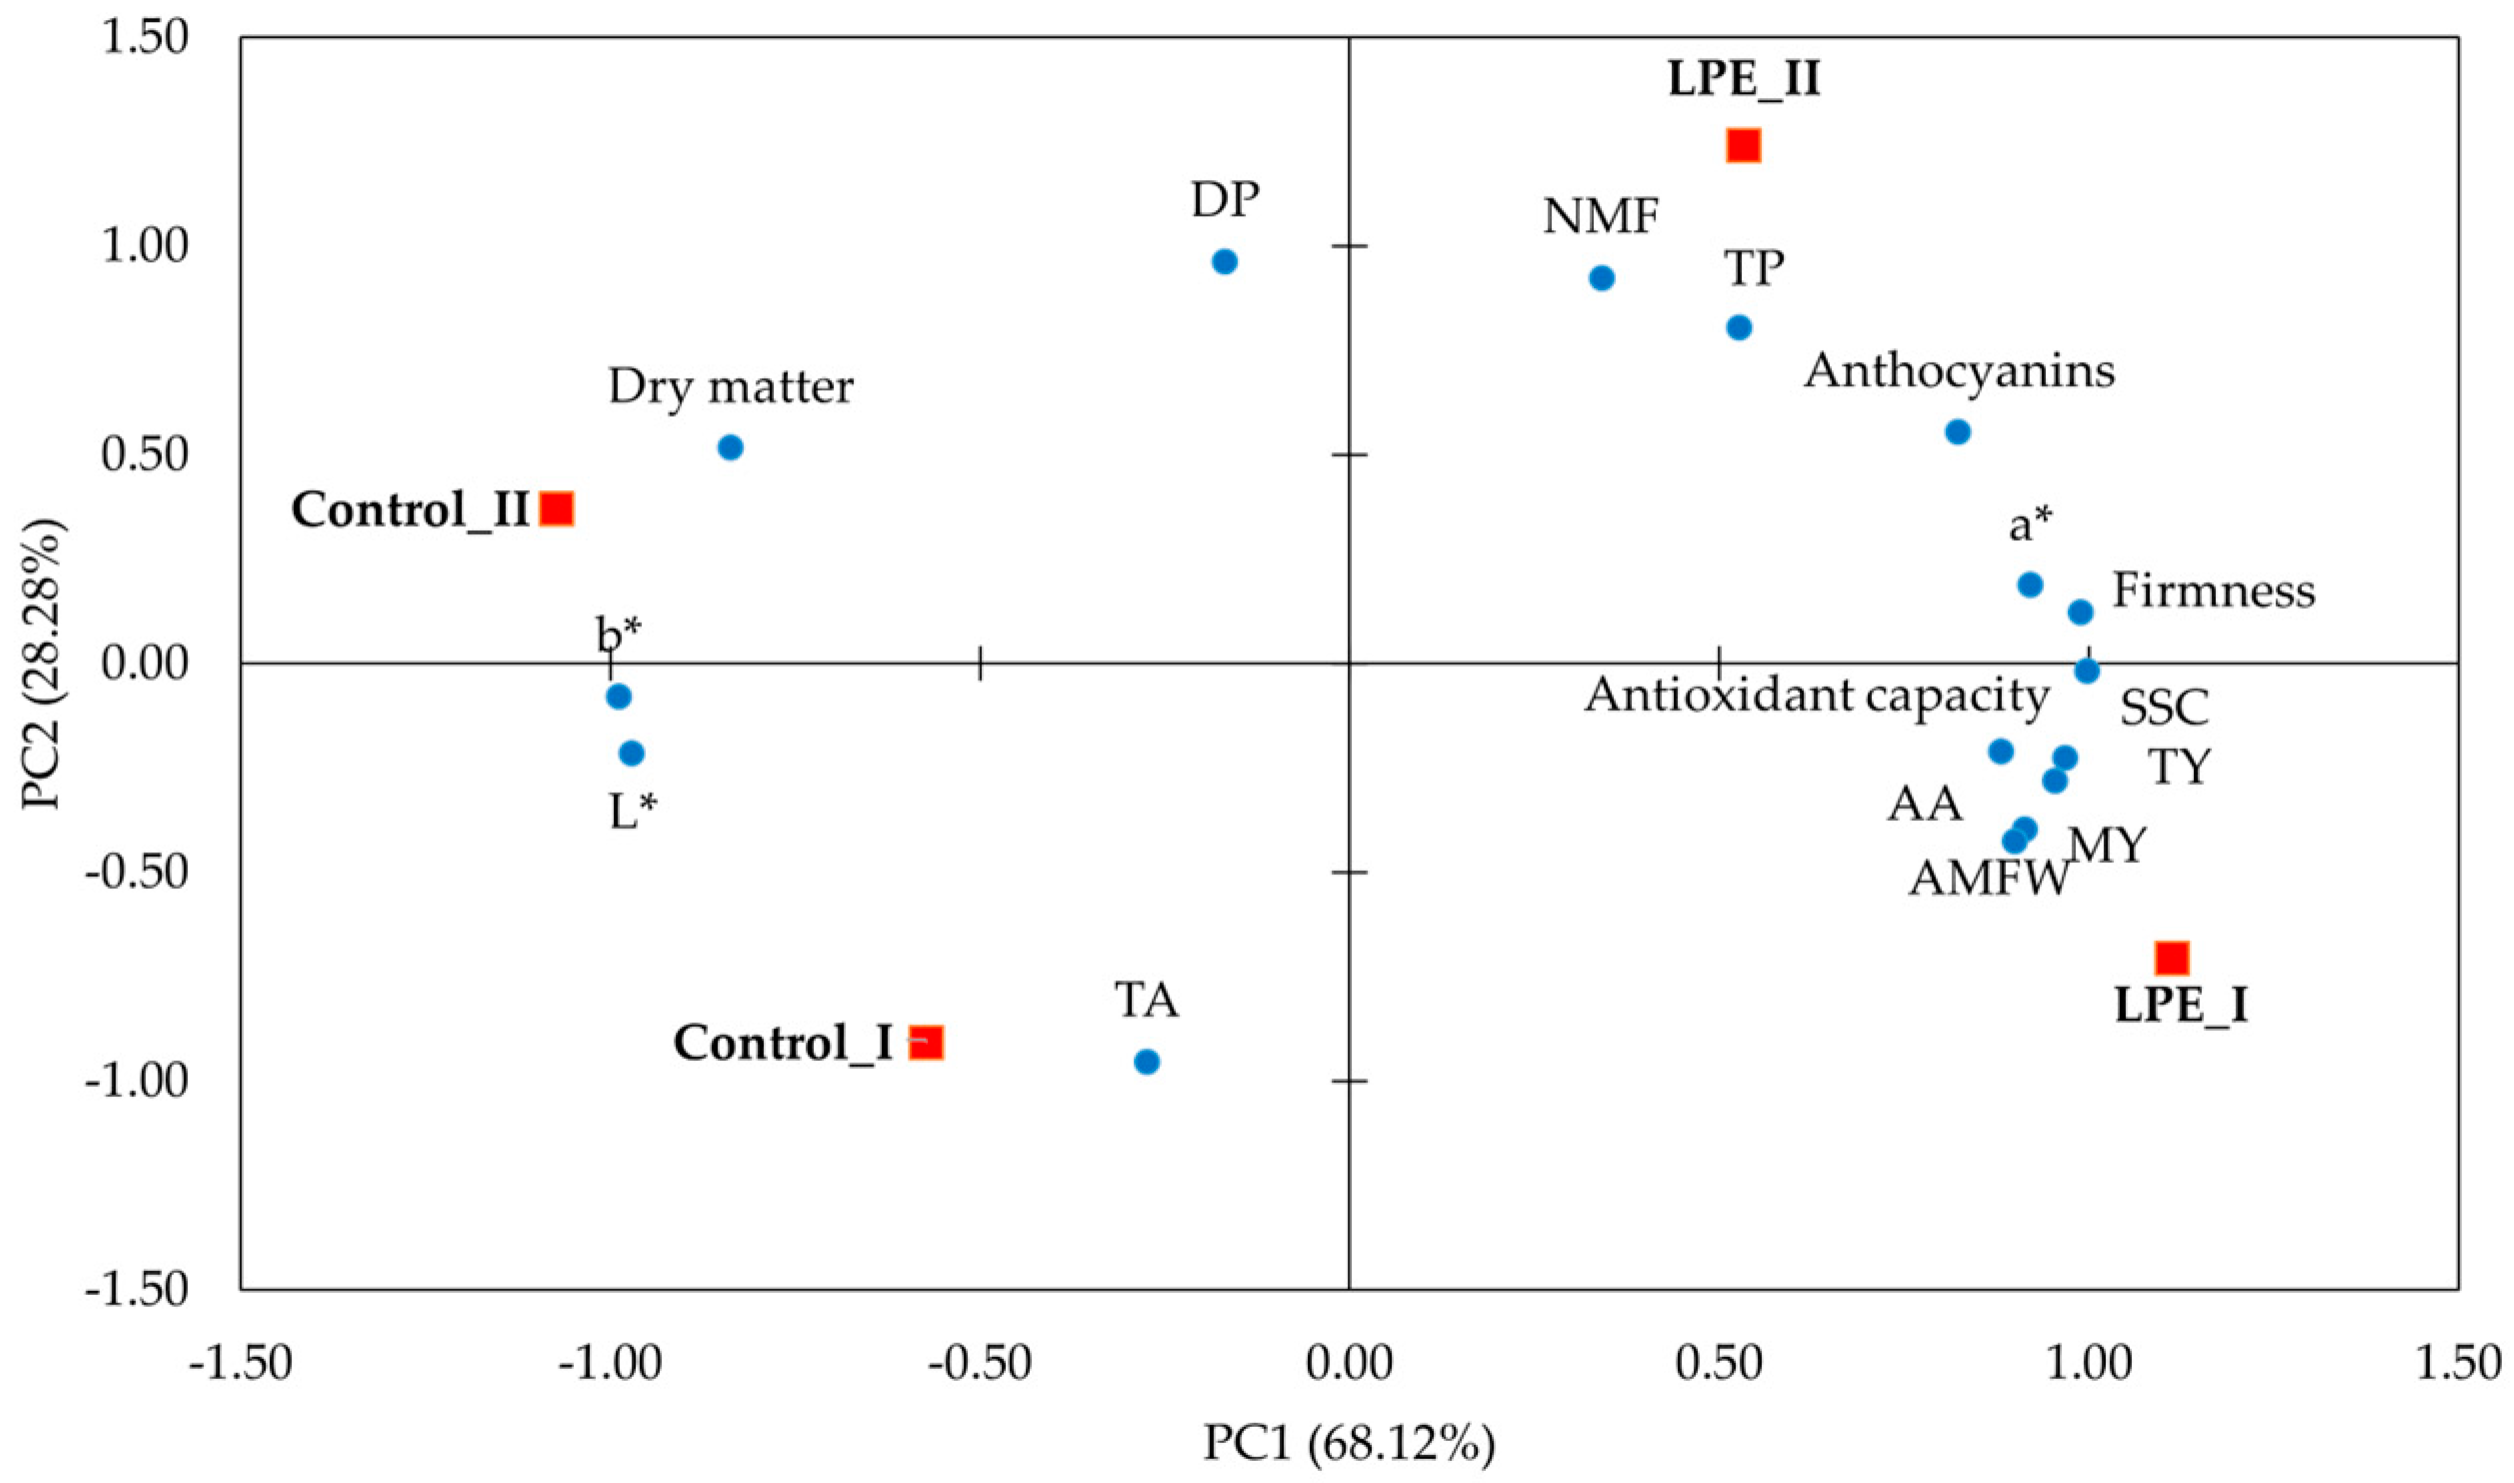
| Variables | PC1 | PC2 |
|---|---|---|
| TY | 0.955 | −0.282 |
| MY | 0.914 | −0.399 |
| NMF | 0.342 | 0.922 |
| AMFW | 0.901 | −0.427 |
| DP | −0.168 | 0.961 |
| AA | 0.969 | −0.228 |
| TP | 0.528 | 0.802 |
| Anthocyanins | 0.824 | 0.554 |
| Antioxidant capacity | 0.882 | −0.213 |
| TA | −0.273 | −0.956 |
| Firmness | 0.990 | 0.122 |
| a* | 0.922 | 0.186 |
| b* | −0.988 | −0.082 |
| L* | −0.971 | −0.218 |
| SSC | 0.999 | −0.019 |
| Dry matter | −0.836 | 0.516 |
| Eigenvalue | 10.900 | 4.525 |
| Variance cumulative (%) | 68.123 | 96.401 |
| Variance | 68.123 | 28.278 |
Disclaimer/Publisher’s Note: The statements, opinions and data contained in all publications are solely those of the individual author(s) and contributor(s) and not of MDPI and/or the editor(s). MDPI and/or the editor(s) disclaim responsibility for any injury to people or property resulting from any ideas, methods, instructions or products referred to in the content. |
© 2023 by the authors. Licensee MDPI, Basel, Switzerland. This article is an open access article distributed under the terms and conditions of the Creative Commons Attribution (CC BY) license (https://creativecommons.org/licenses/by/4.0/).
Share and Cite
Vultaggio, L.; Sabatino, L.; Rouphael, Y.; De Pasquale, C.; La Bella, S.; Consentino, B.B. Configuration of Strawberry Yield, Nutritional and Functional Traits in Response to LPE Application in a Two-Year Study. Agronomy 2023, 13, 1266. https://doi.org/10.3390/agronomy13051266
Vultaggio L, Sabatino L, Rouphael Y, De Pasquale C, La Bella S, Consentino BB. Configuration of Strawberry Yield, Nutritional and Functional Traits in Response to LPE Application in a Two-Year Study. Agronomy. 2023; 13(5):1266. https://doi.org/10.3390/agronomy13051266
Chicago/Turabian StyleVultaggio, Lorena, Leo Sabatino, Youssef Rouphael, Claudio De Pasquale, Salvatore La Bella, and Beppe Benedetto Consentino. 2023. "Configuration of Strawberry Yield, Nutritional and Functional Traits in Response to LPE Application in a Two-Year Study" Agronomy 13, no. 5: 1266. https://doi.org/10.3390/agronomy13051266
APA StyleVultaggio, L., Sabatino, L., Rouphael, Y., De Pasquale, C., La Bella, S., & Consentino, B. B. (2023). Configuration of Strawberry Yield, Nutritional and Functional Traits in Response to LPE Application in a Two-Year Study. Agronomy, 13(5), 1266. https://doi.org/10.3390/agronomy13051266