Article

Dual Isotopes Tracing Carbon and Nitrogen Dynamics during Leguminous and Non-Leguminous Litter Decomposition under Controlled Precipitation

1
College of Natural Resources and Environment, Northwest A&F University, Yangling 712100, China
2
State Key Laboratory of Soil Erosion and Dryland Farming on the Loess Plateau, Northwest A&F University, Yangling 712100, China
3
University of Chinese Academy of Sciences, Beijing 100049, China
*
Author to whom correspondence should be addressed.
These authors contributed equally to this work.
Agronomy 2023, 13(5), 1205; https://doi.org/10.3390/agronomy13051205
Submission received: 20 March 2023 / Revised: 16 April 2023 / Accepted: 19 April 2023 / Published: 24 April 2023
(This article belongs to the Section Agroecology Innovation: Achieving System Resilience)

Abstract

:
Plant litter decomposition figures importantly in the cycling of C and N pools in terrestrial ecosystems. We investigated how C and N fluxes changed during the decomposition of leguminous and non-leguminous leaf litters, and how these processes responded to different precipitation regimes. We used the dual-isotope tracing method to investigate differences in leaf and soil C and N, along with δ13C and δ15N, in the soil of the Loess Plateau in China. The δ15N and δ13C values were 3604‰ and 56‰ for Robinia pseudoacacia (Leguminosae) and 8115‰ and 452‰ for Populus tomentosa (Salicaceae) leaf litters. Through decomposition, δ13C decreased in all litters, and δ15N in the leguminous litter increased while it decreased in the non-leguminous litter. In the surface soil, the fraction of litter-derived N (14%) from the leguminous litter was significantly higher than that of the non-leguminous litter after 16 months. The C and N concentrations of both litters and soil always had a positive correlation during decomposition, and the responses of N to C changes in soil were reduced by the litter cover. Increased precipitation enhanced the litters’ C and N correlation. The 600 mm precipitation treatment most benefited litter C’s transformation to SOC, and drought conditions promoted the transformation of legume litter N to soil TN, but inhibited non-legume litter N. In the soil and both litters, C and N changes always had a positive correlation. After 16 months, the proportion of soil N from legumes was higher than that from non-legumes. Reduced precipitation could promote leguminous N in soil. Our results provide a scientific basis for accurately predicting the C and N cycles in terrestrial ecosystems.

1. Introduction

Leaf litter is both a link between plants and soil in the nutrient cycle and an important nutrient source, and its decomposition process is vital for the composition and circulation of C and N pools in terrestrial ecosystems [1]. The return of C and N from leaf litter to soil can change not only the existing morphological stability and availability of soil C and N, but it can also affect the structure and function of soil ecosystems and their responses to environmental changes [2]. C and N released directly into the atmosphere and those released into soil during litter decomposition have different but very important ecological and environmental significances, and each must be identified and quantified. Isotopic labeling can accurately identify the C and N paths in litter decomposition and describe each path’s flux and dynamic characteristics [3]. Most of the current litter decomposition studies, such as that of Pei et al. [4], have used single isotope markers, and few such studies have used dual-isotope labeling [5,6]. However, dual labeling of stable 13C and 15N isotopes can reveal both C and N circulation processes in litter decomposition and, thus, simultaneously provide an accurate picture of both circulation processes. Additionally, this procedure’s research, analysis, and material costs, as well as research time, are lower than those of single-element labeling studies, so it is better suited for broad applications [7]. Glaser et al. [5] used the field labeling method to show that low-cost, dual-isotope labeling materials can achieve the same labeling effect and obtain a large number of labeling materials, compared to the results using single-element and indoor labeling. In addition, a quantitative analysis of soil organic carbon (SOC) dynamics under litter cover requires tracing both the SOC compounds’ origins and their transformation pathways, and this can be performed by stable-isotope (e.g., 13C and/ or 15N) labeling [8]. Therefore, using 13C and 15N isotope dual labeling while conducting in situ litter decomposition studies in the field can reveal how litter decomposition and return to soil contribute to a comprehensive understanding of the biogeochemical cycles within ecosystems and the formation of soil organic matter (SOM) [9].
Because of reduced vegetation coverage, China’s Loess Plateau has become one of the most severely eroded regions in the world [10]. To restore the forest cover and prevent soil erosion on sloped croplands in this region, the Chinese government has established 5.2 million hectares of tree plantations there [11]. A leguminous black locust (Robinia pseudoacacia, RP) and a non-leguminous poplar (Populus tomentosa, PT) are two important forest species that have been widely planted in the Plateau for soil and water conservation. Showing promise for reforestation, RP grows quickly and is able to fix atmospheric N, so it can supplement soil N pools, increase N return in litter fall, and enhance soil N mineralization rates when it is grown in a nutrient-poor ecosystem [12,13]. Ma et al. [14] suggested that PT can effectively control soil erosion and has the potential to maintain water. Therefore, RP and PT planted in the Loess Plateau importantly improve the regional ecological environment in northwest China. Xia et al. [15] reported that litter cover can reduce surface runoff and soil erosion. In semi-arid areas such as the Loess Plateau, litter decomposition is ecologically significant because it helps maintain ecosystem stability and improve soil texture [16]. Among many studies on leaf litters on the Loess Plateau, Tateno et al. [17] studied litter yield, forest floor organic matter quantity, and litter decomposition rate of nitrogen-fixing RP and non-N-fixing oak (Quercus liaotungensis) forests. Zhang et al. [18] conducted a 345-day controlled, laboratory decomposition experiment using RP litter mixed with 10 other species litters to investigate the impacts of mixed leaf litter decomposition on the release of eight main nutrients and to assess interspecific relationships. Xia et al. [15] used a rainfall simulation on a loess hillslope to examine the effects of forest litter cover on water interception, runoff, and infiltration and soil erosion. When Zhou et al. [19] examined the soil respiration and biophysical factors of PT and four other forest tree species, they found that 48% of the variation in annual soil CO2 efflux was explained by the combined C stocks in the litter and topsoil. Li et al. [20] placed ground leaf litters of PT and 11 other tree species into soil, both separately and as a mixture, and incubated the samples in a laboratory to analyze the effects of leaf litter decomposition on soil properties and the interactions between the litters’ decompositions. In addition, previous studies have surveyed biomass and C storage, soil organic C, and soil chemical and microbiological properties of RP plantations to understand their ecological restoration process after afforestation on the Loess Plateau [3,13,17,21,22], and some of these studies have used isotopes. For example, Liu and Wang [23] discussed the potential relationship between the δ15N values of a plant–soil system and climate factors, such as temperature and precipitation, and they noted that the N isotope values of plant litter and soil both declined as mean annual precipitation increased and with summer precipitation. However, there are few studies using dual-isotope labeling on the Loess Plateau, and studies on the impact of precipitation on the fractions of litter-derived C and N have not been reported, but this is crucial for assessing carbon sequestration and sustainable development of forestland in this region.
The climate and plant diversity of arid and semi-arid regions are major determinants of C and N dynamics in decomposing plant litters [24], and these areas are sensitive to climate changes [25]. Therefore, climate changes may have great impacts on the Loess Plateau’s fragile ecosystems. The Loess Plateau, a semi-arid region with scarce water and large variations in inter-annual rainfall, is subject to frequent dry and wet cycles and severe drought during the dry season [26]. This is important because water more significantly influences litter decomposition than does temperature [27]. Water availability controls ecosystem structure and processes by affecting long-term balances between the input and output of elements and the cycling of C and nutrients within these ecosystems [28]. Precipitation changes can influence litter decomposition directly by restricting the physical breakdown of litter and indirectly by affecting decomposer activities [29]. Paul et al. [30] found that SOM decomposition is governed by soil water conditions, with relatively weak decomposition in drier soils than in wetter soils, and Sanaullah et al. [25] found that drought inhibited grassland litter decomposition by more than 50%. Liu and Wang [23] noted that the N isotope values in Loess Plateau plant litter and soil respond to the amount of precipitation, declining with increasing precipitation. In addition, other studies have shown significant decomposition reductions with reduced water availability (e.g., in Chihuahuan Desert [31] and Mediterranean area [32]). To date, few studies have used C and N isotope labeling to examine common Loess Plateau leaf litter decomposition dynamics under different precipitation gradients, and the effect precipitation has on leaf litter entry into Loess Plateau soil is not clear.
In general, research that clarifies such dynamics and effects on the Loess Plateau also lays an important foundation for the study of C and N cycles during litter decomposition in general, which has significant value for predicting and comprehensively understanding the C and N cycles in terrestrial ecosystems. In this study, we used the 13C and 15N tracing technique to investigate C and N flux pathways during litter decomposition in a simulated in situ decomposition experiment. We also examined how C and N circulation during litter decomposition responds to different precipitation regimes. Here, we tested the following hypotheses: (1) litter decomposition weakens C and N correlation in soil; (2) higher precipitation increases the entry of leaf litter C and N into the soil and strengthens the C and N positive correlation relationship; and (3) more C and N from leguminous leaf litter sources enters the soil than from non-leguminous sources.

2. Materials and Methods

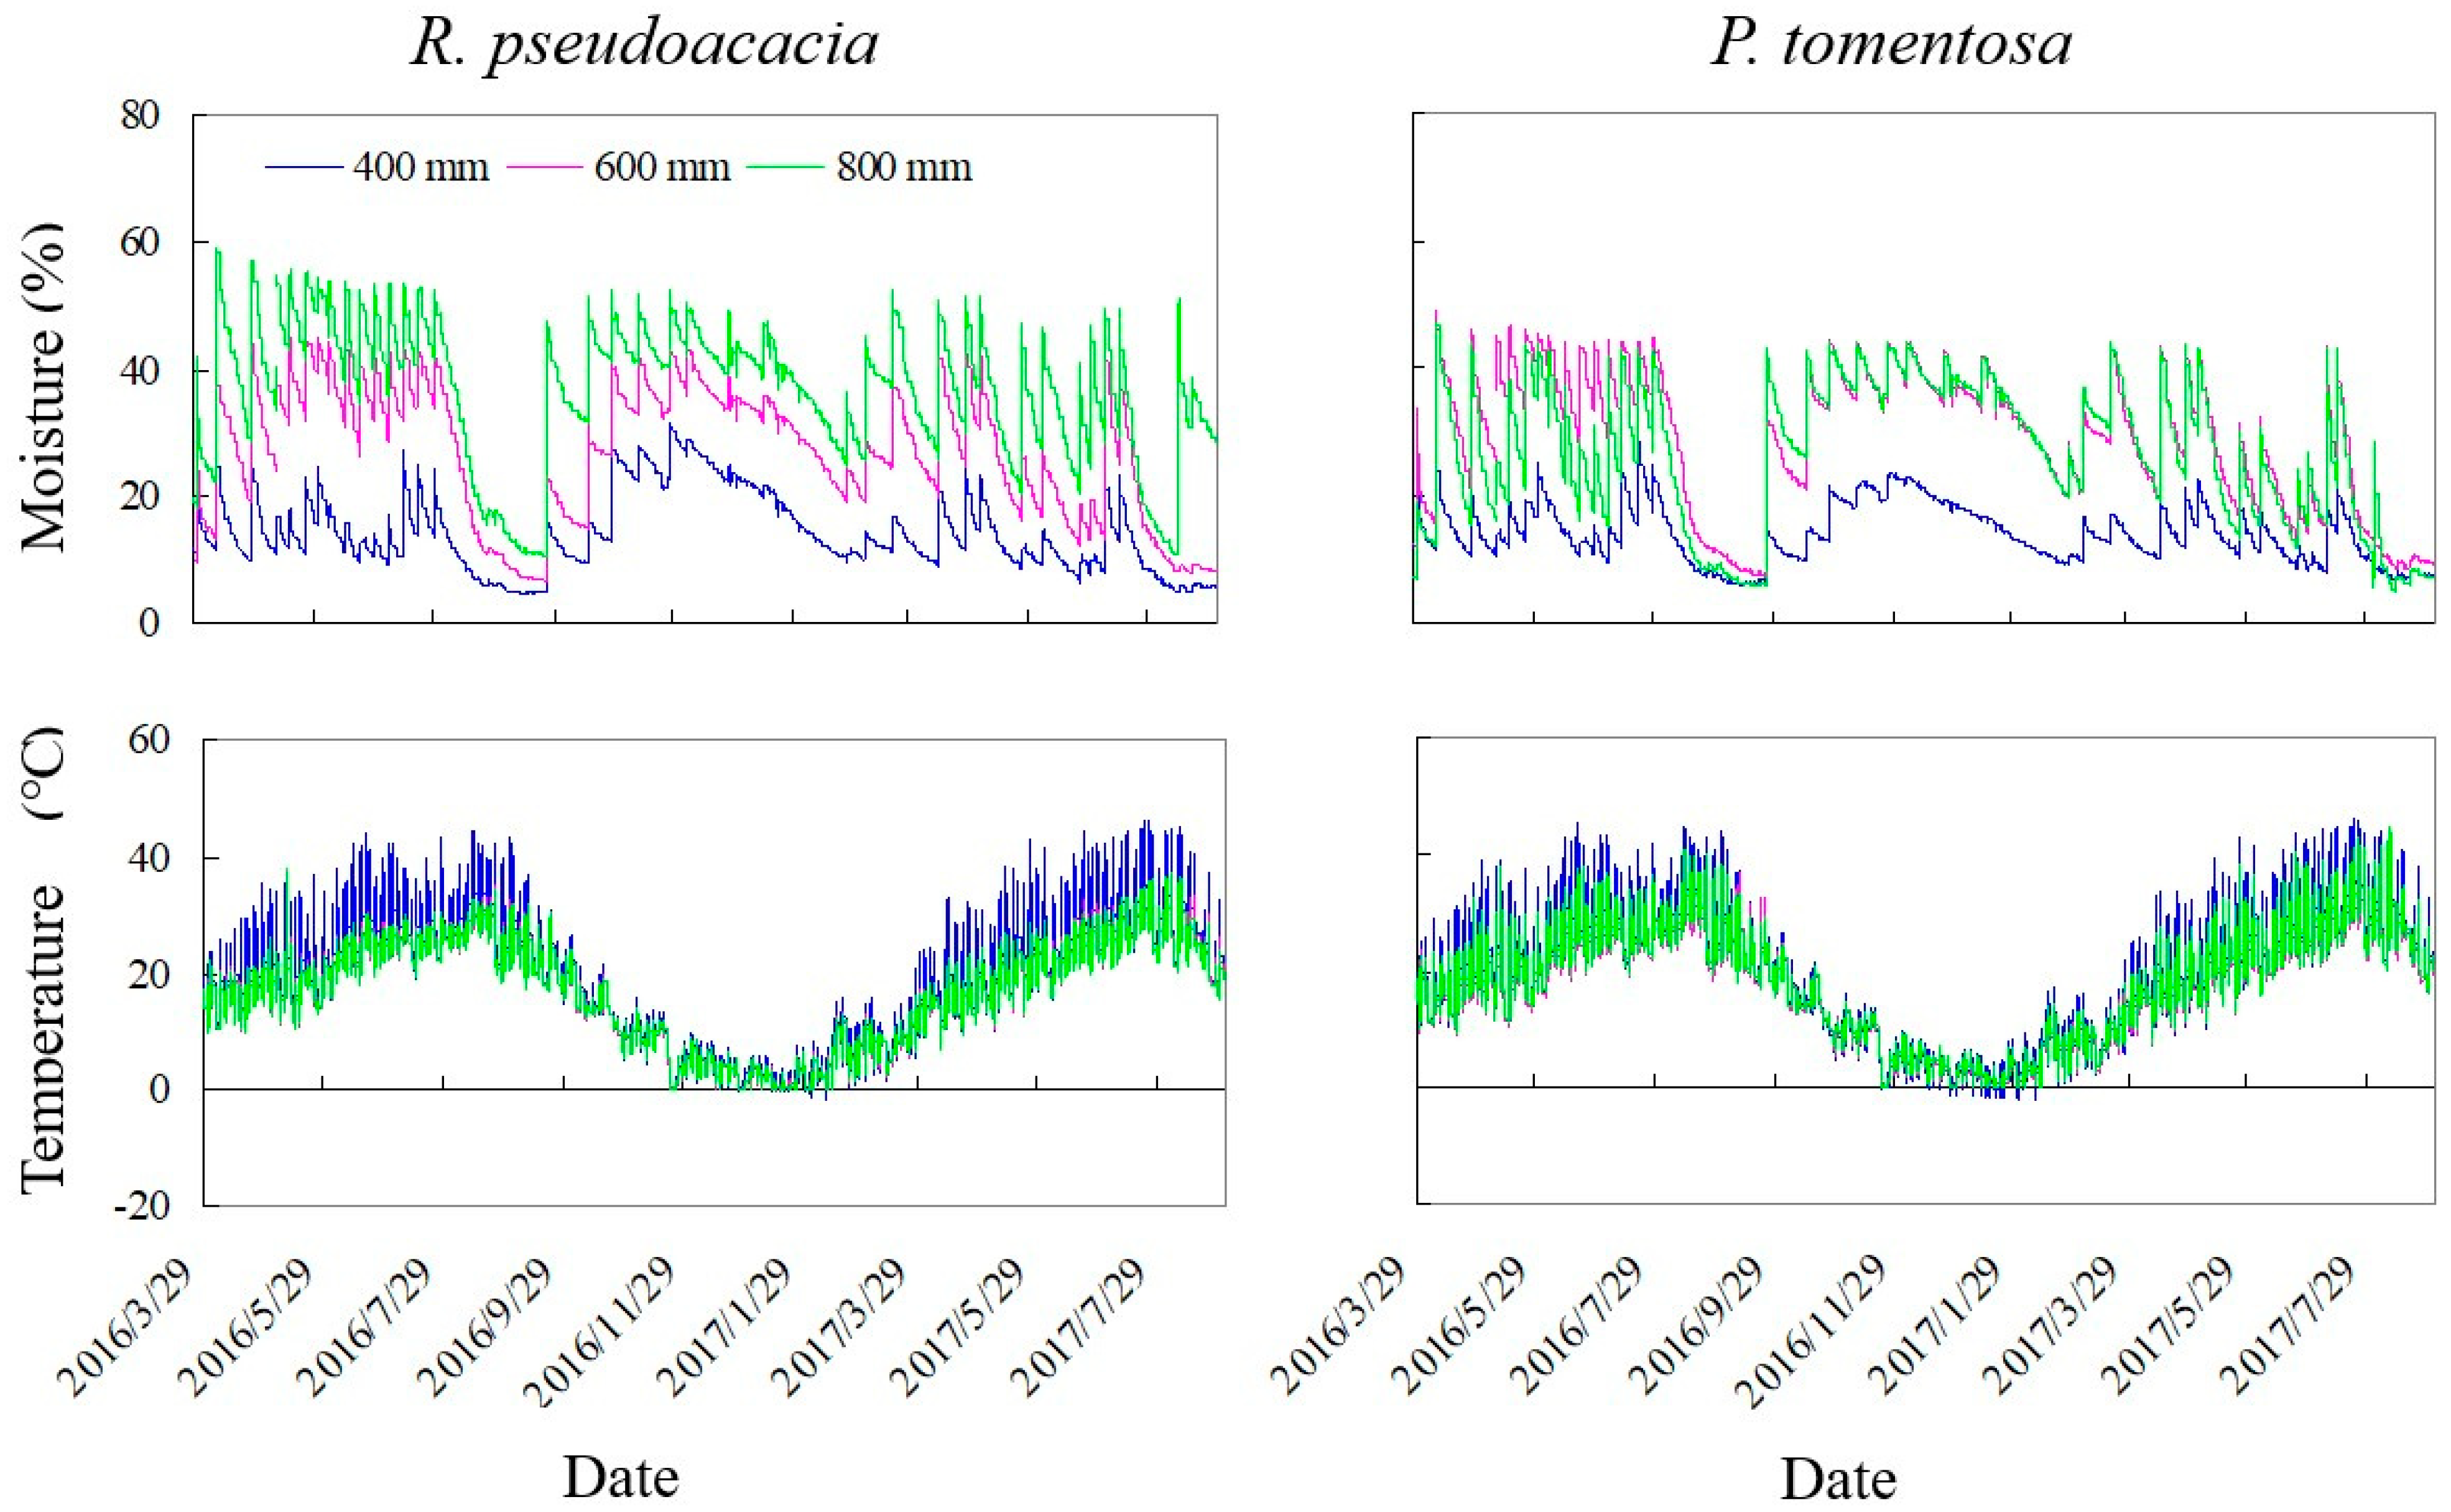
2.1. Study Site and Soil Properties

This study was carried out at the Northwest A&F University in Yangling, Shaanxi, China (34°16′18″ N, 108°04′59″ E; 525 masl), an area characterized by a warm temperate monsoon climate [33]. The area’s mean annual precipitation and temperature are 580.5 mm and 15.6 °C, respectively, with most precipitation falling between July and September. The soil used in this study was collected from a farmland (pH = 7.8) that had been abandoned for at least 8 years. The soil is a Typ-Eum-Orthic anthrosol, which belongs to the Nitisols according to FAO taxonomy [34]. The soil’s organic matter, total N, and extractable phosphorus and potassium concentrations were 22.04 g kg−1, 1.63 g kg−1, 48 mg kg−1, and 490 mg kg−1, respectively; its texture was clay loam, and it had a gravimetric moisture content at a field capacity of 22%. The sand, silt, and clay contents were 27%, 41%, and 32%, respectively [35]. At the beginning of the experiment, the soil density was 1.35 g cm−3. Given that all the soil used in this study was the same, the effects of the initial soil properties on litter decomposition were negligible.

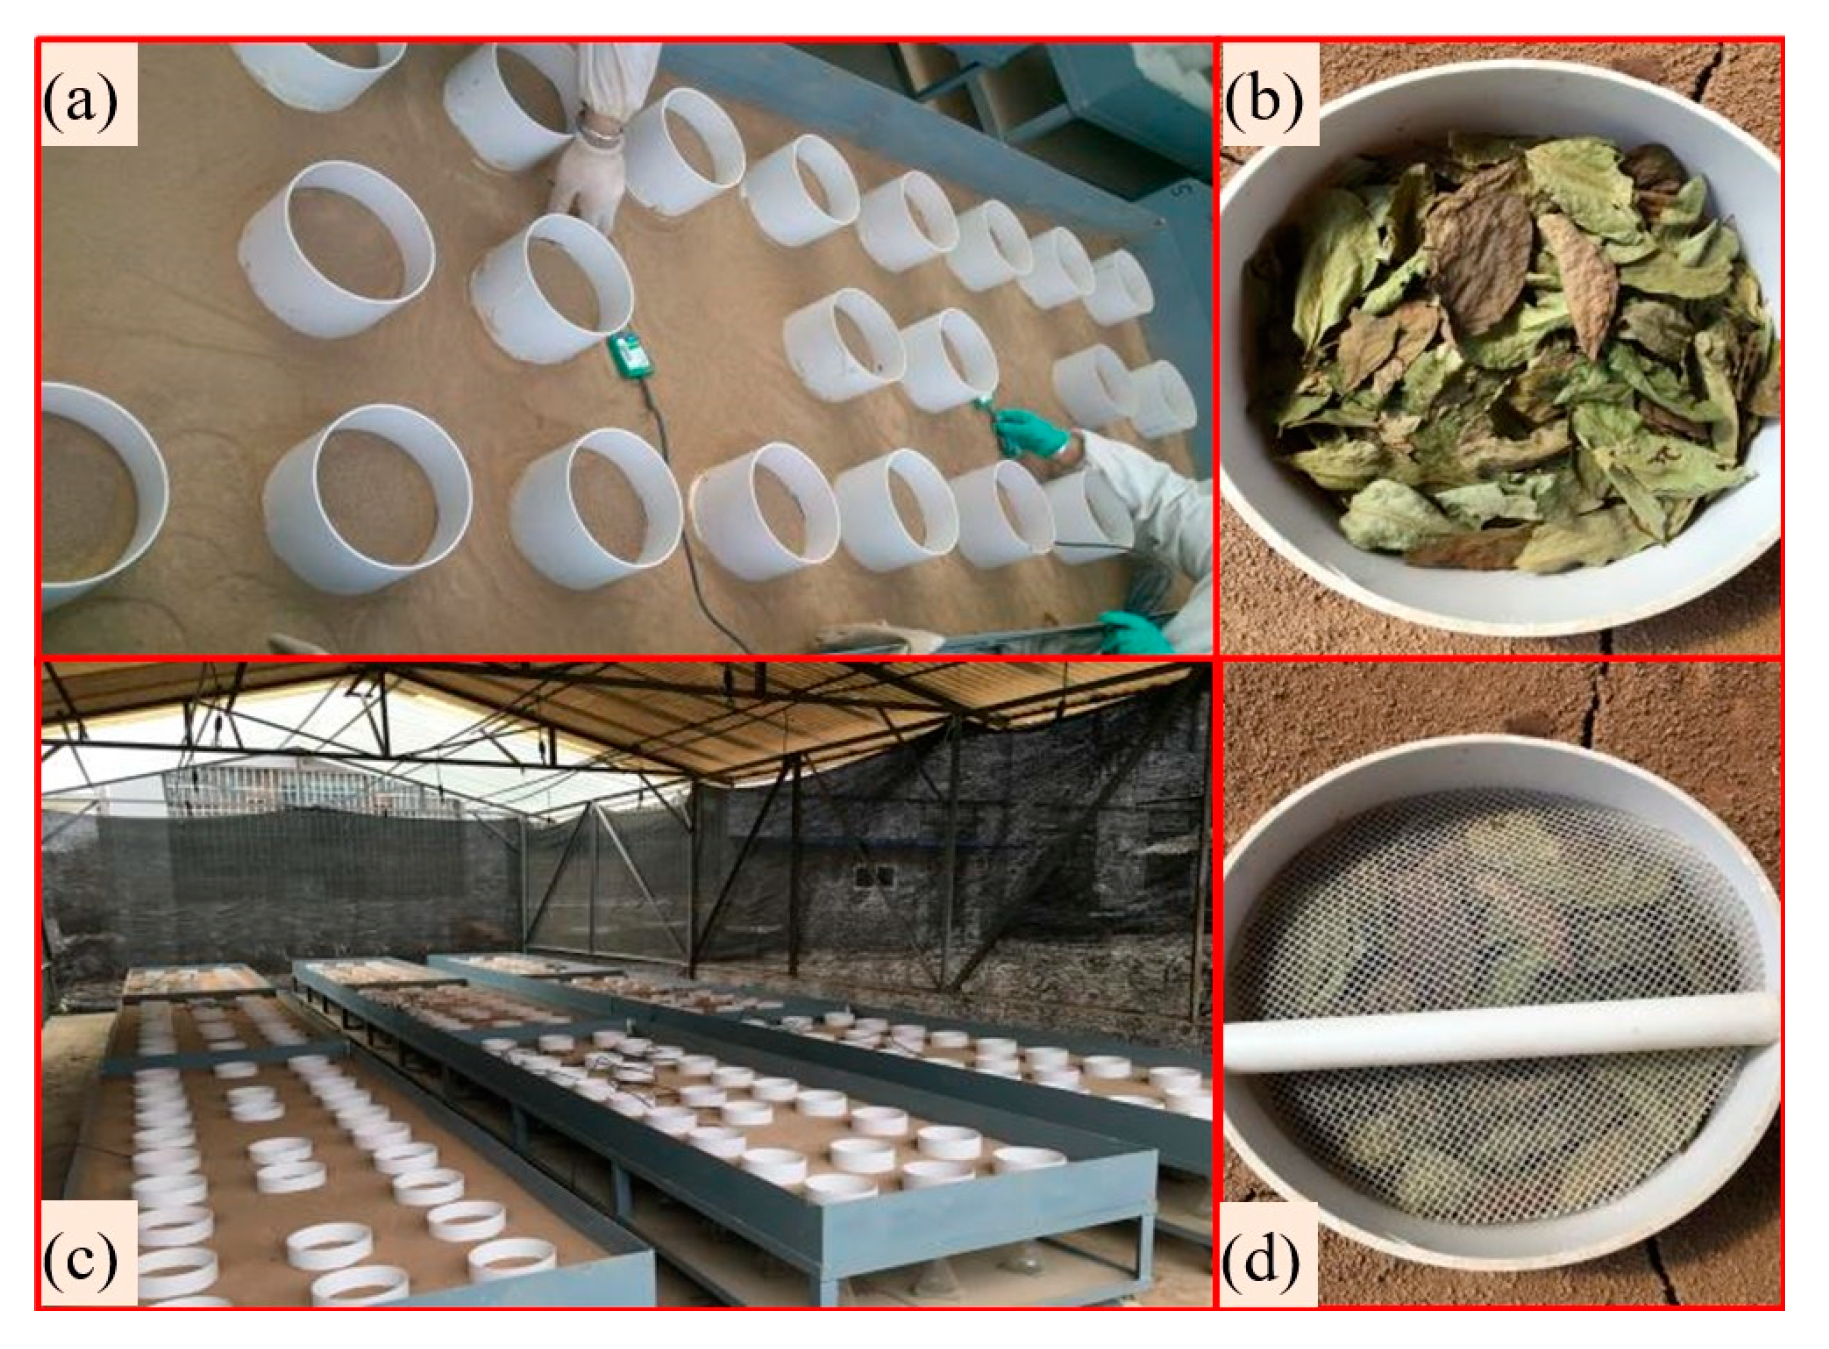
2.2. Experimental Design

The greenhouse litter decomposition field experiments began by first sinking 16 cm diameter by 20 cm long PVC (polyvinyl chloride) tubes (N = 126) 15 cm into soil that had been screened through a 2 mm mesh. Then, 10 g of leaf litter (density about 0.02 g cm−3) was placed on the surface of the soil inside each tube, and a 2 mm mesh nylon net (16 cm diameter) was carefully placed on the litter to minimize loss due to wind and other factors. Additionally, 18 control tubes were set up identically to the experimental tubes, except that they received no litter. Finally, the experimental site was roofed over, and the experiment was carried out in the shade to avoid photolysis of the litter (Figure A1). The decomposition experiment was conducted between April 2016 and August 2017.
The experimental design included the decomposition stages, precipitation treatments, and litter types. Decomposition was measured 2 (June 2016), 4 (August 2016), 6 (October 2016), 8 (December 2016), 12 (April 2017), and 16 (August 2017) months after the experiment began. The precipitation treatments were controlled by an artificial irrigation system and included 400, 600, and 800 mm of water per year, which are amounts that reflect the actual ranges of average precipitation in the area. The scheduled rainfall and frequency are shown in Table 1. The artificial rainfall system was installed under the rooftop, and each sprinkler head had a short, stable, 360° full-circle spray range. Additionally, the sprinkler’s water droplets were small enough to simulate raindrops (Figure A2). Each of the 2 types of leaf litter was tested in combinations of the 6 decomposition stages and 3 precipitation treatments (2 × 6 × 3) with 3 replicates, resulting in a total of 108 experimental plots.

2.3. Isotope Labeling and Leaf Sample Collection

We used a leguminous black locust (RP) and a non-leguminous poplar (PT) as study materials. There is significant variation in the ability of these two trees to use N from environments (leguminous vs. non-leguminous), which significantly affects the nitrogen and carbon contents as well as the abundance of labeled 13C and 15N in the litters. The two trees were all artificially planted in Yangling, among which RP was 4 m tall, with 3.2 m crown diameter and 20 cm trunk circumference, and PT was 5.5 m tall, with 2.4 m crown diameter and 30 cm trunk circumference. Since isotope labeling efficiency is greatly affected by water availability, we conducted the labeling during the rainy season (28 July 2015–3 August 2015), using the technique proposed by Glaser et al. [5]. During that process, we first drilled an approximately 2 cm hole into the tree trunks with a power drill tilted down about 30°. Then, the tree stems were injected with 15NH415NO3 to affect 15N uptake, while the trees were simultaneously gassed with 13CO2 to affect 13C uptake via photosynthesis. Specifically, the stems were injected with a 2% 15NH415NO3 solution for 2 consecutive days. After 15N labeling was completed, and 15N was distributed in the leaves as evenly as possible, 13C labeling was performed 1 day later. For that, we sealed each tree in a large plastic bag with high light transmittivity (95%), and then we fixed a vessel containing sulfuric acid (5 mol L−1) to the tree stems and mixed in a high-purity Na213CO3 solution, which then released 13CO2 gas. A fan fixed to the tree stems below the vessel evenly distributed the 13CO2 around the tree body to aid 13C uptake via photosynthesis. We performed labeling with the same concentrations of 13C every 2 h during the day (09:00–15:00 h). After the 13C labeling was completed, 15N and 13C labeled leaves were immediately harvested and dried at 45 °C, their 15N and 13C abundances were measured, and then they were stored in dry shade for subsequent use as leaf litters in this experiment. Ultimately, we obtained 2.18 kg (fresh weight) of RP leaves and 2.06 kg (fresh weight) of PT leaves. The δ15N and δ13C values for the labeled leaves were 3604.0‰ and 55.6‰ for RP and 8115.0‰ and 452.0‰ for PT, respectively. The quantities and isotopic abundances of the labeled materials met our study’s requirements [5,10,36].

2.4. Litter Collection and Soil Sampling

Over the whole experimental period, the litter remaining in each container after 2, 4, 6, 8, 12, and 16 months of decomposition was collected with tweezers and placed in paper bags. A very small amount of soil particles was attached to the decomposed litter of some of the samples, so we used a soft brush to carefully remove these particles. The litter was oven dried at 60 °C to a constant weight, the mass loss during decomposition was calculated, and then the litter was ground fine enough to pass through a 0.25 mm sieve for chemical analysis. The samples from the control (no litter) and litter-treated soils were collected in layers (0–2, 2–5, 5–10, and 10–15 cm) at each sampling time, naturally air dried, and ground through a 0.25 mm sieve for chemical analysis.

2.5. Chemical and Isotopic Analyses

The litter and soil samples were analyzed for total C and N contents and 13C and 15N isotopes using an Elementar Vario EL Cube (Elementar Analysensysteme GmbH, Hanau, Germany) interfaced to a PDZ Europa 20–20 isotope-ratio mass spectrometer (Sercon Ltd., Cheshire, UK).

2.6. Calculations and Statistical Analysis

The proportion of remaining mass (RM, %) after the litter decomposition for each treatment was calculated as follows:
R M % = 1 M 0 M t M 0 × 100
where M0 and Mt are the mass (g) of the litter before and after decomposition, respectively, for each stage.
The annual decay rate constants (k, year−1) of the litter types were calculated using the Olson [37] negative exponential decay model:
k = ln X t X 0 t
where X0 is the initial weight of litter; Xt is the weight of the residual litter after sampling at time t; and t is the sampling duration (in years).
The time required for 50% and 95% decomposition of leaf litter in each treatment was calculated as follows:
t 0.5 = ln 0.5 k
t 0.95 = ln 0.05 k
where t0.5 and t0.95 are the time for 50% (half-life period) and 95% decomposition of leaf litters, respectively.
The fraction of litter-derived C and N in the soil was obtained from the variation in δ13C or δ15N in the soil and litter and by applying a two-source mixing model [7]:
f l i t t e r = δ s ( t ) δ c ( t ) δ l ( t ) δ c ( t )
where flitter (%) is the fraction of litter-derived C or N in the soil over the total soil C or N; δs (t) is the δ 13C or δ 15N of the soil at the end of incubation; δc (t) is the δ 13C or δ15N of the control soil at the end of incubation (c = control); and δl (t) is the δ 13C or δ15N of the litter sample.
All correlation analyses were calculated using Pearson correlation coefficients. The direct effects of precipitation (400, 600, and 800 mm) on litter mass-loss rates, C and N releases, and 13C and 15N isotope abundances were examined by using one-way analyses of variance (ANOVAs). Linear regression and further statistical analyses were performed using SPSS version 19.0 (IBM, Armonk, NY, USA).

3. Results

3.1. Remaining Mass of Litters

When averaged across the two leaf types and three precipitation treatments, the remaining mass (RM) of the leaf litters decreased linearly with time during the 16-month decomposition period, with rapid decomposition in the first 2 months (73.52 ± 1.61% for RP and 66.44 ± 1.23% for PT, about 60% of the total mass loss) and slow changes after 8 months (60.80 ± 1.71% for RP and 45.68 ± 4.05% for PT) (Figure 1). Additionally, the RM varied with leaf type, with the decay rate constants (k) of 0.41 year−1 and 0.48 year−1 for RP and PT leaves, respectively. After 16 months of decomposition, the PT leaf RM (53.17 ± 2.48%) was significantly lower than that of RP leaves (60.08 ± 1.47%) (p = 0.027).
The RM of both leaf types was significantly affected by precipitation regime during litter decomposition (p < 0.01, Table 2), and the effects varied with leaf type (p = 0.028 for the interaction). After 16 months of decomposition, The PT leaf RM under 600 mm (43.53%) precipitation treatment was significantly lower than that under 400 mm (60.27%) and 800 mm (55.73%) treatments (p < 0.05); Same as the RM, the k values were 0.33 ± 0.03 year−1, 0.56 ± 0.01 year−1, and 0.58 ± 0.04 year−1, respectively. The RM for RP leaves under 400 mm (69.24%) precipitation treatment was significantly higher than that under 600 mm (57.52%) and 800 mm (53.39%) (p < 0.05), while the k values (p = 0.552) were 0.37 ± 0.01, 0.41 ± 0.02, and 0.45 ± 0.08 year−1, respectively. The half-life period of the RP leaf litters was not affected by precipitation treatments, while the half-life period of the PT leaf litter under 400 mm precipitation was significantly higher than that under 600 mm and 800 mm precipitation treatments.

3.2. Leaf Litter Carbon and Nitrogen Dynamics

The C concentration of both leaf litters was similar, while that of N was significantly higher in the RP litter than in the PT litter (Table 2). Additionally, the C and N concentrations decreased as decomposition progressed, and the decreases were not significantly different for PT and RP (p = 0.567), while C decreased more overall than N did. For instance, the C and N concentrations in the RP litter decreased by 102.49 g kg−1 and 7.20 g kg−1, respectively, while those in the PT litter decreased by 141.89 g kg−1 and 10.35 g kg−1, respectively.
Leaf litter C and N dynamics during decomposition were not significantly affected by precipitation regime (p > 0.05) (Table 2). In the 400, 600, and 800 mm precipitation treatments, the mean C contents in the RP leaf litter were 450 g kg−1, 436 g kg−1, and 431g kg−1, respectively, and the mean N concentrations were largely unaffected by precipitation (40.15 g kg−1, 39.84 g kg−1, and 35.87 g kg−1, respectively). For the PT leaf litter, the mean C contents were 445 g kg−1, 421 g kg−1, and 428g kg−1, respectively, and the mean N concentrations were 29.36 g kg−1, 29.46 g kg−1, and 31.04 g kg−1, respectively.
During litter decomposition, the C:N ratio was significantly lower (p = 0.003) in RP (11.10–10.74) than in PT (14.75–14.43) leaves primarily because the RP leaves began with higher N concentrations. The average C:N ratio of the RP leaf litter during decomposition was not significantly different with increasing precipitation, but for the PT leaf litter, the ratio was significantly higher in the 400 mm treatment (16.2) (p = 0.052) but not in the 800 mm treatment (12.7).

3.3. Leaf Litter δ13C and δ15N Dynamics

The initial δ13C of the PT leaf litter was significantly higher (452.00‰) than that of the RP leaf litter (55.60‰) regardless of precipitation regime and decomposition time (Figure 2). As decomposition progressed, δ13C decreased and the decrease was greater for PT than for RP. The drop occurred mainly in the first two months (reduced about 70%); in the RP litter, δ13C decreased to 16.28‰, and it decreased to 133.84‰ in the PT litter. While δ13C in the RP leaf litter was relatively stable (16.28‰ to 23.44‰) in 2–16 months, it was significantly lower than the initial value; in the PT leaf litter, it decreased over the decomposition time from 133.84‰ to 38.50‰ in 2–16 months. For the RP litter, δ13C was significantly higher in the 400 mm treatment (30.73‰) than in the 600 mm (21.31‰) and 800 mm (23.47‰) treatments (p < 0.05) from 4 to 12 months of decomposition, but the PT litter had no such significant differences.
The δ15N value was also significantly higher in the PT leaf litter than in the RP leaf litter across the three precipitation regimes (p < 0.05). The RP leaf litter’s δ15N increased from 3604‰ to 4552‰ as decomposition progressed, while that of the PT leaf litter decreased from 8115‰ to 4118‰. The δ15N value of the PT leaf litter decreased sharply in the first two months, and it decreased by 58.57%, 43.84%, and 49.38% in the 400 mm, 600 mm, and 800 mm precipitation treatments, respectively. Additionally, the average δ15N was not significantly different among different precipitation regimes for both litters (p > 0.3, Figure 2).

3.4. Soil Carbon and Nitrogen Dynamics

As precipitation increased from 400 to 800 mm, soil moisture increased from 14.97% to 32.00%, and conductivity increased from 7.57 to 19.14 dS m−1, but soil temperature decreased from 19.27 to 17.74 °C (Figure 3).
Soil C concentrations were significantly higher in the 0–2 cm (3.76 g kg−1) than in the 2–5, 5–10, and 10–15 cm soil layers (3.48, 3.43, and 3.41 g kg−1, respectively) (p < 0.001, Figure 4), but there were no significant differences in N concentrations between the different soil layers (0.52, 0.55, 0.53, and 0.53 g kg−1, respectively; Figure 4). Because previous research showed that litter decomposition mainly changed surface soil C and N contents, we only analyzed the 0–2 cm soil layer’s large variations [38,39]. Researchers believe that microorganisms are active in litter layers, and SOC and TN accumulate significantly in the surface layer. In addition, about half of the underground plant biomass is concentrated in the soil surface layer, and organic matter in a lower layer is less returned. Both the RP and PT leaf litter-treated soils began with similar C and N concentrations, but over time, the C concentration peaked at 8 months for the RP soil and at 12 months for the PT soil. For N concentrations, the peak values appeared at six months for both RP and PT soils. Although soil C and N contents first increased and then decreased, these variations were not significantly different. Compared with the blank soil, the leaf litter treatment slightly increased the C and N contents in the 0–2 cm soil layer, but the effect of this increase was not significant (p > 0.05).
Precipitation regimes did not significantly affect soil C and N dynamics during decomposition (p > 0.05, Figure 4). In the 0–2 cm soil layer, the mean values of C and N concentrations for the RP soil increased slightly as precipitation increased. In the 400, 600, and 800 mm precipitation treatments, the RP soil’s C concentration was 3.55, 3.81, and 3.93 g kg−1, respectively, and the N concentration was 0.54, 0.56, and 0.58 g kg−1, respectively. For the PT soil, the C concentration was almost unaffected by precipitation, and the N concentration was 0.58, 0.61, and 0.63 g kg−1, respectively.

3.5. Soil δ13C and δ15N Dynamics

As soil depth increased, the δ13C and δ15N values gradually decreased (Figure 5), and the values in the 0–2 cm soil layer were markedly higher than those in the 2–15 cm soil layers. Additionally, the δ15N decrease was significantly greater than that of δ13C. However, the control soil’s δ13C value was evenly distributed in the soil profile (focused on −21‰), and the δ13C value was significantly lower than the leaf litter-treated soil. In the 0–2 cm soil layer, the mean δ13C was not significantly different in both PT (−10.49‰) and RP soils (−13.34‰) (p = 0.237), whereas the mean δ15N was significantly higher in the RP soil (445.75‰) than in the PT soil (126.75‰) (p < 0.05). The δ13C peak values of the RP and PT soils appeared at six months (−10.82‰) and two months (−8.14‰) of decomposition, respectively, and δ15N peaked at eight months for both RP and PT soils (557.83‰ and 414.89‰, respectively) (Figure 5). In the 0–2 cm soil layer, the δ13C and δ15N values were not significantly affected by the different precipitation treatments, but the PT soil’s δ13C value in the 600 mm treatment was higher than those in the 400 and 800 mm treatments (p < 0.05).

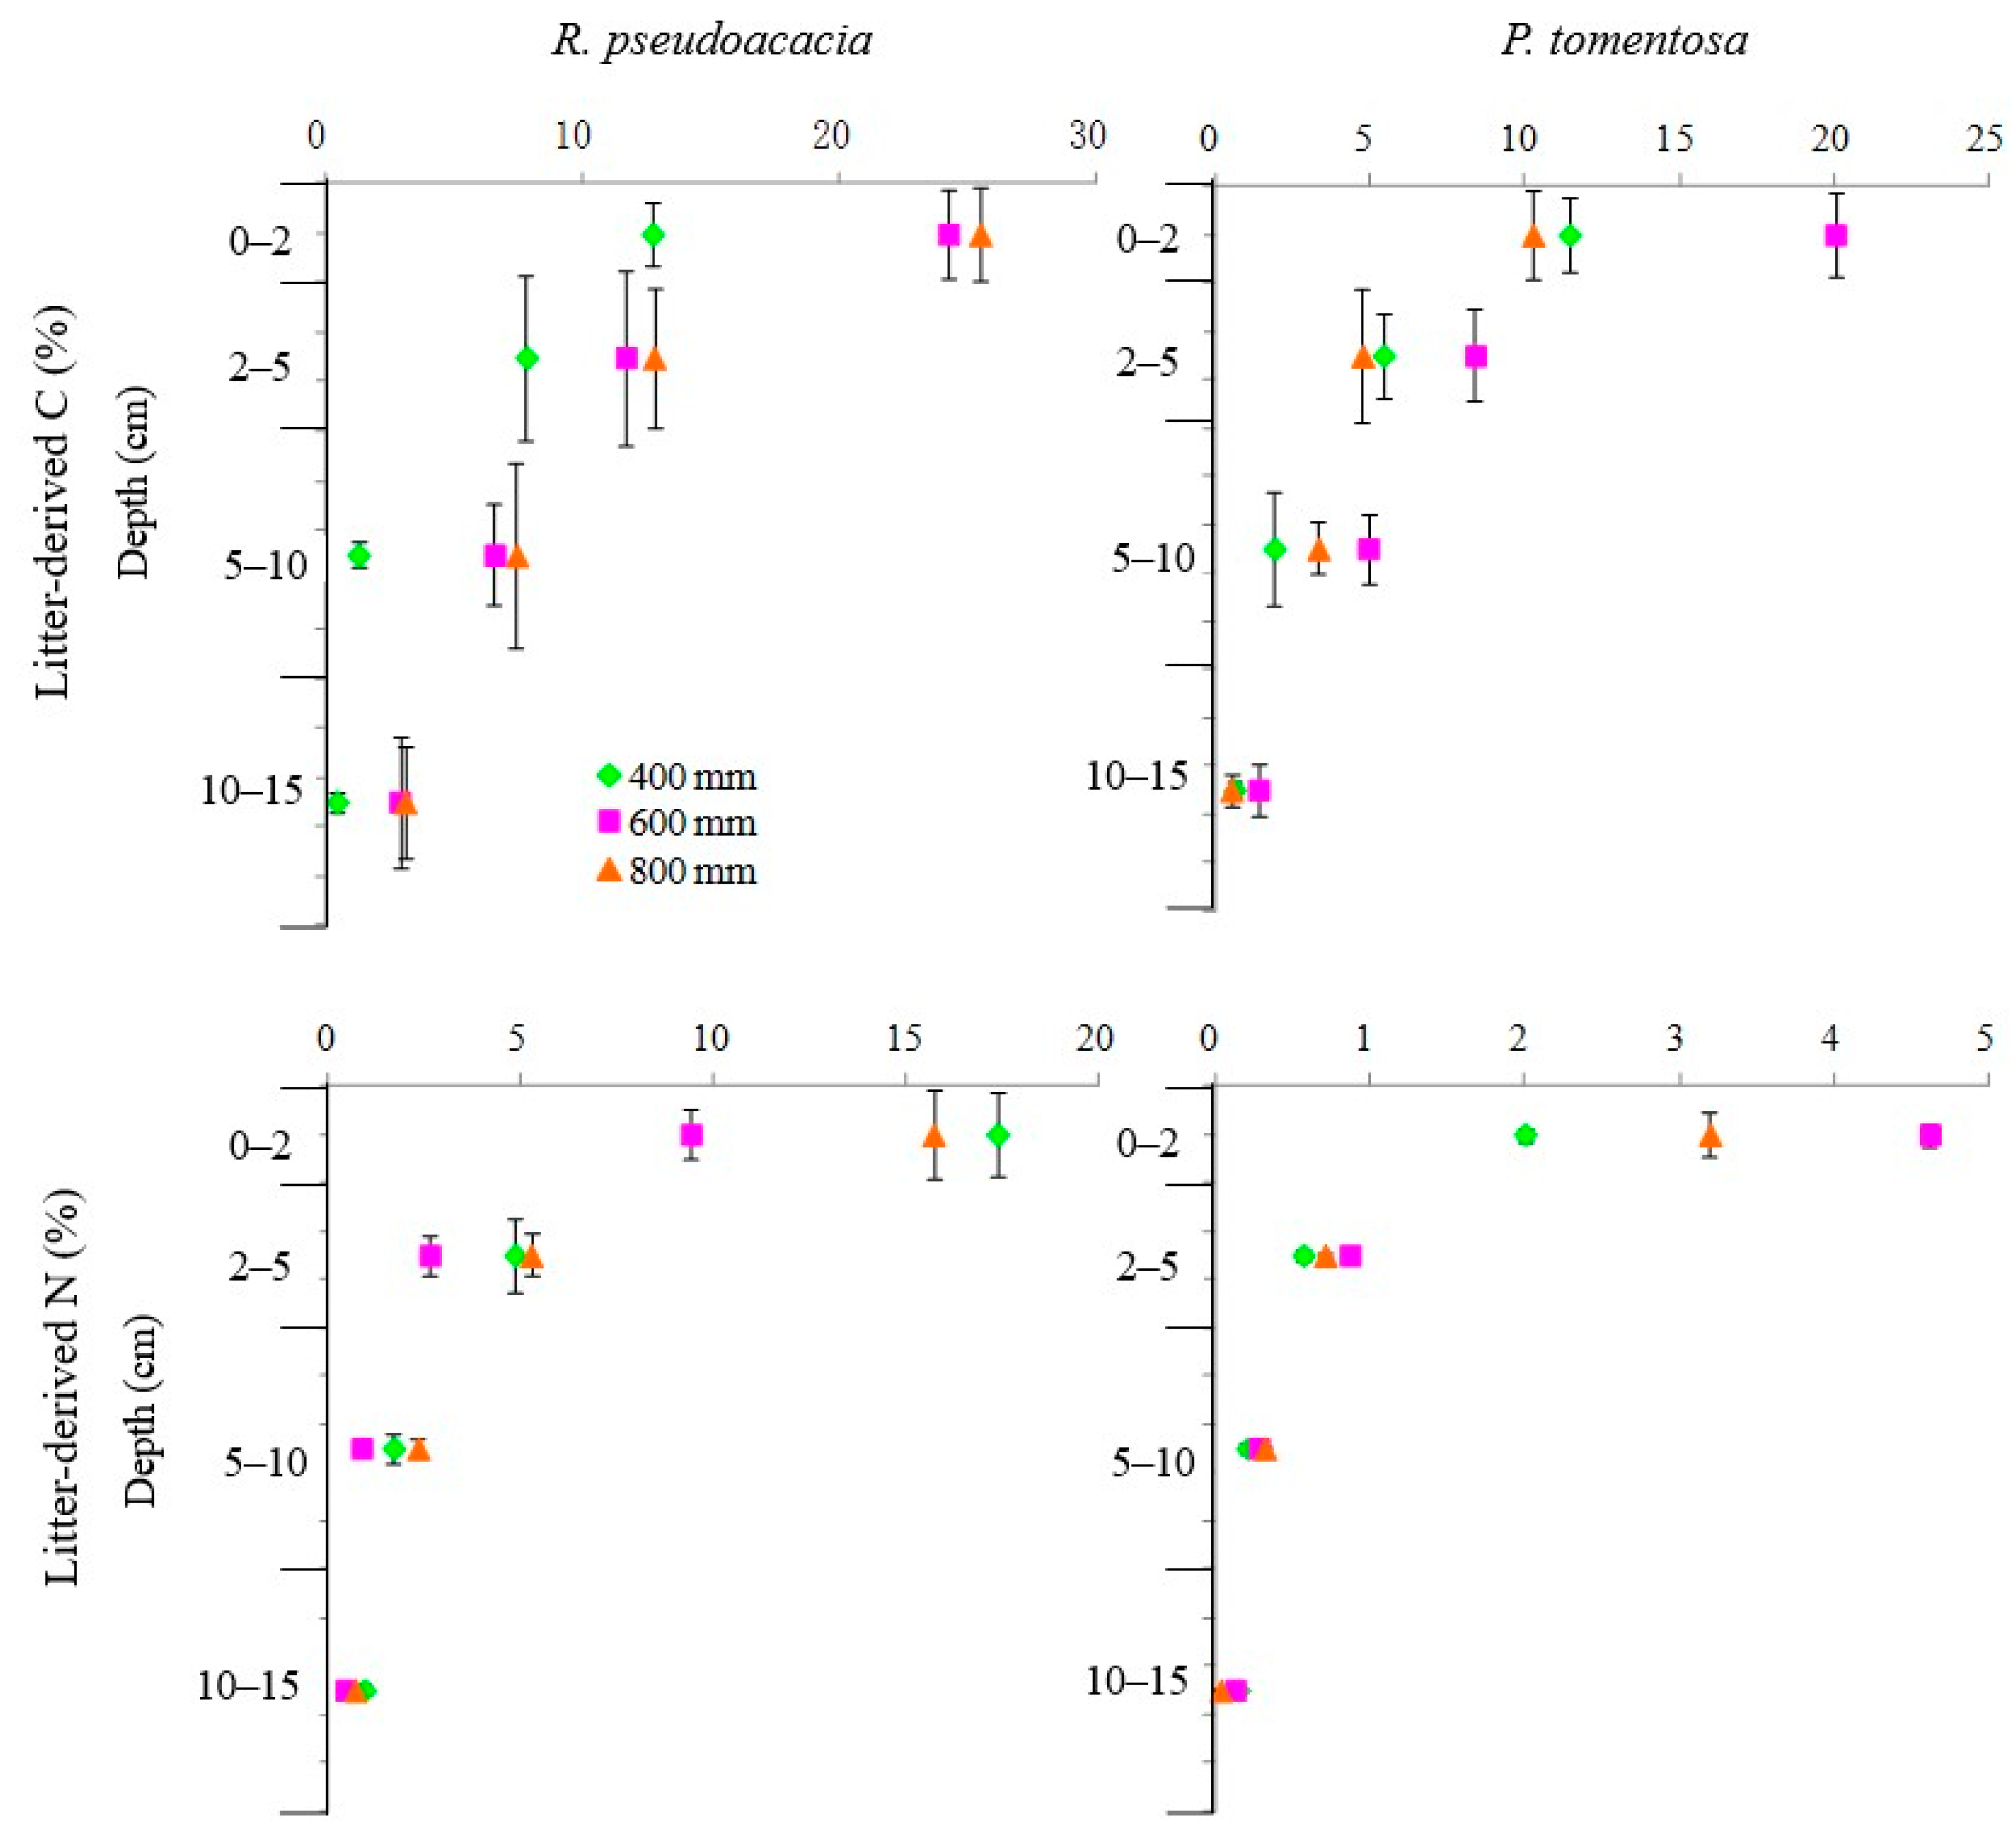
3.6. The Fractions of Litter-Derived Carbon and Nitrogen in Soil

The fractions of litter-derived C and N gradually decreased as soil depth increased, and the 0–2 cm soil layer had significantly higher fractions than the 2–15 cm soil layers (Figure 6). Moreover, in the 0–2 cm soil layer, there was no significant difference between the RP and PT fractions of litter-derived C (20.79% and 14.60%, respectively), while the fraction of litter-derived N from the RP soil (14.13%) was significantly higher than that from the PT soil (3.19%, p = 0.009). Additionally, the fraction of litter-derived C (17.34%) was significantly higher than that of litter-derived N (8.7%, p = 0.036).
After 16 months of decomposition, the fractions of litter-derived C and N were also related to precipitation regimes. In the 0–2 cm soil layer, the fraction of litter-derived C from the RP soil was significantly higher in the 600 (24.22%) and 800 mm (25.44%) precipitation treatments than in the 400 mm (12.72%) precipitation treatment (p < 0.05), and the fraction of litter-derived N from the RP soil was significantly higher in the 400 (17.34%) and 800 mm (15.67%) precipitation treatments than in the 600 mm (9.38%) precipitation treatment (p < 0.05). However, the fractions of litter-derived C (20.01%) and N (4.61%) from the PT soil were highest in the 600 mm precipitation treatment (Figure 6, p < 0.05). In addition, with the deepening of soil layers, the differences among the three precipitation regimes were smaller.

3.7. Linear Carbon and Nitrogen Relationship

The C and N residue contents of the RP leaf litter were significantly positively correlated under different precipitation treatments (p < 0.001), but the positive correlation between the C and N residue contents of the PT leaf litter was not significant (p > 0.1) (Table 3). Additionally, the slope value of the linear relationship was higher for the RP leaf litter (0.0671) than for the PT leaf litter (0.0257). The slope values of the linear relationships between C and N residue contents in the RP and PT leaf litters under the 400 mm precipitation treatment were significantly lower than those under the 600 and 800 mm treatments (p < 0.05). For example, the linear slope values of the C and N residue contents of the RP leaf litter under the 400 mm, 600 mm, and 800 mm precipitation treatments were 0.0504, 0.0821, and 0.0834, respectively, and those of the PT leaf litter were 0.0019, 0.0295, and 0.0500, respectively. These results indicate that the N response to the changes in C was enhanced as precipitation increased. As decomposition proceeded, the C and N residue contents in the RP leaf litter were always positively correlated. However, the C and N residue contents in the PT leaf litter were negatively correlated at 2 and 16 months of decomposition, but positively correlated between 4 and 12 months of decomposition, although none of these correlations were significant (p > 0.05). In addition, the slope value of the relationship between the C and N residue contents was significantly higher at two months of decomposition (RP = 0.137 and PT = −0.129) than at other decomposition periods.
While the C and N contents in the 0–2 cm, 5–10 cm, and 10–15 cm soil layers were significantly positively correlated (p < 0.01) (Table 4), they were not significantly correlated in the 2–5 cm soil layer (p = 0.272). During the whole decomposition period (16 months), the C and N contents in the leaf litter-treated soil were always positively correlated (p < 0.001). As decomposition time progressed, the linear relationship slope value gradually decreased from 0.299 (initial) to 0.095 (eight months), and then it remained basically unchanged. This indicated that while the litter cover weakened the response of N to C changes in the soil, they did not uncouple. In addition, the C and N contents in the leaf litter soil were positively correlated under different precipitation treatments (p < 0.001). We also found that the slope values of the linear relationship of C and N contents in all soil layers of the legume RP were significantly higher than those of the non-legume PT, indicating that the responses of N to C changes in the leguminous leaf litter-treated soil were stronger than those of the non-legume treatment.

4. Discussion

4.1. Remaining Mass of Litters

The leaf litters rapidly lost mass in the first two months (simulated rainy season) of irrigation (Figure 1), indicating that many unstable water-soluble compounds were lost. Similarly, Rubino et al. [7] demonstrated that mass loss stabilized after 100 days of incubation, and Gautam et al. [6] reported an initial phase (up to 60 days) that was characterized by a rapid decline in litter weight. Peak litter decomposition rates usually occur at the beginning of the rainy season, mainly because a large number of unstable water-soluble compounds are lost due to precipitation [40]. Afterward, decomposition rates reduce during later decomposition phases because of a predominance of recalcitrant metabolites [6].
The greatest RM in our study was in the 400 mm precipitation treatment (p < 0.05), possibly because drought-limited conditions did not favor microbial decomposition in the litter. Santonja et al. [32] also showed that drier climate led to slower mass-loss rates. For the RP leaf litter, the mass loss increased with an increase in precipitation. Typically, populations of major decomposers, including bacteria, fungi, and arthropods, may be affected by precipitation, and low humidity can inhibit fungal growth and/or activity [41]. Increasing precipitation not only promotes the leaching of soluble substances in litter, but also increases soil surface water content and improves the living environment of microorganisms, thus accelerating the decomposition of litter. Zhou et al. [42] studied decomposition in Sichuan (with an average annual rainfall of 1700 mm) and found that both 20% and 50% reduction in rainfall significantly reduced litter mass loss. Studies in both Hawai’ian (500–5500 mm) and the Mediterranean (annual mean of 830 mm) found that decomposition reduced significantly as water availability reduced [32,43]. However, for the PT leaf litter, the mass loss was the highest under the 600 mm precipitation treatment. We believe that the shape and size of leaves should also be considered in the study of litter decomposition in experimental tubes. The PT leaves we selected were thin and large, resulting in the loss of excess water flow from the short-term, high-intensity pulse precipitation along the soil column wall. Moreover, greater precipitation (i.e., 800 mm) in humid soil hinders oxygen supply to microorganisms and inhibits the biological activity of decomposers [44]. Thus, not surprisingly, precipitation regimes significantly affected the RM values during litter decomposition in our study.
In our study, the non-legume leaf litter’s RM values were less than those of the legume (higher N content and lower C:N ratio) leaf litter. In contrast, other studies have shown that decomposition is rapid when the N contents are high and the C:N ratios are low [45]. This might be because the PT litter’s surface area was larger, more microorganisms could be carried on the litter per unit mass, thus contributing to decomposition [46]. Alternatively, its low tannin content might have aided PT leaf decomposition, as Drechsel et al. [47] suggested when they found that the low decomposition rate of Acacia was caused by its high tannin content. However, we believe that in the Loess Plateau, leaf litter mass loss of deciduous vegetation is mainly determined by the N/p ratio, and the N/p ratio is negatively correlated with mass loss [35]. Therefore, the PT leaf litter (N/p ratio was 15.91) had a higher mass loss than the RP leaf litter (N/p ratio was 34.53).

4.2. Leaf Litter Carbon and Nitrogen Dynamics

Both C and N decreased in the leaf litters during decomposition, with C having greater decreases than N, thus indicating that litter C and N were always released. Similarly, Du et al. [35] found that the C content in plant litter gradually reduced after 1 year, and Connin et al. [48] reported that plant litter N contents decreased 60% during the first 120 days of decomposition. Hart et al. [49] found that the C mineralization rate of fresh litter in soil was accelerated because of the soil’s high N content at the initial decomposition stage, and the C mineralization rate gradually decreased as the high N litter was decomposed. However, Parton et al. [50] reported a simultaneous net increase in N content in decomposing litter, perhaps because N may be immobilized by bacteria and/or nutrients may be transferred to the decomposing litter from humus or mineral soil via fungal hyphae [7]. In our study, the leaf litter N content was >24 g kg−1 and the C:N ratio was <17, and relatively higher N concentrations and lower C:N ratios (i.e., N content > 20 mg g−1 and C:N < 25) favor organic matter decomposition and, thus, larger N loss [51]. Therefore, the dynamic characteristics of C and N are related to litter quality.
In our study, the litter C and N losses were not significantly affected by precipitation (Table 2), thus indicating that increases in precipitation did not increase the loss of litter C and N. Santonja et al. [24] also showed that a 10% reduction in rainfall did not alter the C content in a Mediterranean shrub forest with an average annual precipitation of 552 mm. However, Austin and Vitousek [43] reported that N mineralization generally increased with increasing precipitation on the island of Hawai’i (500 to 5500 mm). The differences between our results and theirs may be due to the relatively smaller range of precipitation regimes in our study (400 to 800 mm). Additionally, the extent of the effects of reduced rainfall may depend on the type of ecosystem and on the amount of rainfall that is removed [24].

4.3. Leaf Litter δ13C and δ15N Dynamics

All δ13C values decreased gradually, while the δ15N value for the RP leaf litter showed an enrichment and that for the PT leaf litter decreased. These findings indicate that different types of leaf litters may have greatly different isotope distributions. The loss of 13C in leaf litter is usually accompanied by a loss of dry mass and total C [52]. The variation in δ13C values in litters during decomposition may also result from isotope fractionation during microbial respiration, which leads to preferential release of 13C [53]. In the Loess Plateau, Bai et al. [10] found that 13C recovery in the leaves of Populus decreased from nearly 90% at 6 h (δ13C = 568 ± 71‰) after labeling to 40% at 21 days. Other studies found that δ13C decreased by 75.83% after 11 months [7], enriched over time [6], or shifted negligibly in residual litters [54]. Connin et al. [48] also reported two different isotopic shifts within the same geographic region for two different species after two years of decomposition—one shift led to enrichment (S.gerardi) and the other led to depletion (p.elliotii). Other studies found that δ15N was depleted [1] and 15N was enriched [55] in litters. The rapid δ13C depletion was caused mainly by decreased tannin content and the destruction of aromatic C structures in the initial stage of decomposition [56]. The δ15N enrichment might be explained by a preferential retention of 15N-enriched substrates [48] and/or by fungal-dominant decay processes [57]. However, decreases in δ15N might reflect decomposition processes dominated by bacteria [58]. Perakis et al. [59] observed a correlation between δ15N in litters and N availability. Thus, when N is limited, 15N will be lost. Similarly, when C availability is relatively high, the fractionation in the N assimilation process leads to a low 15N enrichment level [60].
Our results also showed that the δ13C and δ15N values of the leaf litters were positively correlated at 0.01 level (r = 0.414, p < 0.01). We also found that the N content was negatively correlated with δ13C (r = −0.305, p < 0.01) and δ15N (r = −0.284, p < 0.01). Therefore, in our study, the δ13C and δ15N values of the RP leaf litter (with high N content) were lower than those of the PT leaf litter. In addition, Gautam et al. [6] found that when the C/N value is high, 15N depletion may be related to microbial demand for extra N during litter degradation. Thus, the 15N loss of the PT (with high C/N value) leaf litter was greater than that of the RP (with low C/N value) leaf litter in our study.
The δ13C and δ15N values of our leaf litters were not significantly different among the precipitation gradients, except for the RP leaf litter’s δ13C (2–12 months) (Figure 2). This indicates that the increase in precipitation in this study did not change the isotope distributions in the litters. Water availability is arguably the most influential factor affecting leaf δ13C and δ15N in semi-arid and arid environments [28]. Additionally, a large body of literature has reported negative correlations between plants’ δ13C and δ15N values and the availability of precipitation [61]. Handley et al. [62] found that Acacias’s δ13C (−24‰ to −26.6‰) in arid sites without access to groundwater had smaller negative values than other sites with groundwater access, and this was possibly a response to water stress. Welker et al. [63] reported that δ15N in the leaves of 15 Eurasian Arctic coastal Carex plants differed significantly among the plots, and these δ15N values were negatively correlated with the mean annual precipitation. This correlation suggests that the δ15N values decreased when water availability was sufficient. Liu et al. [23] showed that δ15N of the Loess Plateau ecosystem was more sensitive to precipitation than previous data, and the δ15N value of the litter was −1.39‰/100 mm. The nitrogen isotope values of the litter decreased with an increase in annual rainfall or summer precipitation. In our study, precipitation had no significant effect on the δ15N value, possibly because the abundance of leaf litter markers was too high, which did not respond significantly to the change caused by the difference of 200 mm precipitation. Future research should employ larger differences.

4.4. Soil Carbon and Nitrogen Dynamics

Compared to the control (no litter), the C and N contents in the 0–2 cm layer of litter-treated soil were significantly greater than those in the 2–15 cm layers (p < 0.001), and the profile difference was larger. Because litter can alter the microenvironment, thereby affecting both biotic and abiotic processes in the topsoil [64], it has no significant effect on soil C in the deep layers because the faster degradation of old C in the soil offsets the increased input of soil-conditioning matter [65]. In their 6-year study, Cao et al. [66] found that forest leaf litter increased the SOC content in the 0–10 cm soil layer but did not cause a change in the 10–20 cm soil layer. Garten et al. [67] also found that the mean soil C contents declined with soil depth during litter decomposition. Hatton et al. [68] observed that after 10 years, a relatively large proportion of N produced by litter was retained in the topsoil layer, and they demonstrated time delays in the transfer of litter-derived N from the soil organic layer to the mineral layer (vertical delay) and from plant debris to the mineral–organic assemblage (horizontal delay). If soil surface moisture and temperature are suitable, and there are ample microorganisms, litter decomposes quickly. Litter cover can change the microenvironment, thereby affecting the soil C and N contents in topsoil layers [64].
Although the C and N contents of the litter-treated soil was significantly higher than the control soil (no litter) during 4–8 months of decomposition (August to December, during which there was heavy rainfall), the leaf litter treatment did not significantly increase soil C and N contents in terms of the mean values after the 16-month decomposition period. In Pennsylvania, Bowden et al. [69] found that 20 years of double litter treatment did not increase the content and storage of SOC. Similarly, Lajtha et al. [70] found in their 20-year study in the Harvard Forest that double litter treatment increased the C content of the organic layer, but it had no effect on the C content of mineral soil. This is because new C input from litter sources can compensate for the decomposition of soil old OC caused by priming effect [65]. Thus, an increase in litter input during the initial years of forest restoration is likely to be offset by C loss due to its higher C degradation rate [71].
In the litter-treated soil, the surface soil C and N contents did not change significantly as precipitation increased. A previous study showed that rainfall positively correlated with litter decomposition rate, which in turn affected surface soil C and N dynamics [72]. This difference might be because our precipitation gradient was too small to reflect the impacts of precipitation differences on soil surface C and N. This indicates that in the Loess Plateau (semi-arid region), a small amount of additional precipitation does not significantly change the amount of litter C and N entering the soil.

4.5. Soil δ13C and δ15N Dynamics

Compared with the δ13C and δ15N values in the control soil, these values were significantly enriched in the 0–5 cm layer of the litter-treated soils (p < 0.01) (Figure 5). Similarly, litter-treated soils in other studies were significantly enriched in δ13C [7] and δ15N [1] in the 0–5 cm soil layers. As the δ15N content became gradually enriched, the δ13C content remained unchanged in the 0–2 cm soil layer during decomposition (Figure 5). Overall, these values were higher than the values in the control soil, most likely because of the decomposition of organic matter [73]. Consistent with our study, Bimüller et al. [1] found that δ15N increased after 140 days of decomposition, and Díaz-Ravinã et al. [73] observed a 4.4‰ enrichment in the 0–5 cm layer after 12 years. Our results show that 15N peaked in winter, with most of it as dissolved organic N that was strongly retained in the upper 5 cm of soil [52]. In addition, the δ13C value of the 0–2 cm soil layer was positively correlated with the δ13C value of the leaf litter (r = 0.431, p < 0.01) in this study. It has been verified that soil organic matter mainly comes from the vegetation layer, and the δ13C value of the surface layer is closely related to the δ13C value of the litter [23]. Altogether, these results show that litter decomposition significantly changes the δ13C and δ15N profile distribution characteristics in soil.

4.6. The Fractions of Litter-Derived Carbon and Nitrogen in Soil

The fractions of litter-derived C and N gradually decreased as the soil layers deepened (Figure 6). This indicates that litter-derived C and N accumulate mainly in topsoil (C: 17.35%, N: 7.89%), and part of the C and N remain in the soil as microbial by-products [7]. Changes in aboveground litter inputs can cause significant changes in the SOC pool in the upper soil layer [66], so litter-derived C and N accumulate mainly in the top mineral soil, progressively increasing the topsoil’s 13C and 15N signatures [1]. Studies have shown that the fraction of litter-derived C accounts for 5% (after 200 days [7]) and 8% (after one year [74]) of all soil C; however, the fraction of litter-derived N is 16–23% after 2.25 years of decomposition [4], and it can even reach about 90% at the soil surface [68]. Rubino et al. [75] found that litter-derived C in soil accounted for 13.3% of the total C loss, so C input was directly proportional to the total C loss from the litter (r = 0.780, p < 0.01). Therefore, they posited that a fixed proportion of C in the total C lost by litter decomposition entered the SOM, but there was no such correlation in our study. In addition, we found that soil particles wrapped in the humified leaf litter formed on the soil surface (Figure A3). This might also account for the high proportions of litter-derived C and N in the surface soil. Zeller and Dambrine [76] found that 15N released from decaying litter was recovered mainly in the coarse particulate organic matter fraction (>200 μm). Future measurements should clarify the proportion of litter-derived C incorporated into a range of SOM fractions, thus forming a more holistic understanding of the litter–soil biogeochemical continuum [7].
Although the mass loss of the PT leaf litter in this study was significantly higher than that of the RP leaf litter, the fractions of litter-derived N from the RP leaf litter were higher than those from PT leaf litter, indicating that leguminous leaf litter contributed more to soil N than non-leguminous litter did. This might be because the difference in mass loss between the two was only 7%, which was reduced when RP, with its high N content, entered the soil. This reflects RP’s advantage of having a higher proportion of N in the leaf litter. After investigating 130 cases, Berg [77] found that the higher the N concentration of fresh litter (and the lower the C:N ratio), the more organic matter left the decomposing litter to become SOM. Litter with a higher N content tends to contain more labile complexes (e.g., phenolic acids and flavonoids) that are usually easily accessed by decomposers [78]. Therefore, due to their higher N content, leguminous leaf litters can boost soil N content faster than other plants [79].
We found that different precipitation gradients significantly affected the percentages of soil C and N from the litter sources (p < 0.05). For instance, after litter C entered the surface soil (0–2 cm layer), the 600 mm precipitation treatment was most beneficial for C’s transformation to SOC. In addition, drought conditions promoted the transformation of legume litter N to soil total nitrogen (TN), but inhibited the transformation of non-legume litter N.

4.7. Linear Carbon and Nitrogen Relationship

The concentrations of C and N in the litter and soil, and the fractions of litter-derived C and N, had a positive correlation (Table 3). This does not support our first hypothesis that C and N would eventually decouple as decomposition progressed. Marichal et al. [80] also reported that soil and litter C and N were highly coupled in tropical forest plantations, and Fan et al. [81] reported that N and C released from Maize litter were coupled in the first year. These findings suggest that microbes preferentially decompose litter C and N simultaneously when the labile organic compounds are composed of both C and N during the early decomposition stage [82]. Compared to the control soil, the litter-treated soils experienced significantly reduced soil N intensity in response to C change, and that might, in turn, alter SOC dynamics by changing plant litter inputs and decomposition rates [66]. Our results also showed that the slopes of the linear relationships between C and N contents were highest under the highest precipitation treatment (Table 3). This shows that the response of N to C change becomes stronger as precipitation increases. The study of linear C and N relationship during litter decomposition provides an important basis for the modeling and prediction of the material cycles of ecosystems [83].

5. Conclusions

Using dual-isotope tracing and in situ controlled, experimental methods, we investigated how the C and N fluxes during both leguminous and non-leguminous leaf litter decomposition responded to changes in precipitation. The results show that the dual-isotope tracing method can be used to study both C and N fluxes and how C and N pathways diverge during litter decomposition. While the δ15N value of the leguminous leaf litter increased gradually, that of the non-leguminous leaf litter decreased. In the surface soil, the overall fraction of litter-derived N from the leguminous leaf litter was higher than that of the non-leguminous leaf litter, and the fraction of litter-derived C was greater than that of N. Furthermore, after litter C entered the soil, the 600 mm precipitation treatment best benefited C’s transformation to SOC. Additionally, drought conditions promoted the transformation of legume litter N to soil TN, but inhibited the transformation of non-legume litter N. The C and N concentrations of both litters and soils always has a positive correlation during decomposition, and their entering the soil did not change that relationship. Additionally, the N responses to C changes in the soil were reduced by the litter cover. However, increased precipitation enhanced the positive relationship between C and N in the litters. These results have implications for how C and N fluxes respond to precipitation changes, thus providing new insights for further research on litter decomposition and its ecological significance under various global climate change scenarios.

Author Contributions

N.D.: conceptualization, data curation, formal analysis, investigation, validation, visualization, and writing—original draft. K.Z.: formal analysis, investigation, validation. J.Z.: formal analysis, investigation, and visualization. L.Q.: funding acquisition, methodology, project administration, resources, supervision, and writing—review and editing. Y.Z.: investigation and visualization. X.W.: project administration, resources, and supervision. X.Z.: project administration, resources, and supervision. All authors have read and agreed to the published version of the manuscript.

Funding

This study was supported by the National Natural Science Foundation of China (Nos. 41471244 and 41977105), and the Strategic Priority Research Program of the Chinese Academy of Sciences (No. XDA23070202).

Data Availability Statement

The data are contained within the article.

Acknowledgments

We acknowledge the Northwest A&F University and the University of Chinese Academy of Sciences for providing the experimental facilities and other materials necessary for this study.

Conflicts of Interest

The authors declare no conflict of interest.

Appendix A

Figure A1. Experimental setups and PVC decomposition tubes used in this study. (a) A technician embeds probes that use time-domain reflectometry to measure soil moisture and temperature. (c) Screened, native soil beds under shade and with sunken experimental tubes. (b,d) Sunken tubes containing (b) uncovered leaf litter and (d) leaf litter covered by nylon netting.
Agronomy 13 01205 g0a1
Figure A2. Sample sprinkler head used in the artificially simulated rainfall system in this study. Each sprinkler’s diameter is 1.4 mm and each rotates 360° with an injection diameter of 1.1 m. This setup allows uniform watering over all experimental tubes.
Agronomy 13 01205 g0a2
Figure A3. Experimental settlements and decomposition container used in this study.
Agronomy 13 01205 g0a3

References

  1. Bimüller, C.; Naumann, P.S.; Buegger, F.; Dannenmann, M.; Zeller, B.; von Lützow, M.; Kögel-Knabner, I. Rapid transfer of 15N from labeled beech leaf litter to functional soil organic matter fractions in a Rendzic Leptosol. Soil Biol. Biochem. 2013, 58, 323–331. [Google Scholar] [CrossRef]
  2. Cleveland, C.C.; Reed, S.C.; Keller, A.B.; Nemergut, D.R.; O’Neill, S.P.; Ostertag, R.; Vitousek, P.M. Litter quality versus soil microbial community controls over decomposition: A quantitative analysis. Oecologia 2014, 174, 283–294. [Google Scholar] [CrossRef]
  3. Qiu, L.; Wei, X.; Ma, T.; Wei, Y.; Horton, R.; Zhang, X.; Cheng, J. Effects of land-use change on soil organic carbon and nitrogen in density fractions and soil δ13C and δ15N in semiarid grasslands. Plant Soil 2015, 390, 419–430. [Google Scholar] [CrossRef]
  4. Pei, G.; Liu, J.; Peng, B.; Gao, D.; Wang, C.; Dai, W.; Jiang, P.; Bai, E. Nitrogen, lignin, C/N as important regulators of gross nitrogen release and immobilization during litter decomposition in a temperate forest ecosystem. For. Ecol. Manag. 2019, 440, 61–69. [Google Scholar] [CrossRef]
  5. Glaser, B.; Benesch, M.; Dippold, M.; Zech, W. In situ 15N and 13C labelling of indigenous and plantation tree species in a tropical mountain forest (Munessa, Ethiopia) for subsequent litter and soil organic matter turnover studies. Org. Geochem. 2012, 42, 1461–1469. [Google Scholar] [CrossRef]
  6. Gautam, M.K.; Lee, K.-S.; Song, B.-Y.; Lee, D.; Bong, Y.-S. Early-stage changes in natural 13C and 15N abundance and nutrient dynamics during different litter decomposition. J. Plant Res. 2016, 129, 463–476. [Google Scholar] [CrossRef]
  7. Rubino, M.; Dungait, J.; Evershed, R.; Bertolini, T.; De Angelis, P.; D’Onofrio, A.; Lagomarsino, A.; Lubritto, C.; Merola, A.; Terrasi, F. Carbon input belowground is the major C flux contributing to leaf litter mass loss: Evidences from a 13C labelled-leaf litter experiment. Soil Biol. Biochem. 2010, 42, 1009–1016. [Google Scholar] [CrossRef]
  8. Flessa, H.; Ludwig, B.; Heil, B.; Merbach, W. The origin of soil organic C, dissolved organic C and respiration in a long-term maize experiment in Halle, Germany, determined by 13C natural abundance. J. Plant Nutr. Soil Sci. 2000, 163, 157–163. [Google Scholar] [CrossRef]
  9. Berg, B.; McClaugherty, C. Plant Litter: Decomposition, Humus Formation, Carbon Sequestration; Springer: Berlin/Heidelberg, Germany, 2008. [Google Scholar]
  10. Bai, X.; Huang, Y.; Wang, B.; Kuzyakov, Y.; An, S. Belowground allocation and fate of tree assimilates in plant–soil–microorganisms system: 13C labeling and tracing under field conditions. Geoderma 2021, 404, 115296. [Google Scholar] [CrossRef]
  11. Gong, C.; Tan, Q.; Liu, G.; Xu, M. Mixed-species plantations enhance soil carbon stocks on the loess plateau of China. Plant Soil 2021, 464, 13–28. [Google Scholar] [CrossRef]
  12. Rice, S.K.; Westerman, B.; Federici, R. Impacts of the exotic, nitrogen-fixing black locust (Robinia pseudoacacia) on nitrogen-cycling in a pine–oak ecosystem. Plant Ecol. 2004, 174, 97–107. [Google Scholar] [CrossRef]
  13. Wang, B.; Liu, G.; Xue, S. Effect of black locust (Robinia pseudoacacia) on soil chemical and microbiological properties in the eroded hilly area of China’s Loess Plateau. Environ. Earth Sci. 2012, 65, 597–607. [Google Scholar] [CrossRef]
  14. Ma, L.; Teng, Y.; Shangguan, Z. Ecohydrological responses to secondary natural Populus davidiana and plantation Pinus tabulaeformis woodlands on the Loess Plateau of China. Ecohydrology 2014, 7, 612–621. [Google Scholar] [CrossRef]
  15. Xia, L.; Song, X.; Fu, N.; Cui, S.; Li, L.; Li, H.; Li, Y. Effects of forest litter cover on hydrological response of hillslopes in the Loess Plateau of China. Catena 2019, 181, 104076. [Google Scholar] [CrossRef]
  16. Cornwell, W.K.; Cornelissen, J.H.; Amatangelo, K.; Dorrepaal, E.; Eviner, V.T.; Godoy, O.; Hobbie, S.E.; Hoorens, B.; Kurokawa, H.; Pérez-Harguindeguy, N. Plant species traits are the predominant control on litter decomposition rates within biomes worldwide. Ecol. Lett. 2008, 11, 1065–1071. [Google Scholar] [CrossRef]
  17. Tateno, R.; Tokuchi, N.; Yamanaka, N.; Du, S.; Otsuki, K.; Shimamura, T.; Xue, Z.; Wang, S.; Hou, Q. Comparison of litterfall production and leaf litter decomposition between an exotic black locust plantation and an indigenous oak forest near Yan’an on the Loess Plateau, China. For. Ecol. Manag. 2007, 241, 84–90. [Google Scholar] [CrossRef]
  18. Zhang, X.; Liu, Z.; Zhu, B.; Bing, Y.; Luc, N.T.; Du, L.; Zhu, Z. Impacts of mixed litter decomposition from Robinia pseudoacacia and other tree species on C loss and nutrient release in the Loess Plateau of China. J. For. Res. 2016, 27, 525–532. [Google Scholar] [CrossRef]
  19. Zhou, Z.; Zhang, Z.; Zha, T.; Luo, Z.; Zheng, J.; Sun, O.J. Predicting soil respiration using carbon stock in roots, litter and soil organic matter in forests of Loess Plateau in China. Soil Biol. Biochem. 2013, 57, 135–143. [Google Scholar] [CrossRef]
  20. Qian, L.; Liu, Z.; Du, L. Effects of mixed decomposition of Populus simonii and other tree species leaf litters on soil properties in Loess Plateau. Yingyong Shengtai Xuebao 2012, 23, 595–602. [Google Scholar] [CrossRef]
  21. Li, T.; Ren, B.; Wang, D.; Liu, G. Spatial variation in the storages and age-related dynamics of forest carbon sequestration in different climate zones—Evidence from black locust plantations on the Loess Plateau of China. PLoS ONE 2015, 10, e0121862. [Google Scholar] [CrossRef]
  22. Lu, N.; Liski, J.; Chang, R.; Akujärvi, A.; Wu, X.; Jin, T.; Wang, Y.; Fu, B. Soil organic carbon dynamics of black locust plantations in the middle Loess Plateau area of China. Biogeosciences 2013, 10, 7053–7063. [Google Scholar] [CrossRef]
  23. Liu, W.; Wang, Z. Nitrogen isotopic composition of plant-soil in the Loess Plateau and its responding to environmental change. Chin. Sci. Bull. 2009, 54, 272–279. [Google Scholar] [CrossRef]
  24. Santonja, M.; Milcu, A.; Fromin, N.; Rancon, A.; Shihan, A.; Fernandez, C.; Baldy, V.; Hättenschwiler, S. Temporal shifts in plant diversity effects on carbon and nitrogen dynamics during litter decomposition in a Mediterranean shrubland exposed to reduced precipitation. Ecosystems 2019, 22, 939–954. [Google Scholar] [CrossRef]
  25. Sanaullah, M.; Rumpel, C.; Charrier, X.; Chabbi, A. How does drought stress influence the decomposition of plant litter with contrasting quality in a grassland ecosystem? Plant Soil 2012, 352, 277–288. [Google Scholar] [CrossRef]
  26. Liu, E.; Wang, J.; Zhang, Y.; Angers, D.A.; Yan, C.; Oweis, T.; He, W.; Liu, Q.; Chen, B. Priming effect of C-13-labelled wheat straw in no-tillage soil under drying and wetting cycles in the Loess Plateau of China. Sci. Rep. 2015, 5, 13826. [Google Scholar] [CrossRef]
  27. Gray, C.M.; Fierer, N. Impacts of nitrogen fertilization on volatile organic compound emissions from decomposing plant litter. Glob. Change Biol. 2012, 18, 739–748. [Google Scholar] [CrossRef]
  28. Ma, J.-Y.; Sun, W.; Liu, X.-N.; Chen, F.-H. Variation in the stable carbon and nitrogen isotope composition of plants and soil along a precipitation gradient in northern China. PLoS ONE 2012, 7, e51894. [Google Scholar] [CrossRef]
  29. Salamanca, E.F.; Kaneko, N.; Katagiri, S. Rainfall manipulation effects on litter decomposition and the microbial biomass of the forest floor. Appl. Soil Ecol. 2003, 22, 271–281. [Google Scholar] [CrossRef]
  30. Paul, K.; Polglase, P.; O’connell, A.; Carlyle, J.; Smethurst, P.; Khanna, P. Defining the relation between soil water content and net nitrogen mineralization. Eur. J. Soil Sci. 2003, 54, 39–48. [Google Scholar] [CrossRef]
  31. Joly, F.X.; Kurupas, K.L.; Throop, H.L. Pulse frequency and soil-litter mixing alter the control of cumulative precipitation over litter decomposition. Ecology 2017, 98, 2255–2260. [Google Scholar] [CrossRef]
  32. Santonja, M.; Fernandez, C.; Gauquelin, T.; Baldy, V. Climate change effects on litter decomposition: Intensive drought leads to a strong decrease of litter mixture interactions. Plant Soil 2015, 393, 69–82. [Google Scholar] [CrossRef]
  33. Zhang, J.; Gao, M.; Wen, X.; Chen, Y.; Yang, S.; Li, L.; Liao, Y. Effects of different fertilizers on soil enzyme activities and CO2 emission in dry-land of maize. Acta Ecol. Sin. 2012, 32, 6147–6154. [Google Scholar] [CrossRef]
  34. FAO-UNESCO. Soil Map of the World, Revised Legend; World Soil Resources Report 60; FAO: Rome, Italy, 1988. [Google Scholar]
  35. Du, N.; Li, W.; Qiu, L.; Zhang, Y.; Wei, X.; Zhang, X. Mass loss and nutrient release during the decomposition of sixteen types of plant litter with contrasting quality under three precipitation regimes. Ecol. Evol. 2020, 10, 3367–3382. [Google Scholar] [CrossRef] [PubMed]
  36. Bernard, M.J.; Pitz, S.L.; Chang, C.-H.; Szlavecz, K. Continuous 13C and 15N labeling of tree litter using a climate-controlled chamber. Commun. Soil Sci. Plant Anal. 2015, 46, 2721–2733. [Google Scholar] [CrossRef]
  37. Olson, J.S. Energy storage and the balance of producers and decomposers in ecological systems. Ecology 1963, 44, 322–331. [Google Scholar] [CrossRef]
  38. Foster, D.R.; Aber, J.D. Forests in Time: The Environmental Consequences of 1000 Years of Change in New England; Yale University Press: New Haven, CT, USA, 2006. [Google Scholar]
  39. Arai, H.; Tokuchi, N. Factors contributing to greater soil organic carbon accumulation after afforestation in a Japanese coniferous plantation as determined by stable and radioactive isotopes. Geoderma 2010, 157, 243–251. [Google Scholar] [CrossRef]
  40. Xu, X.; Hirata, E. Decomposition patterns of leaf litter of seven common canopy species in a subtropical forest: N and P dynamics. Plant Soil 2005, 273, 279–289. [Google Scholar] [CrossRef]
  41. Lensing, J.R.; Wise, D.H. Impact of changes in rainfall amounts predicted by climate-change models on decomposition in a deciduous forest. Appl. Soil Ecol. 2007, 35, 523–534. [Google Scholar] [CrossRef]
  42. Zhou, S.; Huang, C.; Xiang, Y.; Tie, L.; Han, B.; Scheu, S. Effects of reduced precipitation on litter decomposition in an evergreen broad-leaved forest in western China. For. Ecol. Manag. 2018, 430, 219–227. [Google Scholar] [CrossRef]
  43. Austin, A.T.; Vitousek, P.M. Precipitation, decomposition and litter decomposability of Metrosideros polymorpha in native forests on Hawai’i. J. Ecol. 2000, 88, 129–138. [Google Scholar] [CrossRef]
  44. Garcia-Pausas, J.; Casals, P.; Romanya, J. Litter decomposition and faunal activity in Mediterranean forest soils: Effects of N content and the moss layer. Soil Biol. Biochem. 2004, 36, 989–997. [Google Scholar] [CrossRef]
  45. Osono, T.; Azuma, J.-i.; Hirose, D. Plant species effect on the decomposition and chemical changes of leaf litter in grassland and pine and oak forest soils. Plant Soil 2014, 376, 411–421. [Google Scholar] [CrossRef]
  46. Gurvich, D.E.; Easdale, T.A.; Pérez-Harguindeguy, N. Subtropical montane tree litter decomposition: Links with secondary forest types and species’ shade tolerance. Austral Ecol. 2003, 28, 666–673. [Google Scholar] [CrossRef]
  47. Drechsel, P.; Glaser, B.; Zech, W. Effect of four multipurpose tree species on soil amelioration during tree fallow in Central Togo. Agrofor. Syst. 1991, 16, 193–202. [Google Scholar] [CrossRef]
  48. Connin, S.; Feng, X.; Virginia, R. Isotopic discrimination during long-term decomposition in an arid land ecosystem. Soil Biol. Biochem. 2001, 33, 41–51. [Google Scholar] [CrossRef]
  49. Hart, S.C.; Nason, G.; Myrold, D.D.; Perry, D.A. Dynamics of gross nitrogen transformations in an old-growth forest: The carbon connection. Ecology 1994, 75, 880–891. [Google Scholar] [CrossRef]
  50. Parton, W.; Silver, W.L.; Burke, I.C.; Grassens, L.; Harmon, M.E.; Currie, W.S.; King, J.Y.; Adair, E.C.; Brandt, L.A.; Hart, S.C. Global-scale similarities in nitrogen release patterns during long-term decomposition. Science 2007, 315, 361–364. [Google Scholar] [CrossRef]
  51. Wei, X.; Li, X.; Jia, X.; Shao, M. Accumulation of soil organic carbon in aggregates after afforestation on abandoned farmland. Biol. Fertil. Soils 2013, 49, 637–646. [Google Scholar] [CrossRef]
  52. Fahey, T.J.; Yavitt, J.B.; Sherman, R.E.; Groffman, P.M.; Fisk, M.C.; Maerz, J.C. Transport of carbon and nitrogen between litter and soil organic matter in a northern hardwood forest. Ecosystems 2011, 14, 326–340. [Google Scholar] [CrossRef]
  53. Fernandez, I.; Mahieu, N.; Cadisch, G. Carbon isotopic fractionation during decomposition of plant materials of different quality. Glob. Biogeochem. Cycles 2003, 17, 1075. [Google Scholar] [CrossRef]
  54. Ngao, J.J.; Cotrufo, M.-F.M.-F. Carbon isotope discrimination during litter decomposition can be explained by selective use of substrate with differing δ13C. Biogeosci. Discuss. 2011, 8, 51–82. [Google Scholar] [CrossRef]
  55. Xu, S.; Liu, Y.; Cui, Y.; Pei, Z. Litter decomposition in a subtropical plantation in Qianyanzhou, China. J. For. Res. 2011, 16, 8–15. [Google Scholar] [CrossRef]
  56. Ono, K.; Hiradate, S.; Morita, S.; Ohse, K.; Hirai, K. Humification processes of needle litters on forest floors in Japanese cedar (Cryptomeria japonica) and Hinoki cypress (Chamaecyparis obtusa) plantations in Japan. Plant Soil 2011, 338, 171–181. [Google Scholar] [CrossRef]
  57. Hobbie, E.A.; Hobbie, J.E. Natural abundance of 15N in nitrogen-limited forests and tundra can estimate nitrogen cycling through mycorrhizal fungi: A review. Ecosystems 2008, 11, 815–830. [Google Scholar] [CrossRef]
  58. Bragazza, L.; Iacumin, P.; Siffi, C.; Gerdol, R. Seasonal variation in nitrogen isotopic composition of bog plant litter during 3 years of field decomposition. Biol. Fertil. Soils 2010, 46, 877–881. [Google Scholar] [CrossRef]
  59. Perakis, S.S.; Sinkhorn, E.R. Biogeochemistry of a temperate forest nitrogen gradient. Ecology 2011, 92, 1481–1491. [Google Scholar] [CrossRef]
  60. Dijkstra, P.; LaViolette, C.M.; Coyle, J.S.; Doucett, R.R.; Schwartz, E.; Hart, S.C.; Hungate, B.A. 15N enrichment as an integrator of the effects of C and N on microbial metabolism and ecosystem function. Ecol. Lett. 2008, 11, 389–397. [Google Scholar] [CrossRef]
  61. Murphy, B.P.; Bowman, D.M. The carbon and nitrogen isotope composition of Australian grasses in relation to climate. Funct. Ecol. 2009, 23, 1040–1049. [Google Scholar] [CrossRef]
  62. Handley, L.; Odee, D.; Scrimgeour, C. δ15N and δ13C patterns in savanna vegetation: Dependence on water availability and disturbance. Funct. Ecol. 1994, 8, 306–314. [Google Scholar] [CrossRef]
  63. Welker, J.M.; Jónsdóttir, I.S.; Fahnestock, J.T. Leaf isotopic (δ13C and δ15N) and nitrogen contents of Carex plants along the Eurasian Coastal Arctic: Results from the Northeast Passage expedition. Polar Biol. 2003, 27, 29–37. [Google Scholar] [CrossRef]
  64. Schmidt, M.W.; Torn, M.S.; Abiven, S.; Dittmar, T.; Guggenberger, G.; Janssens, I.A.; Kleber, M.; Kögel-Knabner, I.; Lehmann, J.; Manning, D.A. Persistence of soil organic matter as an ecosystem property. Nature 2011, 478, 49–56. [Google Scholar] [CrossRef] [PubMed]
  65. Cheng, X.; Luo, Y.; Xu, X.; Sherry, R.; Zhang, Q. Soil organic matter dynamics in a North America tallgrass prairie after 9 yr of experimental warming. Biogeosciences 2011, 8, 1487–1498. [Google Scholar] [CrossRef]
  66. Cao, J.; He, X.; Chen, Y.; Chen, Y.; Zhang, Y.; Yu, S.; Zhou, L.; Liu, Z.; Zhang, C.; Fu, S. Leaf litter contributes more to soil organic carbon than fine roots in two 10-year-old subtropical plantations. Sci. Total Environ. 2020, 704, 135341. [Google Scholar] [CrossRef] [PubMed]
  67. Garten, C.T., Jr.; Cooper, L.W.; Post, W., III; Hanson, P.J. Climate controls on forest soil C isotope ratios in the southern Appalachian Mountains. Ecology 2000, 81, 1108–1119. [Google Scholar] [CrossRef]
  68. Hatton, P.-J.; Kleber, M.; Zeller, B.; Moni, C.; Plante, A.F.; Townsend, K.; Gelhaye, L.; Lajtha, K.; Derrien, D. Transfer of litter-derived N to soil mineral–organic associations: Evidence from decadal 15N tracer experiments. Org. Geochem. 2012, 42, 1489–1501. [Google Scholar] [CrossRef]
  69. Bowden, R.D.; Deem, L.; Plante, A.F.; Peltre, C.; Nadelhoffer, K.; Lajtha, K. Litter input controls on soil carbon in a temperate deciduous forest. Soil Sci. Soc. Am. J. 2014, 78, S66–S75. [Google Scholar] [CrossRef]
  70. Lajtha, K.; Bowden, R.D.; Nadelhoffer, K. Litter and root manipulations provide insights into soil organic matter dynamics and stability. Soil Sci. Soc. Am. J. 2014, 78, S261–S269. [Google Scholar] [CrossRef]
  71. Xu, S.; Liu, L.; Sayer, E.J. Variability of above-ground litter inputs alters soil physicochemical and biological processes: A meta-analysis of litterfall-manipulation experiments. Biogeosciences 2013, 10, 7423–7433. [Google Scholar] [CrossRef]
  72. Tuo, D.; Gao, G.; Chang, R.; Li, Z.; Ma, Y.; Wang, S.; Wang, C.; Fu, B. Effects of revegetation and precipitation gradient on soil carbon and nitrogen variations in deep profiles on the Loess Plateau of China. Sci. Total Environ. 2018, 626, 399–411. [Google Scholar] [CrossRef]
  73. Díaz-Raviña, M.; Bueno, J.; González-Prieto, S.J.; Carballas, T. Cultivation effects on biochemical properties, C storage and 15N natural abundance in the 0–5 cm layer of an acidic soil from temperate humid zone. Soil Tillage Res. 2005, 84, 216–221. [Google Scholar] [CrossRef]
  74. Hagedorn, F.; Kammer, A.; Schmidt, M.W.; Goodale, C.L. Nitrogen addition alters mineralization dynamics of 13C-depleted leaf and twig litter and reduces leaching of older DOC from mineral soil. Glob. Chang. Biol. 2012, 18, 1412–1427. [Google Scholar] [CrossRef]
  75. Rubino, M.; Lubritto, C.; D’Onofrio, A.; Terrasi, F.; Gleixner, G.; Cotrufo, M. An isotopic method for testing the influence of leaf litter quality on carbon fluxes during decomposition. Oecologia 2007, 154, 155–166. [Google Scholar] [CrossRef] [PubMed]
  76. Zeller, B.; Dambrine, E. Coarse particulate organic matter is the primary source of mineral N in the topsoil of three beech forests. Soil Biol. Biochem. 2011, 43, 542–550. [Google Scholar] [CrossRef]
  77. Berg, B. Litter decomposition and organic matter turnover in northern forest soils. For. Ecol. Manag. 2000, 133, 13–22. [Google Scholar] [CrossRef]
  78. García-Palacios, P.; Prieto, I.; Ourcival, J.-M.; Hättenschwiler, S. Disentangling the litter quality and soil microbial contribution to leaf and fine root litter decomposition responses to reduced rainfall. Ecosystems 2016, 19, 490–503. [Google Scholar] [CrossRef]
  79. Horodecki, P.; Jagodziński, A.M. Tree species effects on litter decomposition in pure stands on afforested post-mining sites. For. Ecol. Manag. 2017, 406, 1–11. [Google Scholar] [CrossRef]
  80. Marichal, R.; Mathieu, J.; Couteaux, M.-M.; Mora, P.; Roy, J.; Lavelle, P. Earthworm and microbe response to litter and soils of tropical forest plantations with contrasting C:N:P stoichiometric ratios. Soil Biol. Biochem. 2011, 43, 1528–1535. [Google Scholar] [CrossRef]
  81. Fan, F.; Yin, C.; Tang, Y.; Li, Z.; Song, A.; Wakelin, S.A.; Zou, J.; Liang, Y. Probing potential microbial coupling of carbon and nitrogen cycling during decomposition of maize residue by 13C-DNA-SIP. Soil Biol. Biochem. 2014, 70, 12–21. [Google Scholar] [CrossRef]
  82. Prescott, C.E. Litter decomposition: What controls it and how can we alter it to sequester more carbon in forest soils? Biogeochemistry 2010, 101, 133–149. [Google Scholar] [CrossRef]
  83. Zhang, K.; Cheng, X.; Dang, H.; Ye, C.; Zhang, Y.; Zhang, Q. Linking litter production, quality and decomposition to vegetation succession following agricultural abandonment. Soil Biol. Biochem. 2013, 57, 803–813. [Google Scholar] [CrossRef]
Figure 1. Leaf litter mass loss and annual decay rate constants (k value mean, SE) for the 400, 600, and 800 mm precipitation treatments during decomposition (time) of Robinia pseudoacacia (legume) and Populus tomentosa (non-legume). The data are represented as means (SD), and the means with different letters are significantly different at p < 0.05.
Agronomy 13 01205 g001
Figure 2. Leaf litter δ13C and δ15N values for the 400, 600, and 800 mm precipitation treatments during decomposition (time) of Robinia pseudoacacia (legume) and Populus tomentosa (non-legume).
Agronomy 13 01205 g002
Figure 3. Soil temperature and moisture in the 400, 600, and 800 mm precipitation treatments during decomposition (Date).
Agronomy 13 01205 g003
Figure 4. Soil C and N contents for the 400, 600, and 800 mm precipitation treatments during decomposition (time) of Robinia pseudoacacia (legume) and Populus tomentosa (non-legume) leaf litters. The control has no litter. The data are represented as means (SD).
Agronomy 13 01205 g004
Figure 5. Soil δ13C and δ15N values for the 400, 600, and 800 mm precipitation treatments during decomposition (time) of Robinia pseudoacacia (legume) and Populus tomentosa (non-legume) leaf litters. The control has no litter. The data are represented as means (SD).
Agronomy 13 01205 g005
Figure 6. The fractions (%) of litter-derived C and N in various soil layers (0–2, 2–5, 5–10, and 10–15 cm depths) under the 3 precipitation regimes (mm) after 16 months of Robinia pseudoacacia (legume) and Populus tomentosa (non-legume) leaf litter decomposition. The data are represented as means (SD).
Agronomy 13 01205 g006
Table 1. Scheduled rainfall of the different precipitation treatments (800 mm, 600 mm, 400 mm) in different months.
Months800 mm600 mm400 mm
Week 1Week 2Week 3Week 4Sub-SumWeek 1Week 2Week 3Week 4Sub-SumWeek 1Week 2Week 3Week 4Sub-Sum
November15.90.015.90.031.812.70.012.70.025.48.00.08.00.016.0
December6.40.06.40.012.84.80.04.80.09.63.20.03.20.06.4
January6.40.06.40.012.84.80.04.80.09.63.20.03.20.06.4
February9.60.09.60.019.28.00.08.00.016.04.80.04.80.09.6
March19.10.019.10.038.214.30.014.30.028.69.60.09.60.019.2
April38.20.038.20.076.428.70.028.70.057.419.10.019.10.038.2
May25.525.525.525.5102.019.119.119.119.176.412.712.712.712.750.8
June19.119.119.119.176.414.314.314.314.357.29.69.69.69.638.4
July38.238.238.238.2152.828.728.728.728.7114.819.119.119.119.176.4
August5.10.05.10.010.23.80.03.80.07.62.50.02.50.05.0
September41.441.441.441.4165.630.330.330.330.3121.220.720.720.720.782.8
October25.525.525.525.5102.019.119.119.119.176.412.712.712.712.750.8
Table 2. The remaining mass (RM, %) and annual decay rate constants (k, year−1) for the decomposition of Robinia pseudoacacia (leguminous) and Populus tomentosa (non-leguminous) leaf litters, and the carbon (C) and nitrogen (N) contents (g kg−1) as well as C:N ratio of both leaf litters at the beginning (Initial) and after 16 months of decomposition (Final), respectively.
R. pseudoacaciaP. tomentosa
Precipitation400 mm600 mm800 mm400 mm600 mm800 mm
RM72.73 a63.44 b60.00 b65.53 a50.76 b61.03 a
k0.37 a0.41 a0.45 a0.33 b0.56 a0.58 a
Initial C492.0 ± 3.0492.0 ± 3.0492.0 ± 3.0517.0 ± 2.0517.0 ± 2.0517.0 ± 2.0
Final C385.2 ± 8.0 a399.0 ± 10.0 a384.4 ± 8.0 a385.1 ± 5.0 a364.7 ± 3.0 a375.6 ± 6.0 a
Initial N44.2 ± 0.644.2 ± 0.644.2 ± 0.636.6 ± 1.436.6 ± 1.436.6 ± 1.4
Final N37.6 ± 0.6 a37.6 ± 0.8 a35.9 ± 1.0 a23.7 ± 2.2 a25.4 ± 1.8 a29.6 ± 1.9 a
Initial C/N11.1 ± 0.611.1 ± 0.611.1 ± 0.614.14 ± 1.2814.14 ± 1.2814.14 ± 1.28
Final C/N10.2 ± 0.6 a10.6 ± 0.8 a10.7 ± 1.0 a16.2 ± 1.2 a14.4 ± 1.8 ab12.7 ± 1.2 b
Note: Means with different lowercase letters are significantly different (p < 0.05) among the 3 precipitation treatments for each variable.
Table 3. The correlation relationship between C and N (N = a × C + b) of the leaf litters under different precipitation regimes (400, 600, and 800 mm) and at different decomposition times (2, 4, 6, 8, 12, and 16 months).
rR2pRMSEab
Whole0.396 **0.149<0.0015.7750.0704.557
RPPTRPPTRPPTRPPTRPPTRPPT
Precipitation regimes
400 mm0.740 **0.0180.515–0.0710.0010.9481.7464.4980.0500.00217.17728.872
600 mm0.853 **0.3910.7100.096<0.0010.1211.6072.5850.0820.0304.12115.318
800 mm0.843 **0.3140.7110.046<0.0010.1901.7664.5390.0830.0503.9939.341
Decomposition times
2 months0.661–0.3900.3560.0310.0530.2991.8035.4940.137–0.129–22.23190.290
4 months0.3310.4160.0390.0350.4230.3061.4853.6880.0390.04924.0106.288
6 months0.2850.1860.0720.1260.4940.6591.3323.9380.0180.03732.43814.839
8 months0.4670.7040.1060.4110.2050.0511.5433.5610.0260.11928.009–20.271
12 months0.962 **0.1310.9090.1470.0010.7570.6633.1010.0730.0235.69618.576
16 months0.573–0.0950.245–0.1010.0830.7821.4203.9940.048–0.03018.14939.741
Abbreviations: r: correlation coefficient; RP: R. pseudoacacia; PT: p. tomentosa; **: significantly correlated at 0.01 level; RMSE: root mean square error.
Table 4. The correlation relationship between C and N (N = a × C + b) in the litter-treated soil in different layers (0–2, 2–5, 5–10, and 10–15 cm), precipitation regimes (400, 600, and 800 mm), and decomposition times (2, 4, 6, 8, 12, and 16 months) in this study.
rR2pRMSEab
Layers
0–2 cm0.604 **0.347<0.0010.0960.171–0.065
2–5 cm0.1880.0070.2720.1010.0900.239
5–10 cm0.502 **0.2300.0020.0890.170–0.047
10–15 cm0.557 **0.289<0.0010.0840.169–0.035
Precipitation regimes
400 mm0.614 **0.363<0.0010.0500.1020.182
600 mm0.586 **0.329<0.0010.1040.229–0.249
800 mm0.457 **0.1920.0010.1070.1450.048
Decomposition times
Control soil0.533 **0.2510.0070.1340.299–0.509
2 months0.882 **0.767<0.0010.0480.276–0.560
4 months0.731 **0.514<0.0010.0420.183–0.041
6 months0.723 **0.501<0.0010.0770.198–0.047
8 months0.675 **0.431<0.0010.0570.0950.243
12 months0.857 **0.723<0.0010.0200.1040.165
16 months0.753 **0.547<0.0010.0220.1070.147
Abbreviations: r: the correlation coefficient; **: significantly correlated at 0.01 level; RMSE: root mean square error.
Disclaimer/Publisher’s Note: The statements, opinions and data contained in all publications are solely those of the individual author(s) and contributor(s) and not of MDPI and/or the editor(s). MDPI and/or the editor(s) disclaim responsibility for any injury to people or property resulting from any ideas, methods, instructions or products referred to in the content.

