Article

Effect of Transplanting Date on Agronomic and Grain Quality Traits Using Early-Maturing Rice Varieties

Crop Research Department, Chungcheongnamdo Agricultural Research and Extension Services, Yesan 340861, Republic of Korea
*
Author to whom correspondence should be addressed.
Agronomy 2023, 13(5), 1195; https://doi.org/10.3390/agronomy13051195
Submission received: 1 March 2023 / Revised: 25 March 2023 / Accepted: 20 April 2023 / Published: 24 April 2023
(This article belongs to the Special Issue Crop Yield and Quality Response to Cultivation Practices - Series II)

Abstract

:
This study aimed to investigate how transplanting date affects the agronomic and grain quality traits of two early-maturing rice varieties. The experiment was conducted in the rice research field of Chungnam Agricultural Research and Extension Services in South Korea and rice materials were transplanted at intervals of approximately 15 days from 16 April to 16 July in 2019 and 2020. Results showed that agronomic and grain quality traits varied according to the transplanting date and earlier transplanting resulted in a longer period of days from transplanting to heading (DTH). The spikelet number m−2 was highly correlated with the milled rice yield (r = 0.963 ** for Jinbuol, r = 0.909 ** for Yeoreumi) and it significantly decreased as the transplanting date was delayed, which was leading to lower yield. The mean temperature during the grain filling stage had a negative correlation with head rice rate (r2 = 0.825 ** for Jinbuol, r2 = 0.803 ** for Yeoreumi) and the number of days from transplanting to heading showed negative correlation with protein content (r2 = 0.777 ** for Jinbuol, r2 = 0.833 ** for Yeoreumi). Therefore, increasing the number of days from transplanting to heading date can lead to higher milled rice yield and lower protein content and avoiding heading dates on 17 July can improve the appearance traits. As a result, it is suggested that early transplanting is advantageous to increase the milled rice yield and grain quality of early-maturing rice.

1. Introduction

Rice is one of the most important staple foods in the world, feeding more than half of the global population, and approximately 90% of the world’s rice is produced and consumed in Asia. Rice has been a staple food in Korea for thousands of years and has had a significant impact on the country’s economy and culture [1,2]. However, the cultivation area of rice continuously decreased from 1,306,789 hectares (1980) to 780,440 hectares (2021) because of industrialization [3]. As the standard of living has improved, rice consumption per person has decreased from 132.4 kg (1980) to 56.5 kg (2022) (Table S1) due to the increased availability and consumption of Western-style convenience foods and demand for high-quality rice has been increasing [4,5].
Rice grain quality is a complex characteristic that depends on multiple factors such as appearance, cooking qualities, and taste. Among these traits, consumers tend to pay more attention to appearance including head rice, chalky rice, and cracked rice [6]. Chalky rice is generally regarded as an undesirable characteristic because it is less sticky than head rice when cooked and has poor palatability. The reason for the increase in chalky rice is that high temperatures during the grain filling stage interferes with grain development and reduces carbohydrates [7,8,9,10]. In addition, high temperatures can also affect other physicochemical properties such as protein and amylose content [11,12]. Researchers have identified the relationship between physicochemical properties and the eating quality of rice, utilizing characteristics such as protein content, amylose content, glossiness, alkali digestion, and starch viscosity [13,14,15,16]. These properties are currently used as an indirect method of estimating the texture and overall eating quality of rice. Reducing methane emissions from rice cultivation is an important goal in response to climate change and growing early-maturing rice varieties is considered one strategy for reducing methane emissions from rice cultivation due to their short growing periods [17,18,19,20,21]. However, early-maturing rice varieties in Korea have been bred to grow in mid-mountain and mountainous regions due to their adaptability to cooler temperatures and shorter growing seasons in these regions. When these varieties are grown in plains areas, they tend to have decreased grain quality with an increase in chalkiness and cracking due to high temperatures during the grain filling stage, which can negatively affect the appearance and cooking and eating qualities of the rice [22,23,24]. The grain filling stage in rice varies relative to the heading date, which can be influenced by various factors such as rice variety, temperature, day length, and transplanting date. Several studies have reported that the transplanting date has a significant impact on the heading date of rice [25,26,27].
This study was conducted to investigate the variations in growth and grain quality according to the transplanting date using early-maturing rice varieties in plains areas and to use it as data for producing rice with a higher milled rice yield and better quality.

2. Materials and Methods

2.1. Experimental Site and Rice Varieties

This study was conducted in 2019 and 2020 at the rice research field of the Chungcheongnamdo Agricultural Research and Extension Services (CNARES), located in Yesan, Chungcheongnamdo, South Korea (36°44′ N, 126°49′ E). Soil analysis was performed before the test to determine the appropriate fertilizer based on the characteristics of the soil using the manuals of NIAST [28]. The organic matter content of the soil was 20.3 g kg−1, alkaline dissolved nitrogen was 147.2 mg kg−1, available SiO2 was 328 mg kg−1, available potassium was 0.31 cmol+ kg−1, and the pH was 6.2. For this study, Jinbuol and Yeoreumi, which are early-maturing rice varieties with different agronomic and grain quality traits, were used.

2.2. Meteorological Data

To investigate the meteorological conditions during the rice cultivation period in Yesan, South Korea, weather data spanning from 2011 to 2020 sourced from the official website of the Korea Meteorological Administration (https://www.weather.go.kr (accessed on 15 January 2023)) were utilized. Meteorological data from 2019 and 2020, corresponding to the rice growing season, were used to analyze the relationship between temperature and rice growth and grain quality.

2.3. Cultivation Methods

In order to prevent diseases transmitted by seeds, such as Bakanae disease, seeds were soaked in cold water at 15 °C for 2 days and then treated with a seed disinfectant consisting of Tebuconazole (12.5%) + Prochloraz copper chloride (12.5%) [29]. Disinfected seeds were sown in a nursery box, grown in a greenhouse for 3 weeks after sowing, and then transplanted manually seven times at 15-day intervals from 16 April to 16 July. A total of 4–5 seedlings were planted per hill, with a spacing of 12 cm between plants and 30 cm between rows. A split plot design with three replications was employed with the transplanting date as the main plot and cultivars as the subplots. The size of each plot was 13.5 m2 (5 m long, 2.7 m wide, and 9 rows with 30-cm row spacing). After transplanting, the field was flooded immediately and maintained at a depth of 3–5 cm until 30 days after heading and then dried for harvest. The harvest was conducted when an accumulated temperature reached 1000 °C after heading. Chemical pesticides to control pests and diseases were applied only once, immediately after transplanting. Fertilizer (N-P2O5-K2O) was used at the level of 90–45–57 kg/ha, which is used to produce high-quality rice in Korea [30], and applied as a basal fertilizer in accordance with agricultural technology information [31]. The amount of nitrogen fertilizer was calculated by applying the soil test results using the following method [30]:
[90 kg/ha: N (kg/ha) = 91.4 − 1.09 × OM (organic matter) + 0.20 × SiO2]

2.4. Trait Evaluation

2.4.1. Agronomic Traits

Days to heading (DTH) were evaluated as the number of days from transplanting until 50% of the panicles were heading. For panicle length (PL) and panicle number per hill (PNH), 10 randomly selected plants from each plot were investigated at maturity; panicle length was measured in centimeters from panicle neck to panicle tip and panicle number was calculated as the panicle number hill−1 (PNM) and panicle number m−2 (PNM). For spikelet number per panicle−1 (SNP) and ripened grain rate (RGR), 3 randomly selected plants from each plot were harvested at maturity and plants were manually threshed to separate the grains from the straw. Spikelet (filled and unfilled grains) numbers per panicle−1 were manually counted as the spikelet number panicle−1. The threshed grain samples were air-dried and then submerged in water to separate the filled and unfilled spikelets and then the ripened grain rate was estimated; the number of filled grains per panicle−1 was divided by the total number of spikelets (filled and unfilled grains) per panicle−1. For milled rice yield (MRY), 50 plants from each plot were harvested when the accumulated mean temperature reached 1000 °C after heading. After harvesting, rice grains were threshed, air-dried, and weighed. Additionally, 500 g of rough rice was de-hulled and then each brown rice sample was milled to 92% milling yield by a milling machine (MC-90A, Toyo) and then the milled samples were stored in a refrigerator (15 °C) to prevent changes in quality. We determined 1000-grain weight (TGW) by measuring the weight of 1000 randomly-selected brown rice grains; it was performed in triplicate and the values were averaged. Milled rice yield and 1000-grain weight were corrected for the 15% grain moisture content. Head rice yield (HRY) was estimated using the following equation: HRY = [MRY × HR].

2.4.2. Grain Quality Traits

Head rice rate (HR, unbroken and broken translucent grains with at least 3/4 of a whole grain), chalky rice rate (CR, grains with an opaque and chalky appearance covering at least half of the body of the grain), and broken rice (BR) and defective rice (DR) were calculated with a grain inspector (Cervitec, Foss) using a sample of approximately 1000 grains. The protein content (PC) of milled rice was measured with a grain analyzer (Infratec 1241, Foss), using 100 g milled rice samples.

2.5. Statistical Analysis

Statistical analyses, including t-tests, analysis of variance (ANOVA), correlation analysis, and regression analysis were performed using SPSS software (Ver. 20.0.0). The data of phenotypic and grain quality traits from two years were compared using Duncan’s multiple range test. Microsoft Excel 2019 was used to organize the data and to generate tables and figures.

3. Results

3.1. Meteorological Conditions during Rice Cultivation Period

Meteorological data during the rice cultivation period was collected, and the minimum, maximum, and average temperature data for the recent 10 years (2011–2020) are shown in Figure 1. The diurnal temperature range (maximum temperature—minimum temperature) showed a similar level from early April to mid-June, decreased slightly until early August, and then gradually increased. The mean temperature remained above 15 °C from early May, and then dropped below 15 °C after mid-October. Additionally, the minimum temperature reached 15 °C or higher in mid-June.
Characteristics related to the heading date relative to the transplanting date were investigated and then summarized in Table 1. Two varieties showed a significant difference in heading date and, compared to Yeoreumi, the heading date of Jinbuol was 11 days earlier and the harvesting date was 14 days earlier. As the transplanting date was delayed, the heading date tended to be continuously delayed in both varieties. The accumulated temperature from transplanting to heading date showed a tendency to continuously decrease in both varieties as the transplanting date was delayed. The highest accumulated temperatures of Jinbuol and Yeorumi were observed at 1358 °C and 1588 °C when transplanted on 16 April, respectively, and the lowest were 851 °C and 1110 °C on 16 July, respectively. The heading date of Jinbuol transplanted on 1 June and Yeoreumi on 16 May was the same as 17 July and the mean temperature during the grain filling stage was the highest at 25.3 °C.

3.2. Growing Period according to the Transplanting Date

As the transplanting date was delayed, the number of days from transplanting to harvesting continued to decrease (Figure 2). On 16 July, the DTH of Jinbuol and Yeoreumi showed the shortest period of 34 days and 44 days, respectively. DHH tended to increase as the transplanting date was delayed, DTG was 84–121 days for Jinbuol and 102–130 days for Yeoreumi. The DTG of the two varieties showed a similar trend relative to the transplanting date, showing continuous decrease from 16 April to 1 July, then increasing on 16 July.
Correlation analysis was conducted to find out the relationship between the number of days from transplantation to heading and the mean temperature from transplanting to heading and it showed a highly significant correlation in both varieties. In addition, linear regression analysis was conducted to predict the number of days from transplanting to heading using the mean temperature from transplanting to heading as an explanatory variable and it is summarized in Figure 3. The results of the regression showed that the number of days from transplanting to heading can be estimated efficiently using the mean temperature from transplanting to heading. In addition, the regression equation showed that a 1 °C increase in mean temperature would result in a reduction of 5.4 days for Jinbuol and 5.5 days for Yeoreumi in the number of days from transplanting to heading.

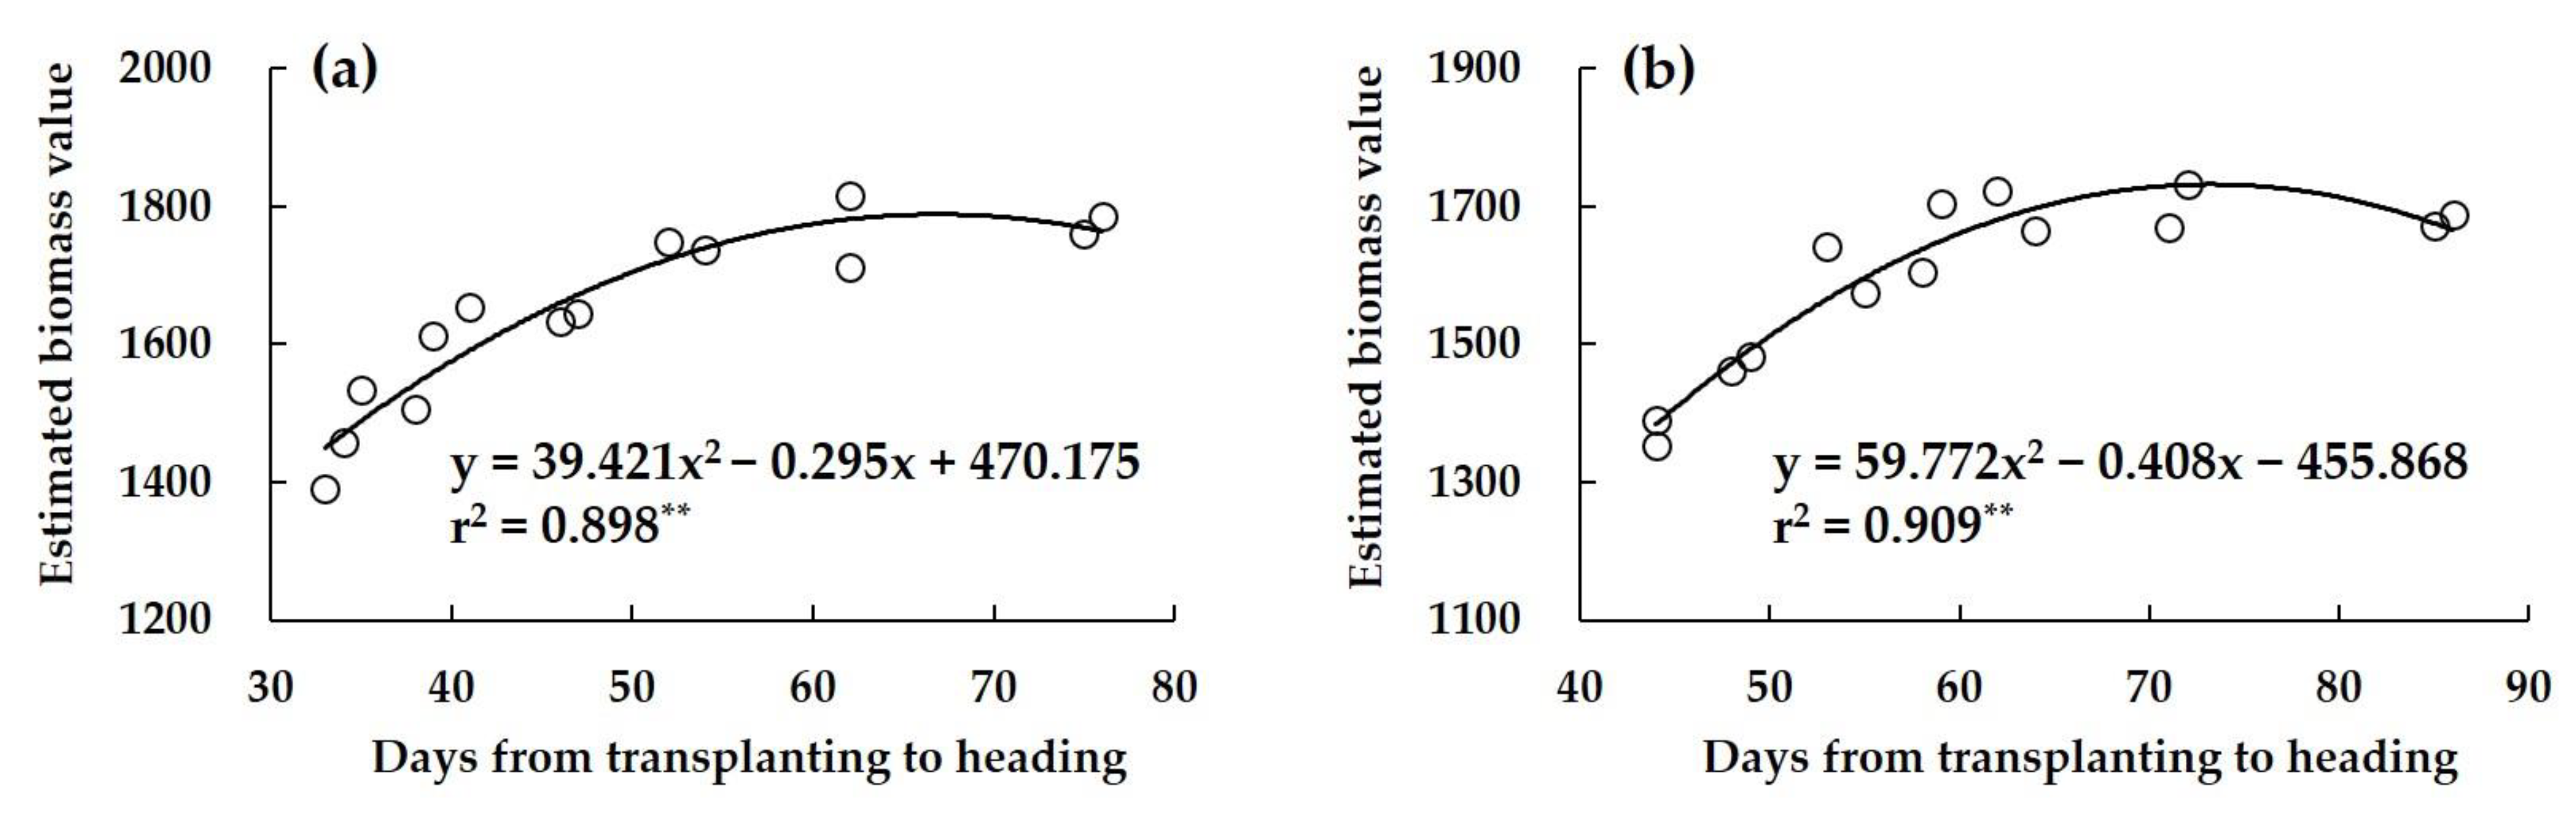
3.3. Agronomic Traits according to the Transplanting Date

Culm- and panicle-related traits relative to the transplanting date were investigated and then summarized in Table 2. Two varieties showed significant differences in culm- and panicle-related traits and, compared to Jinbuolbyeo, the culm length of Yeoreumi was 11.0 cm longer, the panicle length was 1.5 cm longer, and the panicle number hill−1 was 3.4 lower. Relative to the transplanting date, there were statistical differences in culm and panicle-related traits in both varieties. As the transplanting date was delayed, culm length did not show a significant difference until 16 June, after which it gradually decreased. On 16 July, Jinbuol and Yeorumi showed the lowest values at 56.7 cm and 67.5 cm, respectively. Panicle length exhibited a similar trend to culm length and also showed the lowest values on 16 July. For panicle number m−2, Jinbuol exhibited the highest number at 522 m−2 on 16 April and the lowest number at 470 m−2 on 16 July. Similarly, Yeoreumi had the highest number at 423 m−2 on 16 April and the lowest number at 374 m−2 on 16 July.
Data on grain-related traits relative to the transplanting date are summarized in Table 3. Compared to Jinbuol, Yeoreumi showed higher spikelet number panicle–1 and spikelet number m–2 by 32.1 and 10,002, respectively, and ripened grain was 2.3% higher, while 1000-grain weight was 4.3 lighter. Grain-related traits showed a statistical difference relative to the transplanting date. As the transplanting date was delayed, spikelet number panicle–1 and spikelet number m–2 decreased in both varieties. The highest spikelet number m–2 was 24,069 on 16 April for Jinbuol and 32,738 on 1 May for Yeoreumi. There was no difference in ripened grain rate relative to the transplanting date.
The milled and head rice yields of the two rice varieties relative to the transplanting date are presented in Figure 4. Both varieties exhibited a tendency for milled rice yield to continuously decrease as the transplanting date was delayed, with significant reductions observed from 1 July. The highest milled rice yields were obtained on 1 May, with 498 kg/10a for Jinbuol and 534 kg/10a for Yeoreumi. The lowest yields were 352 kg/10a and 426 kg/10a for Jinbuol and Yeoreumi, respectively, on 16 July. Furthermore, head rice yield exhibited a similar trend to milled rice yield, with continuous decreases as the transplanting date was delayed. The highest head rice yields for both varieties were observed on 16 April and 1 May and no significant differences in yield were observed between 16 May and 1 July. The lowest head rice yields were observed on 16 July in both varieties. Although Yeoreumi’s milled rice yield was lower when transplanted on 16 June than on 1 June, its head rice yield remained similar.
Correlation analysis was conducted to investigate the relationship between agronomic traits and the results showed that most of the traits were significantly correlated with each other, as shown in Table 4. DTH was found to be positively correlated with CL, PL, PN, SNP, SNM, and MRY, but negatively correlated with RGR in both varieties. Moreover, MRY was found to be positively correlated with all traits except RGR and significantly correlated with SNM (r = 0.963 ** for Jinbuol and 0.909 ** for Yeoreumi). In Yeoreumi, the highest positive correlation was observed between CL and SNM (r = 0.950 **) while the highest negative correlation was observed between SNP and RGR (r = −0.663 **). On the other hand, in Jinbuol, the highest positive correlation was observed between SNP and SNM (r = 0.972 **) while the highest negative correlation was observed between TGW and RGR (r = −0.802 **).

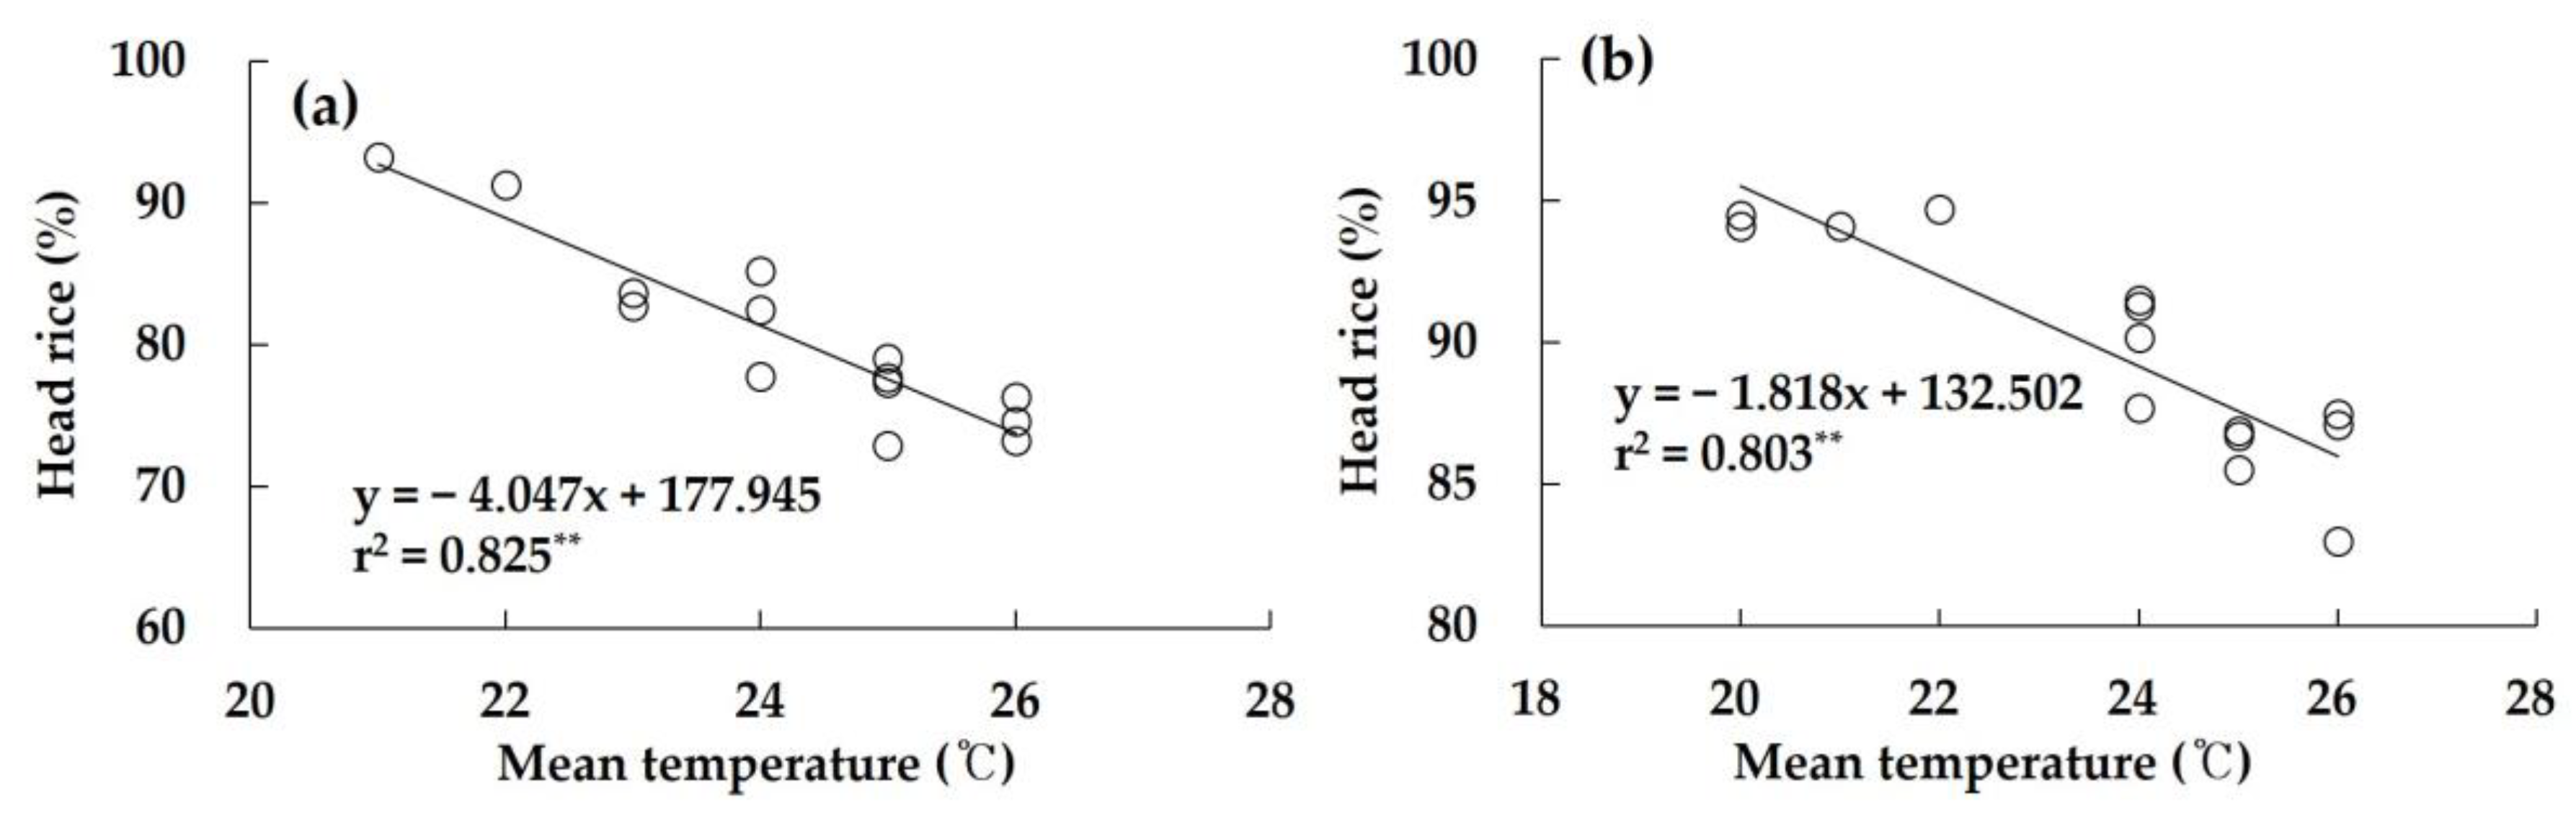
3.4. Grain Quality Traits and Mean Temperature

Grain quality traits of the two rice varieties relative to the transplanting date were summarized in Table 5. There were significant differences between Jinbuol and Yeoreumi in appearance and protein content. Compared to Jinbuol, Yeoreumi showed a 9.4% higher head rice rate and 0.5% lower protein content. The head rice rate for Jinbuol was the highest at 90.6% on July 16 and the lowest at 74.6% on 16 June. Those of Yeoreumi had their highest head rice ratio, at 95.3%, on 16 July and their lowest, at 84.9%, on 16 May. The protein content of the two varieties showed a tendency to continuously increase as the transplanting date was delayed and on 16 July, Jinbuol and Yeoreumi showed their highest values at 8.7% and 7.9%, respectively.
Correlation analysis was conducted to find out the relationship between the mean temperature during the ripening stage and the head rice rate (Figure 5). As a result, a highly significant correlation was shown in both varieties. In addition, linear regression analysis was conducted to predict the head rice rate using the mean temperature during the ripening stage as an explanatory variable. Regression equations in this study show that the head rice rate can be estimated efficiently using the mean temperature during ripening. If the mean temperature rises by 1 °C, the head rice rate dropped to 4.05% for Jinbuol and 1.82% for Yeoreumi, suggesting that head rice rate for Jinbuol was more sensitive to mean temperature.

3.5. Relationship between Protein Content and Growing Period

In order to identify the cause of the continuous increase in protein content of milled rice grains as the transplanting date was delayed, the rice growth period was divided into three periods (DTH: days from transplanting to heading, DHH: days from heading to harvest, and DTG: days of total growth period). Then correlation analysis between the three periods and protein content was performed and shown in Figure 6. It appears that there is a negative correlation between DTH and the protein content of the milled rice grains for both varieties. The correlation between protein and DTH is higher than DHH or DTG and indicates that as the DTH period becomes longer, the protein content decreases.

4. Discussion

4.1. Agronomic Traits and Productivity

As the transplanting date was delayed, the heading and harvesting dates were continuously delayed. Additionally, as the mean temperature from transplanting to heading increased by 1 °C, the number of days from transplanting to heading decreased by approximately 5 days in both rice varieties. This phenomenon can be attributed to the meteorological environment in Korea, where the average temperature continuously rises from April and gradually decreases from early August. Temperature is a critical factor in rice growth and development as high temperatures can accelerate growth and maturation while low temperatures can delay growth [33,34]. Therefore, early transplanting in this study showed a longer growth period due to the low temperature compared to late transplanting.
The productivity of rice is determined by yield components such as panicle number, spikelet number, ripened grain rate, and 1000-grain weight [32]. In this study, significant differences were observed in agricultural traits, including yield components, relative to the transplanting date and almost all traits showed significant correlations, indicating that they were interdependent and affected by environmental factors (Figure 5). In particular, the milled rice yield was highly correlated with the spikelet number m−2 (r2 = 0.963 ** for Jinbuol and r2 = 0.909 ** for Yeoreumi), which is the representative trait of sink size. Several studies showed that spikelet number m−2 largely explains the variation in yield and is considered an important factor [35,36,37]. However, the spikelet number has a certain critical point representing the maximum yield and beyond that the yield does not result in further increase [38] because the spikelet number per unit area and the ripened grain rate are complementary to each other [39]. The previous results support a negative correlation between the ripened grain rate and both milled rice yield and spikelet number in this study. Additionally, the spikelet number m−2 significantly decreased as the transplanting date was delayed and the panicle number m−2 also decreased since the number of days from transplanting to heading is shorter. This means that the decreased panicle number m−2 affected the spikelet number m−2 and could result in a lower yield. These findings suggest that early transplanting is advantageous in increasing the yield of early-maturing rice.

4.2. Rice Appearance Traits

Environmental factors, particularly mean temperature during the grain filling stage, can have a significant impact on the grain quality of rice. The grain filling stage is the period during which the rice grain is developing and filling with starch and the mean temperature during this stage can affect the physicochemical properties, starch structure, and appearance of rice grains [7,8,9,10,11,12]. In this study, there were significant differences in the head and chalky rice rates between the two rice varieties and these rates varied depending on the transplanting date since differences in the transplanting date can result in differences in temperature and sunlight exposure, which can affect the growth and development of rice plants [25,26,27] (Figure S1).
The head rice rate was different depending on the transplanting date, as environmental conditions such as temperature and sunlight exposure can vary depending on when the rice is transplanted [25,26,27]. Additionally, genetic differences between rice varieties can also play a role in determining head rice rate [40,41,42,43], so two rice varieties showed different head rice rates even though they had the same heading date of 17 July, shown by the 75.4% rate for Jinbuol transplanted on 1 June and 84.9% for Yeoreumi transplanted on 16 May. In order to identify the variation, correlation analysis was performed between mean temperature during the grain filling stage and appearance. There was a significant correlation between head rice rate and mean temperature during the grain filling stage, suggesting that temperature during this stage may have a significant impact on the final appearance and quality of the rice grains, including head rice rate (Figure 5). Higher temperatures during the grain filling stage may have a negative impact on head rice rate by increasing the likelihood of chalky areas developing in the rice grains. Conversely, lower temperatures may be more favorable for the development of intact, whole rice grains with high head rice rates [7,8,9,10,11,12].
In addition, the study found that it is possible to estimate the head rice rate based on mean temperature during the grain filling stage and showed that temperature is a key factor influencing head rice rate [8,9,10,11,12,13]. Therefore, it may be possible to increase head rice rate by controlling temperature during the grain filling stage. If the mean temperature rises by 1 °C, the head rice rate dropped to 4.05% for Jinbuol and 1.82% for Yeoreumi, suggesting that Jinbuol is more sensitive to mean temperature (Figure 5). According to Table 1, mean temperature during grain filling stage was the highest on 17 July and mean temperature during grain filling stage and the head rice rate are significantly correlated in this study. This means that if rice is headed on 17 July, the head rice rate might be lower compared to other dates, so changing the transplanting date to avoid high temperatures during the grain filling stage may be a potential strategy to improve rice appearance, including head rice rate.

4.3. Rice Protein Content

In general, protein content was negatively correlated with eating quality because rice with a higher protein content had lower adhesiveness, glossiness, taste, and stickiness when cooked than rice with a lower protein content [43,44,45,46]. The results of the study indicate that the protein content of rice can be significantly influenced by the transplanting date, even when the same level of fertilizer is applied. Specifically, the study found that as the transplanting date was delayed, the protein content of both Jinbuol and Yeoreumi varieties continued to increase. In particular, the highest protein content values were observed when the two varieties were transplanted on 16 July, with Jinbuol having a protein content of 8.7% and Yeoreumi having a protein content of 7.9%. This suggests that delaying the transplanting date may lead to a higher protein content in rice, at least for these two varieties.
In order to understand the relationship between the protein content and the three kinds of periods (DTH, DHH, and DTG), correlation analysis was performed and suggested that DTH has a stronger correlation with protein content than DHH and DTG. Specifically, the analysis showed that DTH had a higher correlation coefficient (r2 = 0.777 ** for Jinbuol, r2 = 0.833 ** for Yeoreumi) with protein content, indicating that as DTH increased, protein content tended to decrease (Figure 6).
Previous studies showed the same trends, indicating that protein content increased as the transplanting date was delayed [24,25,26,27] and early-maturing rice varieties showed higher protein content than mid-late-maturing rice varieties even when transplanted on the same date and with the same level of fertilizer applied [47], suggesting that rice with a higher protein content has a shorter vegetative period.
Nitrogen is a crucial nutrient for plant growth and development as it is a key component of many important biomolecules such as amino acids, nucleic acids, chlorophyll, enzymes, and hormones. Nitrogen is required for various plant processes including tillering and leaf area development, grain formation, grain filling, and protein synthesis, and is essential for protein synthesis in rice plants and applying nitrogen fertilizers can increase the protein content of rice grains. In order to identify the relationship between protein content and DTH, the EBV (estimated biomass value) was calculated by multiplying the panicle number and plant height (culm length + panicle length) since these two traits are determined before heading. Therefore, the EBV increases as the plant height and the panicle number increase and it can be expected that the higher the biomass value, the higher the EBV.
[Estimated biomass value (EBV) = Plant height × Panicle number]
There was a negative correlation between the estimated biomass value (EBV) and protein content (Figure 7). This suggests that when the days to heading (DTH) are shortened, the vegetative period is also reduced, resulting in less plant growth. When there is less growth due to shortened DTH, the amount of nitrogen remaining in the soil may be transferred to the rice grains, which can lead to higher protein content.
Previous studies have shown that the total amount of nitrogen absorbed throughout the rice growing period is a major factor influencing yield and that most nitrogen absorption is completed at heading [48,49,50]. There is a significant correlation between the amount of nitrogen uptake until heading and the spikelet number [51,52]. Additionally, there is a significant correlation between the amount of nitrogen uptake until heading and the number of spikelets, which can influence biomass and milled rice yield [53,54]. Thus, if the vegetative growth period is longer and the EBV is higher under the same nitrogen fertilizer conditions, the amount of nitrogen transferred to rice grains may be reduced, potentially leading to lower protein content and better-quality rice.

4.4. Transplanting Date Suitable for Early-maturing Rice Variety

As a result of this study, we recommend avoiding the heading of early-maturing rice varieties on 17 July, which is the period with the highest mean temperature during the grain filling stage in Chungnam Province, South Korea. This can help to improve the appearance of the rice. Furthermore, early transplanting is beneficial for increasing milled rice yield and improving taste and can increase the DTH (days from transplanting to heading) which is positively correlated with these traits. Therefore, we recommend transplanting early-maturing rice varieties in early May, as this can result in heading before 17 July and lead to higher yield and better grain quality.

5. Conclusions

In this study, the number of days from transplanting to heading has an impact on protein content and milled rice yield. Longer growth periods were found to result in lower protein content and increased yield. In addition, the mean temperature during the grain filling stage affects the appearance of rice including head rice and chalky rice because grain filling is the stage of rice development that determines the final yield and quality. Therefore, early-maturing rice varieties should be transplanted in Chungnam province in early May to improve the yield and grain quality, as the number of DTH was higher and the temperature during the grain filling stage was lower on the early transplanting date. This information will be useful for farmers and rice breeders who seek to improve the yield and the quality of their rice when using early-maturing rice varieties in response to climate change.

Supplementary Materials

The following supporting information can be downloaded at: https://www.mdpi.com/article/10.3390/agronomy13051195/s1, Table S1: Rice consumption per person in Korea (1980–2022). Data were obtained from the KOrean Statistical Information Service (KOSIS) (https://kosis.kr (accessed on 27 February 2023)); Figure S1: Distribution of sunshine hour and precipitation during rice growing period of 10 years (2011–2020). Data were obtained from the Korean Meteorological Administration (KMA) (https://www.weather.go.kr (accessed on 15 January 2023)).

Author Contributions

Conceptualization, Y.Y.; methodology, Y.Y.; software, Y.Y.; formal analysis, Y.Y.; investigation, Y.Y. and G.K.; data curation, Y.Y.; writing—original draft preparation, Y.Y.; writing—review and editing, Y.Y.; visualization, G.C.; supervision, T.Y.; project administration, T.Y.; funding acquisition, T.Y. All authors have read and agreed to the published version of the manuscript.

Funding

This study was carried out with the support of the Chungcheongnamdo Agricultural Research and Extension Services, South Korea (Project No. LP0042352020) and Rural Development Administration, South Korea (Project No. PJ015820062021).

Data Availability Statement

The data presented in this study are available on request from the corresponding author.

Acknowledgments

The author is thankful to Kiwoo Han, Kun Kim, Hyekyun Kim, Jongmi Park, Misook Lee, Eunmi Lee, Jeongsook Jeon, and Heesook Lim for technical support with field transplanting, maintenance, and harvest.

Conflicts of Interest

The authors declare no conflict of interest.

References

  1. Cha, H.-M.; Han, G.S.; Chung, H.-J. A study on the trend analysis regarding the rice consumption of Korean adults using Korean National Health and Nutrition Examination Survey data from 1998, 2001 and 2005. Nutr. Res. Pract. 2012, 6, 254–262. [Google Scholar] [CrossRef]
  2. Jung, J.M.; Kim, E.C.; Venkatanagappa, S.; Lee, J.S. Review of Rice: Production, Trade, Consumption, and Future Demand in Korea and Worldwide. Korean J. Crop Sci. 2017, 62, 157–165. [Google Scholar] [CrossRef]
  3. Ministry of Agriculture, Food and Rural Affairs (MAFRA). Available online: https://www.mafra.go.kr (accessed on 27 February 2023).
  4. Lee, J.-H.; Choi, J.-H.; Kim, S.-Y.; Lee, J.-Y.; Kim, C.-S.; Yeo, U.-S.; Song, Y.-C.; Sohn, Y.-B.; Oh, M.-K.; Kang, H.-W.; et al. Correlation Analysis between Head Rice Ratio and Agronomic Traits in RILs for Developing a Promising Rice Culitivar Adaptable to The Early-Transplanting Cultivation. Korean J. Crop. Sci. 2012, 57, 1–6. [Google Scholar] [CrossRef]
  5. Oh, S.K. Development of rice varieties for processing and trend of food industry. Food Ind. Nutr. 2016, 21, 8–14. [Google Scholar]
  6. Guo, T.; Liu, X.; Wan, X.; Weng, J.; Liu, S.; Liu, X.; Chen, M.; Li, J.; Su, N.; Wu, F.; et al. Identification of a Stable Quantitative Trait Locus for Percentage Grains with White Chalkiness in Rice (Oryza sativa). J. Integr. Plant Biol. 2011, 53, 598–607. [Google Scholar] [CrossRef]
  7. Nakata, M.; Fukamatsu, Y.; Miyashita, T.; Hakata, M.; Kimura, R.; Nakata, Y.; Kuroda, M.; Yamaguchi, T.; Yamakawa, H. High Temperature-Induced Expression of Rice α-Amylases in Developing Endosperm Produces Chalky Grains. Front. Plant Sci. 2017, 8, 2089. [Google Scholar] [CrossRef] [PubMed]
  8. Nagata, K.; Takita, T.; Yoshinaga, S.; Terashima, K.; Fukuda, A. Effect of air temperature during the early grain-filling stage on grain fissuring in rice. Japan J. Crop Sci. 2004, 73, 336–342. [Google Scholar] [CrossRef]
  9. Phan, T.T.T.; Ishibashi, Y.; Miyazaki, M.; Tran, H.T.; Okamura, K.; Tanaka, S.; Nakamura, J.; Yuasa, T.; Iwaya-Inoue, M. High Temperature-Induced Repression of the Rice Sucrose Transporter (OsSUT1) and Starch Synthesis-Related Genes in Sink and Source Organs at Milky Ripening Stage Causes Chalky Grains. J. Agron. Crop. Sci. 2013, 199, 178–188. [Google Scholar] [CrossRef]
  10. Nevame, A.Y.M.; Emon, R.M.; Malek, M.A.; Hasan, M.M.; Alam, A.; Muharam, F.M.; Aslani, F.; Rafii, M.Y.; Ismail, M.R. Relationship between High Temperature and Formation of Chalkiness and Their Effects on Quality of Rice. BioMed Res. Int. 2018, 2018, 1653721. [Google Scholar] [CrossRef] [PubMed]
  11. Nishimura, M.; Yamauchi, F.; Ohuchi, K.; Hamamura, K. Evaluation of the eating quality of recent rice varieties and lines in Hokkaido- The relation between organoleptic and physicochemical qualities of milled rice harvested in an extremely col year and a very hot year during the summer. Res. Bull. Hokkaido Natl. Agric. Exp. Stn. 1985, 144, 77–89. [Google Scholar]
  12. Cuili, W.; Wen, G.; Peisong, H.; Xiangjin, W.; Shaoqing, T.; Guiai, J. Differences of Physicochemical Properties Between Chalky and Translucent Parts of Rice Grains. Rice Sci. 2022, 29, 577–588. [Google Scholar] [CrossRef]
  13. Jin, Z.X.; Qian, C.R.; Yang, J.; Liu, H.Y.; Jin, X.Y. Effect of temperature at grain filling stage on activities of key enzymes related to starch synthesis and grain quality of rice. Rice Sci. 2005, 12, 261–266. [Google Scholar]
  14. Aboubacar, A.; Moldenhauer, K.A.K.; McClung, A.M.; Beighley, D.H.; Hamaker, B.R. Effect of Growth Location in the United States on Amylose Content, Amylopectin Fine Structure, and Thermal Properties of Starches of Long Grain Rice Cultivars. Cereal Chem. 2006, 83, 93–98. [Google Scholar] [CrossRef]
  15. Takeuchi, Y.; Nonoue, Y.; Ebitani, T.; Suzuki, K.; Aoki, N.; Sato, H.; Ideta, O.; Hirabayashi, H.; Hirayama, M.; Ohta, H.; et al. QTL Detection for Eating Quality Including Glossiness, Stickiness, Taste and Hardness of Cooked Rice. Breed. Sci. 2007, 57, 231–242. [Google Scholar] [CrossRef]
  16. Wada, T.; Ogata, T.; Tsubone, M.; Uchimura, Y.; Matsue, Y. Mapping of QTLs for eating quality and physicochemical properties of the japonica rice ‘Koshihikari’. Breed. Sci. 2008, 58, 427–435. [Google Scholar] [CrossRef]
  17. Gutierrez, J.; Kim, S.Y.; Kim, P.J. Effect of rice cultivar on CH4 emissions and productivity in Korean paddy soil. Field Crop. Res. 2013, 146, 16–24. [Google Scholar] [CrossRef]
  18. Yun, Y.; Chung, C.; Kim, G.; Yun, T. ‘Bbareumi’, an Extremely Early-Maturing Rice Cultivar Adaptable for Early Transplanting, in the Chungnam Plain Area. Korean J. Breed. Sci. 2022, 54, 238–243. [Google Scholar] [CrossRef]
  19. Jiang, M.; Li, X.; Xin, L.; Tan, M.; Zhang, W. Impacts of Rice Cropping System Changes on Paddy Methane Emissions in Southern China. Land 2023, 12, 270. [Google Scholar] [CrossRef]
  20. Cho, S.-W.; Jeung, J.-U.; Kang, K.-H.; Kim, H.-S.; Kim, B.-K. Evaluation on Early-maturing Korean Japonica Cultivars for High-temperature Tolerance during Grain Filling Stage. Korean J. Crop. Sci. 2015, 60, 146–152. [Google Scholar] [CrossRef]
  21. Cho, S.R.; Verma, P.P.; Das, S.; Kim, G.W.; Lim, J.Y.; Kim, P.J. A new approach to suppress methane emissions from rice cropping systems using ethephon. Sci. Total Environ. 2022, 804, 150159. [Google Scholar] [CrossRef] [PubMed]
  22. Lee, J.H.; Park, D.S.; Kwak, D.Y.; Yeo, U.S.; Song, Y.C.; Kim, C.S.; Jeon, M.G.; Oh, B.G.; Shin, M.S.; Kim, J.K. Yield and grain quality of early maturing rice cultivars as affected by early transplanting in Yeongnam plain area. Korean J. Crop Sci. 2008, 53, 326–332. [Google Scholar]
  23. Yang, W.; Choi, K.-J.; Shon, J.; Kang, S.; Shin, S.-H.; Shim, K.-B.; Kim, J.; Jung, H.; Jang, J.H.; Jeong, J.-S.; et al. Effects of Temperature and Sunshine Hours During Grain Filling Stage on the Quality-Related Traits of High Quality Rice Varieties in Korea. Korean J. Crop. Sci. 2015, 60, 273–281. [Google Scholar] [CrossRef]
  24. Yun, Y.-T.; Chung, C.-T.; Lee, Y.-J.; Na, H.-J.; Lee, J.-C.; Lee, D.-H.; Lee, K.-W.; Kang, J.-W.; Ahn, S.-N. Variation of Yield and Quality in Early Maturing Rice Cultivars by Transplanting Date in Chungnam Plain Area in Korea. Plant Breed. Biotechnol. 2015, 3, 47–57. [Google Scholar] [CrossRef]
  25. Yang, W.H.; Park, J.H.; Choi, J.S.; Kang, S.G.; Kim, S.J. Yield Characteristics and Related Agronomic Traits Affected by the Transplanting Date in Early Maturing Varieties of Rice in the Central Plain Area of Korea. Korean J Crop Sci. 2019, 64, 165–175. [Google Scholar] [CrossRef]
  26. Yang, W.H.; Kim, M.K.; Kang, S.G.; Park, J.H.; Kim, S.J.; Choe, J.S.; Yang, C.I.; Baeg, N.H. Changes in Flowering Date and Yielding Characteristics Affected by Transplanting Date in the Early-maturing Rice Cultivar ‘Joun’ in the Mid-northern Inland of Korea. Korean J Crop Sci. 2017, 62, 304–310. [Google Scholar] [CrossRef]
  27. Seong, D.-G.; Kim, Y.-G.; Yun, S.-M.; Kim, H.-C.; Lee, J.J.; Kim, C.S.; Chung, J.-S. Studies on How Changing the Transplanting Time Affects Rice Quality and Yield. Korean J. Breed. Sci. 2022, 54, 177–183. [Google Scholar] [CrossRef]
  28. National Institute of Agricultural Science and Technology (NIAST). Methods of Soil Chemical Analysis; RDA: Suwon, Republic of Korea, 2010; pp. 13–144. [Google Scholar]
  29. Yun, Y.T.; Chung, C.T.; Kim, G.C.; Kim, B.R. Improving Efficiency and Effectiveness of Disinfection by Soaking Seeds before Rice Seed Disinfection. Korean J. Crop Sci. 2022, 67, 137–146. [Google Scholar] [CrossRef]
  30. Rural Development Administration (RDA). Available online: https://soil.rda.go.kr (accessed on 10 February 2023).
  31. ChungcheongNamdo Agricultural Research and Extension Services (CNARES). Available online: https://cnnongup.chungnam.go.kr (accessed on 10 February 2023).
  32. Korean Meteorological Administration (KMA). Available online: https://www.weather.go.kr (accessed on 15 January 2023).
  33. Shimono, H.; Hasegawa, T.; Iwama, K. Response of growth and grain yield in paddy rice to cool water at different growth stages. Field Crop. Res. 2002, 73, 67–79. [Google Scholar] [CrossRef]
  34. Ye, C.; Fukai, S.; Godwin, I.; Reinke, R.; Snell, P.; Schiller, J.; Basnayake, J. Cold tolerance in rice varieties at different growth stages. Crop. Pasture Sci. 2009, 60, 328–338. [Google Scholar] [CrossRef]
  35. Abookheili, F.A.; Mobasser, H.R. Effect of planting density on growth characteristics and grain yield increase in successive cultivations of two rice cultivars. Agrosystems Geosci. Environ. 2021, 4, e20213. [Google Scholar] [CrossRef]
  36. Meas, V.; Shon, D.; Lee, Y.-H. Impacts of Planting Density on Nutrients Uptake by System of Rice Intensification under No-tillage Paddy in Korea. Korean J. Soil Sci. Fertil. 2011, 44, 98–103. [Google Scholar] [CrossRef]
  37. Ying, J.; Peng, S.; He, Q.; Yang, H.; Yang, C.; Visperas, R.M.; Cassman, K.G. Comparison of high-yield rice in tropical and subtropical environments: I. Determinants of grain and dry matter yields. Field Crop. Res. 1998, 57, 71–84. [Google Scholar] [CrossRef]
  38. Son, Y.; Park, S.T.; Kim, S.C.; Lee, S.S.; Lee, S.K. Varietal response on different planting densities in rice. Res. Rept. RDA 1989, 34, 1–6. [Google Scholar]
  39. Hayashi, S.; Kamoshita, A.; Yamagishi, J. Effect of Planting Density on Grain Yield and Water Productivity of Rice (Oryza sativa L.) Grown in Flooded and Non-flooded Fields in Japan. Plant Prod. Sci. 2006, 9, 298–311. [Google Scholar] [CrossRef]
  40. Li, Z.-F.; Wan, J.-M.; Xia, J.-F.; Zhai, H.-Q. Mapping quantitative trait loci underlying appearance quality of rice grains (Oryza sativa L.). Acta Genet. Sin. 2003, 30, 251–259. [Google Scholar] [CrossRef]
  41. Nelson, J.C.; McClung, A.M.; Fjellstrom, R.G.; Moldenhauer, K.A.K.; Boza, E.; Jodari, F.; Oard, J.H.; Linscombe, S.; Scheffler, B.E.; Yeater, K.M. Mapping QTL main and interaction influences on milling quality in elite US rice germplasm. Theor. Appl. Genet. 2011, 122, 291–309. [Google Scholar] [CrossRef]
  42. Chen, H.; Zhao, Z.; Jiang, L.; Wan, X.; Liu, L.; Wu, X.; Wan, J. Molecular genetic analysis on percentage of grains with chalkiness in rice (Oryza sativa L.). Afr. J. Biotech. 2011, 10, 6891–6903. [Google Scholar]
  43. Yun, Y.-T.; Chung, C.-T.; Lee, Y.-J.; Na, H.-J.; Lee, J.-C.; Lee, S.-G.; Lee, K.-W.; Yoon, Y.-H.; Kang, J.-W.; Lee, H.-S.; et al. QTL Mapping of Grain Quality Traits Using Introgression Lines Carrying Oryza rufipogon Chromosome Segments in Japonica Rice. Rice 2016, 9, 62. [Google Scholar] [CrossRef]
  44. Kwon, S.-W.; Cho, Y.-C.; Lee, J.-H.; Suh, J.-P.; Kim, J.-J.; Kim, M.-K.; Choi, I.-S.; Hwang, H.-G.; Koh, H.-J.; Kim, Y.-G. Identification of quantitative trait loci associated with rice eating quality traits using a population of recombinant inbred lines derived from a cross between two temperate japonica cultivars. Mol. Cells 2011, 31, 437–445. [Google Scholar] [CrossRef] [PubMed]
  45. Yanase, H.; Ohtsubo, K.; Hashimoto, K.; Sato, H.; Teranishi, T. Correlation between protein contents of brown rice and textural parameters of cooked rice and cooking quality of rice. Rep. Natl. Food Res. Inst. 1984, 45, 118–122. [Google Scholar]
  46. Yun, Y.; Kim, G.; Cho, G.; Lee, Y.; Yun, T.; Kim, H. Effect of Nitrogen Application Methods on Yield and Grain Quality of an Extremely Early Maturing Rice Variety. Agriculture 2023, 13, 832. [Google Scholar] [CrossRef]
  47. Heu, M.H.; Lee, C.Y.; Choe, Z.R.; Kim, S.I. Variablility of protein content in rice grown at several different environments. Korean J. Crop Sci. 1969, 7, 79–84. [Google Scholar]
  48. Ladha, J.; Kirk, G.; Bennett, J.; Peng, S.; Reddy, C.; Reddy, P.; Singh, U. Opportunities for increased nitrogen-use efficiency from improved lowland rice germplasm. Field Crop. Res. 1998, 56, 41–71. [Google Scholar] [CrossRef]
  49. Peng, S.; Buresh, R.J.; Huang, J.; Yang, J.; Zou, Y.; Zhong, X.; Wang, G.; Zhang, F. Strategies for overcoming low agronomic nitrogen use efficiency in irrigated rice systems in China. Field Crop. Res. 2006, 96, 37–47. [Google Scholar] [CrossRef]
  50. Zhou, C.; Huang, Y.; Jia, B.; Wang, S.; Dou, F.; Samonte, S.O.P.; Chen, K.; Wang, Y. Optimization of Nitrogen Rate and Planting Density for Improving the Grain Yield of Different Rice Genotypes in Northeast China. Agronomy 2019, 9, 555. [Google Scholar] [CrossRef]
  51. Schnier, H.F.; Dingkuhn, M.; De Datta, S.K.; Marqueses, E.P.; Faronilo, J.E. Nitrogen-15 balance in transplanted and direct-seeded flooded rice as affected by different methods of urea application. Biol. Fertil. Soils 1990, 10, 89–96. [Google Scholar] [CrossRef]
  52. Khan, S.; Anwar, S.; Kuai, J.; Ullah, S.; Fahad, S.; Zhou, G. Optimization of Nitrogen Rate and Planting Density for Improving Yield, Nitrogen Use Efficiency, and Lodging Resistance in Oilseed Rape. Front. Plant Sci. 2017, 8, 532. [Google Scholar] [CrossRef]
  53. Sui, B.; Feng, X.; Tian, G.; Hu, X.; Shen, Q.; Guo, S. Optimizing nitrogen supply increases rice yield and nitrogen use efficiency by regulating yield formation factors. Field Crop. Res. 2013, 150, 99–107. [Google Scholar] [CrossRef]
  54. Counce, P.A.; Wells, B.R. Rice Plant Population Density Effect on Early-Season Nitrogen Requirement. J. Prod. Agric. 1990, 3, 390–393. [Google Scholar] [CrossRef]
Figure 1. Mean, maximum, and minimum temperature during rice cultivation periods in years from 2011 to 2020. Data were obtained from the website of the Korean Meteorological Administration (https://www.weather.go.kr (accessed on 15 January 2023)) [32].
Agronomy 13 01195 g001
Figure 2. Number of days for DTH (days from transplanting to heading), DHH (days from heading to harvesting), and DTG (days of total growth period) relative to the transplanting date of (a) Jinbuol and (b) Yeoreumi. Each data point is the mean of 2 years (2019 and 2020).
Agronomy 13 01195 g002
Figure 3. Relationship between DTH (days from transplanting to heading) and mean temperature from transplanting to heading for (a) Jinbuol and (b) Yeoreumi. Each data point is the mean of 3 replicates every year. DTH denotes the number of days from transplanting to heading. **: Significant at p < 0.01.
Agronomy 13 01195 g003
Figure 4. Milled and head rice yield relative to the transplanting date for (a) Jinbuol and (b) Yeoreumi. Numbers followed by the same letter are not significantly different based on Duncan’s multiple range at p < 0.05. Each datum is the mean of two years.
Agronomy 13 01195 g004
Figure 5. Relationship between the mean temperature during ripening and the ratio of head rice for (a) Jinbuol and (b) Yeoreumi. Each data point is the mean of 3 replicates every year (2019 and 2020). **: Significant at p < 0.01.
Agronomy 13 01195 g005
Figure 6. Relationship between protein content and three different periods of Jinbuol (ac) and Yeoreumi (df), respectively. DTH, DHH, and DTG indicate days from transplanting to heading, days from heading to harvest, and days of total growth period, respectively. Each data point is the mean of 3 replicates every year. **: Significant at p < 0.05 and ns: not significant.
Agronomy 13 01195 g006
Figure 7. Correlation between DTH and estimated biomass value (EBV) of (a) Jinbuol and (b) Yeoreumi. Each data point is the mean of 3 replicates every year. **: Significant at p < 0.01.
Agronomy 13 01195 g007
Table 1. Characteristics related to heading date according to the transplanting date.
VarietyTransplanting Date (m.dd)Heading Date
(m.dd)
Accumulated
Temp. (°C)
Harvesting Date
(m.dd)
Mean Temp.
(°C)
Jinbuol4.166.2913588.1323.9
5.017.0112048.1524.1
5.167.0710968.1924.7
6.017.1710188.2825.3
6.167.259079.0625.2
7.018.068729.2024.1
7.168.1885110.0921.7
Yeoreumi4.177.1015888.2124.8
5.017.1114248.2324.9
5.167.1713228.2825.3
6.017.2913109.1025.0
6.168.0812659.2423.9
7.018.18118810.0921.7
7.168.28111010.3020.0
MeanJinbuol7.1910439.0224.1
Yeoreumi7.3013159.1623.7
Difference*******
Harvesting date was determined when the accumulated temperature reached 1100 °C. Accumulated temperature denotes the sum of the mean temperature from transplanting to heading. Mean temperature denotes the mean temperature for 40 days after heading. Each data is the mean of two years. *, **: Significant at p < 0.05 and p < 0.01, respectively.
Table 2. Culm and panicle-related traits according to the transplanting date.
VarietyTransplanting Date (m.dd)Culm Length
(cm)
Panicle Length
(cm)
Panicle Number
hill−1
Panicle Number
m−2
Jinbuol4.1663.4 a17.4 a21.9 a522 a
5.0163.8 a17.4 a21.7 a517 a
5.1663.1 a17.5 a21.6 a515 a
6.0162.7 a17.0 ab20.6 b489 b
6.1662.9 a16.7 bc20.5 b488 b
7.0158.6 b16.2 c20.3 b484 b
7.1656.7 c15.4 d19.8 b470 b
Yeoreumi4.1675.2 a18.7 a17.9 ab423 ab
5.0175.4 a18.8 a18.1 a431 a
5.1675.1 a18.7 a18.1 a429 a
6.0173.4 a18.6 a18.0 a428 a
6.1673.5 a18.2 ab17.5 ab417 ab
7.0168.1 b17.8 b17.1 b408 b
7.1667.5 b17.6 b16.1 c384 c
MeanJinbuol61.616.820.9498
Yeoreumi72.618.317.5417
Difference********
Numbers followed by the same letter in each column are not significantly different based on Duncan’s multiple range at p < 0.05. Each datum is the mean of two years. **: Significant at p < 0.01.
Table 3. Grain-related traits relative to the transplanting date.
VarietyTransplanting Dates (m.dd)Spikelet Number Panicle−1Spikelet Number m−2Ripened Grain (%)1000-Grain Weight (g)
Jinbuol4.1646.1 a24,069 a80.5 a24.5 a
5.0145.1 ab23,301 a80.8 a24.6 a
5.1644.6 ab22,899 a81.3 a24.3 a
6.0142.9 b20,983 b81.7 a24.4 a
6.1642.8 b20,880 b80.6 a24.5 a
7.0138.5 c18,233 c82.1 a24.4 a
7.1632.9 d15,514 d82.8 a24.1 a
Yeoreumi4.1675.7 a32,007 a83.2 a20.2 a
5.0176.1 a32,738 a83.4 a20.3 a
5.1675.8 a32,540 a83.5 a20.1 a
6.0174.8 a32,048 a84.1 a20.0 a
6.1676.5 a31,886 a83.2 a20.1 a
7.0169.2 b28,210 b84.1 a20.1 a
7.1669.0 b26,465 c84.3 a20.0 a
MeanJinbuol41.820,84081.424.4
Yeoreumi73.930,84283.720.1
Difference********
Numbers followed by the same letter in each column are not significantly different based on Duncan’s multiple range at p < 0.05. Each datum is the mean of two years. **: Significant at p < 0.01.
Table 4. Correlation coefficients of two varieties for DTH and agronomic traits.
Yeoreumi
TraitDTHCLPLPNHSNPSNMRGRTGWMRY
DTH10.791 **0.835 **0.677 **0.659 *0.697 **−0.507 ns0.565 *0.731 **
CL0.689 **10.930 **0.890 **0.879 **0.950 **−0.552 *0.528 ns0.909 **
PL0.779 **0.875 **10.829 **0.783 **0.870 **−0.575 *0.633 *0.912 **
PNH0.816 **0.608 *0.736 **10.711 **0.915 **−0.347 ns0.555 *0.835 **
SNP0.780 **0.924 **0.940 **0.758 **10.927 **−0.663 **0.333 ns0.864 **
SNM0.851 **0.889 **0.927 **0.881 **0.972 **1−0.547 *0.462 ns0.909 **
RGR−0.607 *−0.769 **−0.723 **−0.432 ns−0.790 **−0.725 **1−0.467 ns−0.579 *
TGW0.526 ns0.677 **0.549 *0.350 ns0.650 *0.590 *−0.802 **10.600 *
MRY0.766 **0.942 **0.938 **0.788 **0.962 **0.963 **−0.726 **0.648 *1
Jinbuol
DTH: days from transplanting to heading, CL: culm length, PL: panicle length, PNH: panicle number hill−1, SPP: spikelet number panicle−1, SNPM: spikelets number m−2, RGR: ripened grain rate, TGW: 1000 grains weight, MRY: milled rice yield. The gray part of the table is the correlation analysis result of Yeoreumi, and the white part is Jinbuol. *, **: Significant at p < 0.05 and p < 0.01, respectively, ns: not significant.
Table 5. Rice grain quality traits relative to the transplanting date.
VarietyTransplanting Date
(mm.dd)
Appearance Traits (%)Protein
(%)
HeadChalkyBrokenDamaged
Jinbuol4.1679.2 c17.0 b3.6 ab0.2 a6.6 c
5.0180.1 c15.1 bc4.5 a0.4 a6.8 c
5.1676.2 d20.0 a3.2 abc0.6 a7.5 b
6.0175.4 d21.3 a3.3 ab0.3 a7.9 b
6.1674.6 d21.2 a3.8 ab0.4 a8.1 ab
7.0183.8 b13.1 c2.7 bc0.3 a8.6 a
7.1690.6 a7.5 d1.8 c0.2 a8.7 a
Yeoreumi4.1688.8 b8.8 b2.0 c0.4 a6.5 d
5.0189.2 b8.1 b2.6 bc0.3 a6.3 d
5.1684.9 d12.3 ab2.8 bc0.3 a6.9 c
6.0186.2 cd10.4 a3.0 b0.4 a7.2 b
6.1687.3 bc8.1 b4.3 a0.3 a7.5 b
7.0194.4 a2.6 d2.8 bc0.2 a7.8 a
7.1695.3 a2.5 d2.0 c0.2 a7.9 a
MeanJinbuol80.016.53.30.37.7
Yeoreumi89.47.52.80.37.2
t-test*****ns**
Numbers followed by the same letter in each column are not significantly different based on Duncan’s multiple range at p < 0.05. Each datum is the mean of two years. *, **: Significant at p < 0.05 and p < 0.01, respectively, ns: not significant.
Disclaimer/Publisher’s Note: The statements, opinions and data contained in all publications are solely those of the individual author(s) and contributor(s) and not of MDPI and/or the editor(s). MDPI and/or the editor(s) disclaim responsibility for any injury to people or property resulting from any ideas, methods, instructions or products referred to in the content.

