Article

Comparison of Biochar- and Lime-Adjusted pH Changes in N2O Emissions and Associated Microbial Communities in a Tropical Tea Plantation Soil

1
Sanya Nanfan Research Institute of Hainan University, Sanya 572025, China
2
College of Tropical Crops, Hainan University, Haikou 570228, China
3
Institute of Agricultural Environment and Soil, Hainan Academy of Agricultural Sciences, Haikou 571100, China
*
Authors to whom correspondence should be addressed.
These authors contributed equally to this work.
Agronomy 2023, 13(4), 1144; https://doi.org/10.3390/agronomy13041144
Submission received: 21 March 2023 / Revised: 13 April 2023 / Accepted: 14 April 2023 / Published: 17 April 2023
(This article belongs to the Section Soil and Plant Nutrition)

Abstract

:
The use of biochar and lime (CaO) is a common approach to mitigating soil acidification. However, little is known about how biochar and lime amendments impact N2O emissions and potential microbial mechanisms. We conducted a 45-day microcosm incubation experiment to examine N2O emission and associated functional guilds to biochar and lime amendment in an acidic tea plantation soil. Results show that lime and biochar treatments significantly reduced cumulative N2O emissions by 49.69% and 63.01%, respectively, while significantly increasing cumulative CO2 emissions by 27.51% and 19.35%, respectively. Additionally, lime and biochar treatments significantly decreased the abundances of bacterial nirK, nirS, nosZ and fungal nirK genes, while increasing that of the ammonia-oxidizing bacteria (AOB) and the complete ammonia-oxidizing bacteria (comammox) amoA genes. The stimulated or inhibitory effects of biochar on functional genes abundances were higher than lime. The N2O emission rate was positively linked with the abundance of the fungal nirK gene but was negatively correlated with AOB and comammox amoA genes abundances. The random forest and linear regression analysis revealed that fungal denitrifiers were the most important predictors of N2O emissions. Lime and biochar amendments reduced the alpha diversity and altered the community composition of nirK-harboring fungal denitrifiers. Ascomycota was the dominant fungal denitrifiers belonging to the families Nectriaceae, Aspergillaceae, and Chaetomiaceae, and the relative abundances of genera Chaetomium, Penicillium and Fusarium were positively correlated with N2O emissions. Overall, our findings suggest that biochar is more effective than lime in reducing N2O emissions, and this is likely due to the powerful effects it has on community traits of nirK-harboring fungal denitrifiers.

1. Introduction

Nitrous oxide (N2O) is a potent greenhouse gas that destroys the atmospheric ozone layer [1]. Agricultural soils are the primary source of N2O emissions, accounting for approximately 60% of anthropogenic emissions. This is primarily due to the heavy mineral nitrogen (N) inputs in agricultural land use [2]. Tea (Camellia sinensis L.) is a crop that thrives in acidic soils with pH levels ranging from 5.0–5.6 and is widely planted in tropical and subtropical regions [3]. Tea plantation fields have high N fertilizer inputs to boost yields, leading to excessive N2O emissions and significant soil acidification, which substantially exceed those of other upland soils [4,5]. As a result, tea plantation ecosystems have become a major source of agricultural N2O emissions. Soil nitrification and denitrification are two biological processes that release N2O gas [6]. Ammonia oxidation, the rate-limiting step of nitrification, is mediated by three groups of ammonia oxidizers, including archaea (AOA), bacteria (AOB) and complete ammonia-oxidizing bacteria (comammox), operating under aerobic conditions [7]. Ammonia oxidizers, possessing amoA genes, use NH3 as an energy source to convert ammonia (NH3) to nitrite (NO2) or nitrate (NO3) and release N2O gas as a byproduct [8]. AOB produces N2O directly via hydroxylamine (NH2OH) oxidation and NO2 reduction via nitrifier denitrification [9]. AOA and comammox can also produce through abiotic processes but with a lower release of N2O compared to AOB [10,11]. Bacterial denitrification is the stepwise reduction in NO3 to NO2, nitric oxide (NO), N2O and N2 under anaerobic conditions, producing N2O as an intermediate product [12]. The NO2 reduction to NO is the rate-limiting step during denitrification, which is mediated by the NO2 reductase gene (nirK and nirS) [13]. The NO reductase gene transforms N2O to N2 (nosZ), which serves as a microbial sink for N2O [12]. Fungi denitrifiers also produce N2O via denitrification by reducing NO2 to N2O using the nirK and P450nor genes, which differ from the bacterial nirK and nor genes [14,15]. Unlike bacterial denitrifiers, fungal denitrifiers can significantly contribute to N2O emissions, as they lack the N2O reductase encoding by the nosZ gene [16,17]. Fungi play a critical role in N2O emissions, and their contributions to N2O emissions can range from 17% to 89% in various soil ecosystems [18]. Recent research shows that the increase in N2O emissions is closely linked to the fungal community when a subtropical forest is converted to a tea plantation, indicating a vital role of fungi in N2O emissions [19]. Overall, the discovery of fungal N2O emissions in acidic tea plantation soil highlights the need to reassess microbial mechanisms behind N2O emissions.
Net N2O emissions are dependent on the balance between N2O production from nitrification and denitrification and N2O consumption from denitrification [6]. Environmental factors such as pH, organic carbon, soil water content, O2 partial pressure and nitrogen (N) availability have been shown to influence N2O production in soils [12]. Among these, pH is the primary factor influencing both microbial N2O production and consumption processes in soils [20,21]. Additionally, soil pH also affects the contributions of fungi and bacteria to N2O production [22]. For instance, Wang et al. [23] found that reducing pH increased the contribution of N2O produced by fungi compared to bacteria. Biochar and lime amendment can regulate microbial-mediated nitrification and denitrification processes, alleviating soil acidification and mitigating N2O emissions from acidic soils [24,25,26]. However, the effects of lime and biochar on N2O emissions and related microbial characteristics, especially for fungal denitrifiers, in acidic tea plantation soils remains poorly understood.
Lime is a commonly used soil amendment that is applied to counteract soil acidification and regulate N2O emissions. Some studies have shown that increasing soil pH via liming stimulates N2O reductase activity, leading to reduced N2O emissions [27,28]. In contrast, other reports have suggested that liming may increase soil pH, thus stimulating N mineralization, nitrification and denitrification rates, which increases N2O emissions [20,28]. Nitrifiers and denitrifiers communities in soils are significantly affected by pH [28,29,30]. For nitrifiers, previous studies have demonstrated that increasing the pH of acidic soils reduces the abundance of AOA but enhances AOB abundance [31,32]. For denitrifiers, liming can lead to an increase in the number of denitrifying bacterial nirK and nosZ genes, thus reducing N2O emissions [25,28]. To date, most studies have focused on N2O and bacterial denitrifiers’ responses to lime amendment in soils. However, how lime amendment influences the contribution of fungal denitrifiers to N2O emissions in acidic tea plantation soils is yet to be determined.
Biochar, a carbonaceous material is commonly used as a soil amendment to ameliorate soil acidification, enhance soil health and increase crop quality and yield [24,33]. Partial studies have reported that biochar effectively reduces N2O emissions in various soils [34,35]. However, some studies in agricultural ecosystems have demonstrated increased N2O emissions increased following biochar amendment [3,36]. Biochar can affect soil abiotic and biotic features, thus altering N2O emissions [37]. For example, biochar can change soil abiotic properties by improving soil pH (liming effects), aeration, and affecting nutrient availability through interactions with mineral N and organic carbon [37]. These changes in abiotic properties can affect microbial communities and regulate N-cycling processes related to N2O emissions. Ji et al. [26] and Aamer et al. [38] reported that biochar reduces N2O emissions by increasing denitrification activity and bacterial denitrification abundance. Conversely, other studies have shown that biochar can increase N2O emissions by stimulating soil nitrification activity and AOB abundance [36,39]. While most studies have focused on how biochar amendment affects N2O emissions and related bacterial communities involved in N cycling, the role of fungal denitrifiers in biochar-induced N2O emissions remains understudied.
This study aims to investigate the effects of lime and biochar amendments on N2O emissions and potential microbial mechanisms in tropical tea plantation soil. Specifically, we aim to (1) compare the effects of lime and biochar amendment on N2O emissions in an acidic tropical tea soil; (2) assess the effects of biochar and lime amendment on ammonia oxidizers and bacterial and fungal denitrifiers communities; (3) identify the dominant drivers leading to differences of N2O emissions between biochar and lime treatments.

2. Materials and Methods

2.1. Soil Sampling and Biochar Preparation

In June 2021, soil samples were taken from the tea plantation located at Wuzhishan Mountain (18°54′19″ N, 109°40′14″ E) in Hainan Province, China. The study area is a tropical-monsoon climate with a mean annual precipitation of 2350–2488 mm and a mean annual temperature of 22.5 °C. The soil is classified as Ferralsol according to the USDA. The tea field was converted from a natural forest ten years ago and received N in the form of urea around 500–600 kg ha−1 year−1. Ten surface layer soils (0–15 cm) were taken to compose a composite sample. Fresh soil samples were sieved (<2 mm) and stored under 4 °C for incubation experiments within a week. The soil consists of 35.30% sand, 13.20% silt, and 51.50% clay, with a pH of 4.70, a total N of 0.94 g/kg, and organic matter of 37.45 g/kg. Biochar was produced using maize straw at 500 °C under oxygen-restricted conditions in a batch system. The biochar had the following properties: pH, 9.10; total C and total N of 636.45 and 9.5 g kg−1, respectively; CEC, 22.51 cmol kg−1; ash content, 19.3%; bulk density, 0.20 g cm−3.

2.2. Microcosm Incubation Experiment

To reach the same final pH (5.60), a pre-experiment was conducted to determine the optimal amount of lime and biochar. The microcosm incubation study comprised three treatments with three replicates: non-treated control (CK), soil amended with 0.25% CaO (lime), and soil amended with 1% biochar (biochar). Air-dried soil (20 g dry weight) was mixed with either lime or biochar in 200 mL bottles. The moisture content of each mixed sample was adjusted to 40% water holding capacity (WHC). Bottles were sealed and pre-incubated at 25 °C for ten days in the dark to stabilize soil pH. Subsequently, soil moisture was adjusted to 60% WHC with sterile water by weighing, after which the bottles were tightly sealed and incubated at 25 °C for 45 days. The water was replenished every 2–3 days to compensate for moisture loss.
Headspace gas samples (20 mL) were sampled from the bottles on days 1, 2, 3, 4, 7, 14, 21, 28, 35, and 45. Before gas sampling, the bottles were ventilated to ensure gas exchange between air and the bottle inside. After ventilation, gas samples were collected from the bottle to be considered as the blank control. After that, bottles were sealed with rubber stoppers and incubated for 6 h, and then gas samples were taken using a sterile syringe. We measured the concentrations of CO2 and N2O using a gas chromatograph (Agilent 7890A, Santa Clara, CA, USA) which was equipped with a flame ionization detector and an electron capture detector. Three replicates of soil from each treatment were collected at 1, 4, 7, 14, 28 and 45 days. A portion of the soil was used to determine pH and mineral N (NH4+–N and NO3–N) concentration, while the remaining soil was kept at −20 °C for molecular analysis.

2.3. Nucleic Acid Extraction and Quantification of Functional Gene Abundance

Nucleic acid was extracted from 0.25 g of soil (wet weight) at days 7 and 45 with the DNeasy Powersoil kit (MoBio Laboratories, Carlsbad, CA, USA) according to instructions. DNA purity and concentration were estimated using NanoDrop-2000 and stored at −80 °C until use.
Quantitative real-time PCR (qPCR) was used to quantify the AOA, AOB, and comammox amoA genes and the bacterial nirK, nirS and nosZ genes of denitrifying bacteria. Additionally, the nirK gene for denitrifying fungi was quantified by qPCR in triplicates using the BIO-RAD Connect Real-time System (Bio-Rad, Laboratories Inc, Herculers, CA, USA). The primers and amplification conditions are available in Supplemental (Table S1). Standard curves were constructed using a tenfold serial dilution of plasmids containing the correct target genes. A melting curve was performed to reflect product specificity. PCR amplification efficiency is 84.5% for AOA amoA, 86% for AOB amoA, comammox amoA for 90%, bacterial nirK for 84%, nirS for 85%, nosZ for 87% and fungal nirK for 94%.

2.4. Amplicon Sequencing of Fungal Denitrifier nirK and Bioinformatics Analysis

Total soil DNA used for qPCR was also used for the amplification fungal nirK gene using the barcoded primers [17]. Thermal cycling consisted of an initial denaturation at 95 °C for 30 s, followed by 30 cycles of denaturation at 95 °C for 30 s, annealing at 55 °C for 30 s, and elongation at 72 °C for 30 s, with a final elongation step at 72 °C for 7 min. The PCR products were purified using the Qiagen Gel Extraction Kit (Qiagen, Germany) and quantified using a Qubit 2.0 fluorometer (Invitrogen, Carlsbad, CA, USA). The purified PCR products were mixed in equimolar concentrations and sent to a biotech company and sequenced using the Illumina Miseq platform at the Shenzhen Micro Ecological Technology Co., Ltd., Shenzhen, China. Raw sequences were demultiplexed and quality filtered with QIIME 1.9.1. Low-quality reads < 200 bp in length or reads with ambiguous bases were discarded. Chimeras were subsequently removed using UCHIME 4.3. The remaining reads were grouped into operational taxonomic units (OTUs) at 3% dissimilarity using UPARSE. Representative OTU sequences of fungal nirK OTUs were identified using BLAST in the NCBI database. A maximum likelihood phylogenetic tree of the fungal nirK gene was conducted using MEGA 11.0 software with 1000 bootstrap replicates. All sequences have been submitted to the NCBI database under the accession number PRJNA894784.

2.5. Statistical Analysis

All data analysis was conducted with R and Sigmaplot software. One-way ANOVA was used to examine the differences across different treatments in soil properties (pH, NH4+, NO3), net N mineralization rate (NNM), net nitrification rate (NNR), the copy numbers of ammonia oxidizers, bacterial denitrifiers, and fungal denitrifiers, and N2O and CO2 emissions. Spearman’s rank correlation coefficients were performed to evaluate the associations between soil pH, NH4+ and NO3 contents, NNM, NNR, the copy numbers of ammonia oxidizers, bacterial denitrifiers, and fungal denitrifiers, and N2O emissions. Linear regression analysis was conducted to assess the connections between N2O emissions and the copy numbers of ammonia oxidizers, bacterial denitrifiers and fungal denitrifiers. Random forest analysis was used to investigate the dominant drivers affecting N2O emissions.
Evaluation of alpha diversity including Chao1 and Shannon diversity indexes was conducted using Mothur software. One-way ANOVA was performed to estimate the differences among all treatments. Principal coordinate analysis (PCoA) was performed to evaluate fungal community dissimilarities among all treatments, and PERMANOVA analysis was performed to explore the difference across the treatments for fungal community structure.

3. Results

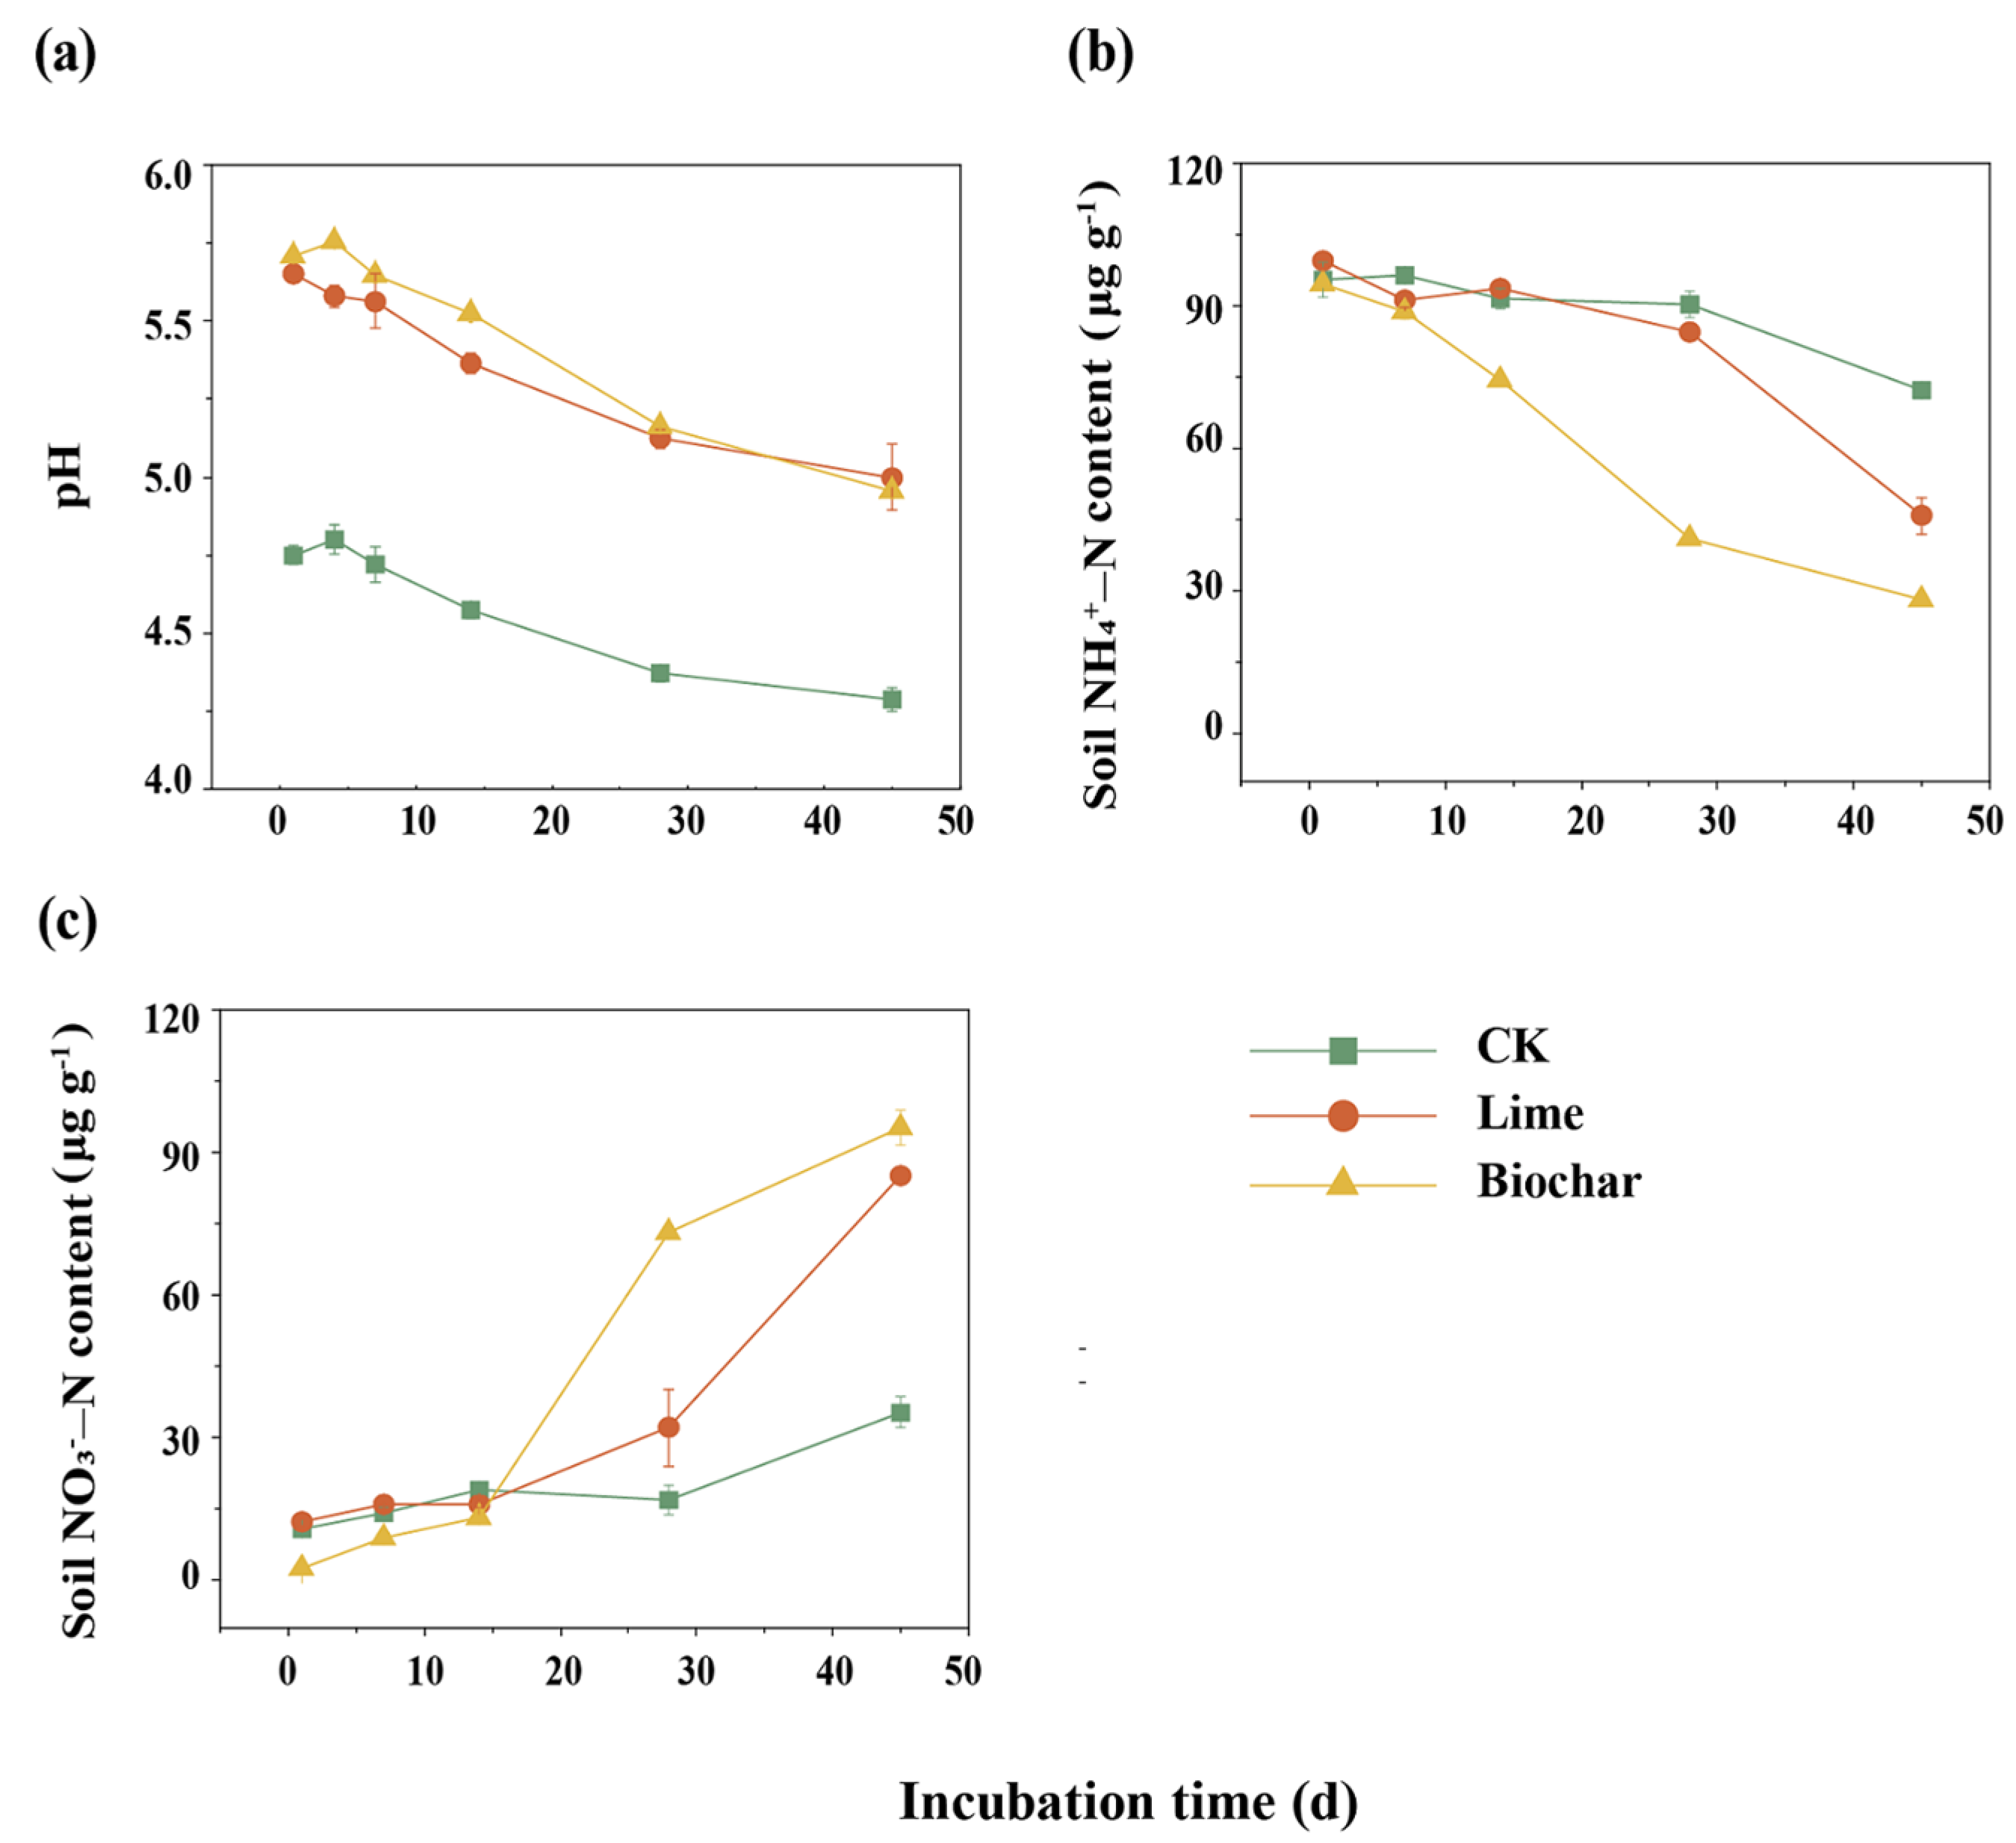
3.1. Soil pH and Dynamics of Mineral N Concentrations

The soil pH of the control declined from an initial pH of 4.70 to an ending pH of 4.32 (Figure 1a). The dynamics of soil pH were influenced by the type of acid-neutralizing material (lime vs. biochar) used during the incubation period. For example, the soil pH value was slightly higher in biochar-amended soil than in lime treatment before 28 days. However, the soil pH was similar after 28 days between biochar and lime treatments. Overall, the ameliorating effect of biochar was comparable to lime after 45-day incubation.
The dynamics of mineral N concentrations indicated different N transformation states in soils between treatments (Figure 1b). In the CK treatment, the concentration of exchangeable NH4+ decreased from 95.5 mg kg−1 soil at the beginning to 72.4 µg g−1 soil at the end. Exchangeable NH4+ concentration was significantly influenced by acid-neutralizing materials. For example, lime or biochar application accelerated NH4+ of consumption during the incubation period, with the lowest exchangeable NH4+ concentration (28.2 µg g−1) in biochar-treated soils after 45-day incubation.
For all treatments, NO3 concentrations were gradually increased during the incubation period and were distinct between treatments (Figure 1c). After 45-day incubation, NO3 concentrations across all treatments followed the sequence: biochar (95.2 µg g−1) > lime (85.1 µg g−1) > CK (35.4 µg g−1). This was contrary to the trend of NH4+ concentrations. The rate of decline in exchangeable NH4+ concentrations and the rate of increase in NO3 concentrations in the biochar treatment were faster relative to the lime treatment. Furthermore, the net mineralization rate was much higher in the CK-treated soil (0.91 µg N g−1 day−1) in the first week than in the lime (−0.79 µg N g−1 day−1) or biochar (0.21 µg N g−1 day−1) treatments (Figure S1). Additionally, this was much lower in the CK treatment than other treatments (lime vs. biochar) after 45-day incubation (Figure S1a). The net nitrification rate in the CK treatment (0.55 µg NO3–N g−1 day−1) over a 45-day incubation period was much lower compared to lime (1.62 µg NO3–N g−1 day−1) and biochar (2.06 µg NO3–N g−1 day−1) treatments (Figure S1b).

3.2. Soil N2O and CO2 Emissions

We analyzed the influences of biochar and lime on greenhouse gas (N2O and CO2) emissions (Figure 2). The N2O emission rates in the CK, lime, and biochar treatments were low in the early stage of the incubation. However, the N2O emission rate increased differently in the middle and latter stages of the incubation (Figure 2a). The highest N2O emission rate was obtained in the CK treatment, followed by lime and biochar treatments. Accordingly, the highest amount of N2O accumulation was recorded in the CK treatment (Figure 2b). In contrast, the lime and biochar treatments significantly reduced N2O accumulation by 49.69% and 63.01% compared to CK, respectively. Thus, the inhibitory effect of biochar on N2O emission was superior to lime.
The CO2 emission rates across all treatments were significantly higher at the beginning of the study and then declined in the subsequent incubation period (Figure 2c). The CO2 emission rates with lime- and biochar-treated soils were much higher compared to CK before 21-day incubation. Similarly, the lime and biochar treatments significantly increased cumulative CO2 emissions by 27.51% and 19.35%, respectively, in comparison to the CK (Figure 2d).

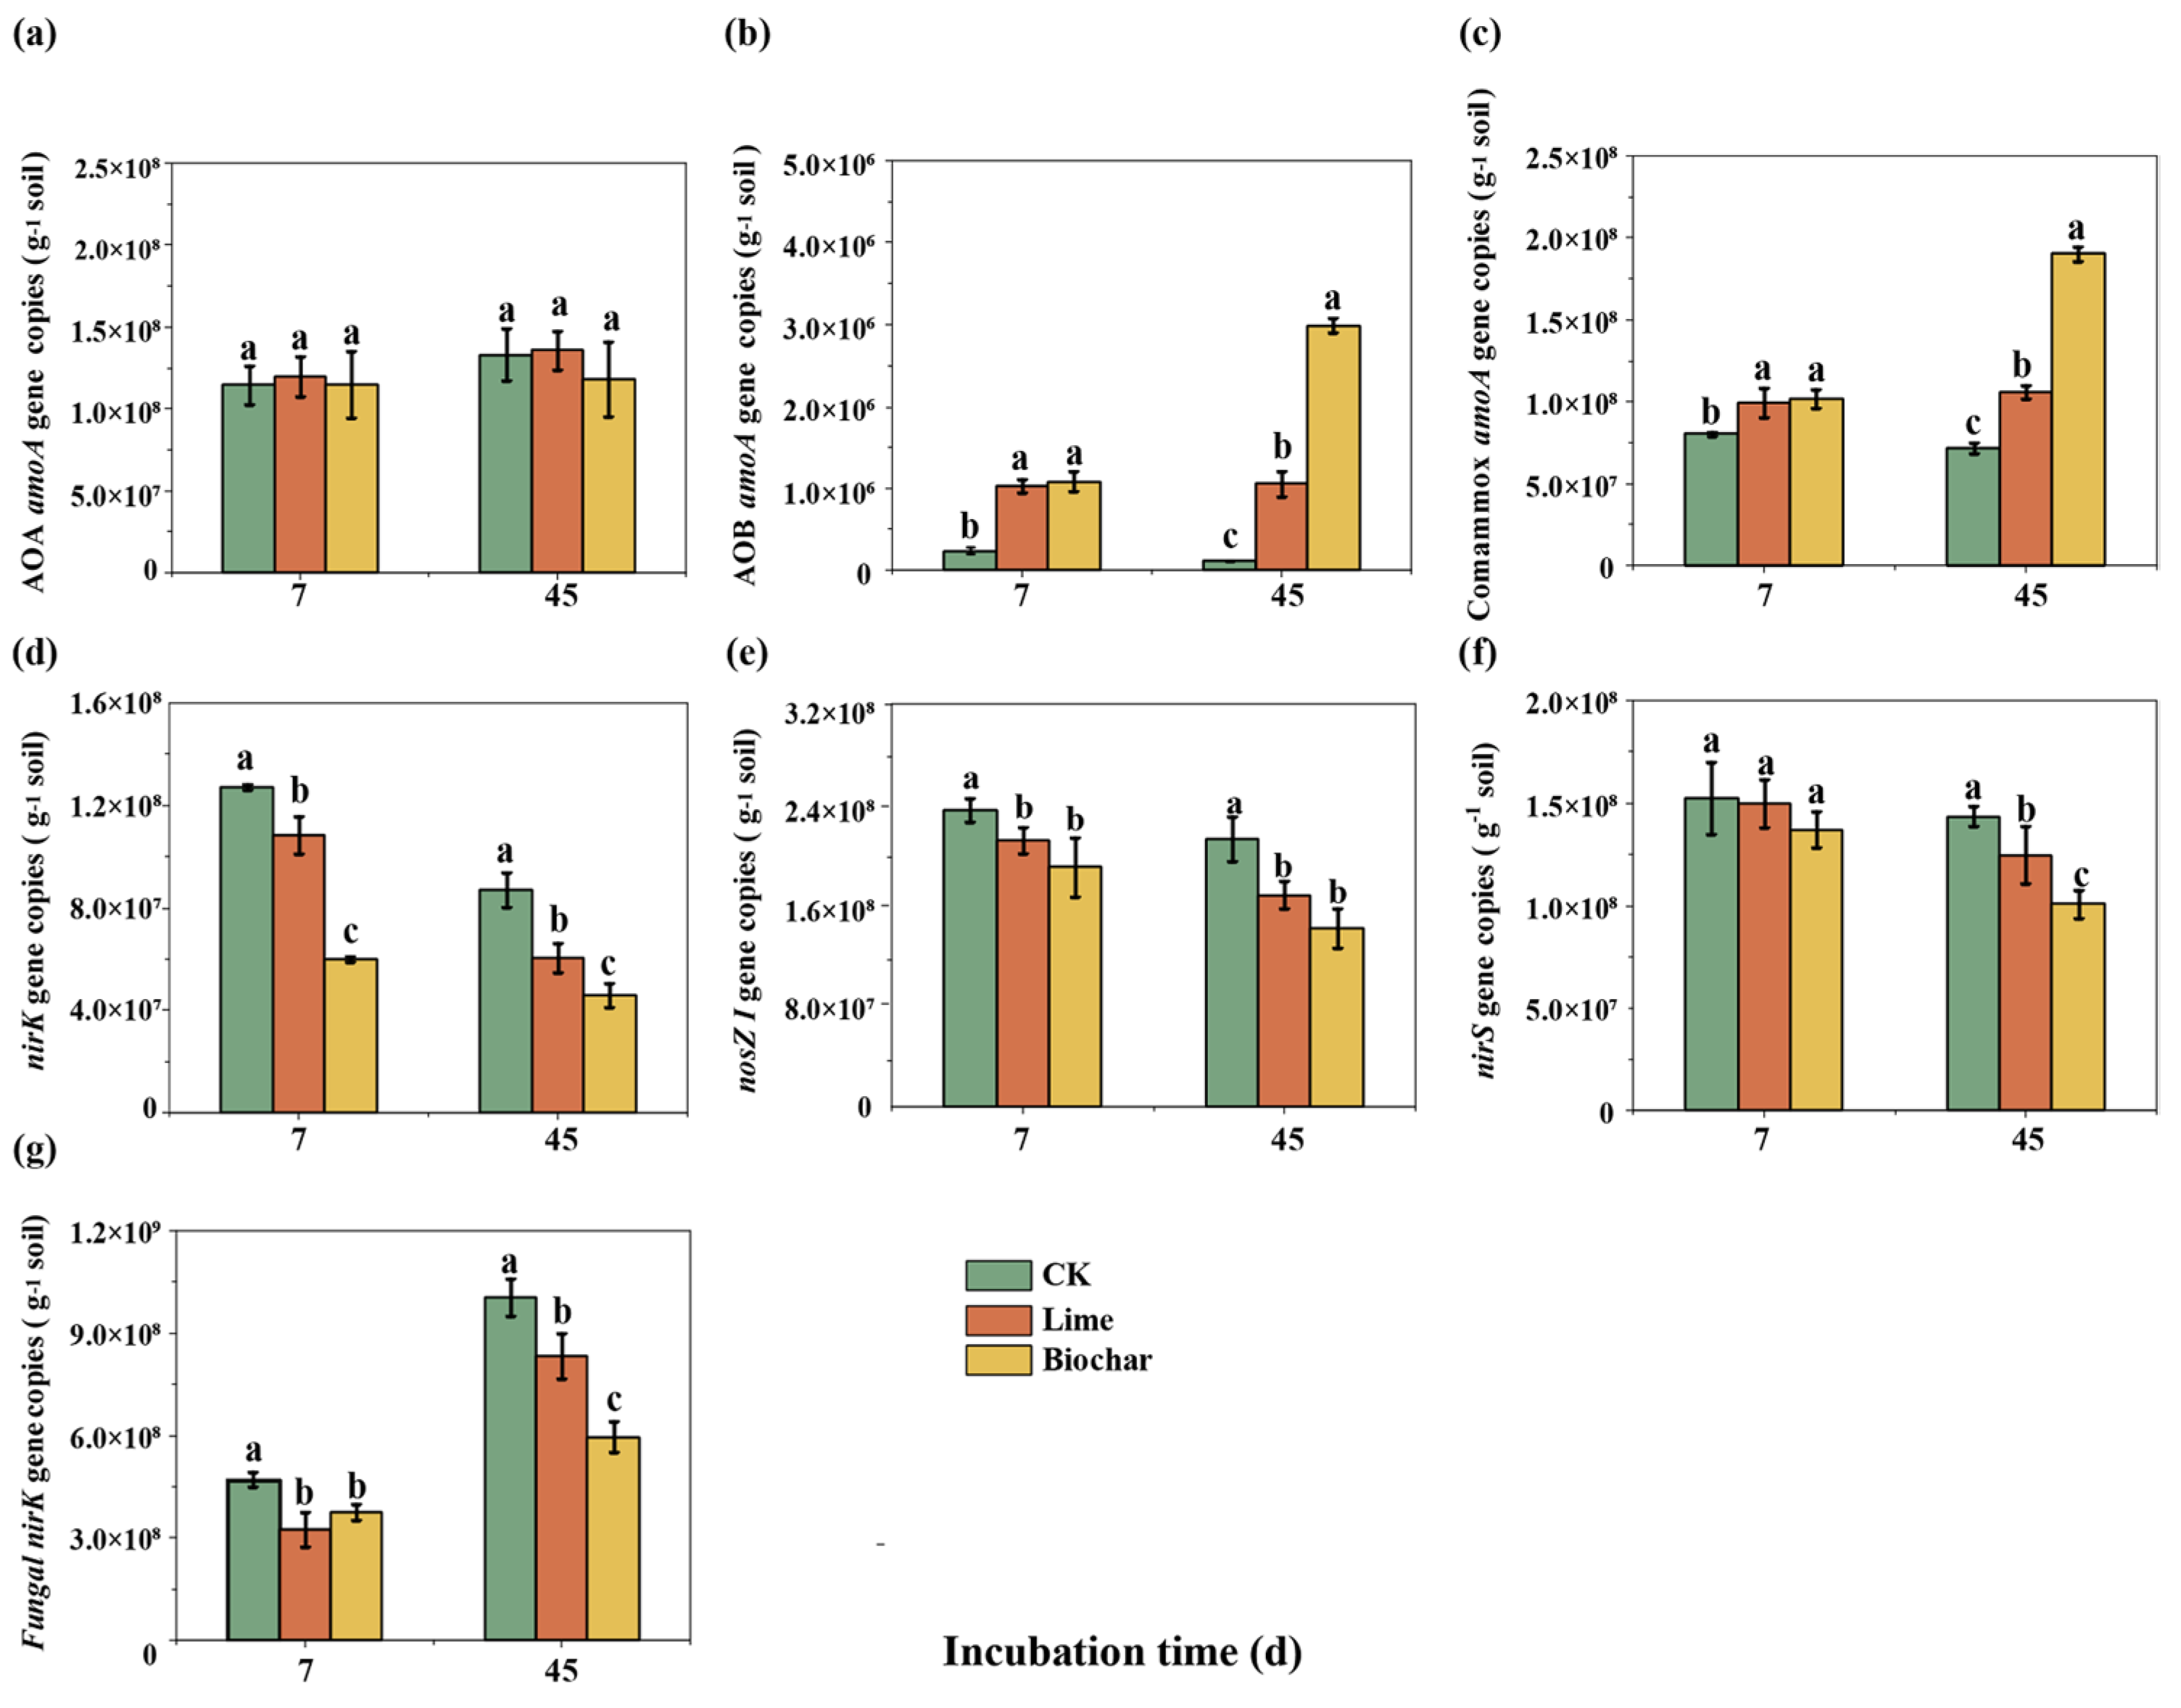
3.3. Abundances of Ammonia-Oxidizers, Bacterial Denitrifiers and Fungal Denitrifiers

Abundances of ammonia-oxidizing archaea (AOA), bacteria (AOB), and completing ammonia-oxidizing bacteria (comammox) amoA, bacterial denitrifiers nirS, nirK, nosZ, and fungal denitrifying nirK genes were quantified using qPCR (Figure 3a–g). Copy numbers of AOA and comammox amoA genes varied between 1.15 × 10⁸ and 1.39 × 10⁸ copies g−1 soil, and between 7.17 × 10⁷ and 1.90 × 10⁸ copies g−1 soil across different treatments (Figure 3a,c). This was significantly greater than AOB, which varied between 4.13 × 10⁶ and 8.82 × 10⁶ copies of g−1 soil (Figure 3b). Copy numbers of the AOA amoA gene were not dramatically affected by biochar or lime in any of the sampling dates compared to CK. No differences in AOA amoA gene copy numbers were recorded between lime and biochar treatments. In contrast, the addition of lime or biochar strongly enhanced the copy numbers of the AOB and comammox amoA gene, with a higher stimulatory effect on the growth in the biochar treatment.
The copy numbers of the bacterial nirS gene varied between 1.01 × 10⁸ and 1.52 × 10⁸ copies of g−1 soil across different treatments (Figure 3d). The gene abundance of bacterial nirS was similar among the three treatments (CK vs. lime vs. biochar) on day 7. However, its abundance significantly decreased in the lime and biochar treatments (p < 0.05) relative to CK at the end of incubation. The copy numbers of bacterial nirK, nosZ and fungal nirK genes varied between 4.59 × 10⁷ and 1.21 × 10⁸ copies g−1 soil, and between 1.55 × 10⁸ and 2.59 × 10⁸ copies g−1 soil, and between 3.61 × 10⁸ and 9.32 × 10⁸ copies g−1 soil, respectively (Figure 3e–g). The copy numbers of bacterial nirK, nosZ and fungal nirK genes dramatically decreased in response to the application of lime or biochar in any of the sampling dates.

3.4. Correlations between Soil Chemical Properties, the Abundances of N-Cycling Genes and N2O Emissions

Pearson correlation analysis assessed the relationships between chemical properties, N-cycling genes copy numbers, and N2O emissions (Figure S2). Soil pH was negatively correlated with fungal nirK gene copy number. NH4+ concentration was positively correlated with bacterial nirK, nirS, and nosZ gene copy numbers, but negatively correlated with AOB and comammox amoA, and fungal nirK gene copy numbers. NO3 concentration was positively connected with comammox amoA gene copy number but negatively correlated with bacterial nirK, nirS, and nosZ gene copy numbers. Moreover, soil pH was negatively associated with N2O emission rates. AOB and comammox amoA gene copy numbers were negatively correlated with N2O emission rates, while was positively associated with fungal nirK gene copy number.
The relationships between the N-cycling gene copy numbers and N2O emission rates were examined using linear regression analysis (Figure S3). The copy number of the fungal nirK gene was positively associated with the N2O emission rate, while AOB and comammox amoA gene copy numbers were negatively correlated with it. Random forest analysis showed fungal nirK gene copy number (9.3%) was the most important biotic predictor for N2O emissions, followed by soil pH (6.1%), and the copy numbers of AOB (5.6%) and comammox (4.2%) amoA genes (Figure 4).

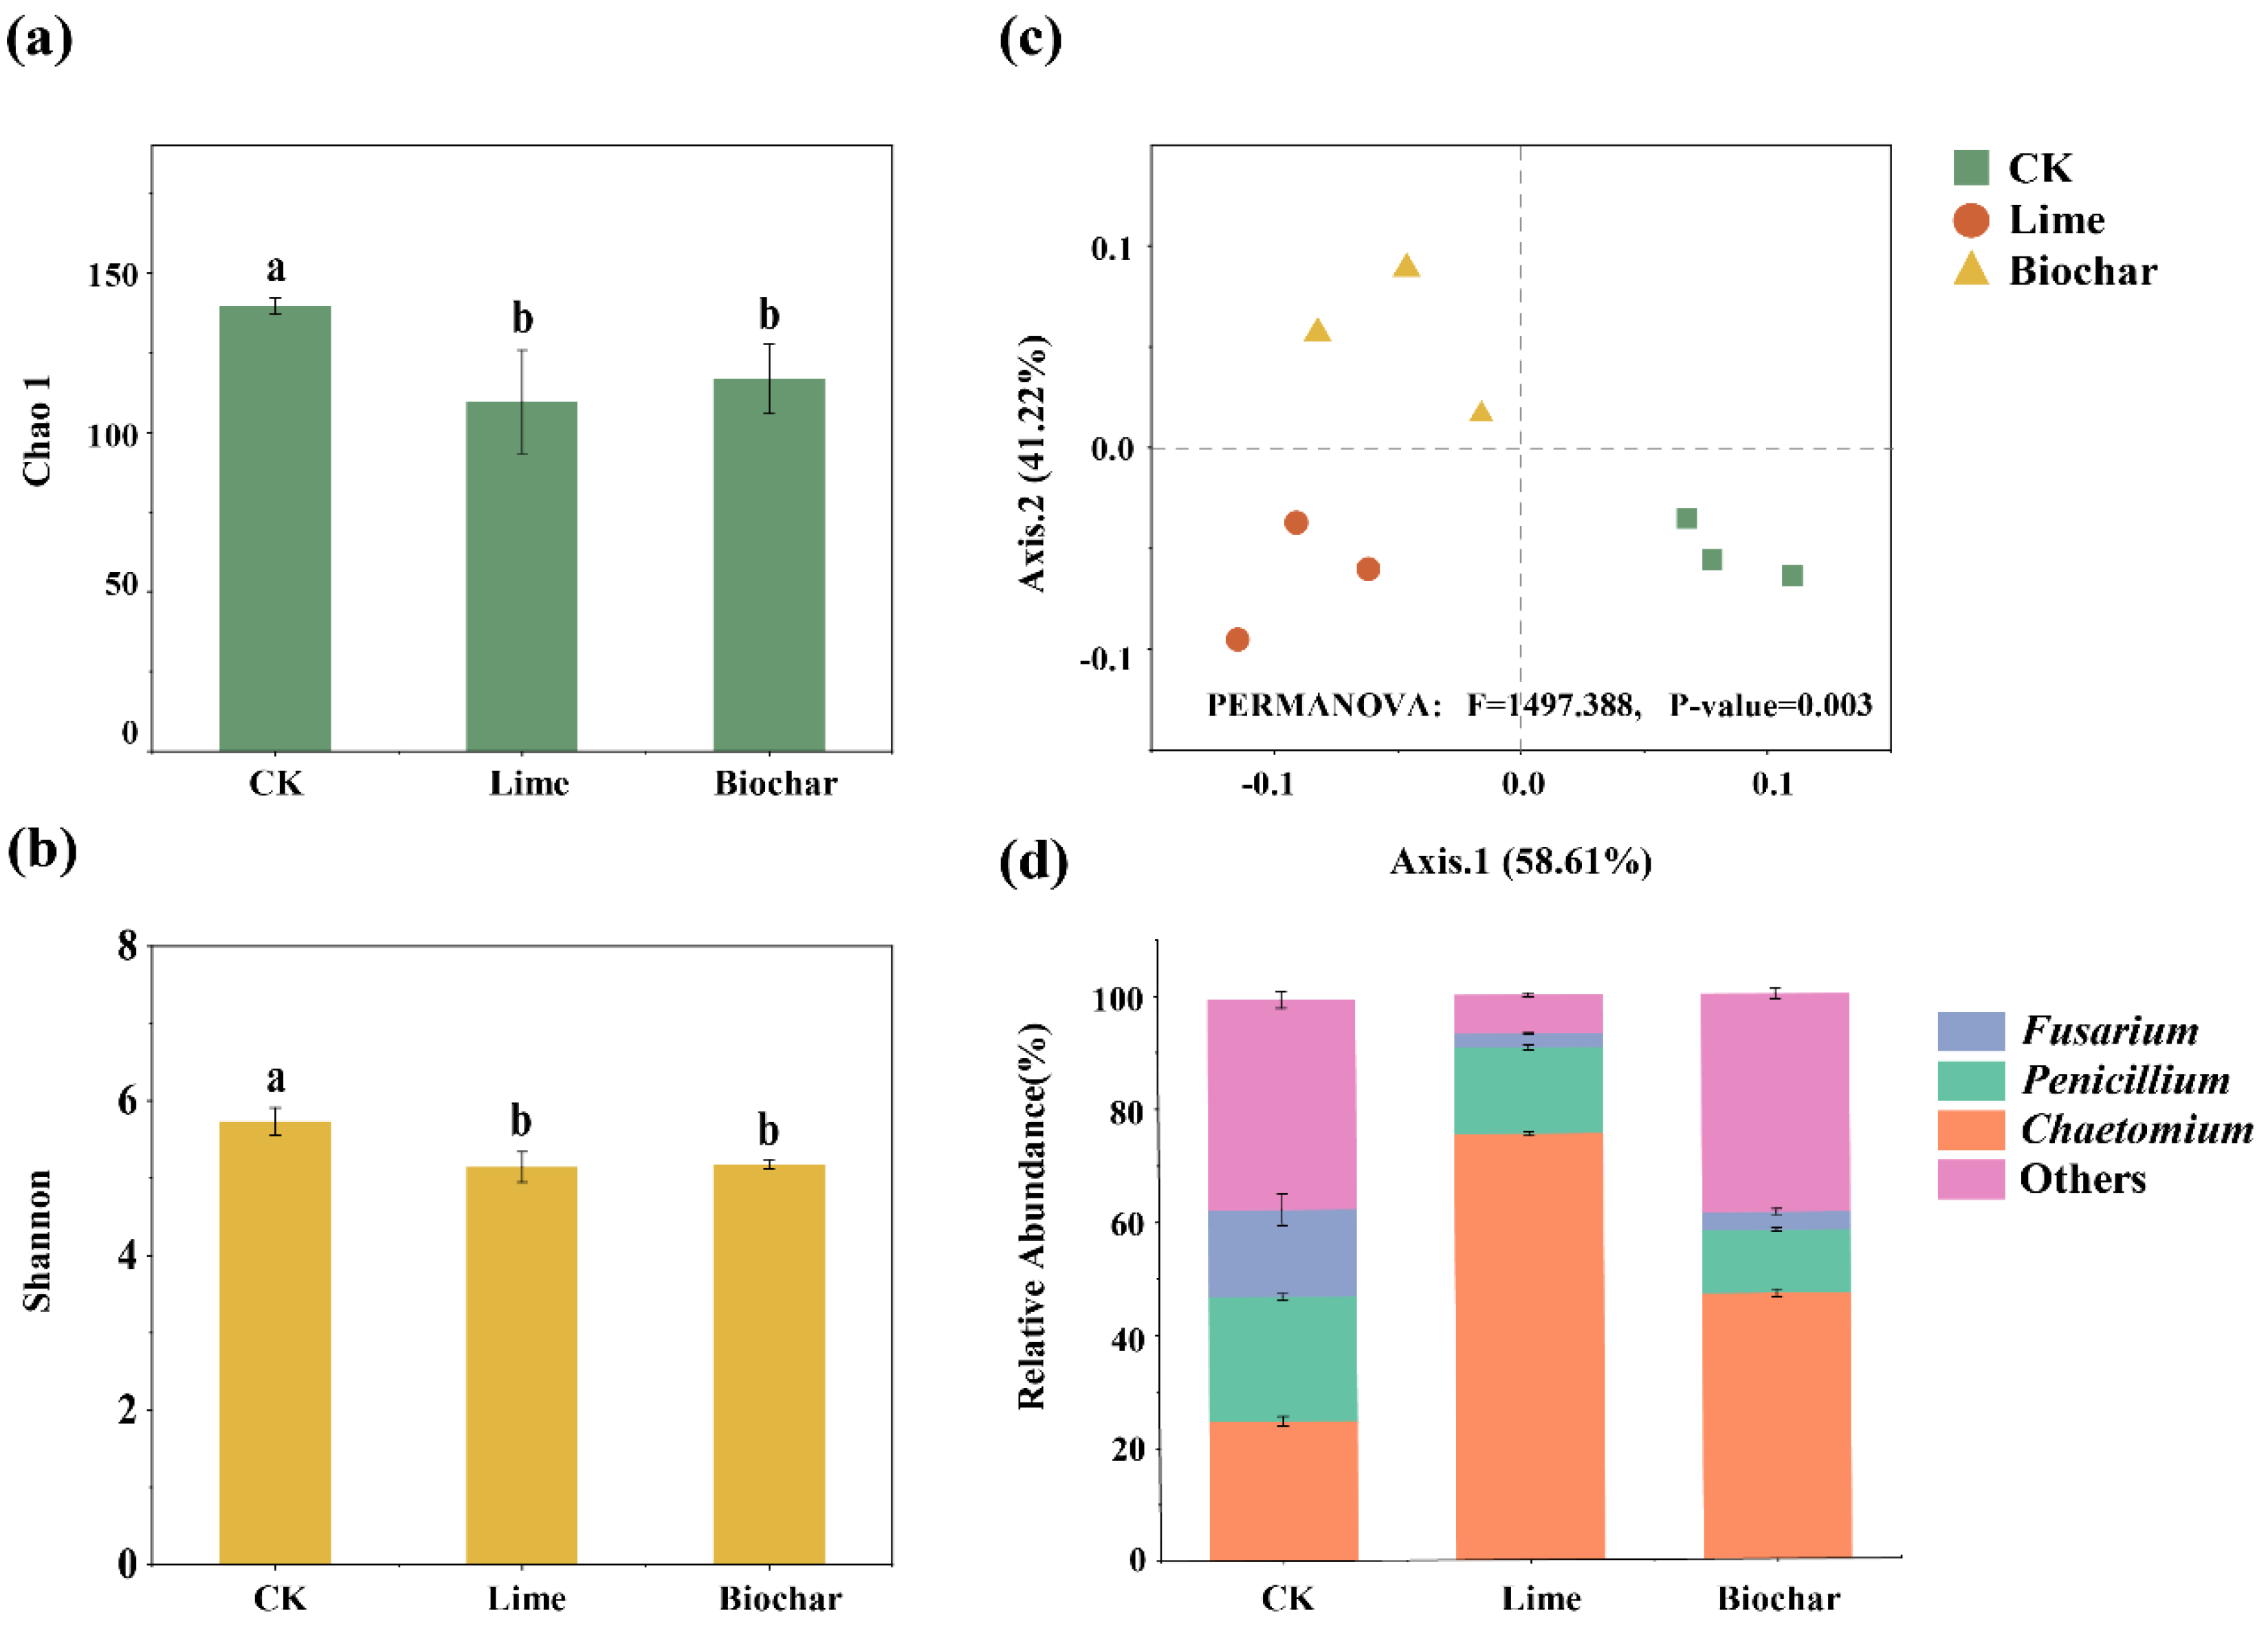
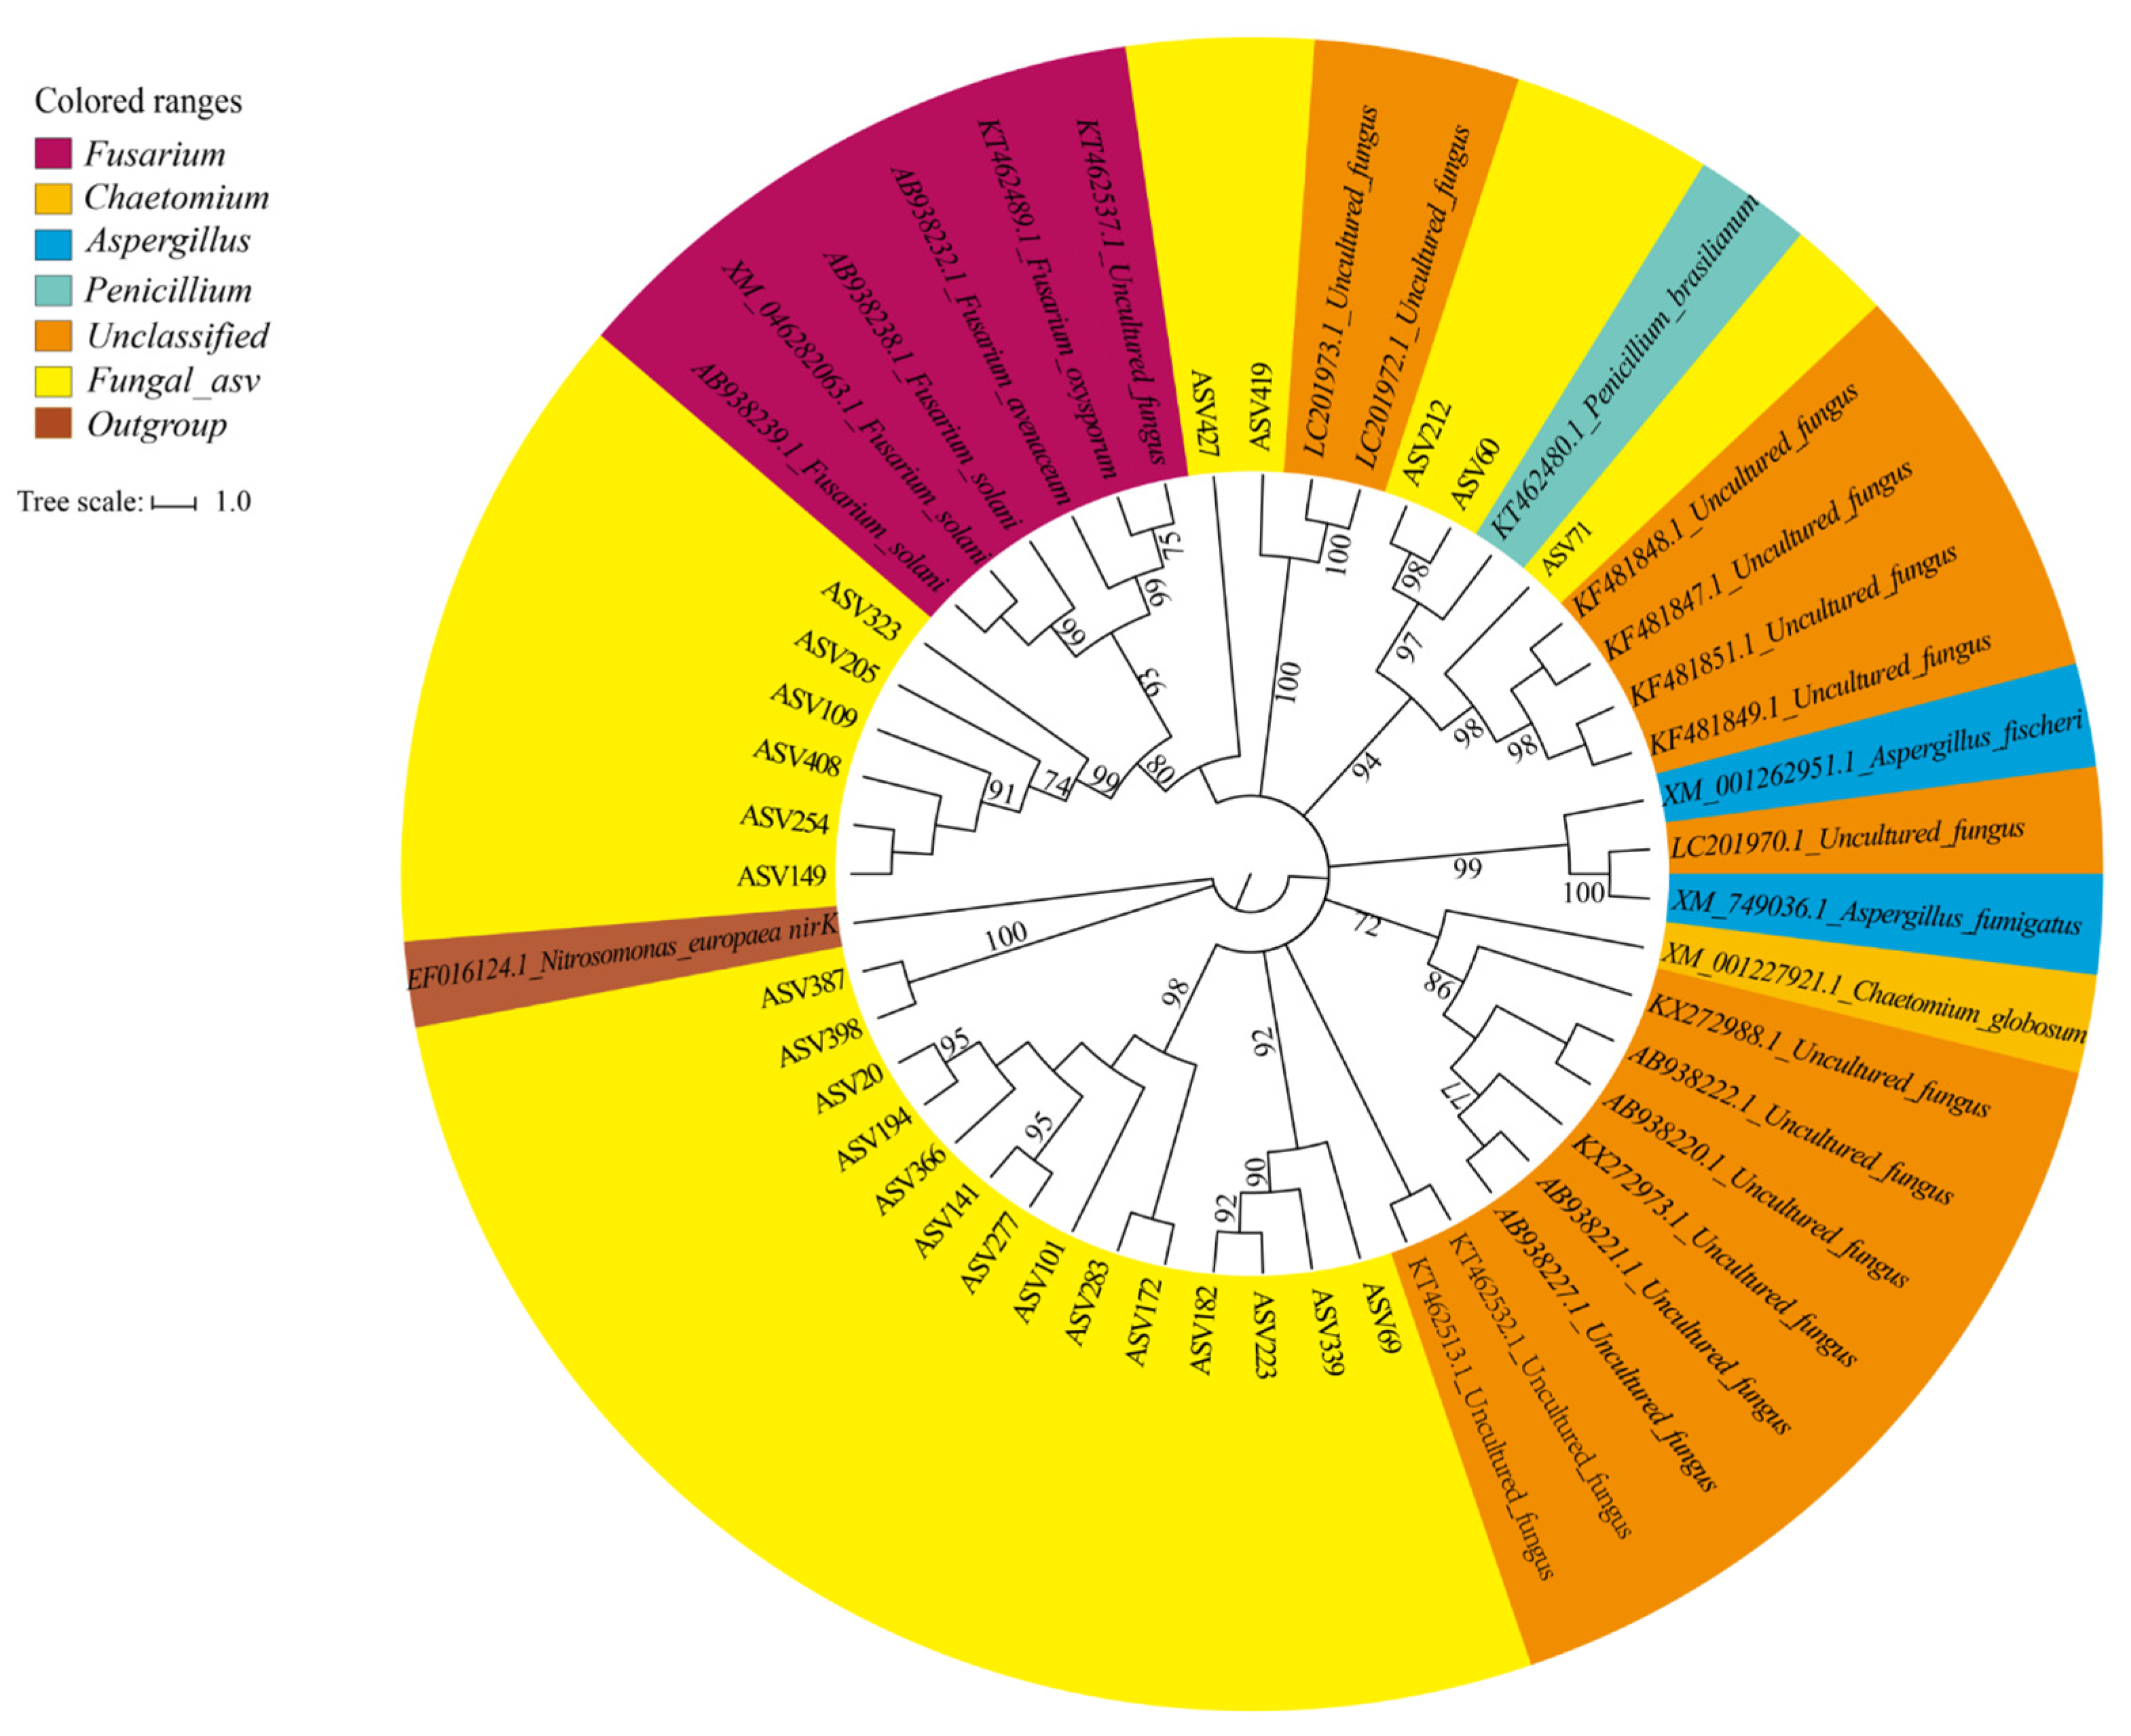
3.5. Diversity and Composition of Fungal Denitrifiers

We obtained a total of 221,832 high-quality sequences from nine samples with a mean of 24,648 reads per sample. In comparison to CK, treatment with either lime or biochar resulted in a significant reduction in the alpha diversity indexes of fungal nirK-containing species, as determined by Chao 1 and Shannon (Figure 5a,b). Principle coordinates analysis (PCoA) was employed to assess the difference in the fungal nirK community structure among the different treatments (Figure 5c). The fungal nirK community structure exhibited significant variations among the different treatment groups. The first and second axis together explained 99.83% of fungal nirK community variability. PERMONOVA analysis also revealed that lime and biochar treatments significantly influenced fungal nirk community structure (F = 1497.388, p = 0.003).
The dominant fungal denitrifying community was the phyla Ascomycota belonging to the families Nectriaceae, Aspergillaceae, and Chaetomiaceae, with the predominant genera Fusarium, Penicillium and Chaetomium (Figure 5d). Compared to CK, biochar and lime amendment both reduced the relative proportion of genera Fusarium and Penicillium and significantly increased the relative proportion of genera Chaetomium. The top 25 fungal nirK OTUs are shown with a phylogenetic tree in Figure 6. The predominant OTUs belonged to environmental fungi with ambiguous taxonomic classification. The cumulative N2O emissions were positively associated with the relative proportion of genera Fusarium (r = 0.936, p < 0.001) and Penicillium (r = 0.982, p < 0.001), while negatively correlated with genera Chaetomium (r = −0.9697, p = 0.037) (Table S2).

4. Discussion

Biochar and lime are good acid-neutralizing materials to adjust soil pH and improve soil health for agricultural purposes [24,40]. Soil pH has been widely observed to influence net N2O emissions by altering microbial-driven N-cycling processes [20,21]. However, comparative effects of distinct pH-raising materials such as lime or biochar on N2O emissions and related microbial mechanisms are rarely revealed. In this study, lime and biochar were added to reach the same final soil pH, allowing for the assessment of comparative effects on N2O emissions and related N-cycling functional microbes. Results revealed biochar was better as an acid-neutralizing material for lowering N2O emissions than lime. The reduced N2O emissions coincided with the suppression of nirK-containing fungal denitrifier abundance and changes in fungal community composition. Our results comprehensively informed how N2O emissions and underlying microbial characteristics respond to lime and biochar amendment in tropical tea soils.
Lime amendment to acidic soils significantly decreased N2O emissions in this study, this deduction was further confirmed by significantly negative correlations of soil pH with N2O emissions (Figure S3). The lime application significantly improved soil pH, a vital factor in the regulation of N2O production and reduction via affecting N cycling microbes [27,33]. Some research reports observed that lime-treated soil emitted higher N2O emissions relative to untreated soil due to the inorganic N contents increased via organic N mineralization [20,41]. In contrast, our results showed lime-treated soils resulted in a significant decrease at the beginning of incubation, but increased net mineralization rates after 45-day incubation (Figure S1a). Inconsistent results are likely due to the differences in soil characteristics and microbial communities responding to adjusted soil pH [42]. Net nitrification rates were strongly increased by lime amendment after 45-day incubation, while N2O emissions significantly decreased (Figure S1b). These results showed that nitrification was most likely a minor mechanism involved in N2O emissions. Decreased N2O emissions followed by the lime amendment are likely linked with the denitrification process and related functional microbes in the present soil.
In comparison with lime amendment, biochar treatment reduced cumulative N2O emissions by 30%, indicating biochar is a better acid-neutralizing material for mitigating N2O emissions. Meanwhile, the relatively higher net nitrification rates and lower N2O emissions in the biochar treatment suggest biochar might play a greater role than lime by inhibiting denitrification [43]. However, our results are contrary to a previous finding that biochar or lime amendment significantly increased N2O emissions, due to increased nitrification rates in subtropical tea soil [3]. In addition to the “liming effect” of biochar on N cycling, biochar could increase soil porosity and aeration, inhibiting denitrification and leading to a decrease in N2O production [37]. Furthermore, biochar governs adsorption properties and decreases mineral N availability, thus suppressing N2O emissions [44]. Similarly, our results showed that biochar obviously decreased NO3 concentration in the first 14 days of incubation thus reducing N2O emissions. Differences in findings demonstrate the effects of biochar on N2O emissions may closely depend on its intrinsic characteristics.
The potential effects of biochar or lime on N2O emissions can be linked to the abundance, diversity, and composition of microbial communities [4,20,36]. However, existing studies have primarily focused on bacterial-driven N2O production or consumption pathways [28,35,36]. Here, we demonstrate that the application of biochar or lime significantly increased the population of bacterial nitrifiers (e.g., AOB, comammox) while reducing bacterial denitrifiers’ numbers (e.g., nirK-, nirS- and nosZ-type denitrifiers) (Figure 3). AOB and comammox communities potentially contribute more to nitrification activity in the lime or biochar-treated soil relative to AOA because of the increased copy numbers of AOB and comammox amoA genes. This enhanced the fit with the increased net nitrification rates in the selected soil. Some studies suggest that the increased AOB and comammox abundance with biochar or lime application could be attributed primarily to the “liming effect” which facilitates the growth of these communities, increasing nitrification rates [26,31,45]. The negative associations between AOB and comammox amoA gene copy numbers and N2O emissions suggest that these functional communities have minimal contributions to N2O emissions in acidic tea plantation soils. Furthermore, the decline in bacterial nirK, nirS, and nosZ gene copy numbers implies that the bacterial denitrification process was inhibited by biochar or lime amendments ultimately resulting in reduced bacterial-driven N2O emissions.
In addition to the investigation of ammonia oxidizers (AOA, AOB, comammox) and bacterial denitrifiers, biochar and lime amendment both significantly impacted the abundance, diversity and composition of the nirK-containing fungal community. The positive associations of fungal nirK gene abundance with N2O emission rate in biochar or lime-treated soils indicated nirK-containing denitrifying fungi due to lack of N2O reductase enzyme may also be the key contributors to N2O emissions in tropical tea soil ecosystems [19]. Soil pH partially explained the response of the fungal community to biochar or lime amendment which was supported by a strong negative association between soil pH and nirK-containing fungal denitrifiers abundance (Figure S2). In addition to soil pH, biochar or lime amendment influenced fungal diversity and community structure and thus regulated N2O emissions. The decrease in the alpha diversity of nirK-containing fungal denitrifiers under biochar or lime-amended soils was significantly associated with N2O emissions (Table S2). Furthermore, we also found Fusarium and Penicillium genera belonging to Ascomycota phyla were the fungi mainly responsible for the N2O emissions (Table S2). The relative abundances of Fusarium and Penicillium genera are strongly decreased by biochar or lime amendment, which have lower N2O emissions compared with CK. Fusarium and Penicillium genera are reported to produce N2O via respiratory denitrification and are often the major fungal genus connected to N2O emission [17,46]. Therefore, these fungal communities are very likely restrained by biochar or lime amendment, resulting in decreased N2O emissions.

5. Conclusions

Our study showed lime or biochar amendment significantly reduced N2O emissions, however, biochar was a better acid-neutralizing material for N2O emissions mitigation. The increased nitrification rates and decreased N2O emissions with lime or biochar amendment indicated denitrification might be the main pathway of N2O emissions. AOB and comammox abundances were positively connected to net nitrification rates but negatively connected to N2O emissions. This indicates AOB and comammox play a minor role in N2O emissions. Lime or biochar amendment both significantly reduced abundances of bacterial and fungal denitrifying genes. Only the decreased abundance of nirK-containing fungal denitrifiers was closely linked with the reduction in N2O emissions. According to random forest analysis, nirK-containing fungal denitrifiers were the dominant player to N2O emissions in tropical tea soils. Moreover, biochar or lime amendment both suppressed N2O emissions by restricting the growth of nirK-containing fungal denitrifiers and altering its alpha diversity and keystone species. Due to its stronger effects on nirK-containing fungal denitrifiers, biochar may reduce N2O emissions more than lime does. Altogether, data revealed the decrease in N2O emissions and the function of fungal communities in decreased N2O emissions with lime or biochar amendment.

Supplementary Materials

The following supporting information can be downloaded at: https://www.mdpi.com/article/10.3390/agronomy13041144/s1, Figure S1: Net mineralization rate and net nitrification rate on days 7 and 45 under different treatments; Figure S2: Pearson correlation analysis between soil properties, net mineralization rate, net nitrification rate, N-cycling gene abundance, and N2O emission rate on day 7 and 45 under different treatments; Figure S3: Linear regression analysis of N2O emission rates with the copy numbers of nitrifiers (AOA, AOB, comammox amoA), bacterial denitrifiers (bacterial nirK, nirS, and nosZ), and fungal denitrifiers (fungal nirK) on day 7 and 45 under different treatments; Table S1: Quantitative PCR primer sets and amplification conditions used in this study; Table S2: Pearson correlation analysis between a-diversity indexes, the dominant genus of nirK-containing fungal denitrifiers, β-diversity and cumulative N2O emissions. References [47,48,49,50,51,52] are cited in the supplementary materials.

Author Contributions

Conceptualization, S.L. and Q.W.; methodology, Z.Z.; software, Z.W.; validation, Z.W.; formal analysis, S.L.; investigation, Q.W.; resources, S.L.; data curation, Z.W.; writing—original draft preparation, Q.W.; writing—review and editing, S.L. and Q.W.; visualization, Z.Z.; supervision, Y.R.; project administration, Q.W.; funding acquisition, Q.W. All authors have read and agreed to the published version of the manuscript.

Funding

This study was financially supported by Hainan Provincial Natural Science Foundation of China (322MS031).

Data Availability Statement

Not applicable.

Acknowledgments

We thank the anonymous reviewers for reviewing our manuscript.

Conflicts of Interest

The authors declare no conflict of interest.

References

  1. Ravishankara, A.R.; Daniel, J.S.; Portmann, R.W. Nitrous oxide (N2O): The dominant ozone-depleting substance emitted in the 21st century. Science 2009, 326, 123–125. [Google Scholar] [CrossRef] [PubMed]
  2. Tian, H.; Yang, J.; Xu, R.; Lu, C.; Canadell, J.G.; Davidson, E.A.; Jackson, R.B.; Arneth, A.; Chang, J.; Ciais, P.; et al. Global soil nitrous oxide emissions since the preindustrial era estimated by an ensemble of terrestrial biosphere models: Magnitude, attribution, and uncertainty. Glob. Chang. Biol. 2019, 25, 640–659. [Google Scholar] [CrossRef] [PubMed]
  3. Wang, J.; Zhang, B.; Tian, Y.; Zhang, H.; Cheng, Y.; Zhang, J. A soil management strategy for ameliorating soil acidification and reducing nitrification in tea plantations. Eur. J. Soil Biol. 2018, 88, 36–40. [Google Scholar] [CrossRef]
  4. Wu, Y.; Li, Y.; Wang, H.; Wang, Z.; Fu, X.; Shen, J.; Wang, Y.; Liu, X.; Meng, L.; Wu, J. Response of N2O emissions to biochar amendment on a tea field soil in subtropical central China: A three-year field experiment. Agric. Ecosyst. Environ. 2021, 318, 107473. [Google Scholar] [CrossRef]
  5. Liu, S.; Lin, F.; Wu, S.; Ji, C.; Sun, Y.; Jin, Y.; Li, S.; Li, Z.; Zou, J. A meta-analysis of fertilizer-induced soil NO and combined NO+N2O emissions. Glob. Chang. Biol. 2017, 23, 2520–2532. [Google Scholar] [CrossRef]
  6. Butterbach-Bahl, K.; Baggs, E.M.; Dannenmann, M.; Kiese, R.; Zechmeister-Boltenstern, S. Nitrous oxide emissions from soils: How well do we understand the processes and their controls? (Review). Philos. Trans. R. Soc. B Biol. Sci. 2013, 368, 20130122. [Google Scholar] [CrossRef]
  7. Daims, H.; Lebedeva, E.V.; Pjevac, P.; Han, P.; Herbold, C.; Albertsen, M.; Jehmlich, N.; Palat-inszky, M.; Vierheilig, J.; Bulaev, A.; et al. Complete nitrification by Nitrospira bacteria. Nature 2015, 528, 504–509. [Google Scholar] [CrossRef]
  8. Prosser, J.I.; Hink, L.; Gubry-Rangin, C.; Nicol, G.W. Nitrous oxide production by ammonia oxidizers: Physiological diversity, niche differentiation and potential mitigation strategies. Glob. Chang. Biol. 2020, 26, 103–118. [Google Scholar] [CrossRef]
  9. Shaw, L.J.; Nicol, G.W.; Smith, Z.; Fear, J.; Prosser, J.I.; Baggs, E.M. Nitrosospira spp. can produce nitrous oxide via a nitrifier denitrification pathway. Environ. Microbiol. 2006, 8, 214–222. [Google Scholar] [CrossRef]
  10. Hink, L.; Nicol, G.W.; Prosser, J.I. Archaea produce lower yields of N2O than bacteria during aerobic ammonia oxidation in soil. Environ. Microbiol. 2017, 19, 4829–4837. [Google Scholar] [CrossRef]
  11. Kits, K.D.; Jung, M.Y.; Vierheilig, J.; Pjevac, P.; Sedlacek, C.J.; Liu, S.; Herbold, C.; Stein, L.Y.; Richter, A.; Wissel, H.; et al. Low yield and abiotic origin of N2O formed by the complete nitrifier Nitrospira inopinata. Nat. Commun. 2019, 10, 1836. [Google Scholar] [CrossRef] [PubMed]
  12. Hu, H.W.; Chen, D.L.; He, J.Z. Microbial regulation of terrestrial nitrous oxide formation: Understanding the biological pathways for prediction of emission rates. FEMS Microbiol. Rev. 2015, 39, 729–749. [Google Scholar] [CrossRef] [PubMed]
  13. Santoro, A.E.; Boehm, A.B.; Francis, C.A. Denitrifier community composition along a nitrate and salinity gradient in a coastal aquifer. Appl. Environ. Microbiol. 2006, 72, 2102–2109. [Google Scholar] [CrossRef]
  14. Shoun, H.; Fushinobu, S.; Jiang, L.; Kim, S.W.; Wakagi, T. Fungal denitrification and nitric oxide reductase cytochrome P450nor. Phil. Trans. R. Soc. B Biol. Sci. 2012, 367, 1186–1194. [Google Scholar] [CrossRef] [PubMed]
  15. Wei, W.; Isobe, K.; Shiratori, Y.; Nishizawa, T.; Ohte, N.; Otsuka, S.; Senoo, K. N2O emission from cropland field soil through fungal denitrification after surface applications of organic fertilizer. Soil Biol. Biochem. 2014, 69, 157–167. [Google Scholar] [CrossRef]
  16. Wankel, S.D.; Ziebis, W.; Buchwald, C.; Charoenpong, C.; Beer, D.; Dentinger, J.; Xu, Z.; Zengler, K. Evidence for fungal and chemodenitrification based N2O flux from nitrogen impacted coastal sediments. Nat. Commun. 2017, 8, 15595. [Google Scholar] [CrossRef]
  17. Lourenço, K.S.; Costa, O.Y.A.; Cantarella, H.; Kuramae, E.E. Ammonia-oxidizing bacteria and fungal denitrifier diversity are associated with N2O production in tropical soils. Soil Biol. Biochem. 2022, 166, 108563. [Google Scholar] [CrossRef]
  18. Zhong, L.; Wang, S.; Xu, X.; Wang, Y.; Rui, Y.; Zhou, X.; Shen, Q.; Wang, J.; Jiang, L.; Luo, C.; et al. Fungi regulate the response of the N2O production process to warming and grazing in a Tibetan grassland. Biogeosciences 2018, 15, 4447–4457. [Google Scholar] [CrossRef]
  19. Zheng, N.; Yu, Y.; Wang, J.; Chapman, S.J.; Yao, H.; Zhang, Y. The conversion of subtropical forest to tea plantation changes the fungal community and the contribution of fungi to N2O production. Environ. Pollut. 2020, 265, 115106. [Google Scholar] [CrossRef]
  20. Baggs, E.M.; Smales, C.L.; Bateman, E.J. Changing pH shifts the microbial source as well as the magnitude of N2O emission from soil. Biol. Fertil. Soils 2010, 46, 793–805. [Google Scholar] [CrossRef]
  21. Blum, J.M.; Su, Q.X.; Ma, Y.J.; Valverde-Perez, B.; Domingo-Felez, C.; Jensen, M.M.; Smets, B.F. The pH dependency of N-converting enzymatic processes, pathways and microbes: Effect on net N2O production. Environ. Microbiol. 2018, 20, 1623–1640. [Google Scholar] [CrossRef] [PubMed]
  22. Chen, H.; Mothapo, N.V.; Shi, W. Soil moisture and pH control relative contributions of fungi and bacteria to N2O production. Microb. Ecol. 2015, 69, 180–191. [Google Scholar] [CrossRef]
  23. Wang, J.; Cui, W.; Che, Z.; Liang, F.; Wen, Y.; Zhan, M.; Dong, X.; Jin, W.; Dong, Z.; Song, H. Effects of synthetic nitrogen fertilizer and manure on fungal and bacterial contributions to N2O production along a soil acidity gradient. Sci. Total Environ. 2021, 753, 142011. [Google Scholar] [CrossRef]
  24. Dai, Z.M.; Zhang, X.; Tang, C.; Muhammad, N.; Wu, J.; Brookes, P.C.; Xu, J.M. Potential role of biochars in decreasing soil acidification—A critical review. Sci. Total Environ. 2017, 581, 601–611. [Google Scholar] [CrossRef] [PubMed]
  25. Shaaban, M.; Wu, Y.; Khalid, M.S.; Peng, Q.A.; Xu, X.Y.; Wu, L.; Younas, A.; Bashir, S.; Mo, Y.L.; Lin, S.; et al. Reduction in soil N2O emissions by pH manipulation and enhanced nosZ gene transcription under different water regimes. Environ. Pollut. 2018, 235, 625–631. [Google Scholar] [CrossRef] [PubMed]
  26. Ji, C.; Li, S.; Geng, Y.; Yuan, Y.; Zhi, J.; Yu, K.; Han, Z.; Wu, S.; Liu, S.; Zou, J. Decreased N2O and NO emissions associated with stimulated denitrification following biochar amendment in subtropical tea plantations. Geoderma 2020, 365, 114223. [Google Scholar] [CrossRef]
  27. Qu, Z.; Wang, J.; Almoy, T.; Bakken, L.R. Excessive use of nitrogen in Chinese agriculture results in high N2O/(N2O+N2) product ratio of denitrification, primarily due to acidification of the soils. Glob. Chang. Biol. 2014, 20, 1685–1698. [Google Scholar] [CrossRef]
  28. Jha, N.; Palmada, T.; Berben, P.; Saggar, S.; Luo, J.; McMillan, A.M.S. Influence of liming-induced pH changes on nitrous oxide emission, nirS, nirK and nosZ gene abundance from applied cattle urine in allophanic and fluvial grazed pasture soils. Biol. Fertil. Soils 2020, 56, 811–824. [Google Scholar] [CrossRef]
  29. Nicol, G.W.; Leininger, S.; Schleper, C.; Prosser, J.I. The influence of soil pH on the diversity, abundance and transcriptional activity of ammonia oxidizing archaea and bacteria. Environ. Microbiol. 2008, 10, 2966–2978. [Google Scholar] [CrossRef]
  30. Cuhel, J.; Simek, M.; Laughlin, R.J.; Bru, D.; Cheneby, D.; Watson, C.J.; Philippot, L. Insights into the effect of soil pH on N2O and N2 emissions and denitrifier community size and activity. Appl. Environ. Microbiol. 2010, 76, 1870–1878. [Google Scholar] [CrossRef]
  31. Che, J.; Zhao, X.Q.; Zhou, X.; Jia, Z.J.; Shen, R.F. High pH-enhanced soil nitrification was associated with ammonia-oxidizing bacteria rather than archaea in acidic soils. Appl. Soil Ecol. 2015, 85, 21–29. [Google Scholar] [CrossRef]
  32. Zhang, M.M.; Alves, R.J.E.; Zhang, D.D.; Han, L.L.; He, J.Z.; Zhang, L.M. Time-dependent shifts in populations and activity of bacterial and archaeal ammonia oxidizers in response to liming in acidic soils. Soil Biol. Biochem. 2017, 112, 77–89. [Google Scholar] [CrossRef]
  33. Liu, Y.; Tang, H.; Muhammad, A.; Huang, G. Emission mechanism and reduction counter measures of agricultural greenhouse gases—A review. Greenh. Gas. Sci. Technol. 2019, 9, 160–174. [Google Scholar] [CrossRef]
  34. Harter, J.; Krause, H.M.; Schuettler, S.; Ruser, R.; Fromme, M.; Scholten, T.; Kappler, A.; Behrens, S. Linking N2O emissions from biochar-amended soil to the structure and function of the N-cycling microbial community. ISME J. 2014, 8, 660–674. [Google Scholar] [CrossRef] [PubMed]
  35. Chen, H.; Yin, C.; Fan, X.; Ye, M.; Peng, H.; Li, T.; Zhao, Y.; Wakelin, S.A.; Chu, G.; Liang, Y. Reduction of N2O emission by biochar and/or 3,4-dimethylpyrazole phosphate (DMPP) is closely linked to soil ammonia oxidizing bacteria and nosZI-N2O reducer populations. Sci. Total Environ. 2019, 694, 133658. [Google Scholar] [CrossRef] [PubMed]
  36. Lin, Y.; Ding, W.; Liu, D.; He, T.; Yoo, G.; Yuan, J.; Chen, Z.; Fan, J. Wheat straw-derived biochar amendment stimulated N2O emissions from rice paddy soils by regulating the amoA genes of ammonia-oxidizing bacteria. Soil Biol. Biochem. 2017, 113, 89–98. [Google Scholar] [CrossRef]
  37. Cayuela, M.L.; Zwieten, L.; Singh, B.P.; Jeffery, S.; Roig, A.; Sanchez-Monedero, M.A. Biochar’s role in mitigating soil nitrous oxide emissions: A review and meta-analysis. Agric. Ecosyst. Environ. 2014, 191, 5–16. [Google Scholar] [CrossRef]
  38. Aamer, M.; Shaaban, M.; Hassan, M.U.; Huang, G.; Liu, Y.; Tang, H.Y.; Rasul, F.; Ma, Q.; Li, Z.; Rasheed, A.; et al. Biochar mitigates the N2O emissions from acidic soil by increasing the nosZ and nirK gene abundance and soil pH. J. Environ. Manag. 2020, 255, 109891. [Google Scholar] [CrossRef]
  39. Sánchez-García, M.; Roig, A.; Sánchez-Monedero, M.; Cayuela, M.L. Biochar increases N2O emissions produced by nitrification-mediated pathways. Front. Environ. Sci. 2014, 2, 25. [Google Scholar]
  40. Cheng, Y.; Zhang, H.; Chen, Z.; Wang, J.; Cai, Z.; Sun, N.; Wang, S.; Zhang, J.B.; Chang, S.X.; Xu, M.; et al. Contrasting effects of different pH-raising materials on N2O emissions in acidic upland soils. Eur. J. Soil Sci. 2021, 72, 432–445. [Google Scholar] [CrossRef]
  41. Higgins, S.; Laughlin, R.J.; Watson, C.J. Antecedent effect of lime on nitrous oxide and dinitrogen emissions from grassland soils. Nutr. Cycl. Agroecosyst. 2013, 95, 219–229. [Google Scholar] [CrossRef]
  42. Page, K.L.; Allen, D.E.; Dalal, R.C.; Slattery, W. Processes and magnitude of CO2, CH4, and N2O fluxes from liming of Australian acidic soils: A review. Aust. J. Soil Res. 2009, 47, 747–762. [Google Scholar] [CrossRef]
  43. Xu, H.J.; Wang, X.H.; Li, H.; Yao, H.Y.; Su, J.Q.; Caporaso, Y.G. Biochar impacts soil microbial community composition and nitrogen cycling in an acidic soil planted with rape. Environ. Sci. Technol. 2014, 48, 9391–9399. [Google Scholar] [CrossRef]
  44. Song, Y.; Li, Y.; Cai, Y.; Fu, S.; Luo, Y.; Wang, H.; Liang, C.; Lin, Z.; Hu, S.; Li, Y.; et al. Biochar decreases soil N2O emissions in Moso bamboo plantations through decreasing labile N concentrations, N-cycling enzyme activities and nitrification/denitrification rates. Geoderma 2019, 348, 135–145. [Google Scholar] [CrossRef]
  45. Li, S.; Chen, D.W.; Wang, C.; Chen, D.; Wang, Q. Reduced nitrification by biochar and/or nitrification inhibitor is closely linked with the abundance of comammox Nitrospira in a highly acidic sugarcane soil. Biol. Fertil. Soils 2020, 56, 1219–1228. [Google Scholar] [CrossRef]
  46. Mothapo, N.V.; Chen, H.; Cubeta, M.A.; Shi, W. Nitrous oxide producing activity of diverse fungi from distinct agroecosystems. Soil Biol. Biochem. 2013, 66, 94–101. [Google Scholar] [CrossRef]
  47. Rotthauwe, J.H.; Witzel, K.P.; Liesack, W. The ammonia monooxygenase structural gene amoA as a functional marker: Molecular fine-scale analysis of natural ammonia-oxidizing populations. Appl. Environ. Microbiol. 1997, 63, 4704–4712. [Google Scholar] [CrossRef]
  48. Tourna, M.; Freitag, T.E.; Nicol, G.W.; Prosser, J.I. Growth, activity and temperature responses of ammonia-oxidizing archaea and bacteria in soil microcosms. Environ. Microbiol. 2008, 10, 1357–1364. [Google Scholar] [CrossRef] [PubMed]
  49. Fowler, S.J.; Palomo, A.; Dechesne, A.; Mines, P.D.; Smets, B.F. Comammox Nitrospira are abundant ammonia oxidizers in diverse groundwater-fed rapid sand filter communities. Environ. Microbiol. 2018, 20, 1002–1015. [Google Scholar] [CrossRef] [PubMed]
  50. Henry, S.; Baudoin, E.; López-Gutiérrez, J.C.; Martin-Laurent, F.; Brauman, A.; Philippot, L. Quantification of denitrifying bacteria in soils by nirK gene targeted real-time PCR. J. Microbiol. Methods 2004, 59, 327–335. [Google Scholar] [CrossRef] [PubMed]
  51. Throbäck, I.N.; Enwall, K.; Jarvis, A.; Hallin, H. Reassesing PCR primers targeting nirS, nirK and nosZ genes for community surveys of ammonia oxidizer bacteria with DGGE. FEMS Microbiol. Ecol. 2004, 49, 401–417. [Google Scholar] [CrossRef] [PubMed]
  52. Henry, S.; Bru, D.; Stres, B.; Hallet, S.; Philippot, L. Quantitative detection of the nosZ gene, encoding nitrous oxide reductase, and comparison of the abundances of 16S rRNA, narG, nirK, and nosZ genes in soils. Appl. Environ. Microbiol. 2006, 72, 5181–5189. [Google Scholar] [CrossRef] [PubMed]
Figure 1. Changes in soil pH (a), NH4+−N (b) and NO3−N (c) during the 45−day incubation period under different treatments. Error bars indicate standard deviations (n = 3).
Agronomy 13 01144 g001
Figure 2. N2O (a) and CO2 (c) emission rate and cumulative N2O (b) and CO2 (d) emissions during the 45−day incubation period for CK, lime, and biochar treatments. Error bars indicate standard deviations (n = 3). Means followed by different letters indicate significant differences between treatments at p < 0.05.
Agronomy 13 01144 g002
Figure 3. The copy numbers of AOA (a), AOB (b), comammox amoA (c), bacterial nirS (d), nirK (e), nosZI (f) and fungal nirK (g) genes copies on days 7 and 45 under different treatments. Error bars indicate standard deviations (n = 3). Means followed by different letters indicate significant differences between treatments at p < 0.05.
Agronomy 13 01144 g003
Figure 4. Random forest analysis to assess the predictor importance of N cycling gene abundance and environmental factors as drivers for the N2O production.
Agronomy 13 01144 g004
Figure 5. The alpha diversity of nirK−containing fungal denitrifiers including Chao 1 index (a) and Shannon index (b) on day 45. PCoA analysis of community structure based on Bray–Curtis matrix at OTU level (c). The relative abundance of nirK-containing fungal denitrifiers (%) at the genus level under different treatments (d). Error bars indicate standard deviations (n = 3). Means followed by different letters indicate significant differences between treatments at p < 0.05.
Agronomy 13 01144 g005
Figure 6. Maximum likelihood phylogenetic tree depicting the top 25 Fungi nirK OTUs, along with relevant reference sequences from NCBI databases. The analysis employed the Nitrosomonas europaea nirK as the outgroup and MAGE11.0 software for sequence alignment. The resulting dendrogram was built using a tree map derived from maximum likelihood inference, with 1000 Ultrafast bootstrap and guidance value of 0.70.
Agronomy 13 01144 g006
Disclaimer/Publisher’s Note: The statements, opinions and data contained in all publications are solely those of the individual author(s) and contributor(s) and not of MDPI and/or the editor(s). MDPI and/or the editor(s) disclaim responsibility for any injury to people or property resulting from any ideas, methods, instructions or products referred to in the content.

