Analysis of Near-Infrared Spectral Properties and Quantitative Detection of Rose Oxide in Wine
Abstract
1. Introduction
2. Materials and Methods
2.1. Materials
2.2. Instruments and Reagents
2.3. Methods
2.3.1. Sample Preparation and Data Acquisition
2.3.2. Data Pre-Processing and Outlier Rejection
2.3.3. Synergy Interval Partial Least Squares Regression (Si-PLSR)
2.3.4. External Validation
2.4. Data Analysis
3. Results
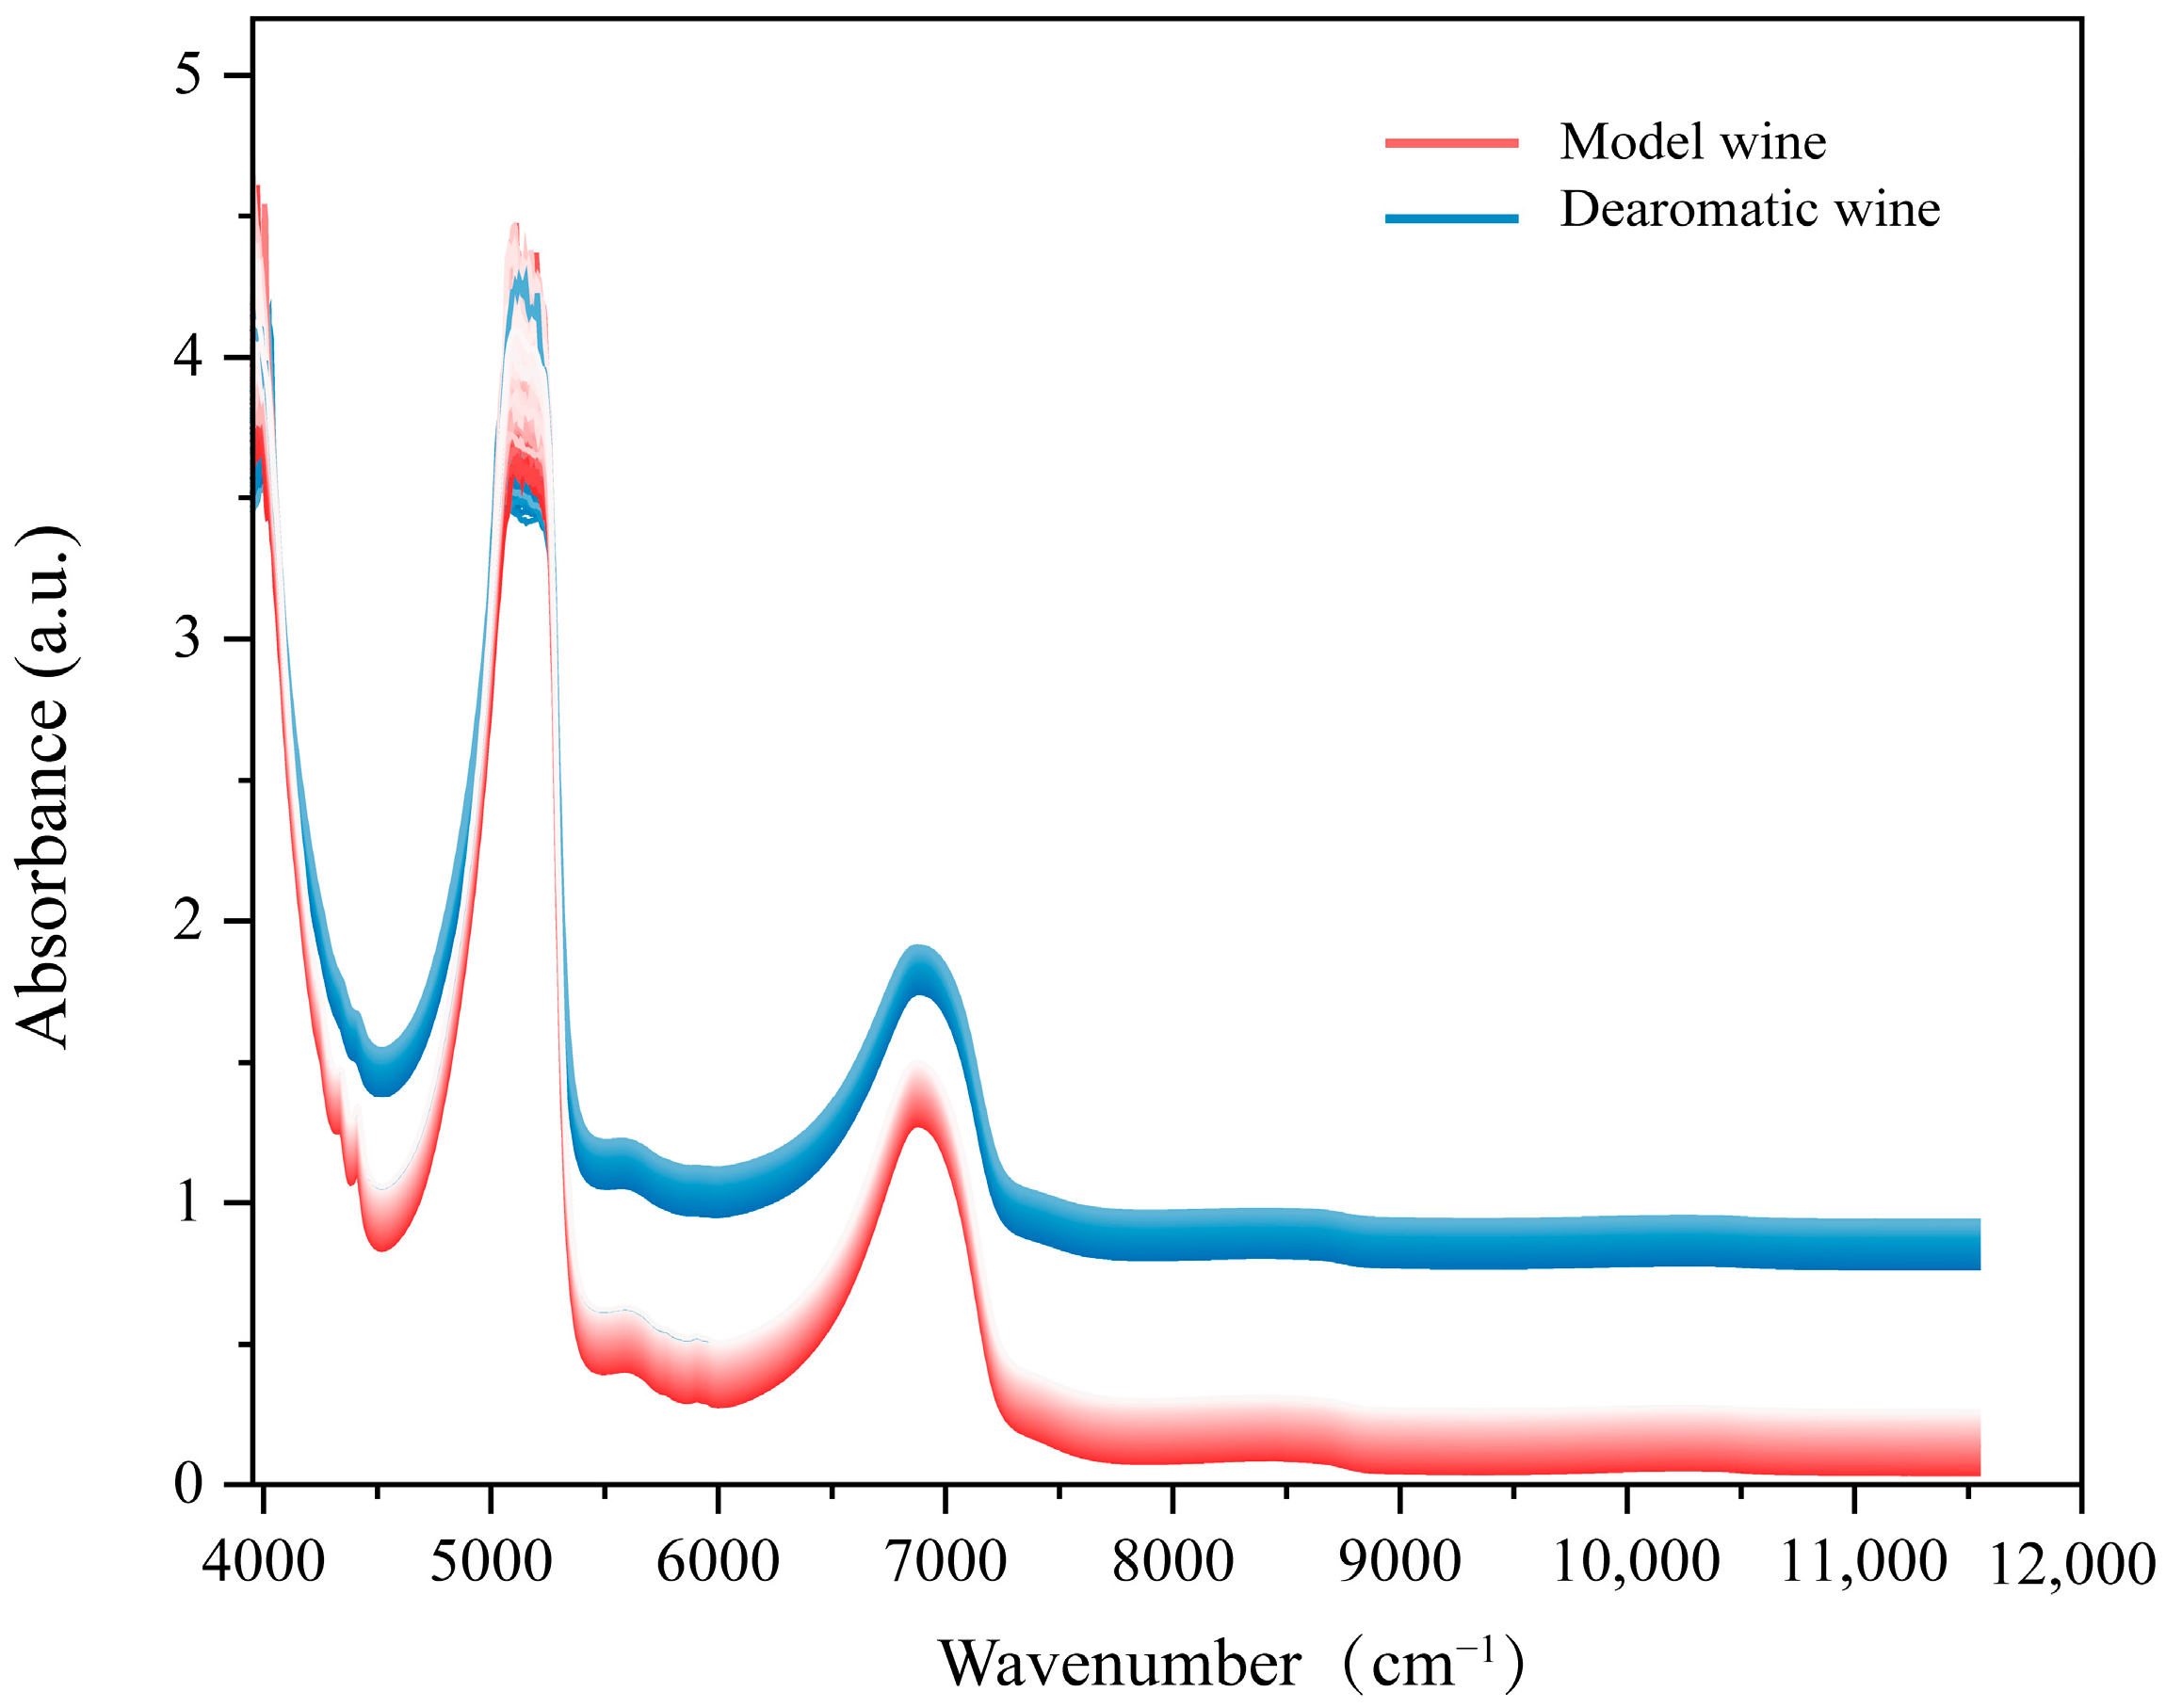
3.1. Original Spectral Analysis of Model and De-Aromatic Wine
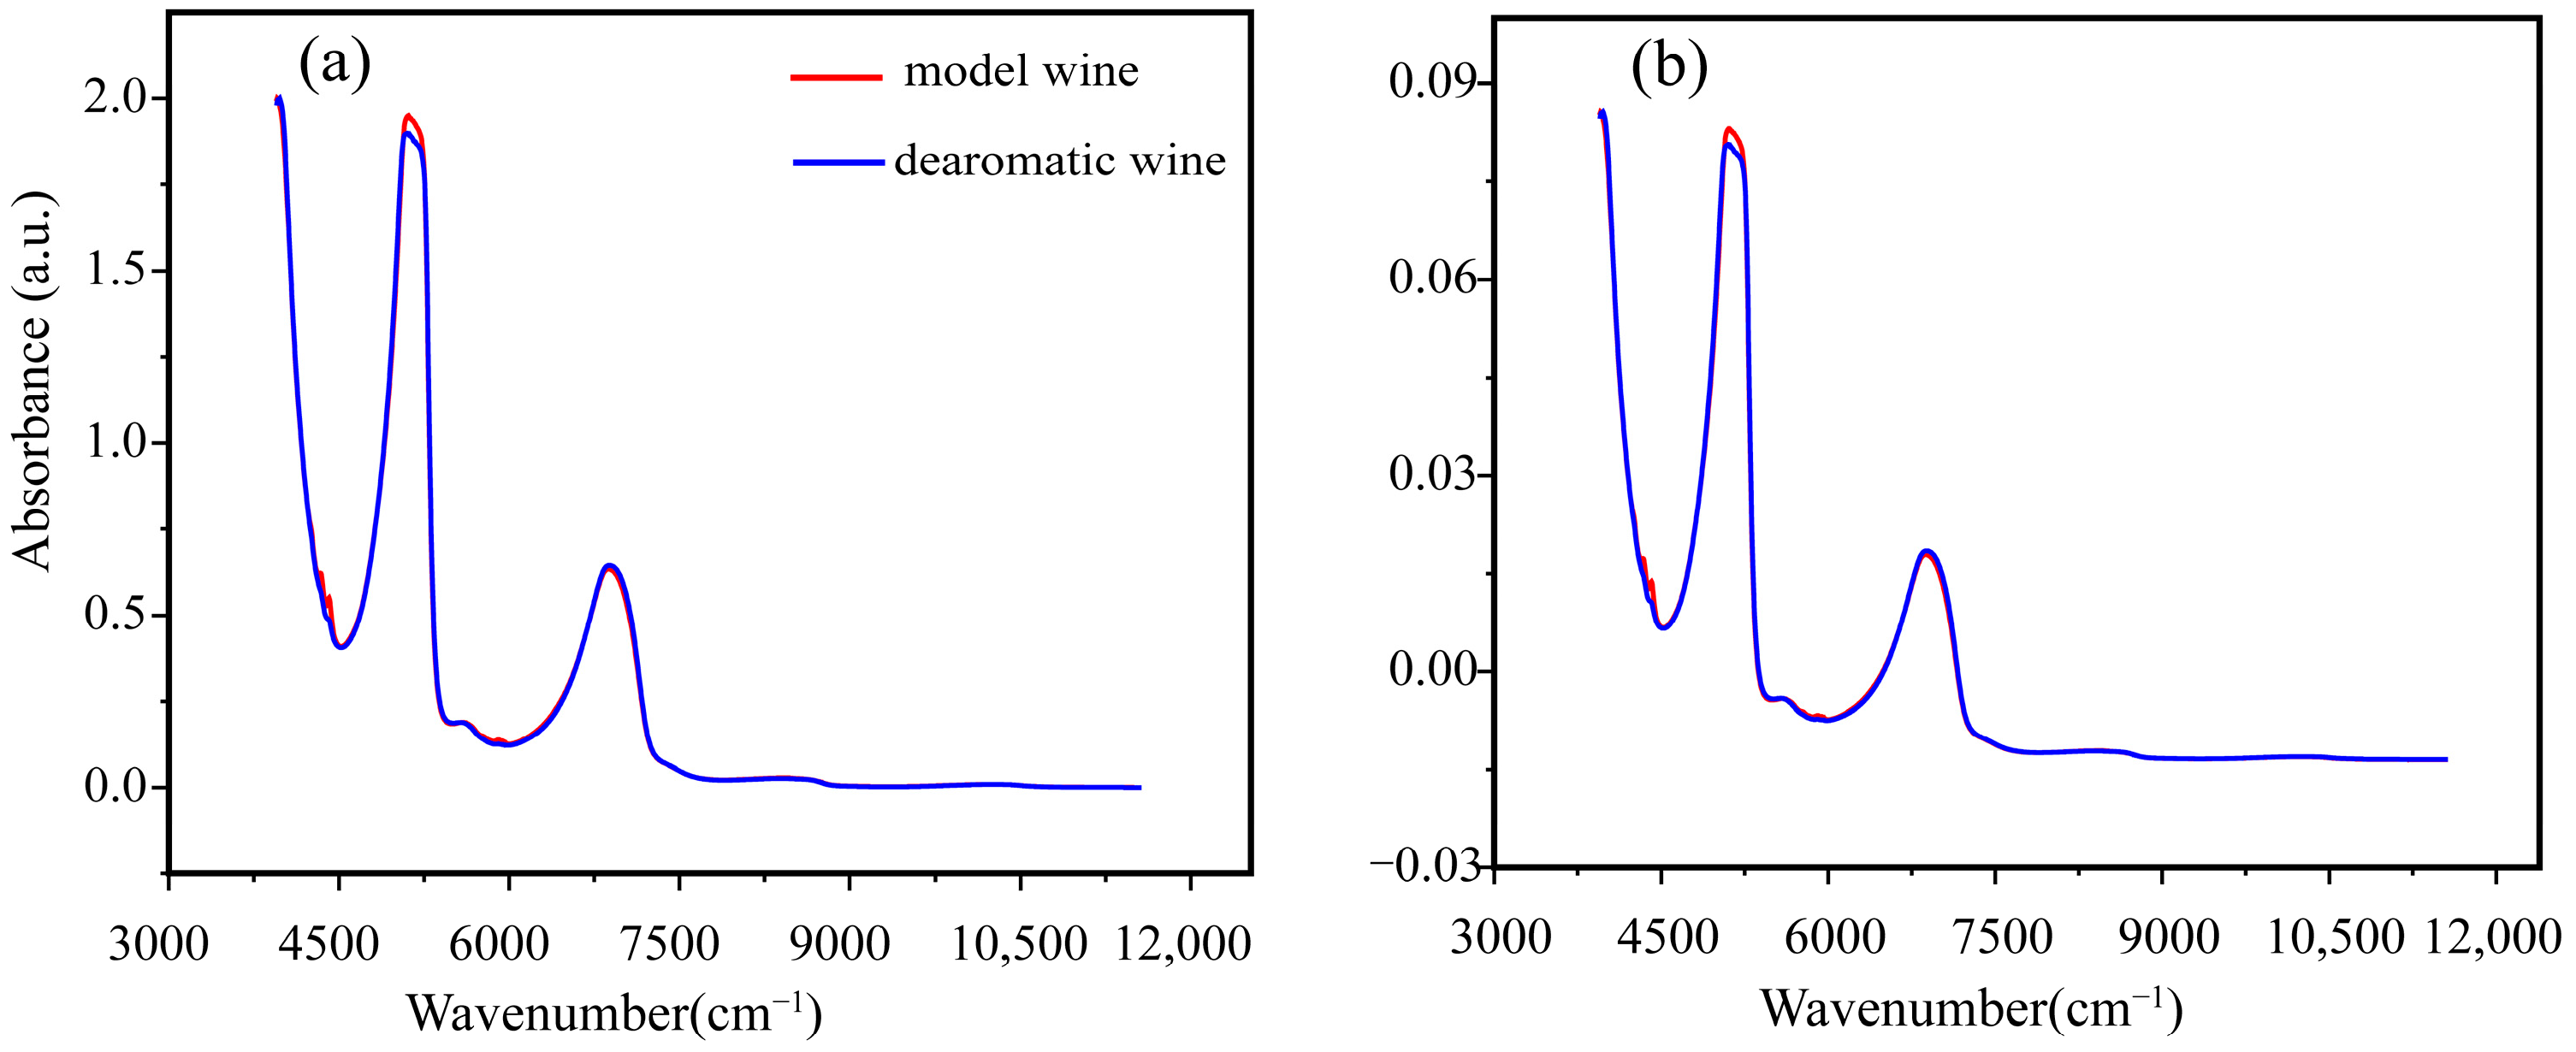
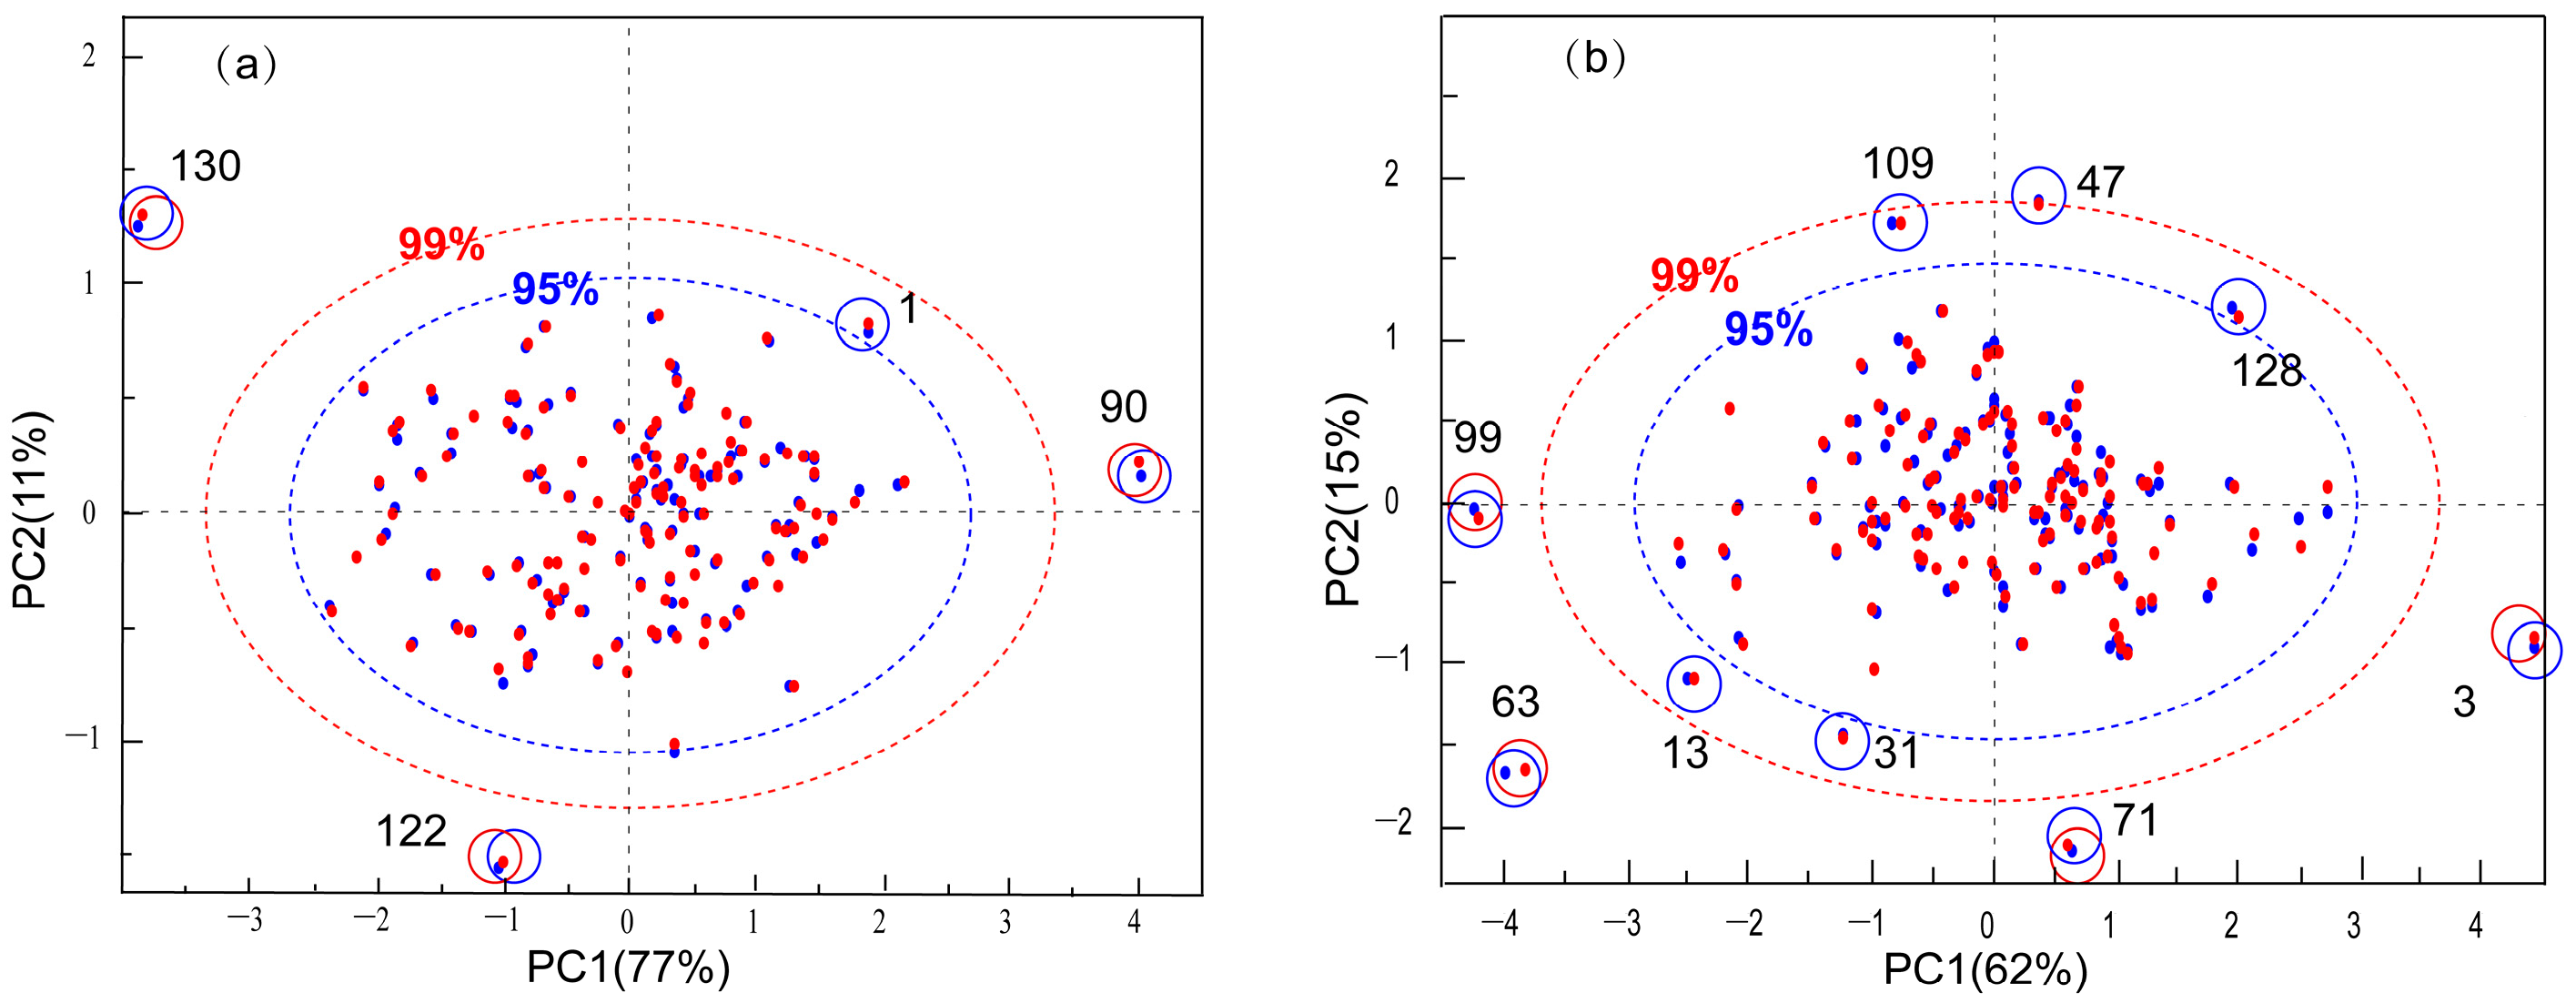
3.2. Spectral Pre-Processing and Outlier Rejection
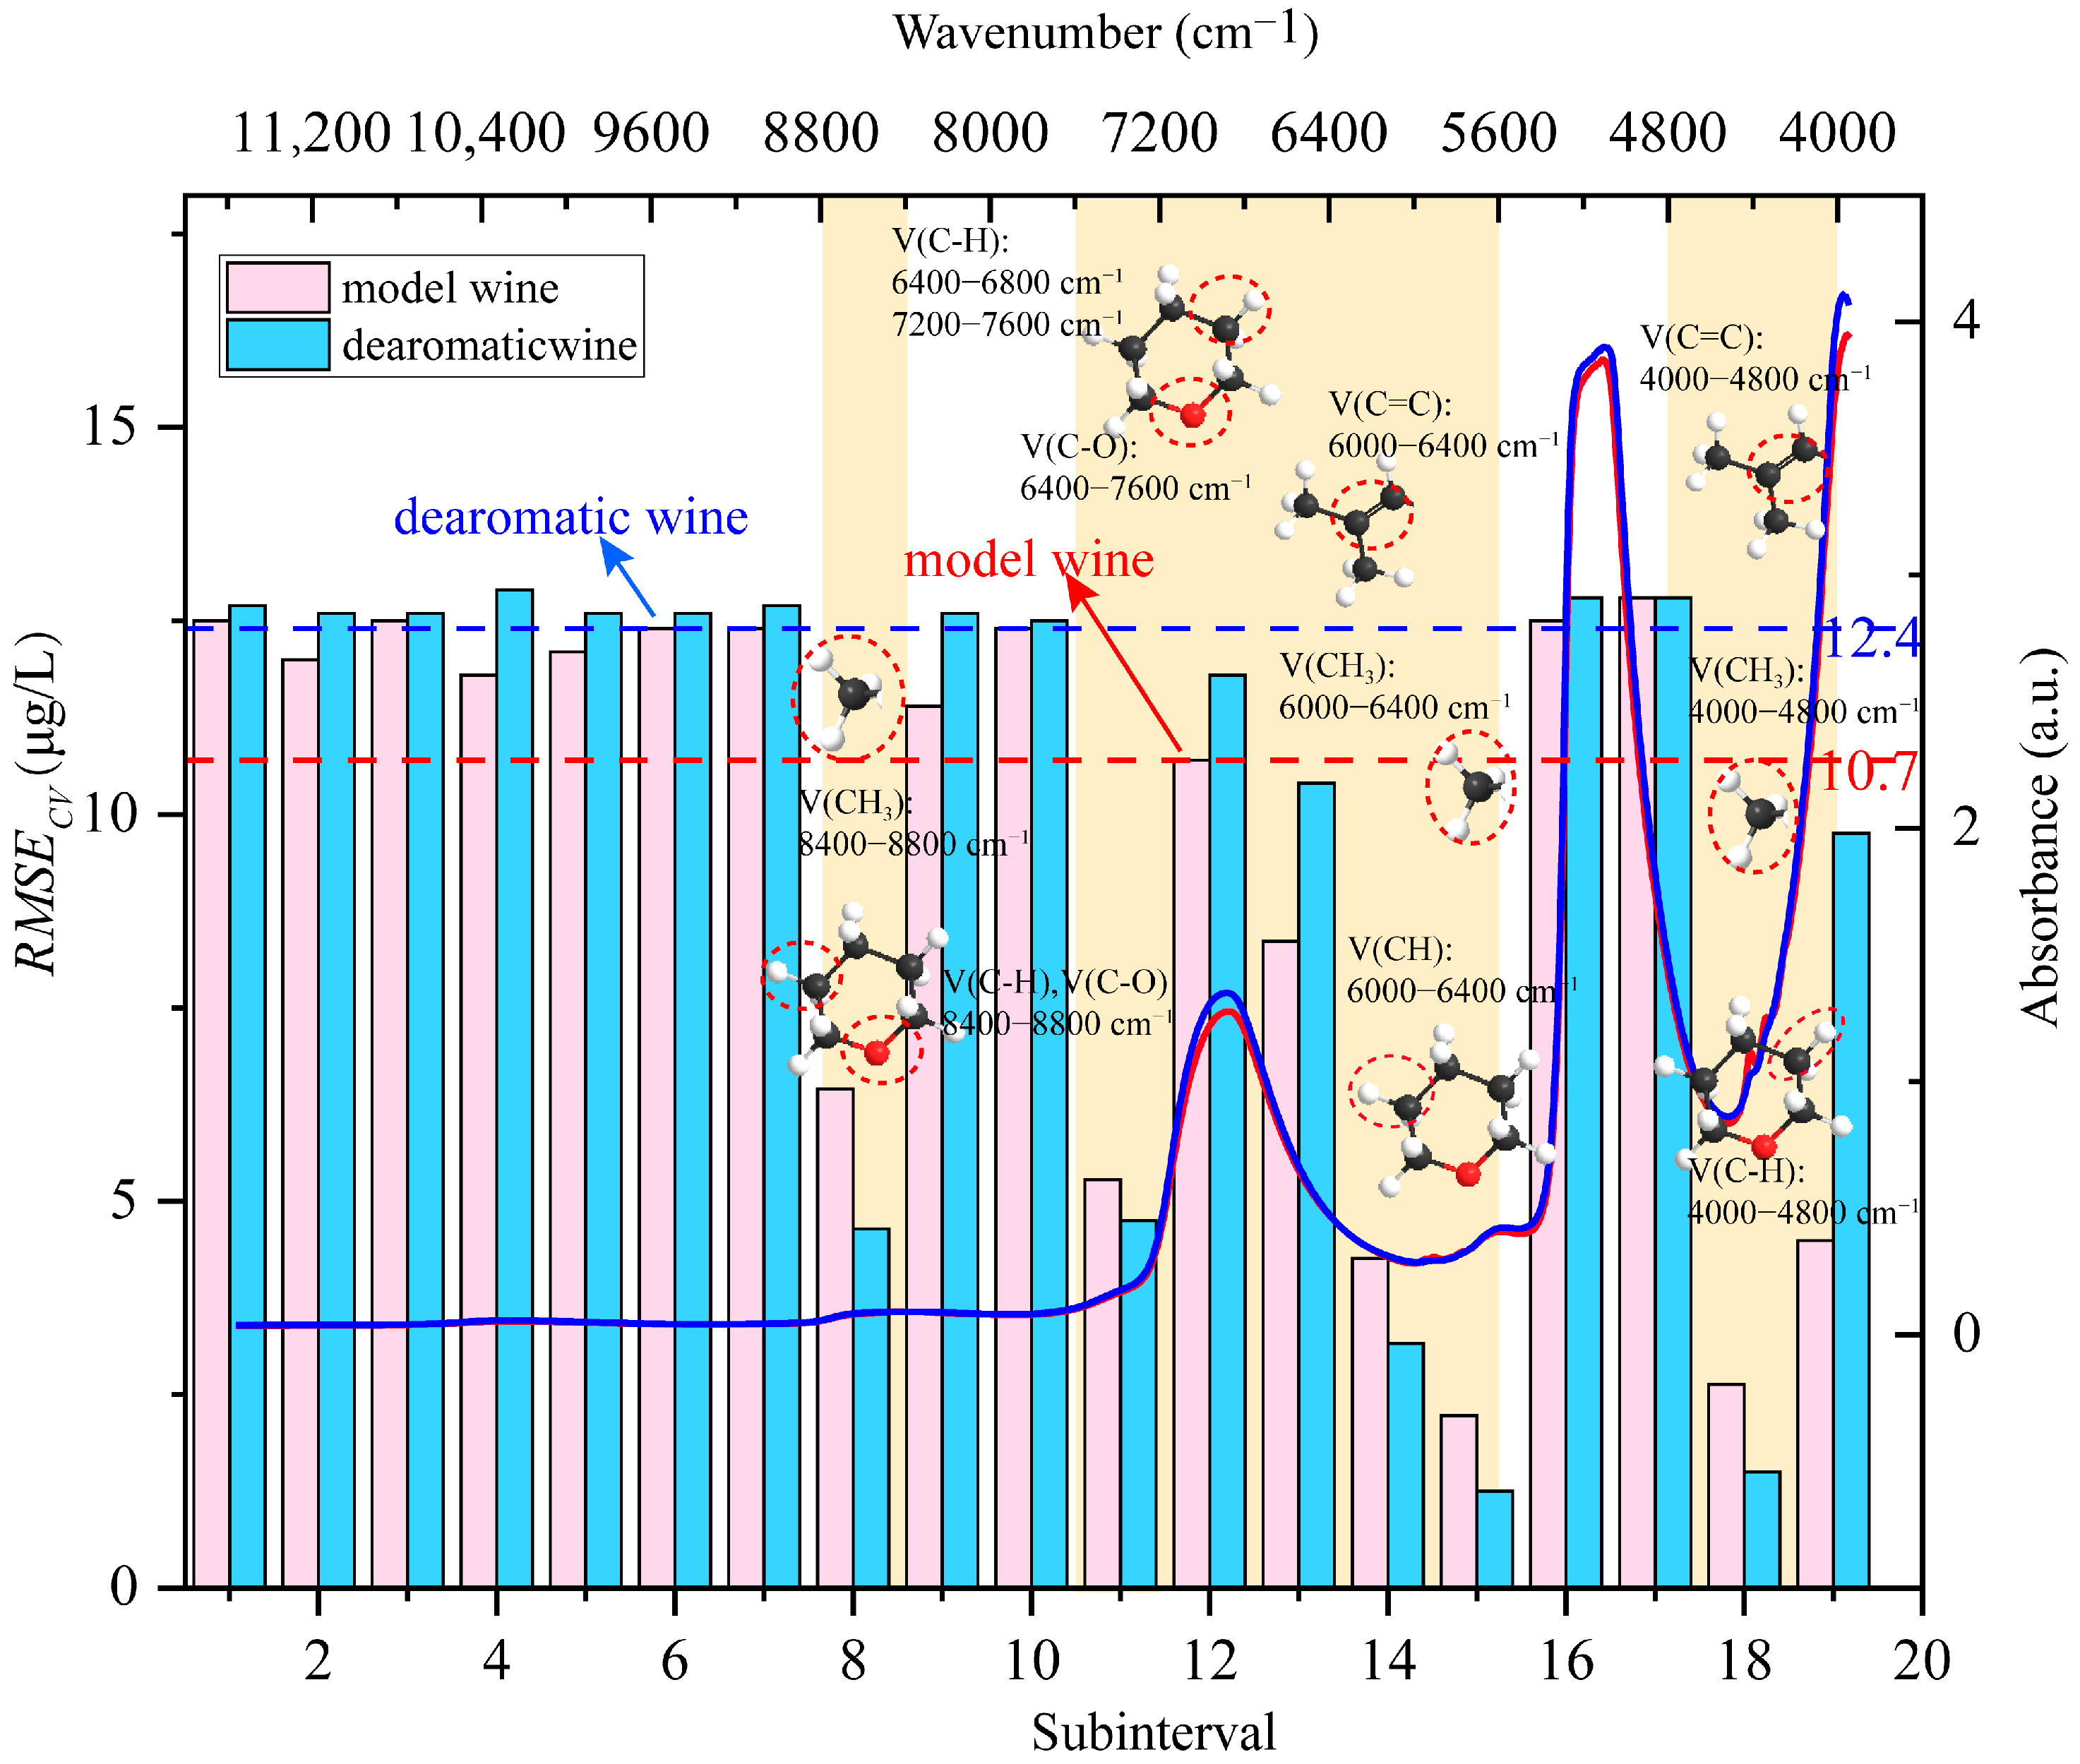
3.3. Si-PLS Analysis
3.4. External Validation
4. Discussion
4.1. Spectral Band Allocation of Rose Oxide
4.2. Potential of Near-Infrared Spectroscopy Models of Rose Oxide
5. Conclusions
Author Contributions
Funding
Data Availability Statement
Conflicts of Interest
References
- Ruiz-García, L.; Hellín, P.; Flores, P.; Fenoll, J. Prediction of Muscat aroma in table grape by analysis of rose oxide. Food Chem. 2014, 154, 151–157. [Google Scholar] [CrossRef] [PubMed]
- Chigo-Hernandez, M.M.; DuBois, A.; Tomasino, E. Aroma perception of rose oxide, linalool and α-terpineol combinations in Gewürztraminer wine. Fermentation 2022, 8, 30. [Google Scholar] [CrossRef]
- Tang, Z.; Zeng, X.; Brennan, M.; Zhong, H.; Niu, D.; Huo, Y. Characterization of aroma profile and characteristic aromas during lychee wine fermentation. J. Food Process. Pres. 2019, 43, e14003. [Google Scholar] [CrossRef]
- Bowen, A.J.; Reynolds, A.G. Odor potency of aroma compounds in Riesling and Vidal blanc Table Wines and Icewines by gas chromatography-olfactometry-mass spectrometry. J. Agric. Food Chem. 2012, 60, 2874–2883. [Google Scholar] [CrossRef] [PubMed]
- Zhao, L.L.; Ruan, S.L.; Yang, X.K.; Chen, Q.L.; Shi, K.; Lu, K.; He, L.; Liu, S.W.; Song, Y.B. Characterization of volatile aroma compounds in litchi (Heiye) wine and distilled spirit. Food Sci. Nutr. 2021, 9, 5914–5927. [Google Scholar] [CrossRef] [PubMed]
- Xu, Q.; Wang, H.; Lu, K.; Su, M.; Cai, J. Aroma Compounds Composition of "Rose Honey" Low-alcohol Rose Wine and the Influence of Commercial Yeast Strain. China Fruit Veg. 2020, 40, 49–55. [Google Scholar]
- Maslov, L.; Tomaz, I.; Mihaljević Žulj, M.; Jeromel, A. Aroma characterization of predicate wines from Croatia. Eur. Food Res. Technol. 2016, 243, 263–274. [Google Scholar] [CrossRef]
- Souza-Coutinho, M.; Brasil, R.; Souza, C.; Sousa, P.; Malfeito-Ferreira, M. Consumers Associate High-Quality (Fine) Wines with Complexity, Persistence, and Unpleasant Emotional Responses. Foods 2020, 9, 452. [Google Scholar] [CrossRef]
- Genisheva, Z.; Quintelas, C.; Mesquita, D.P.; Ferreira, E.C.; Oliveira, J.M.; Amaral, A.L. New PLS analysis approach to wine volatile compounds characterization by near infrared spectroscopy (NIR). Food Chem. 2018, 246, 172–178. [Google Scholar] [CrossRef]
- Bauer, R.; Nieuwoudt, H.; Bauer, F.F.; Kossmann, J.; Koch, K.R.; Esbensen, K.H. FTIR Spectroscopy for Grape and Wine Analysis. Anal. Chem. 2008, 80, 1371–1379. [Google Scholar] [CrossRef]
- Birenboim, M.; Chalupowicz, D.; Barel, S.; Chen, Y.; Falik, E.; Kengisbuch, D.; Shimshoni, J.A. Optimization of sweet basil harvest time and cultivar characterization using near-infrared spectroscopy, liquid and gas chromatography, and chemometric statistical methods. J. Sci. Food Agric. 2021, 102, 3325–3335. [Google Scholar] [CrossRef] [PubMed]
- Buratti, S.; Ballabio, D.; Giovanelli, G.; Dominguez, C.M.; Moles, A.; Benedetti, S.; Sinelli, N. Monitoring of alcoholic fermentation using near infrared and mid infrared spectroscopies combined with electronic nose and electronic tongue. Anal. Chim. Acta 2011, 697, 67–74. [Google Scholar] [CrossRef] [PubMed]
- Silva, S.D.; Feliciano, R.P.; Boas, L.V.; Bronze, M.R. Application of FTIR-ATR to Moscatel dessert wines for prediction of total phenolic and flavonoid contents and antioxidant capacity. Food Chem. 2014, 150, 489–493. [Google Scholar] [CrossRef]
- Cuq, S.; Lemetter, V.; Kleiber, D.; Levasseur-Garcia, C. Assessing macro- (P, K, Ca, Mg) and micronutrient (Mn, Fe, Cu, Zn, B) concentration in vine leaves and grape berries of vitis vinifera by using near-infrared spectroscopy and chemometrics. Comput. Electron. Agric. 2020, 179, 105841. [Google Scholar] [CrossRef]
- Champagne, E.; Bonin, M.; Royo, A.A.; Tremblay, J.P.; Raymond, P. Predicting terpene content in dried conifer shoots using near infrared spectroscopy. J. Near Infrared Spectrosc. 2020, 28, 308–314. [Google Scholar] [CrossRef]
- Yue, X.; Shi, P.; Tang, Y.; Zhang, H.; Ma, X.; Ju, Y.; Zhang, Z. Effects of methyl jasmonate on the monoterpenes of Muscat Hamburg grapes and wine. J. Sci. Food Agric. 2020, 101, 3665–3675. [Google Scholar] [CrossRef]
- Zhang, B.; Shen, J.; Duan, C.; Yan, G. Use of Indigenous Hanseniaspora vineae and Metschnikowia pulcherrima Co-fermentation With Saccharomyces cerevisiae to Improve the Aroma Diversity of Vidal Blanc Icewine. Front Microbiol. 2018, 9, 2303. [Google Scholar] [CrossRef]
- Cameleyre, M.; Lytra, G.; Tempere, S.; Barbe, J.C. Olfactory impact of higher alcohols on red wine fruity ester aroma expression in model solution. J. Agric. Food Chem. 2015, 63, 9777–9788. [Google Scholar] [CrossRef]
- Diwu, P.Y.; Bian, X.H.; Wang, Z.F.; Liu, W. Study on the Selection of Spectral Preprocessing Methods. Spectrosc. Spect. Anal. 2019, 39, 2800–2806. [Google Scholar]
- Bi, R.; Zhao, M. Online NIR modeling study based on PCA and Hotelling T2 distribution. Electron. Technol. Softw. Eng. 2021, 207, 189–191. [Google Scholar]
- Lu, B.; Liu, N.; Wang, X.; Hu, C.; Tang, X. A feasibility quantitative analysis of NIR spectroscopy coupled Si-PLS to predict coco-peat available nitrogen from rapid measurements. Comput. Electron. Agric. 2020, 173, 105400. [Google Scholar] [CrossRef]
- Li, Y.; Li, F.; Yang, X.; Guo, L.; Huang, F.; Chen, Z.; Chen, X.; Zheng, S. Quantitative analysis of glycated albumin in serum based on ATR-FTIR spectrum combined with SiPLS and SVM. Spectrochim. Acta A Mol. Biomol. Spectrosc. 2018, 201, 249–257. [Google Scholar] [CrossRef] [PubMed]
- Cai, J.; Wan, X.; Chen, Q. Feasibility study for the use of near-infrared spectroscopy in the quantitative analysis of TVB-N content in pork. Acta Opt. Sin. 2009, 29, 2808. [Google Scholar]
- Zhu, Z.; Chen, S.; Su, J.; Tao, Y. Correlation Analysis Between Amino Acids and Fruity Esters During Spine Grape Fermentation. Sci. Agric. Sin. 2020, 53, 2272–2284. [Google Scholar]
- Davis, J.C.; Koritzke, A.L.; Caravan, R.L.; Antonov, I.O.; Christianson, M.G.; Doner, A.C.; Osborn, D.L.; Sheps, L.; Taatjes, C.A.; Rotavera, B. Influence of the ether functional group on ketohydroperoxide formation in cyclic hydrocarbons: Tetrahydropyran and cyclohexane. J. Phys. Chem. A 2019, 123, 3634–3646. [Google Scholar] [CrossRef] [PubMed]
- Tosi, C.; Pinto, A. Near-infrared spectroscopy of hydrocarbon functional groups. Spectrochim. Acta A Mol. Biomol. Spectrosc. 1972, 28, 585–597. [Google Scholar] [CrossRef]
- Burns, D.A.; Ciurczak, E.W. Handbook of Near-Infrared Analysis; CRC Press: Beijing, China, 2007. [Google Scholar]
- Gerasimov, T.G.; Snavely, D.L. Vibrational photopolymerization of methyl methacrylate and quantitative analysis of polymerization results. Macromolecules 2002, 35, 5796–5800. [Google Scholar] [CrossRef]
- Smyth, H.E.; Cozzolino, D.; Cynkar, W.U.; Dambergs, R.G.; Sefton, M.; Gishen, M. Near infrared spectroscopy as a rapid tool to measure volatile aroma compounds in Riesling wine: Possibilities and limits. Anal. Bioanal. Chem. 2008, 390, 1911–1916. [Google Scholar] [CrossRef] [PubMed]
- Garde-Cerdán, T.; Lorenzo, C.; Alonso, G.L.; Salinas, M.R. Employment of near infrared spectroscopy to determine oak volatile compounds and ethylphenols in aged red wines. Food Chem. 2010, 119, 823–828. [Google Scholar] [CrossRef]


| Pre-Processing Methods | Model Wine | De-Aromatic Wine | ||||||
|---|---|---|---|---|---|---|---|---|
| MMN | 0.75 | 6.37 | 0.23 | 10.70 | 0.04 | 12.10 | 0.14 | 11.34 |
| VN | 0.78 | 5.97 | 0.31 | 10.10 | 0.06 | 11.90 | 0.03 | 12.30 |
| FD | 0.51 | 8.85 | 0.12 | 11.40 | 0.05 | 12.00 | 0.05 | 12.00 |
| SD | 0.14 | 11.34 | 0.09 | 11.80 | 0.06 | 11.90 | 0.09 | 11.80 |
| Sample Exclusion | RPD | |||||
|---|---|---|---|---|---|---|
| Model wine | All samples (except number 90, 122, and 130) | 0.78 | 5.93 | 0.44 | 9.03 | 1.33 |
| 1 | 0.79 | 5.79 | 0.47 | 8.67 | 1.38 | |
| De-aromatic wine | All samples (except number 3, 63, 71, and 99) | 0.61 | 7.95 | 0.11 | 11.60 | 1.06 |
| 13 | 0.70 | 7.06 | 0.14 | 11.30 | 1.08 | |
| 31 | 0.67 | 7.32 | 0.09 | 11.70 | 1.05 | |
| 47 | 0.57 | 8.37 | 0.08 | 11.80 | 1.04 | |
| 109 | 0.63 | 7.82 | 0.18 | 11.10 | 1.10 | |
| 128 | 0.71 | 6.86 | 0.22 | 10.80 | 1.13 |
| Chemicals | Assignment Groups | Wave Numbers (cm−1) | ||
|---|---|---|---|---|
| First Overtone | Second Overtone | Combination Regions | ||
| Alkanes | V(C–H) | 5555–5882 | 8264–8696 | 6666–7090, 4545, and 4500 |
| V(–CH2–) | Near 6135 | Near 8290 | 4545 and 4525 | |
| V(–CH3) | 5901–5909 | 8264–8696 | 4500–4545, 4395, 4100, 4400, 5520, 5814, 7355, and 7263 | |
| Alkenes | V(C–H=) | 6100–6200 | ||
| V(=CH2) | About 9260, 8787–9009, and 9091 | |||
| V(C=C) | 4482, near 4600, 4670–4780, and 6130 | |||
| Tetrahydropyran | V(C–H) | 5565–6150 | 8040–9320 | 3885–4795, 6500, and 7500 |
| Ethers | V(C–H) | 3800–4500 and 6400–7515 | ||
| V(–CH2–) | 5690 and 5790 | |||
| V(–CH3) | 5898 and 5910 | |||
| V(CH–O–) | 8300 | 6400–7515 | ||
| V(CH2–O–) | 8495 | |||
| Chemical Structure | Assignment Group | Wave Numbers (cm−1) | ||
|---|---|---|---|---|
| First Overtone | Second Overtone | Combination Regions | ||
| Tetrahydropyran ring | V(C–H) | 5600–6000 | 8400–8800 | 4000–4800, 6400–6800, and 7200–7600 |
| V(C–O) | 8400–8800 | 6400–7600 | ||
| Methyl | V(CH3) | 5600–6000 | 8400–8800 | 4000–4800, 5600–6000, 7200–7600 |
| Isobutyl | V(C–H=) | 6000–6400 | ||
| V(C=C) | 4400–4800, 6000–6400 | |||
| Interval Combinations | Model Wine | De-Aromatic Wine | ||||||||
|---|---|---|---|---|---|---|---|---|---|---|
| RPD | RPD | |||||||||
| Full waveband | 0.75 | 6.37 | 0.23 | 10.70 | 1.19 | 0.04 | 12.10 | 0.14 | 11.34 | 0.99 |
| Joint interval | 0.97 | 2.22 | 0.96 | 2.55 | 4.78 | 0.97 | 2.36 | 0.96 | 2.33 | 5.24 |
| Spectral Number | External Validation | |||
|---|---|---|---|---|
| RPD | Regression Equation | |||
| 21 | 2.72 | 2.36 | 0.84 | y = 0.717x + 3.5288 |
Disclaimer/Publisher’s Note: The statements, opinions and data contained in all publications are solely those of the individual author(s) and contributor(s) and not of MDPI and/or the editor(s). MDPI and/or the editor(s) disclaim responsibility for any injury to people or property resulting from any ideas, methods, instructions or products referred to in the content. |
© 2023 by the authors. Licensee MDPI, Basel, Switzerland. This article is an open access article distributed under the terms and conditions of the Creative Commons Attribution (CC BY) license (https://creativecommons.org/licenses/by/4.0/).
Share and Cite
Bai, X.; Xu, Y.; Chen, X.; Dai, B.; Tao, Y.; Xiong, X. Analysis of Near-Infrared Spectral Properties and Quantitative Detection of Rose Oxide in Wine. Agronomy 2023, 13, 1123. https://doi.org/10.3390/agronomy13041123
Bai X, Xu Y, Chen X, Dai B, Tao Y, Xiong X. Analysis of Near-Infrared Spectral Properties and Quantitative Detection of Rose Oxide in Wine. Agronomy. 2023; 13(4):1123. https://doi.org/10.3390/agronomy13041123
Chicago/Turabian StyleBai, Xuebing, Yaqiang Xu, Xinlong Chen, Binxiu Dai, Yongsheng Tao, and Xiaolin Xiong. 2023. "Analysis of Near-Infrared Spectral Properties and Quantitative Detection of Rose Oxide in Wine" Agronomy 13, no. 4: 1123. https://doi.org/10.3390/agronomy13041123
APA StyleBai, X., Xu, Y., Chen, X., Dai, B., Tao, Y., & Xiong, X. (2023). Analysis of Near-Infrared Spectral Properties and Quantitative Detection of Rose Oxide in Wine. Agronomy, 13(4), 1123. https://doi.org/10.3390/agronomy13041123


