Article

Chemical Speciation of Trace Elements in Soil Fertilized with Biomass Combustion Ash and Their Accumulation in Winter Oilseed Rape Plants

1
Department of Soil Science, Environmental Chemistry and Hydrology, College of Natural Sciences, University of Rzeszów, 35-601 Rzeszów, Poland
2
Department of Plant Production, College of Natural Sciences, University of Rzeszów, 35-601 Rzeszów, Poland
3
Department of Botany and Forest Habitats, Faculty of Forestry and Wood Technology, Poznań University of Life Sciences, 60-625 Poznań, Poland
*
Author to whom correspondence should be addressed.
Agronomy 2023, 13(3), 942; https://doi.org/10.3390/agronomy13030942
Submission received: 26 January 2023 / Revised: 18 March 2023 / Accepted: 20 March 2023 / Published: 22 March 2023

Abstract

:
The impact of fertilization of fly ashes from biomass combustion (BAs) on the changes in the chemical speciation of trace elements (Zn, Cu, Cr, Ni, Pb, Cd) in Gleyic Chernozem soil was analyzed in field-experiment conditions, under cultivation of winter oilseed rape plants. The three-year field experiment was carried out in southeastern Poland (50°3′ N, 22°47′ E). The three-stage sequential extraction procedure developed by the Measurements and Testing Program (BCR) was used for the fractionation of trace elements in BAs and soil. The risk assessment code (RAC) coefficient was used to assess potential soil contamination with trace elements from Bas. The total content of Zn, Cu, Cr, Ni, Pb, and Cd in BAs used in the experiment was 470, 311, 29, 78, 38, and 3.7 mg kg−1, respectively. The present study showed that the application of BAs significantly increased the total concentration of Zn and Cu in the surface layer of the Gleyic Chernozem soil, and did not significantly increase the concentration of Cr, Ni, Pb, and Cd. Generally, using BAs does not significantly change the chemical speciation of trace elements in soil. Regardless of the applied fertilization, residual fraction (F4) was the most abundant, whereas the exchangeable/extractable (F1) fraction and reducible (F2) fraction were present in the smallest amounts. Due to the low share of exchangeable/extractable fraction (F1), the BAs used in the experiment were characterized by a low RAC coefficient; hence, their use as a soil fertilizer is relatively safe for the environment. The BAs fertilization did not cause significant changes in the content of trace elements in the different parts of the winter oilseed rape plants. Due to the relatively high content of trace elements in fly ashes from biomass combustion, an analysis of the content of individual trace element fractions should be carried out to assess their actual impact on the environment. This can help indicate further actions that should be taken to limit their negative environmental impact.

1. Introduction

Biomass used for energy purposes is becoming increasingly popular worldwide. It is a source of renewable energy with many advantages, e.g., reduction of greenhouse gas emissions and limitation of non-renewable fossil fuel consumption [1]. Burning biomass for energy purposes is associated with generation of ashes [2,3], of which the amount produced annually is estimated at approx. 480–500 million tons [2,4,5,6]. In legal terms, ashes are regarded as solid waste, which necessitates proper management thereof [7]. The importance of this problem is highlighted by the fact that most ashes are disposed of in landfills, which may cause damage to the natural environment [6]. Ashes from biomass combustion (BAs) contain macro- and micronutrients which can be used in plant fertilization. Therefore, they can be used in agriculture as a crop fertilizer, and their positive effect on plant growth and development has been widely documented in previous studies [4,8,9,10,11]. The use of ashes for fertilization contributes to nutrient recycling in the soil, which is the most environmentally friendly solution and an example of a circular economy [4,12]. Fertilization of plants with biomass combustion ashes has been known since ancient times. One of the first farming systems was slash-and-burn farming, which consisted of burning down forests and using the area for agricultural activities. Cultivated crops growing on mineral-rich ashes produced high yields [13]. BAs can be used as a fertilizer for all crops growing on all types of soil, both in autumn and spring; however, they are most suitable for acidic soils due to their alkaline reaction [9]. The limiting factor in the application of BAs in plant fertilization is the presence of various harmful substances, e.g., trace elements (TEs) [8,13,14]. The concentration of TEs in BAs is highly variable due to the different origin and species composition of biomass. For instance, the biomass from plants harvested several times a year (e.g., cereals) contains substantially lower amounts of TEs than the biomass of plants with a long reproductive period (e.g., trees) [15]. If the biomass is not contaminated with TEs, their amount in the generated ashes usually does not exceed standards determining their applicability as fertilizers [16]. Combustion of biomasses in modern furnaces reduces the concentration of trace elements, including those exerting toxic effects, to a minimum [5].
In general, BAs contain lower concentrations of TEs than ashes produced via combustion of traditional fuels, although this is not a rule [17]. As shown by various studies, the application of BAs to soils increases the content of TEs in the soils and accumulation, thereof, in various parts of plants [11,18]. Therefore, before the application of ashes to the soil, it is essential to determine the content of toxic trace elements (e.g., Zn, Cu, Cr, Ni, Pb, Cd), and especially their potentially mobile and bioavailable chemical forms. The chemical forms of trace elements contained in ashes can be identified, and their mobility and bioavailability can be assessed with sequential extraction procedures. The most common procedure was developed by the Measurements and Testing Program (former Community Bureau of Reference–BCR) [19,20,21]. The BCR procedure was initially applied for analyses of soils, and later to analyze fly ashes and sewage sludge [22,23]. Currently, this method is used most frequently due to the high repeatability of its results, which is associated with the reproducibility of the reaction conditions in different laboratories [21,24]. The BCR analysis helps distinguish the following fractions characterized by different solubility and bioavailability degrees: exchangeable/extractable fraction (F1), reducible fraction bound to Fe and Mn oxides (F2), oxidizable fraction bound to organic matter (F3), and a residual fraction (F4) [19,24]. The exchangeable/extractable fraction (F1) of trace elements is characterized as the most bioavailability, while the residual fraction (F4) is stably bound in the crystal lattice and potentially not bioavailable for plants and other organisms [19,24]. Due to the relatively high content of trace elements in fly ashes from biomass combustion, individual trace element fractions should be analyzed to assess their impact on the environment. According to available data, little is known about changes in the content of individual fractions of trace elements in soils due to the long-term use of BAs for fertilization purposes [18]. Thus, the study aimed to assess the application of BAs on changes in the chemical speciation of Zn, Cu, Cr, Ni, Pb, and Cd, and their total content in chernozem soil (Gleyic Chernozem) under winter oilseed rape cultivation, in a three-year field experiment.

2. Materials and Methods

2.1. Ash from Biomass Combustion and Field-Experiment Conditions

The fly ash from biomass combustion (BAs) used in the experiment was produced through the combustion of forest biomass (approx. 70%) and agricultural biomass (approx. 30%). The forest biomass comprised deciduous and coniferous trees (50/50), whereas cereal straw, sunflower husk, and willow were the components of the agricultural biomass. The characteristics of the ash used in the experiment are presented in Table S1 [11]. The study of the impact of BAs on changes in the BCR chemical speciation and total forms of Zn, Cu, Cr, Ni, Pb, and Cd present in the 0–30 cm Gleyic Chernozem soil layer, with the granulometric composition of silty loam (SiL) [25], was carried out for 3 years (2019–2021) in a field experiment established in autumn 2018. The experiment was conducted on a farm in Korzenica, in the southeastern part of Poland (50°02′22″ N 22°55′20″ E) (Figure S1) [26]. Changes in the BCR chemical speciation of trace elements were also estimated via comparison with the soil analyzed before the experiment (0). In this study, the impact of BAs on changes in the BCR chemical speciation of trace elements and their total forms was analyzed in the soil under the winter oilseed rape (Brassica napus L. var. napus) cv. Mandril (from Syngenta) cultivation. Additionally, changes in the accumulation of trace elements in various parts of the winter oilseed rape plants were analyzed during the 3-year study period. The detailed experimental conditions, analyzed variants, and physicochemical properties of BAs are described in Supplementary Materials (Section S1, Table S1). Ash with the same properties was used throughout the experiment.

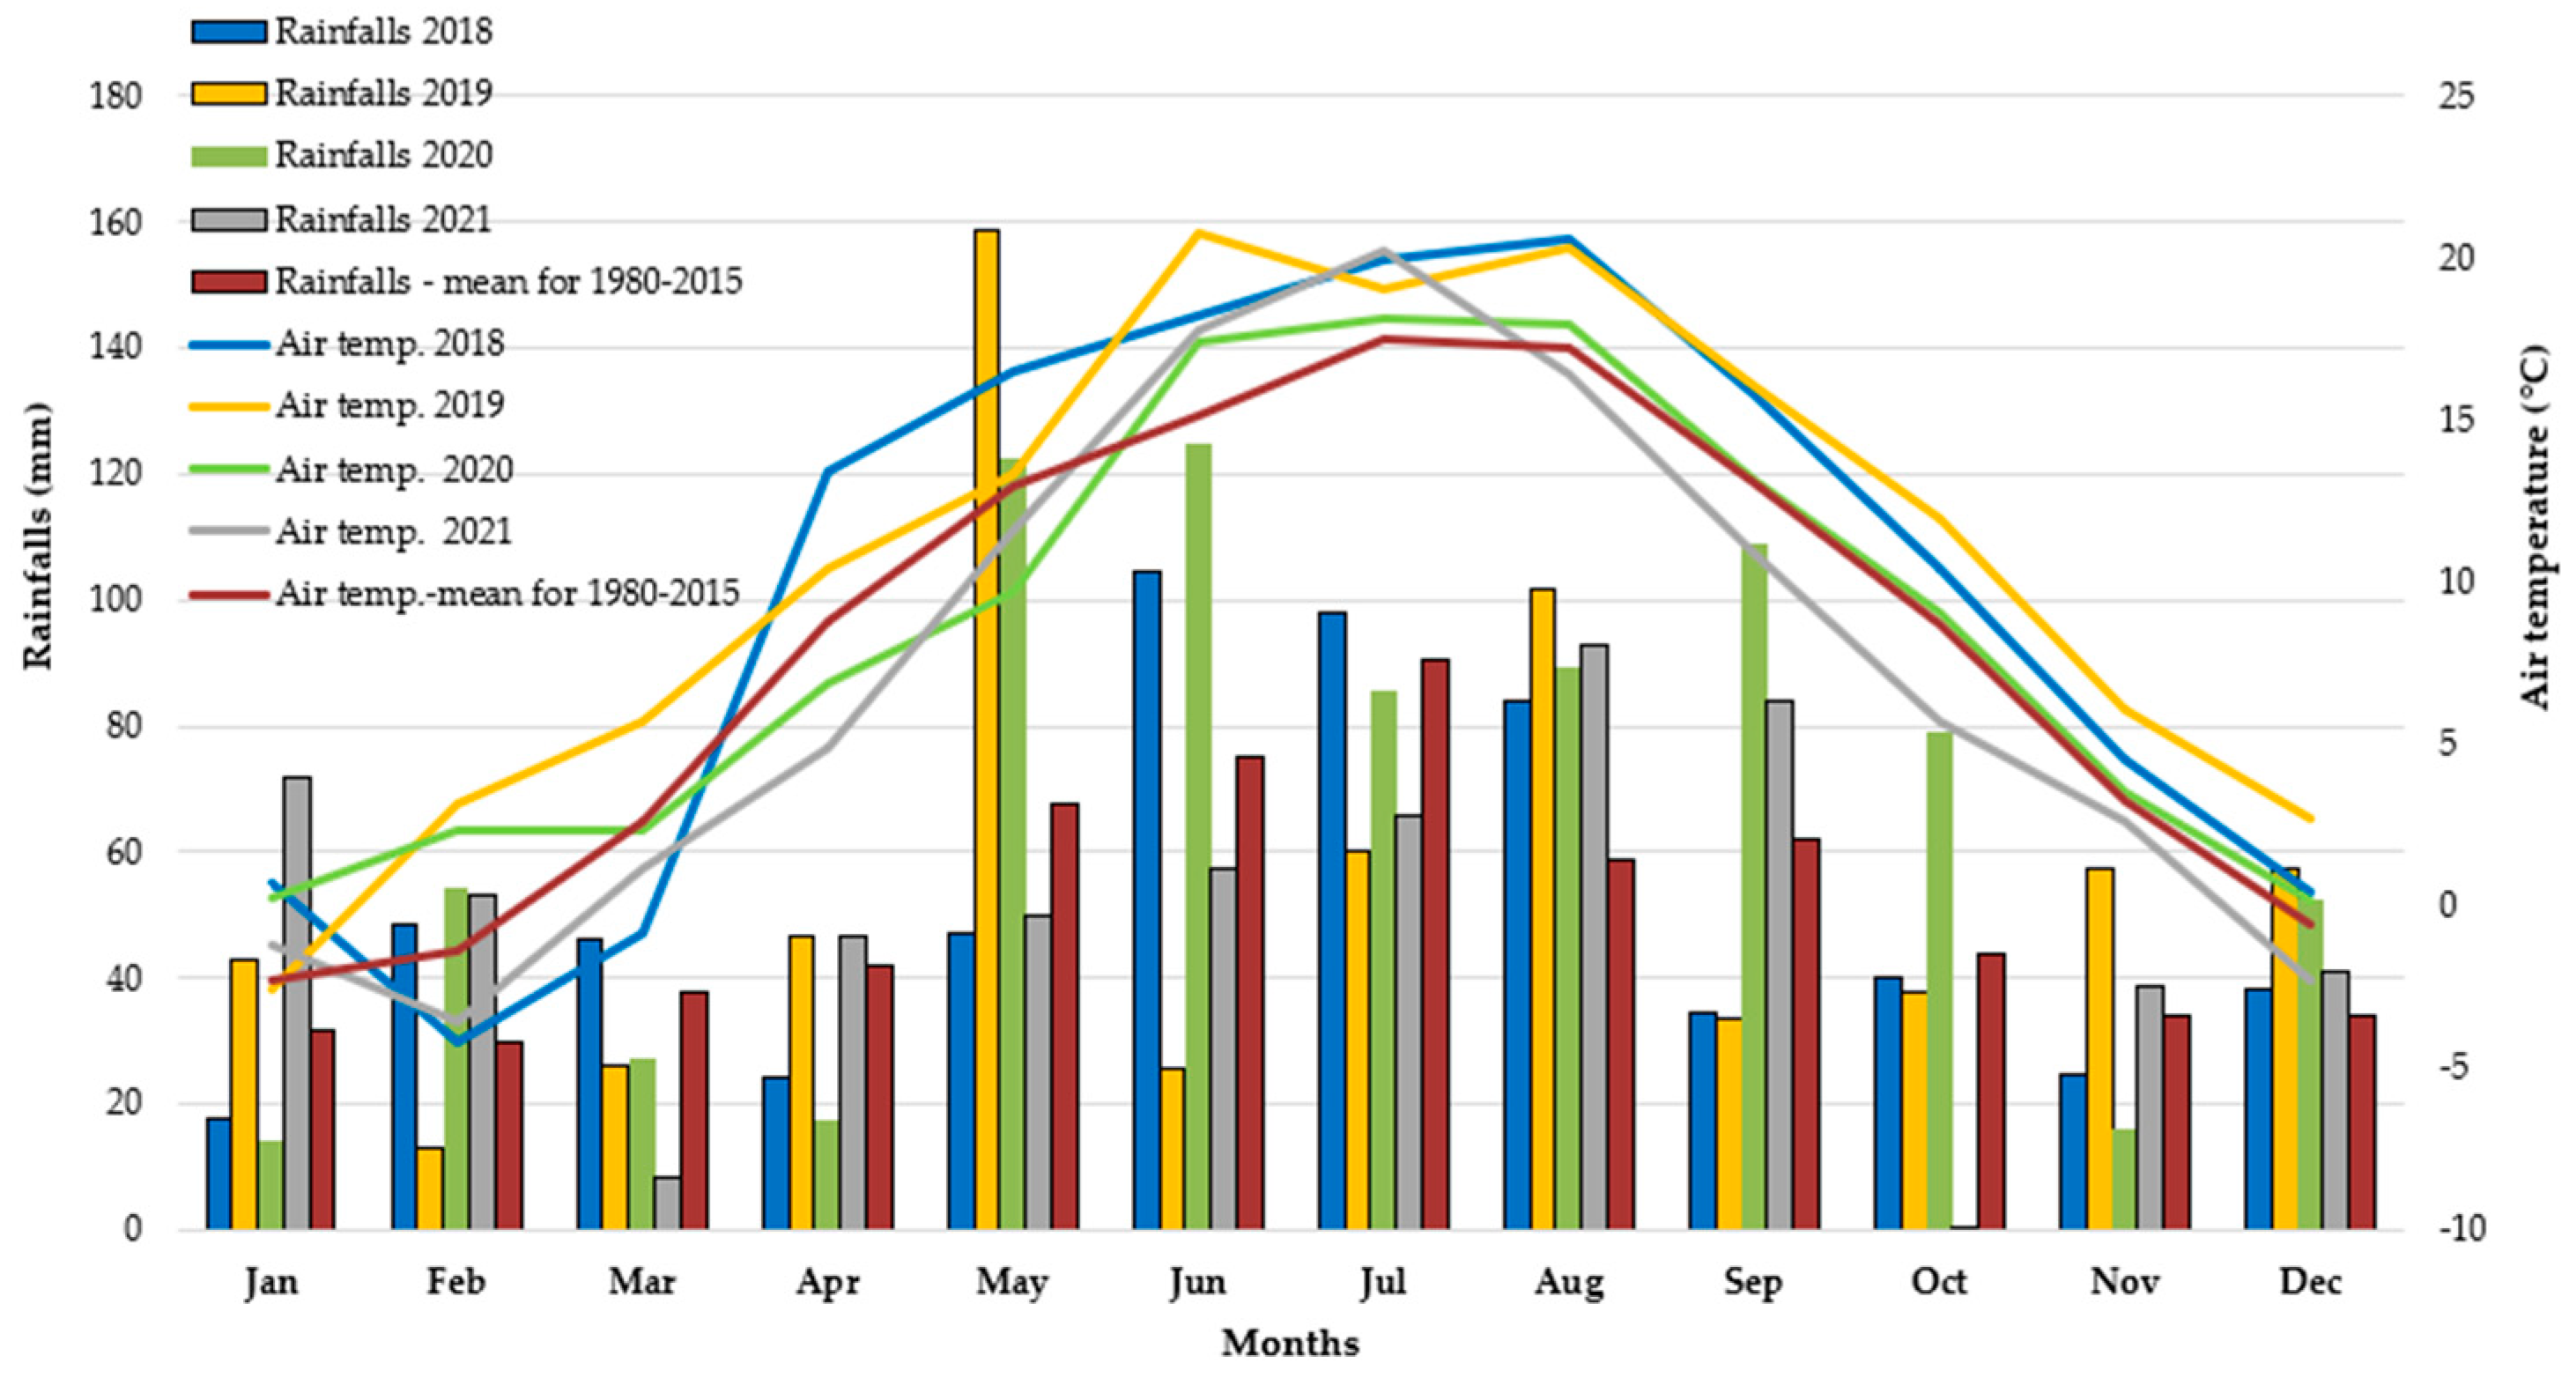
2.2. Weather Conditions during the Study Period (2019–2021)

The meteorological conditions during the study period varied, especially in terms of precipitation (Figure 1). The total precipitation in 2018–2021 ranged from 608.3 mm (2018) to 792.4 mm (2020), and the average annual air temperature ranged from 7.0 °C (2021) to 10.6 °C (2019). During the growing season of winter oilseed rape (September–July of the following year), 510.7, 633.0, and 609.6 mm of precipitation were recorded in the 2018/2019, 2019/2020, and 2020/2021 growing seasons, respectively, and their distribution was uneven. The average air temperature during this period was 9.2, 8.5, and 7.0 °C, respectively.

2.3. BCR Sequential Extraction Procedure Applied to Biomass Combustion Ashes and Soil Samples, and Assessment of Environmental Risk

Soil samples intended for laboratory analyses were collected from a depth of 30 cm of the arable soil layer, in accordance with the methodology used in soil science studies. They were transported to the laboratory, air-dried for 2 weeks, ground with the use of a PULVERISETTE 8 soil Deagglomerator (Fritsch GmbH), and sieved through laboratory sieves with a 2 mm mesh size. Afterward, the samples were subjected to further analyses. The total content of trace elements (Zn_T, Cu_T, Cr_T, Ni_T, Pb_T, Cd_T) in the BAs samples and in the soil samples was determined by atomic absorption spectrometry, using the HITACHI Z-2000 apparatus (Tokyo, Japan). To determine trace elements, approx. 1 g of ash samples and 2 g of soil samples were mineralized in concentrated perchloric acid (HClO4).
The speciation analysis of the trace elements (Zn, Cu, Ni, Cr, Pb, and Cd) was carried out using the three-step BCR sequential extraction procedure [19,24]. The scheme of the sequential extraction procedure was described in the Supplementary Materials Section S2. The risk assessment code index (RAC) value was calculated to assess the environmental risk posed by the trace elements concentrated in BAs. The RAC index takes into account the percentage of trace elements present in mobile forms associated with fraction F1. The details of the RAC index calculation were described in other papers [27,28,29]. Based on the RAC index, the risk associated with the introduction of trace elements into the soil with ash was assessed using a 5-point scale: RAC < 1 no risk (safe to the environment); RAC = 1–10 low risk (relatively safe to the environment); RAC = 11–30 medium risk (relatively dangerous to the environment); RAC = 30–50 high risk (dangerous to the environment); RAC > 50 very high risk (very dangerous to the environment) [27,28,29].

2.4. Analysis of the Trace Element Content in Different Parts of Winter Oilseed Rape Plants

In order to determine the content of Zn, Cu, Cr, Ni, Pb, and Cd in the winter oilseed rape, approximately 20 plants were randomly collected from each plot immediately before harvesting in the full-maturity phase. The plants were transported to the laboratory, separated into grains, straw, and roots, and dried in a laboratory drier at 45 °C with forced air circulation. The dried plant material was homogenized in a laboratory mill, and the samples were subjected to further analysis. Approximately 1 g of the plant material was mineralized in 60% HNO3. The content of Zn, Cu, Ni, Cr, Pb, and Cd in the mineralized material was determined with the use of atomic absorption spectrometry in the HITACHI Z-2000 apparatus (Tokyo, Japan).

2.5. Statistical Analysis

The results were statistically analyzed using the Statistica 13.3 program. The changes in chemical speciation and the total content of trace elements in the soil and plants, depending on the dose of biomass combustion ashes applied, were assessed with the one-way analysis of variance (ANOVA), at the p < 0.05 significance level and with a Tukey’s post hoc test (HDS).

3. Results

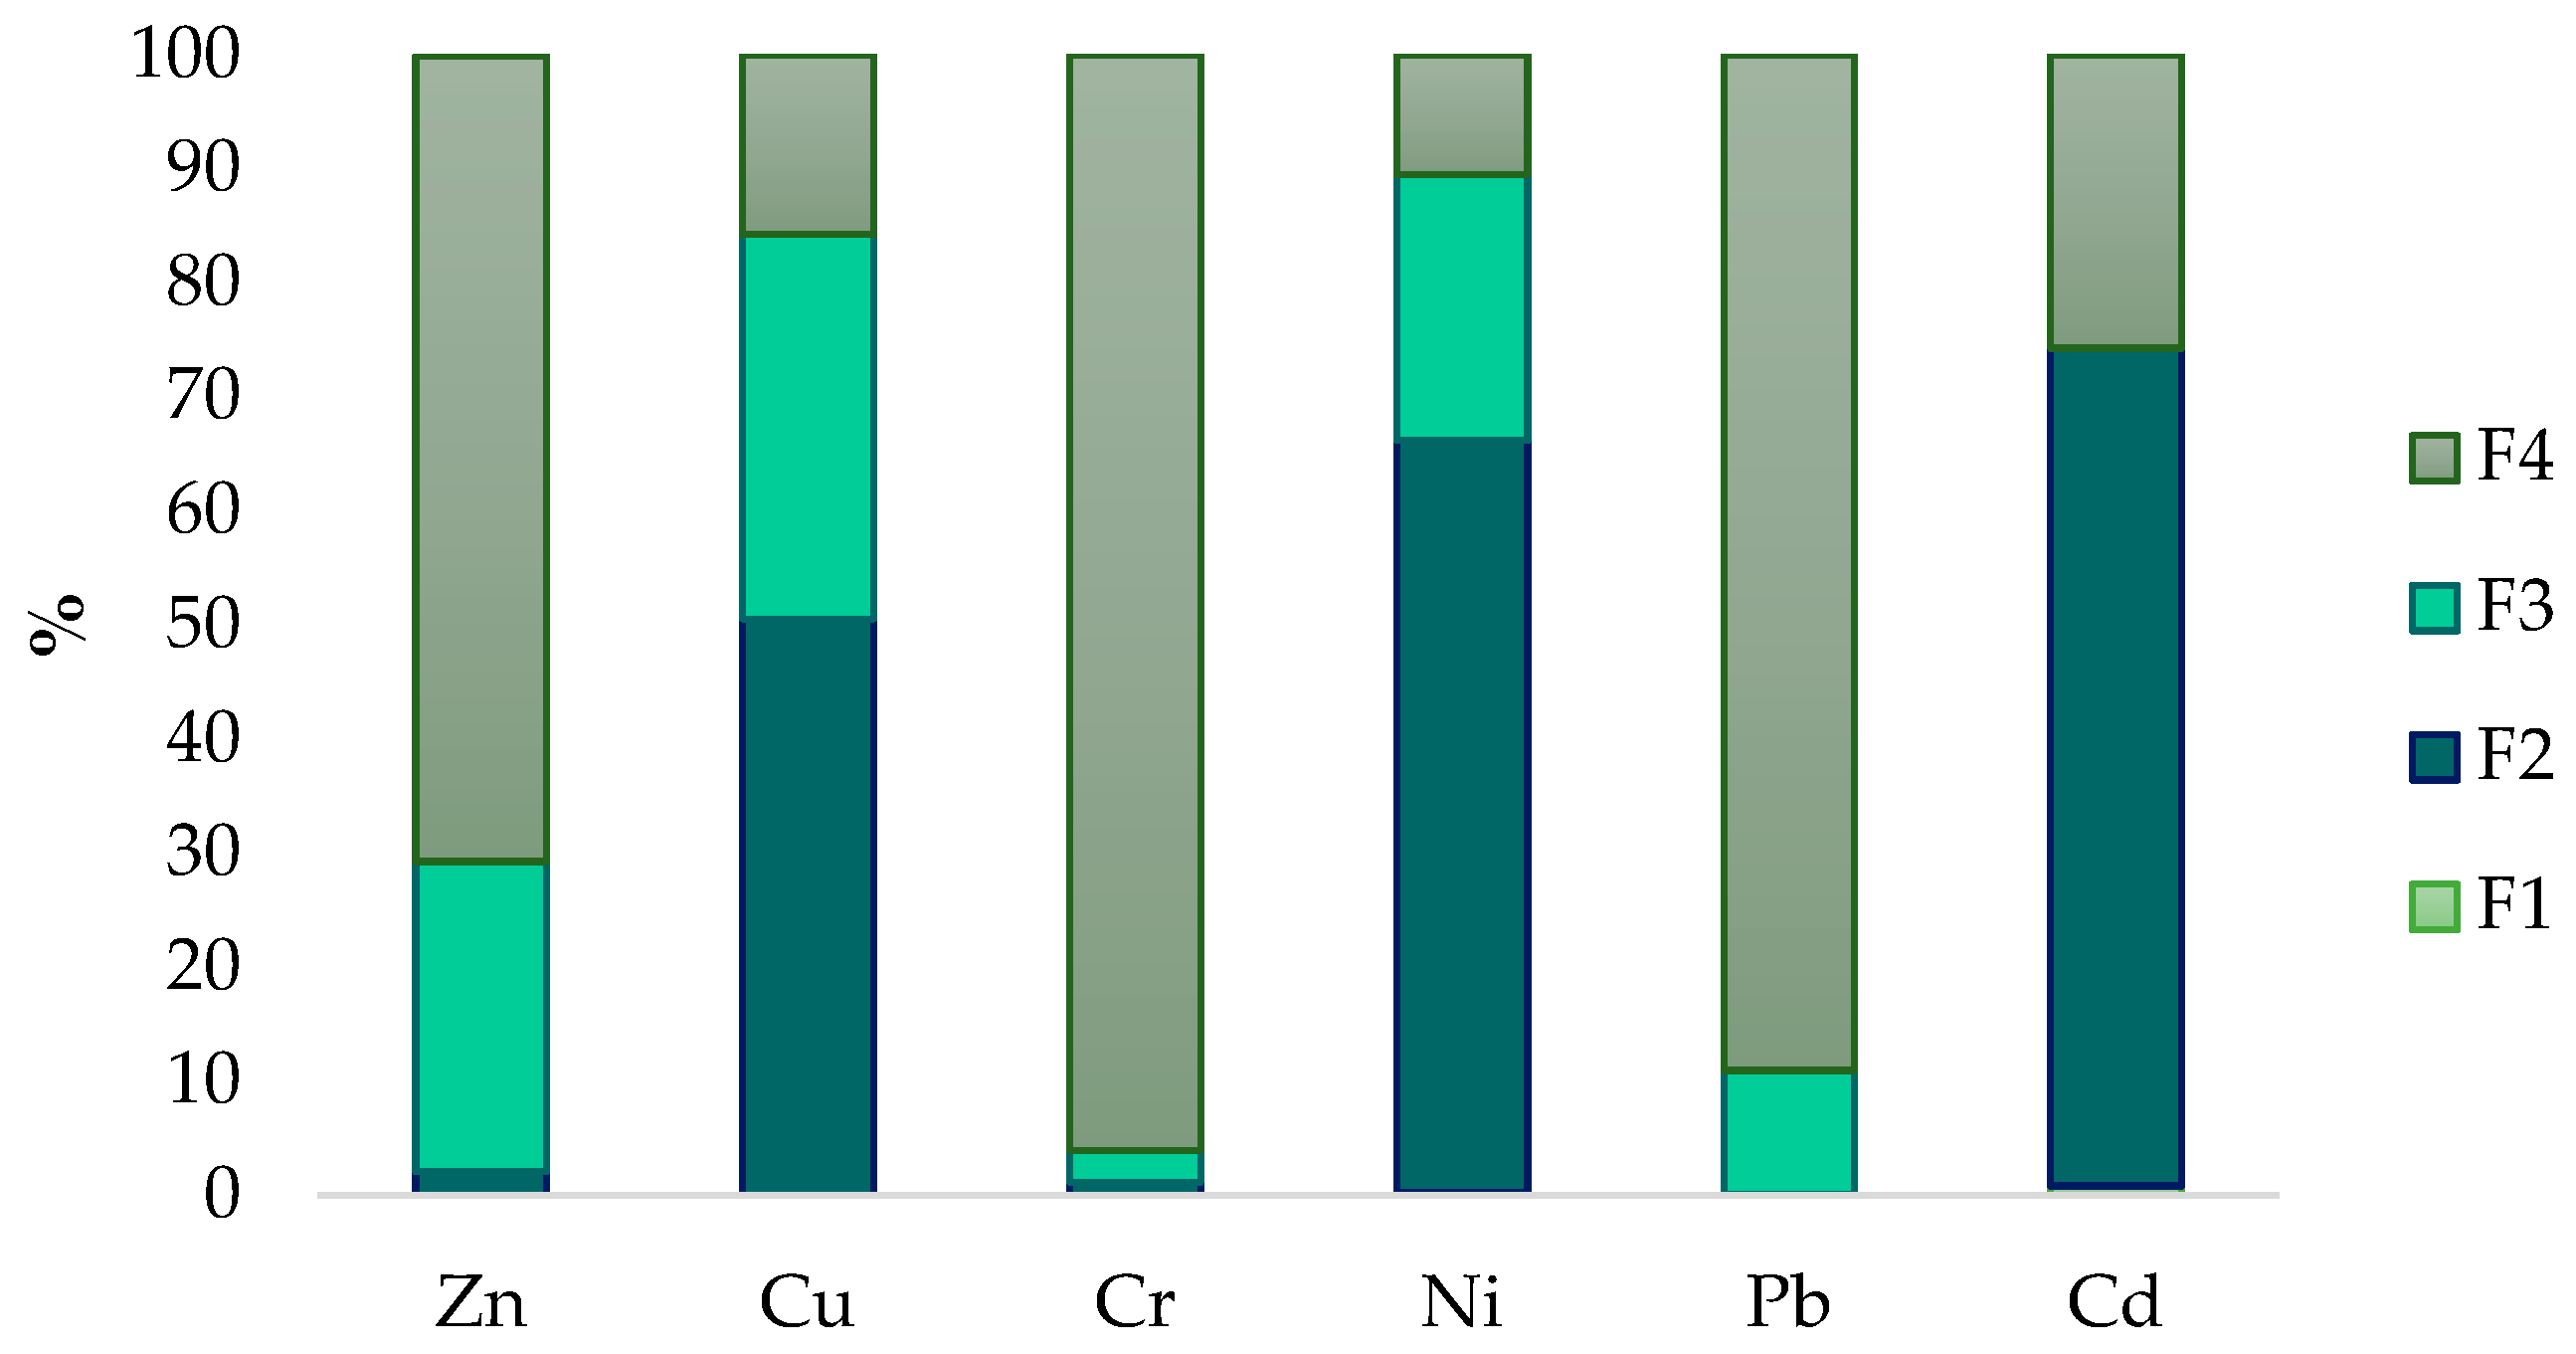
3.1. Chemical Fraction and Total Concentration of Trace Elements in BAs

The content of the analyzed trace elements and their speciation in BAs are summarized in Table 1. As revealed by the data, among the total forms of trace elements in BAs, zinc exhibited the highest concentration, with a mean value of 470 mg kg−1. The other most dominant elements were Cu, Ni, Pb, and Cr, with the mean values of 310.8, 77.7, 37.63, and 28.74 mg kg−1, respectively. The lowest content in BAs was determined for Cd, with an average amount of 3.69 mg kg−1 (Table 1).
The analysis of the proportion of individual fractions of trace elements in their total content in BAs revealed the lowest amount of F1 fraction in the case of all the analyzed elements (Figure 2). Fraction F1 of Ni and Pb in BAs was below the level of quantification. For Zn, Pb, and Ni, the largest percentage shared in their total content was determined for the residual fraction (F4), i.e., 71, 89, and 96%, respectively. In turn, the reducible fraction (F2) had the largest % share in the Cu_T, Cr_T, and Cd_T, i.e., 51, 66, and 73%, respectively. No F3 fraction was found for Cd. In the case of the other analyzed elements, Ni (3%) and Cu (34%) were characterized by the lowest and highest percentage of F3, respectively. The share of fraction F3 in the total content of Zn, Cr, and Pb was 27, 23, and 11%, respectively (Figure 2). The RAC indexes calculated from the content of fraction F1 in the Zn_T, Cu_T, Cr_T, Ni_T, Pb_T, and Cd_T in the BAs used in the experiment, had a value below 1 in all cases (Table 1). It can therefore be concluded that the ashes used in the experiment did not pose a considerable risk to the natural environment, as no large amounts of mobile forms of these trace elements were introduced.

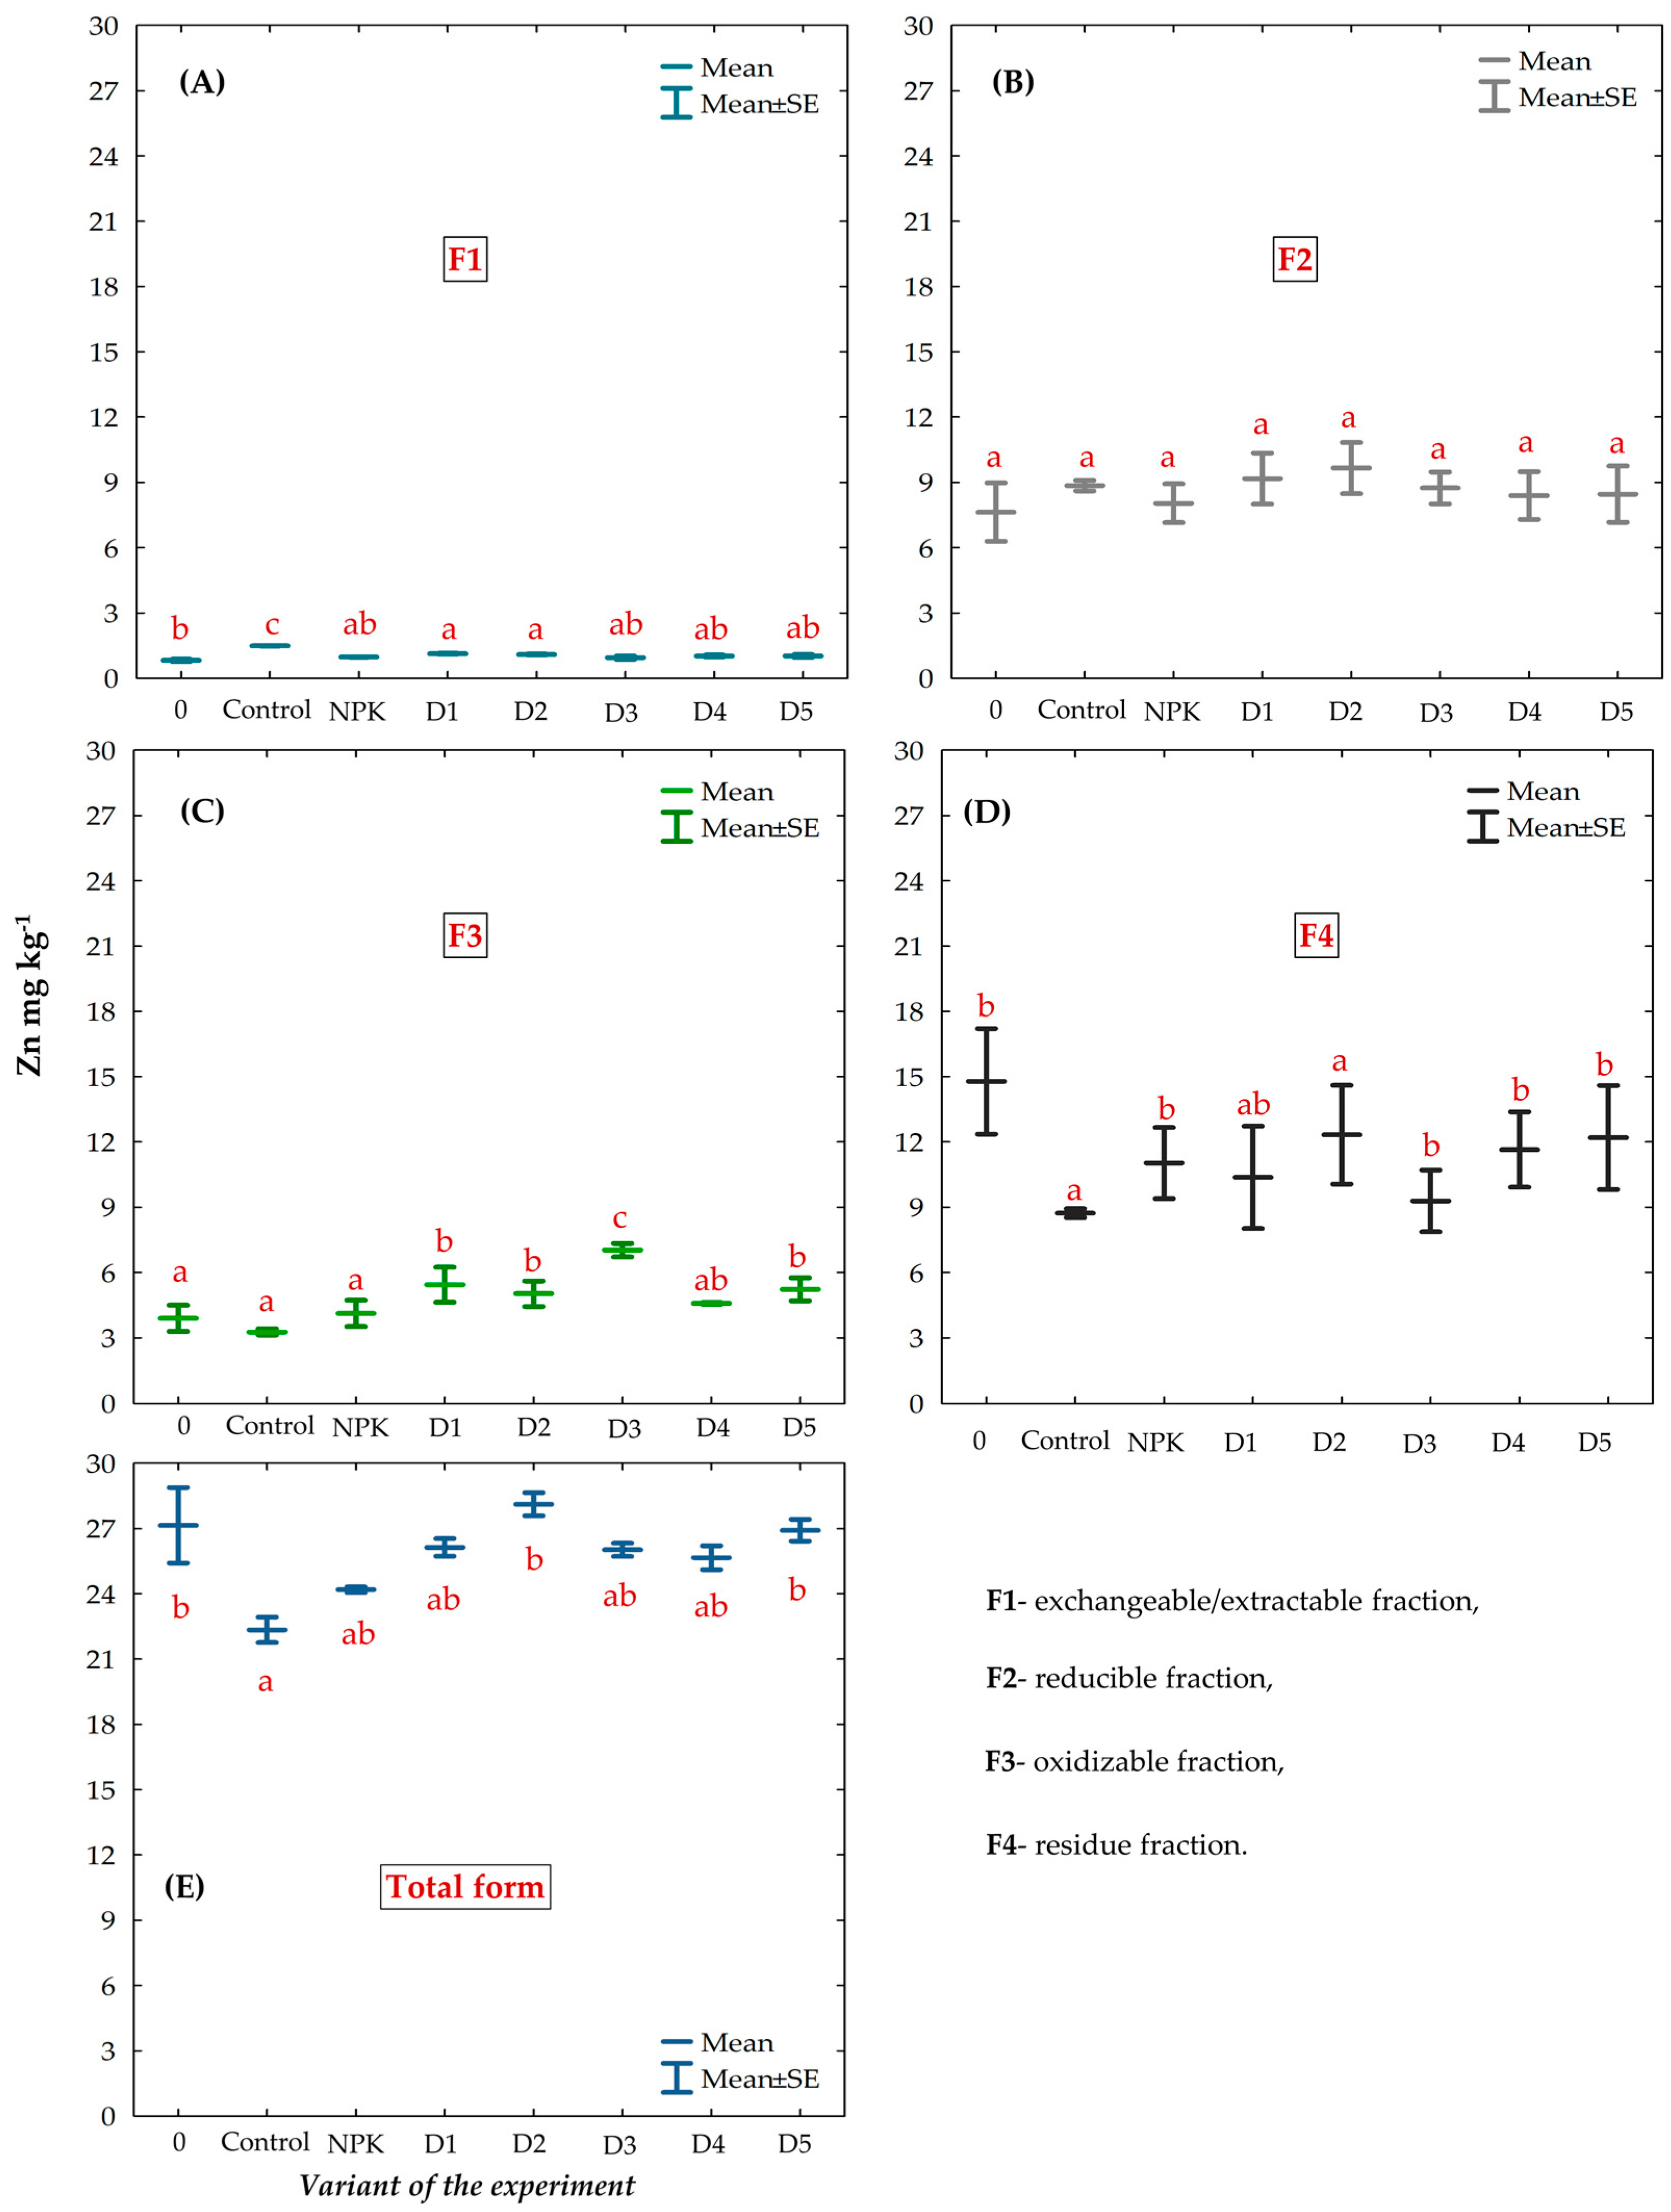
3.2. Chemical Fractions and Total Concentration of Zn in the Gleyic Chernozem Soil Fertilized with BAs

The mean content of the total Zn forms in the Gleyic Chernozem soil (0–30 cm) ranged from 22.35 to 28.11 mg kg−1 (Figure 3E). The highest content of this element was detected in the soil before starting the experiment (0), and the lowest amount was determined in the control. There was no significant effect of the applied BAs fertilization on Zn_T forms in the analyzed soil. The concentration of Zn_T was lower in all the experimental objects after three years of the study than in the soil before starting the experiment (Figure 3E).
The analysis of the content of the BCR Zn fractions in the Gleyic Chernozem soil in all the experimental objects showed the highest amount of the residual F4 fraction and the lowest content of the F1 fraction (Figure 3A–D, Table S2).
The mean content of Zn in fraction F1 was low, with the lowest value (0.83 mg kg−1) in the soil analyzed before the experiment (0) and the highest level (1.49 mg kg−1) in the control. Additionally, the content of fraction F1 of Zn was lower in all the BAs-fertilized objects than in the control soil (Figure 3A).
The content of the reducible F2 fraction of Zn ranged from 7.64 to 9.66 mg kg−1, with the lowest values in the soil before the experiment (0) and the highest level in the soil fertilized with BAs at the D2 dose. Despite the differences in the mean content of F2 of Zn, no statistically significant effect of the fertilization on its content was confirmed (Figure 3B).
The application of BAs caused a significant increase in the content of fraction F3 of Zn. The lowest value of the oxidizable F3 fraction of Zn was recorded in the soil before the experiment (0) and highest with the D3 dose of BAs (Figure 3C); its levels ranged from 3.27 to 7.03 mg kg−1. The increasing share of Zn in fractions F1, F2, and F3 resulted in a decrease in the mean content of its residual F4 fraction in comparison with the soil before starting the experiment. The concentration of Zn_F4 ranged from 8.73 mg kg−1 to 14.78 mg kg−1. A lower content of this fraction of Zn was also observed in the control soil. The statistical analysis confirmed that the mean content of fraction F4 of Zn was significantly lower in the control soil and in the soil treated with the D2 dose of BAs compared to other experimental objects (Figure 3D, Table S2).

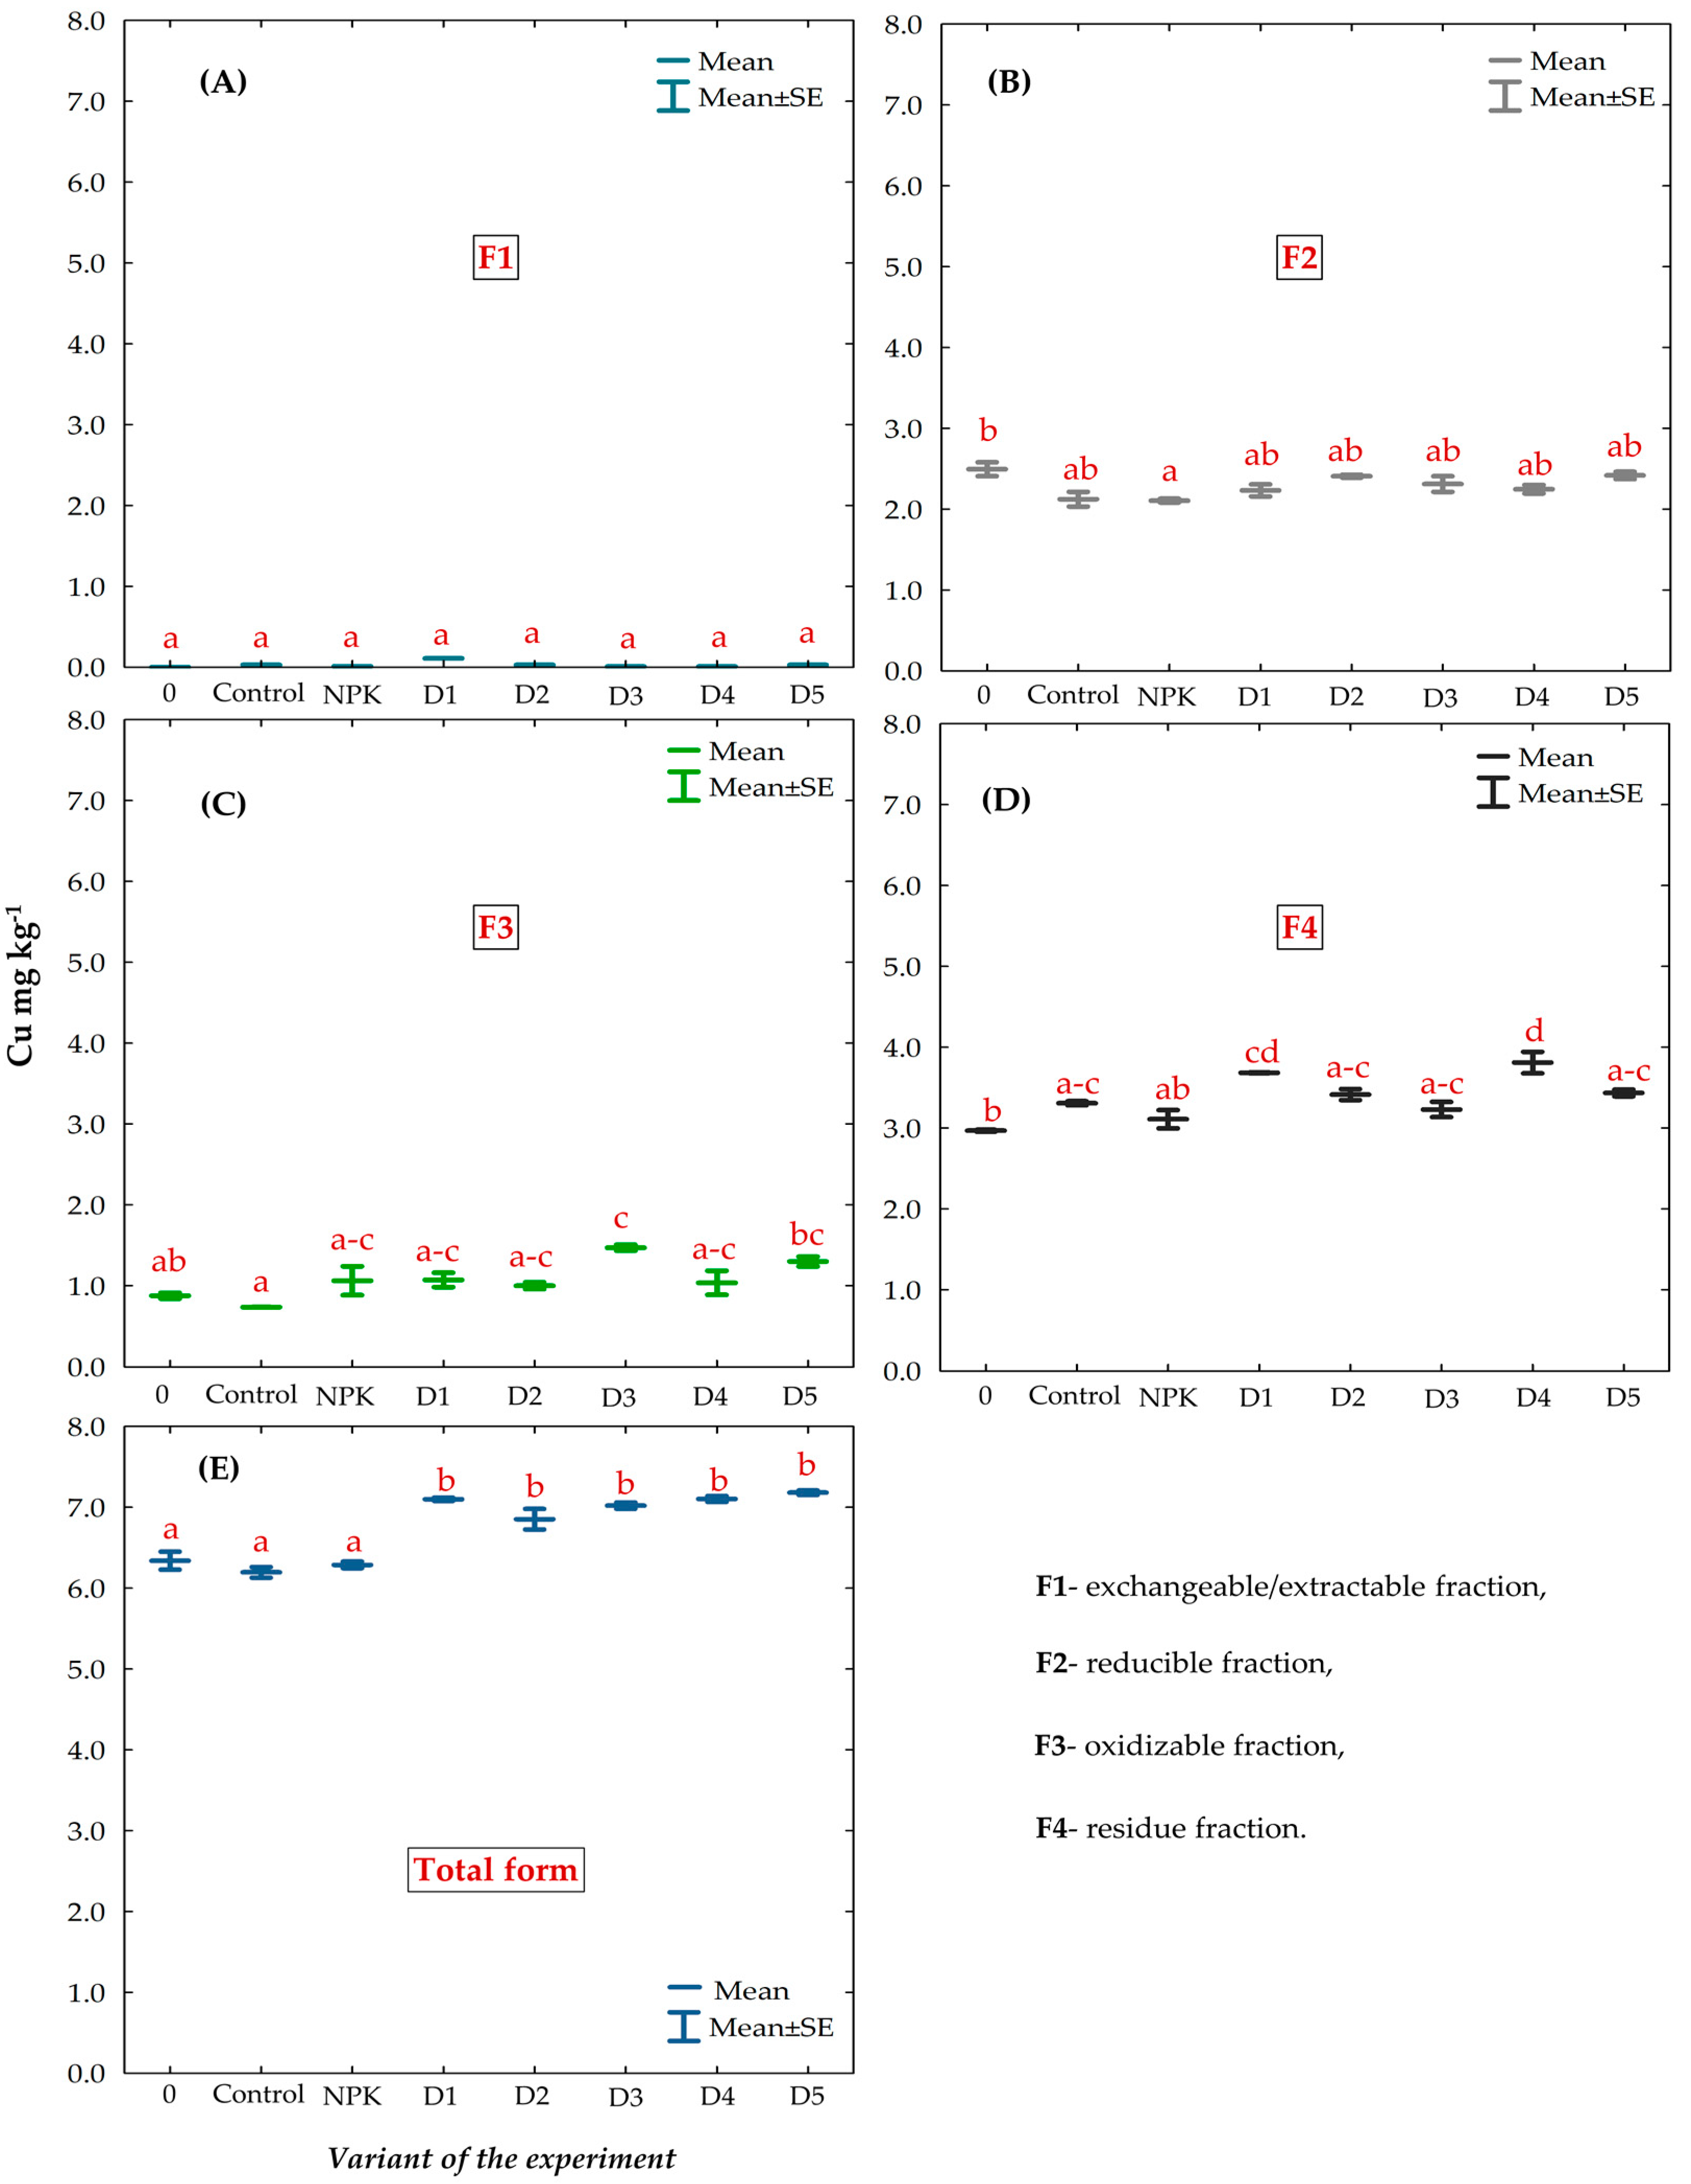
3.3. Chemical Fractions and Total Concentration of Cu in the Gleyic Chernozem Soil Fertilized with BAs

The application of BAs had a significant impact on the concentration of Cu_T in the surface layer of the Gleyic Chernozem soil (Figure 4E). The mean Cu content in the control soil, NPK-fertilized soil, and soil analyzed before the experiment (0) was 6.20, 6.29, and 6.34 mg kg−1, respectively, which was significantly lower than the level of this element in other experimental objects. In the group of objects fertilized with BAs, the lowest concentration of this element was observed in the variant fertilized with the dose of 1.0 Mg ha−1 (D2), whereas the highest level was recorded in the object treated with 2.5 Mg ha−1 of BAs (D5) (Figure 4A–D).
As in the case of zinc, the speciation analysis of Cu showed the highest share of the residual F4 fraction of the element and the lowest content of the ion-exchangeable and carbonate F1 fraction (Figure 5A–D, Table S3). The mean F1 fraction content in the total Cu amount ranged from 0.001 to 0.11 mg kg−1, with the percentage share ranging from 0.02 to 1.55% (Figure 4A, Table S3). The lowest content of Cu_F1 was found in the soil before starting the experiment (0), and the highest level was detected in the soil fertilized with the D1 dose of BAs (Figure 4A).
The impact of the biomass combustion ashes was also reflected in the changes in the share of fraction F2 in the total Cu content. Its mean content in objects D1–D5 was higher than in the control, but these differences were not statistically confirmed. Similar relationships were found between ash-fertilized objects and the soil receiving traditional NPK fertilization. In comparison with the soil 0, the mean content of Cu_F2 in the BAs-fertilized objects and the NPK and control variants was lower during the study period. However, these differences were not confirmed statistically (Figure 4B).
The mean content of fraction F3 of Cu during the study period ranged from 0.74 to 1.47 mg kg−1, with an 11.9–20.9% percentage share in Cu_T (Figure 4C, Table S3). The lowest concentration of Cu_F3 was detected in the control, whereas the object fertilized with 1.5 Mg ha−1 BAs (D3) exhibited its highest content, and these differences were confirmed statistically. The mean content of F3 of Cu in this object was significantly higher than in the soil analyzed before the experiment. The differences observed in the other cases were statistically insignificant (Figure 4C).
The percentage share of the residual F4 fraction in the total Cu content varied between experimental objects and ranged from 46 to 53% (Table S3). Its mean content ranged from 2.97 to 3.81 mg kg−1, with the lowest values noted in the soil analyzed before the experiment (0) and the highest values recorded in the variant fertilized with the BAs dose of 2.0 Mg ha−1 (D4). The content of fraction F4 of Cu in the soil fertilized with the D4 dose of BAs was significantly higher than in other experimental objects (Figure 4D).

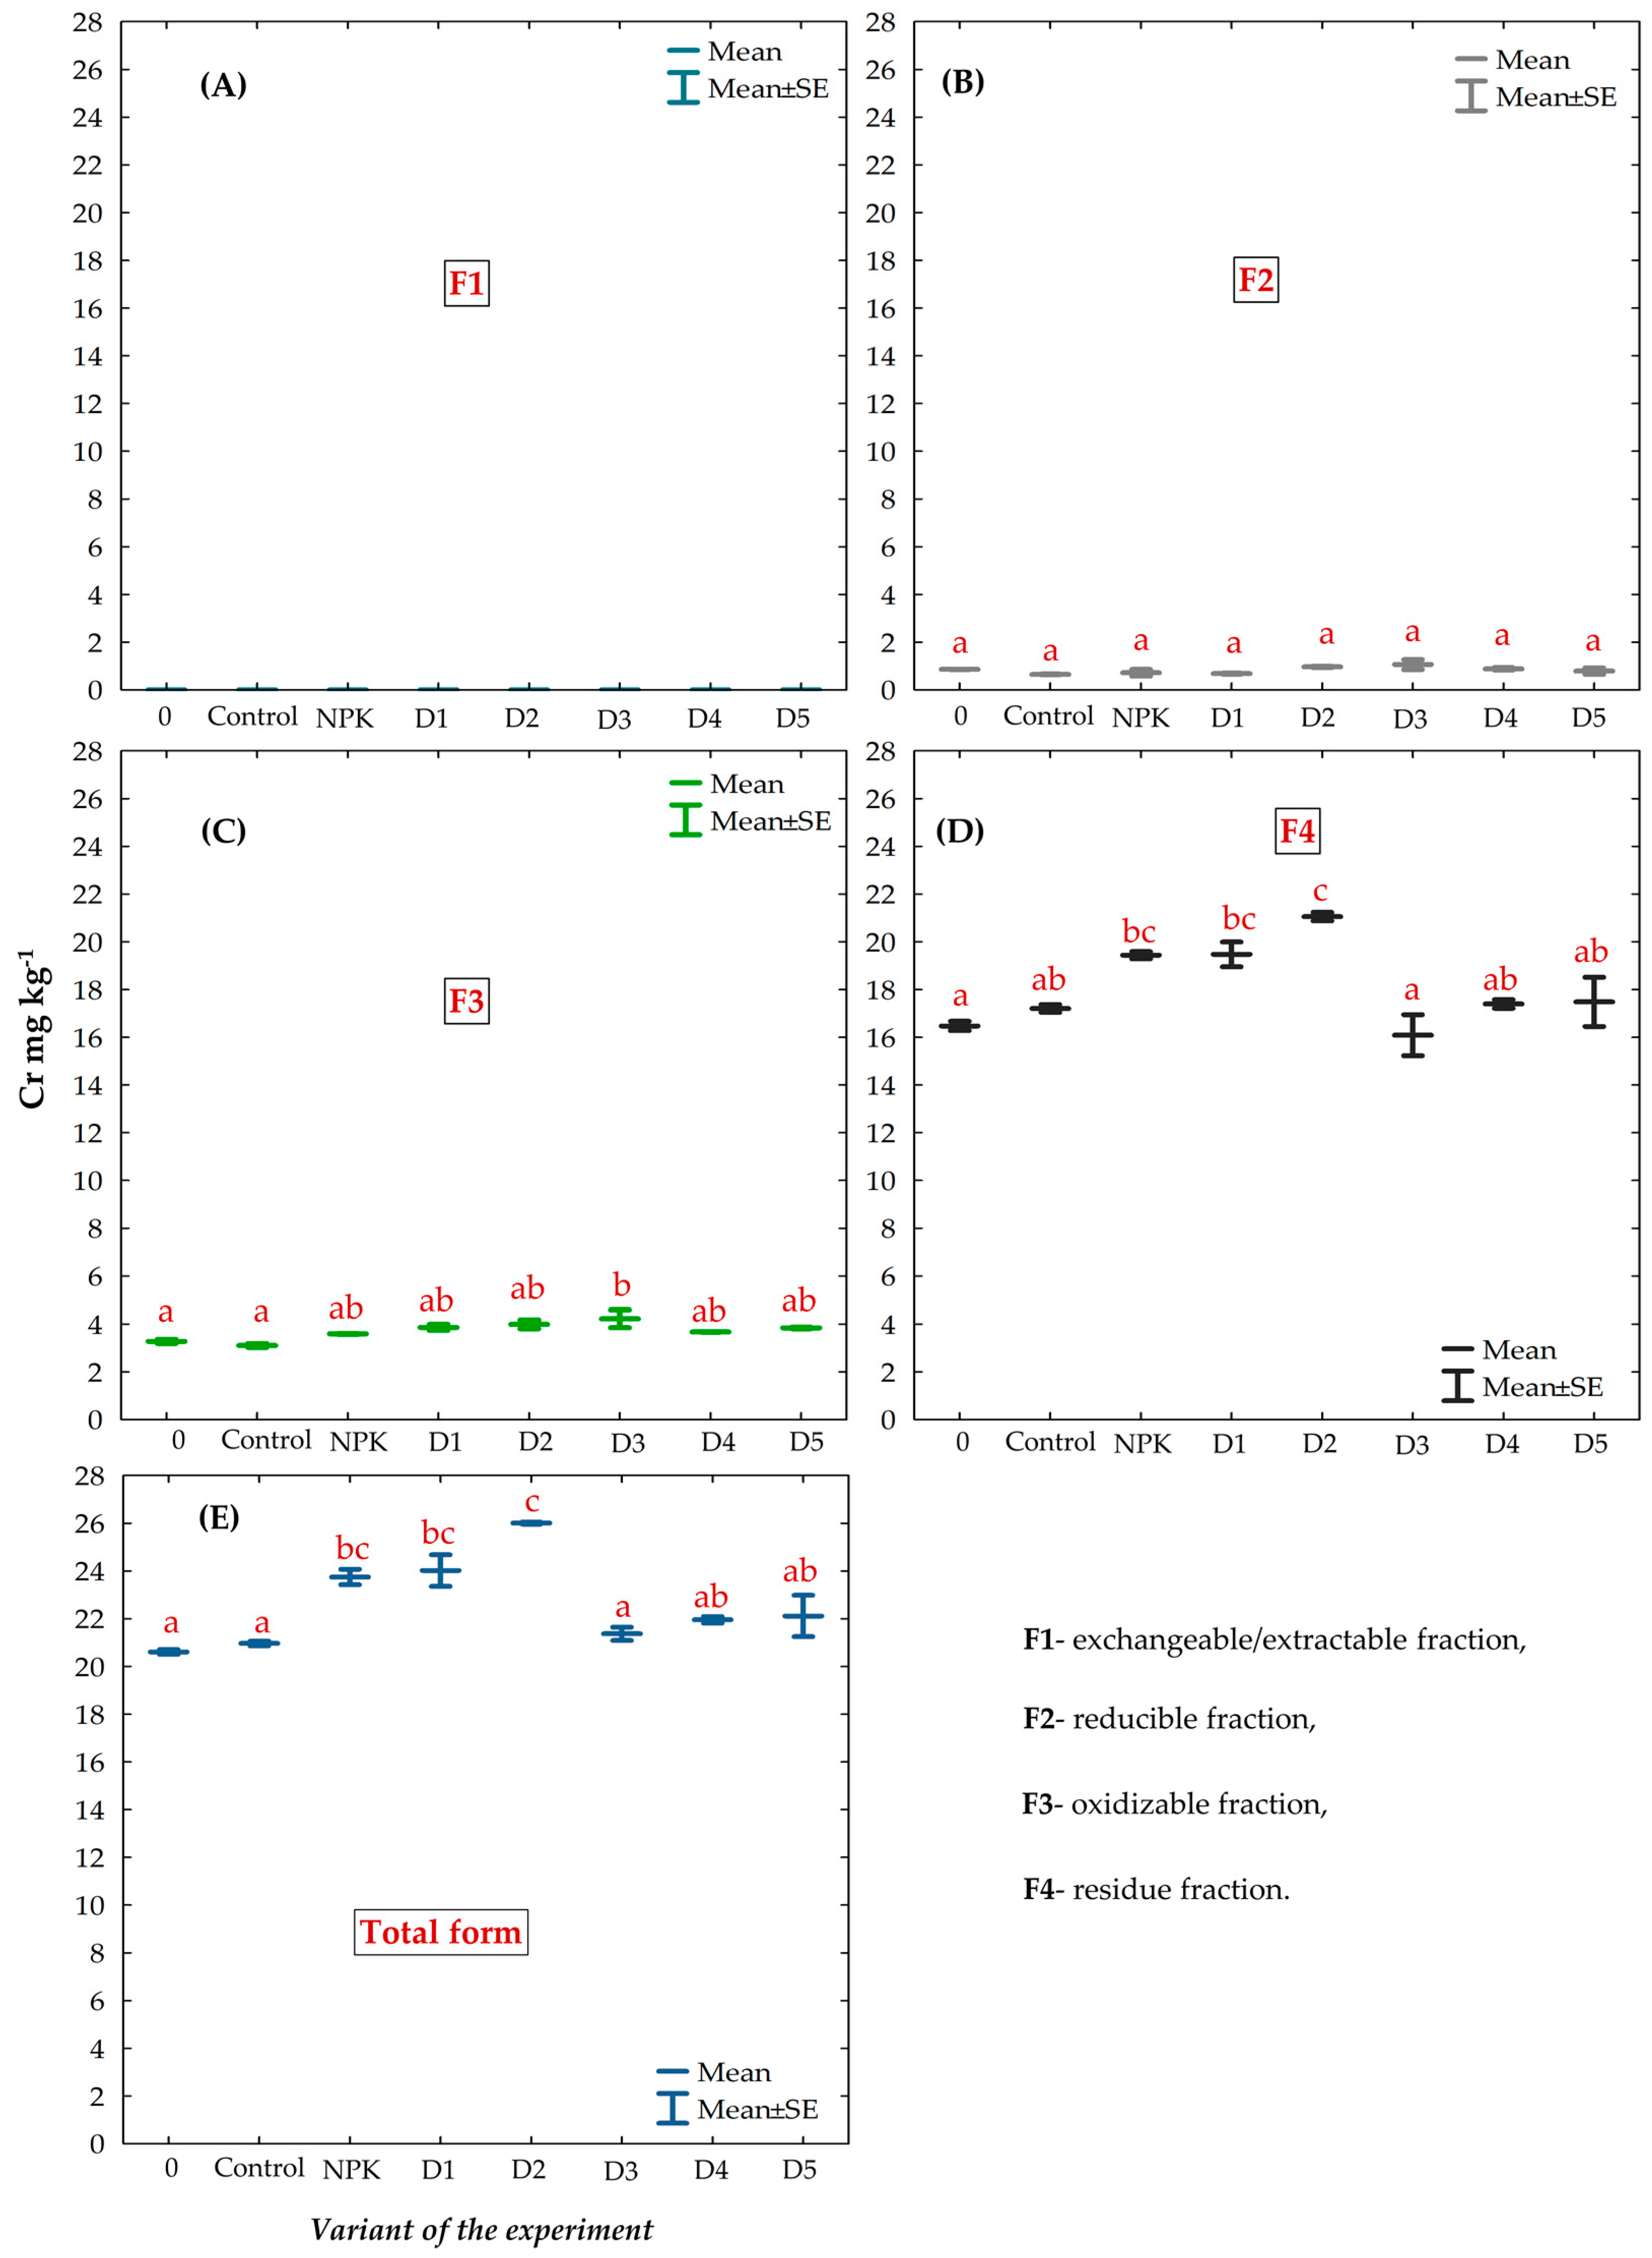
3.4. Chemical Fractions and Total Concentration of Cr in the Gleyic Chernozem Soil Fertilized with BAs

The mean content of the total forms of Cr ranged from 20.61 mg kg−1 in the soil analyzed before the experiment (0), to 26.01 mg kg−1 in the soil fertilized with BAs at the dose of 1.0 Mg ha1 (D2); the significance of these differences was confirmed statistically (Figure 5E).
No exchangeable/extractable fraction (F1) of Cr was detected in any of the experimental objects (Figure 5A, Table S4). In the case of the other Cr fractions, the highest percentage share in Cr_T was exhibited by residual fraction F4, regardless of the experimental variant (Figure 5D, Table S4). In comparison with the soil analyzed before the experiment (0) and the control object, a significant increase in the mean content of F4 of Cr was observed only in the D2 object (Figure 5D). Chromium fraction F3 was the second largest fraction after F4 in all experimental objects (Figure 5, Table S4). Its mean content ranged from 3.11 to 4.22 mg kg−1. The highest concentration of Cr_F3 was detected in the D3 object; the value was significantly higher only in comparison with the control and soil 0. There were no significant differences in the content of Cr_F3 between the other objects (Figure 5C). The share of fraction F2 in the total Cr content ranged from 14.8 to 19.8% (Table S4). Its mean content ranged from 0.65 mg kg−1 in the control to 1.06 mg kg−1 in the soil fertilized with 1.5 Mg ha−1 BAs (D3) (Figure 5B). Despite the observed differences, there was no significant effect of the experimental factors on the F2 content.

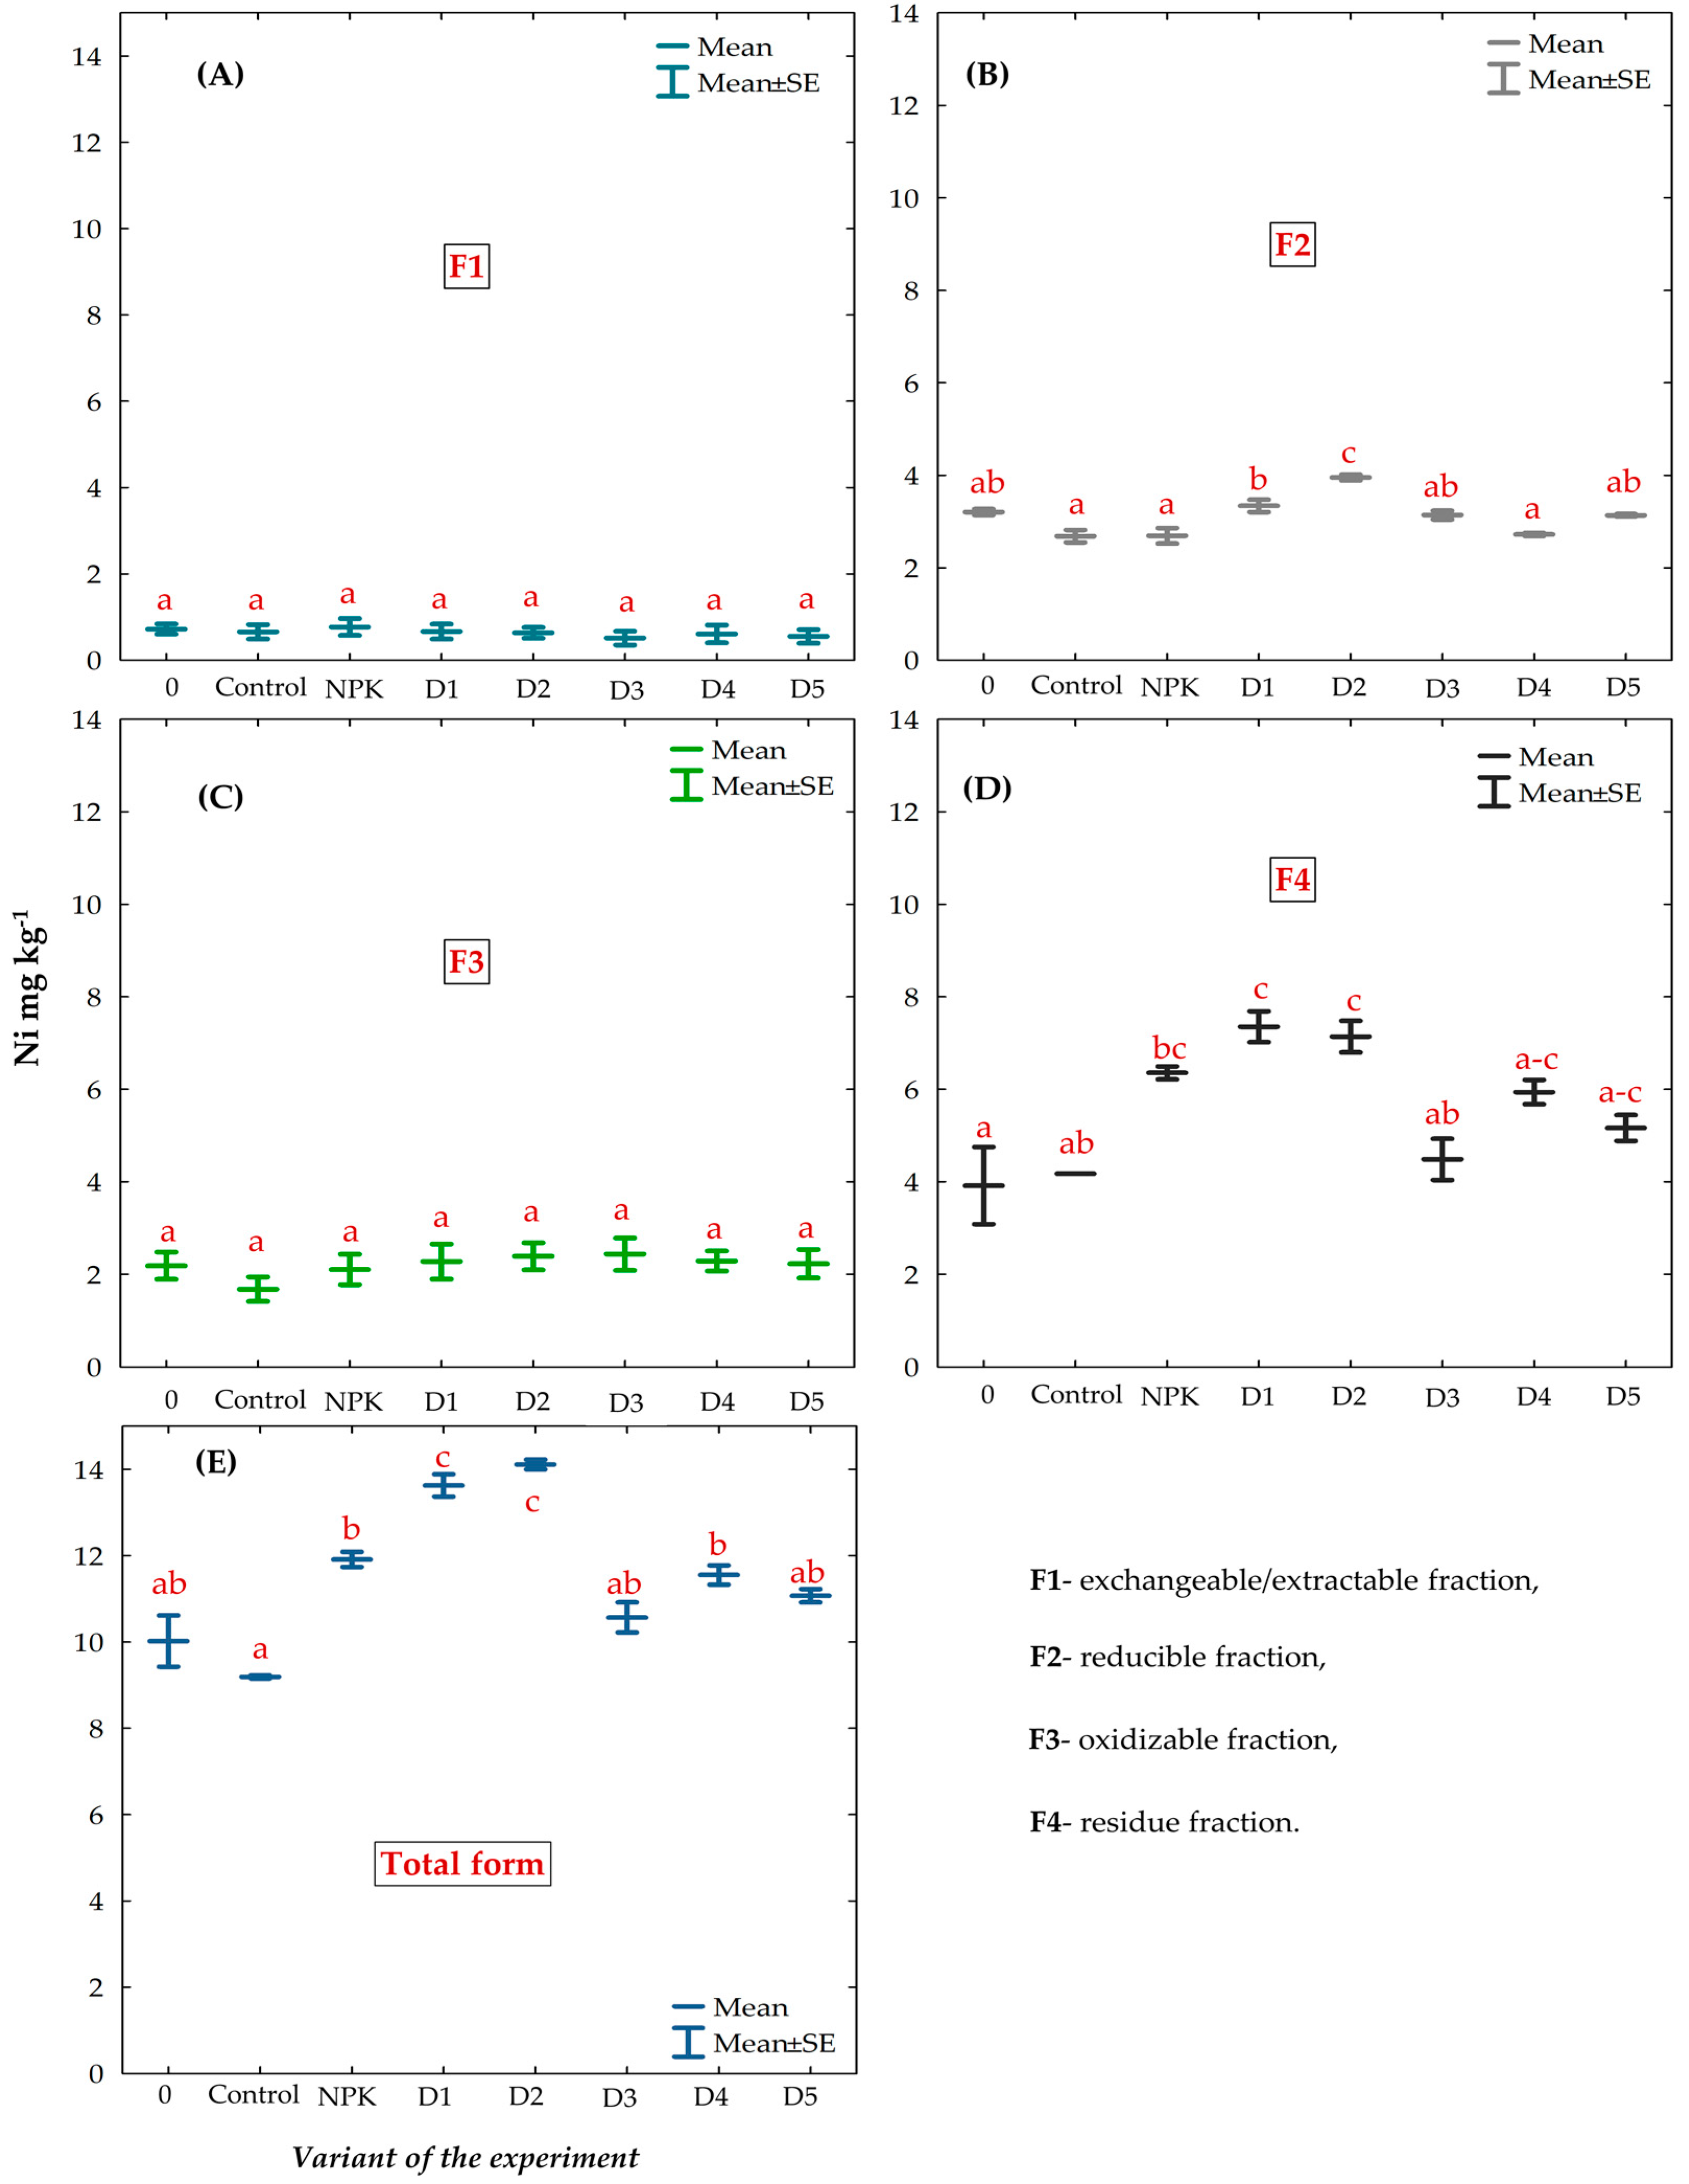
3.5. Chemical Fractions and Total Concentration of Ni in the Gleyic Chernozem Soil Fertilized with BAs

Changes in the mean content of Ni_T and its chemical speciation in the Gleyic Chernozem soil fertilized with BAs are shown in Figure 6, while changes in the percentage share of the individual fractions of this element are presented in Table S5. As indicated by these data, the mean content of the total forms of Ni ranged from 9.19 (control) to 14.11 mg kg−1 (D2) (Figure 6E).
The percentage share of the fractions of Ni decreased as follows: F4 > F2 > F3 > F1 (Figure 6A–D). There was no significant effect of BAs fertilization on the mean content of fractions F1_Ni and F2_Ni, and their mean concentration ranged from 0.51 to 0.77 mg kg−1 and 2.68 to 3.95 mg kg−1, respectively (Figure 6A,B). The concentration of F2_Ni was the lowest in the control, NPK-fertilized soil, and D4 variant, i.e., 2.68, 2.69, and 2.72 mg kg−1, respectively (Figure 6B). The highest content of F2_Ni was observed in the D2 soil. This value was significantly higher than in the other experimental objects. The highest concentration of F3_Ni was detected in object D3, and the lowest in the control; the values ranged from 1.67 to 2.43 mg kg−1. As shown by the statistical analysis, the mean content of F3_Ni did not differ significantly in comparison with the control object and the soil before starting the experiment, irrespective of the fertilization dose applied (Figure 6C).
Among the analyzed Ni fractions, the highest mean content was determined for residual fraction F4 in all the experimental objects (Figure 6D). Its mean content ranged from 3.91 to 7.35 mg kg−1, with the lowest amount in soil 0 and the highest in soil D1. The significance of these differences was confirmed statistically. Additionally, it was found that the mean content of F4_Ni was higher in all experimental objects than in the soil before starting the experiment, but the differences were not statistically significant in any case (Figure 6D).

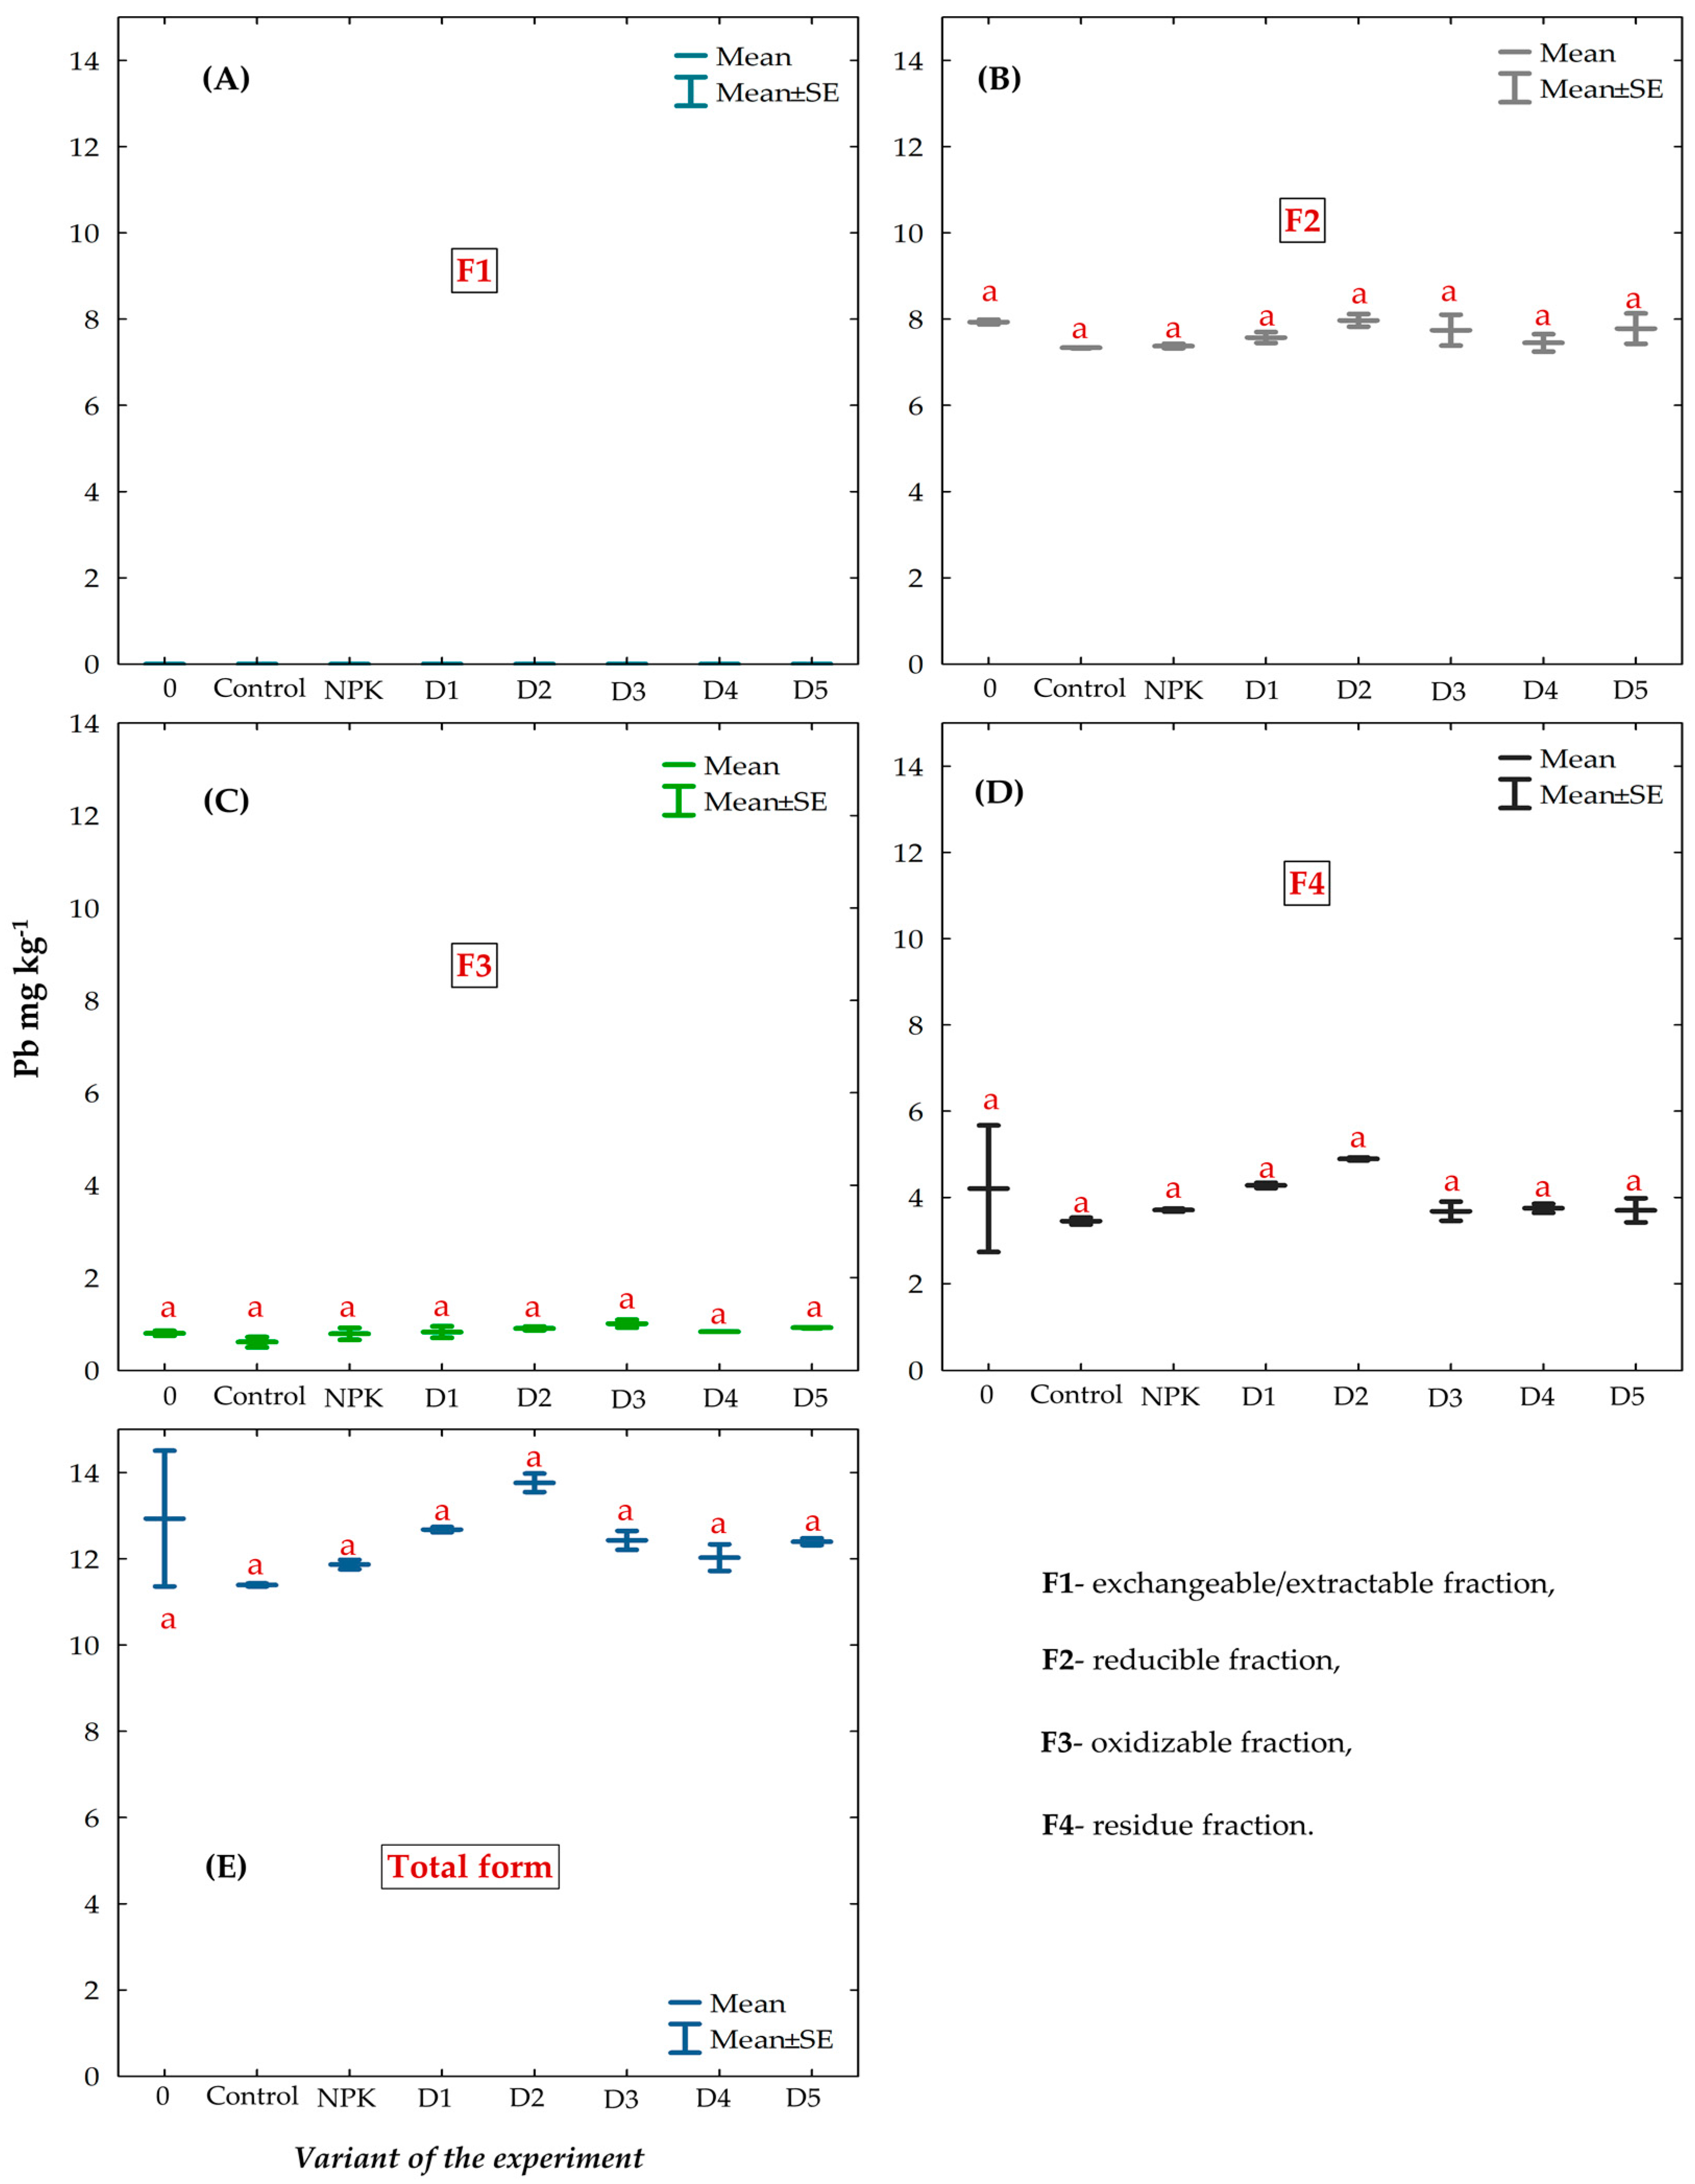
3.6. Chemical Fractions and Total Concentration of Pb in the Gleyic Chernozem Soil Fertilized with BAs

The mean content of the total forms of Pb ranged from 11.39 (control) to 13.77 mg kg−1 (D2) (Figure 7E). With the exception of object D2, all the other variants had a lower content of total Pb forms than the soil analyzed before the experiment (0). Despite the differences, the observed changes were statistically insignificant (Figure 7E).
The speciation analysis of Pb did not show the presence of fraction F1 of Pb in any of the analyzed objects (Figure 7A). Fraction F2 dominated, with the mean content ranging from 7.34 to 7.97 mg kg−1, and its % share in the total Pb content ranged from 57.9 to 64.4% (Table S6). The mean content of fraction F2 of Pb was similar in all experimental objects and showed slight fluctuations during the study period. Additionally, no significant effect of BAs fertilization on changes in F2_Pb was found, as evidenced by the absence of significant differences from the values determined for the control object and for the soil analyzed before the experiment (0) (Figure 7B). The mean content of fraction F3 of Pb ranged from 0.61 to 1.00 mg kg−1, with the percentage share in the total Pb content in the range of 5.3–8.1% (Figure 7C, Table S6). The share of fraction F4 in the total Pb content ranged from 29.6 to 35.6%, with a mean value ranging from 3.45 (control) to 4.89 mg kg−1 (D2) (Figure 7D). Except for objects D1 and D2, the content of F4 of Pb was lower than that of the soil before starting the experiment (0) (Figure 7D).

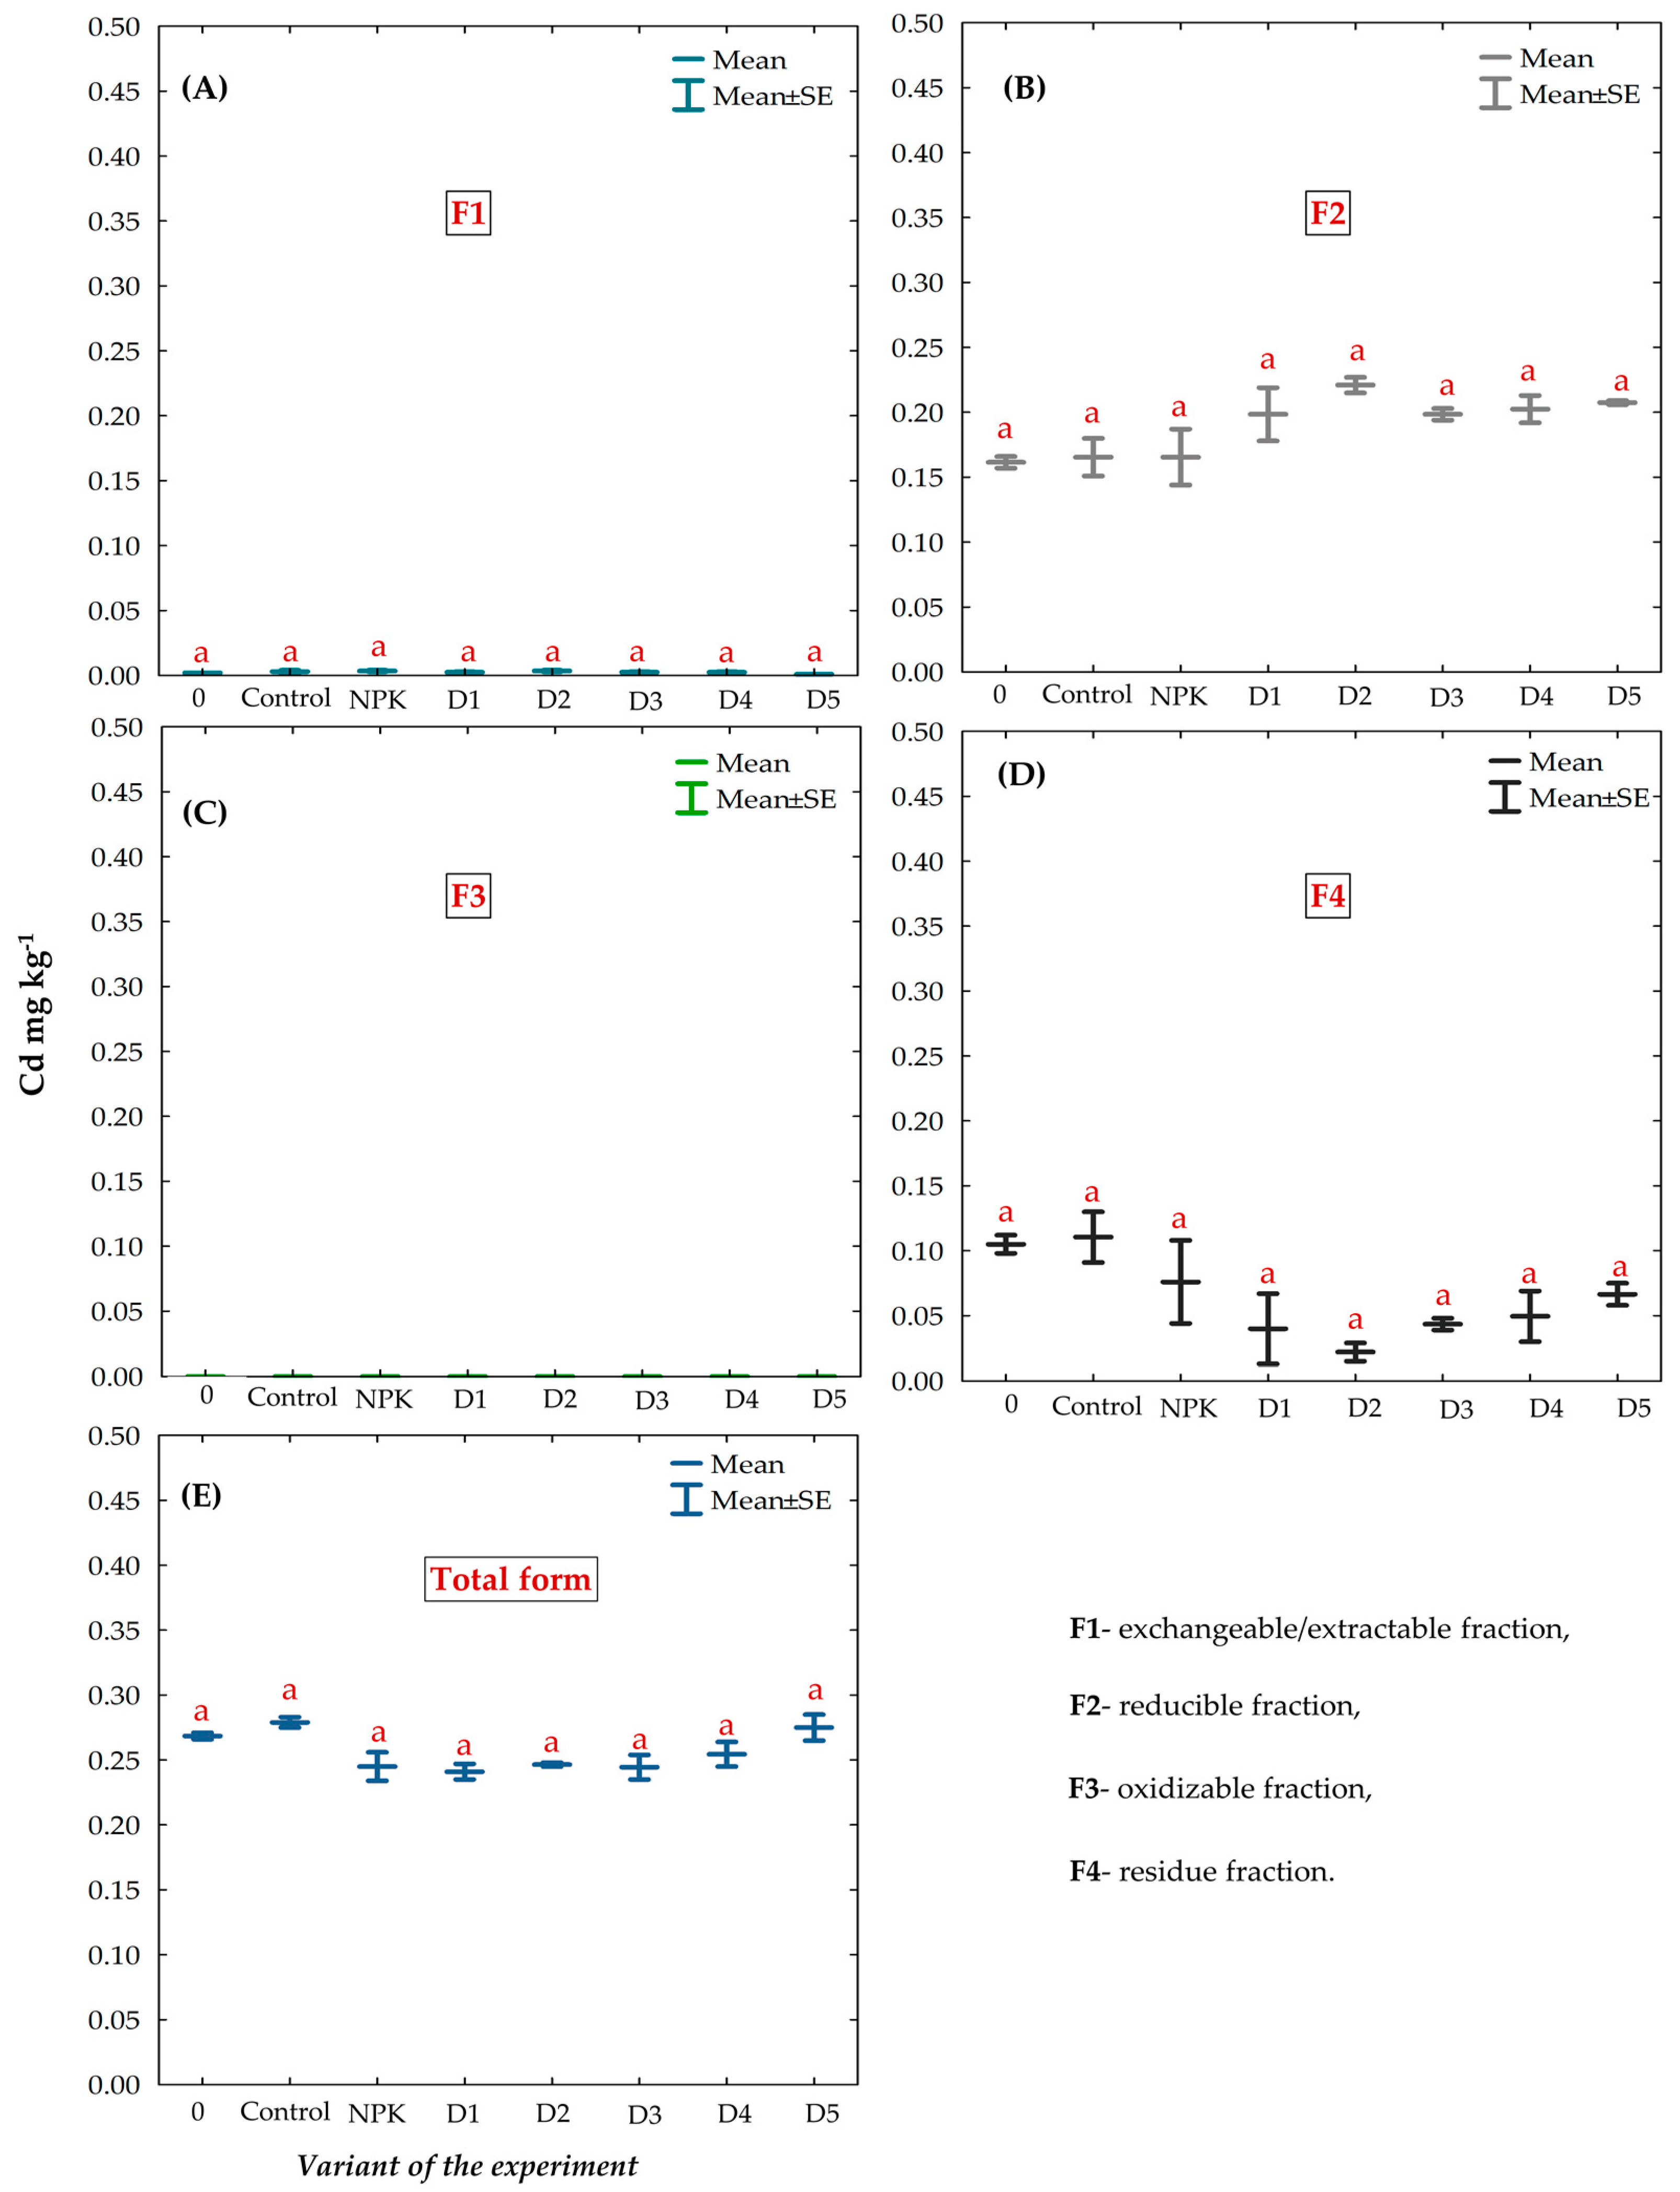
3.7. Chemical Fractions and Total Concentration of Cd in the Gleyic Chernozem Soil Fertilized with BAs

The mean content of the total Cd forms was similar in all experimental objects and varied to a relatively small extent throughout the years of the study. It ranged from 0.241 (D1) to 0.279 (control) mg kg−1. Based on the statistical analysis, it can be concluded that the fertilization applied in the experiment did not significantly differentiate the Cd content in the surface layer of the chernozem soil. Furthermore, the Cd content did not change significantly after BAs fertilization in comparison with soil 0 (Figure 8E). BAs fertilization induced only slight changes in the content of the individual Cd fractions in the soil. Interestingly, no F3 fraction was found in any of the experimental objects. F2 was the dominant fraction, followed by F4 and F1 (Figure 8A–D). The content of fraction F1 of Cd fluctuated slightly and was exhibited at a similar level in all experimental objects (Figure 8A). The share of fraction F1 of Cd in the total content of this element was inconsiderable, as it ranged from 0.4 to 1.4% (Table S7). The content of fraction F2_Cd increased after the application of BAs proportional to the applied doses. The concentration of fraction F2_Cd ranged from 0.161 mg kg−1 in soil 0, to 0.221 mg kg−1 in D2 soil (Figure 8B). It was also observed that the application of BAs contributed to an increase in the share of fraction F2 Cd_T content from approx. 60% (soil analyzed before the experiment, control, and NPK fertilization variant) to approx. 80% (Table S7). The increase in the content of fraction F2 of Cd resulted in a decrease in the content of fraction F4 after the application of BAs (Figure 8D). The mean content of fraction F4 of Cd ranged from 0.110 to 0.022 mg kg−1 in soil fertilized with the D2 dose of BAs. Fraction F4 accounted for the lowest percentage (only 8.9%) in total Cd content in the D4 variant. The share of fraction F4 in the total Cd content in the other BAs-fertilized objects ranged from 16.6 to 24.2%. In turn, the content of fraction F4 in soil 0, control, and NPK-fertilized objects was approx. 30% (Table S7). Despite these differences, the changes were statistically insignificant in all cases (Figure 8A–E).

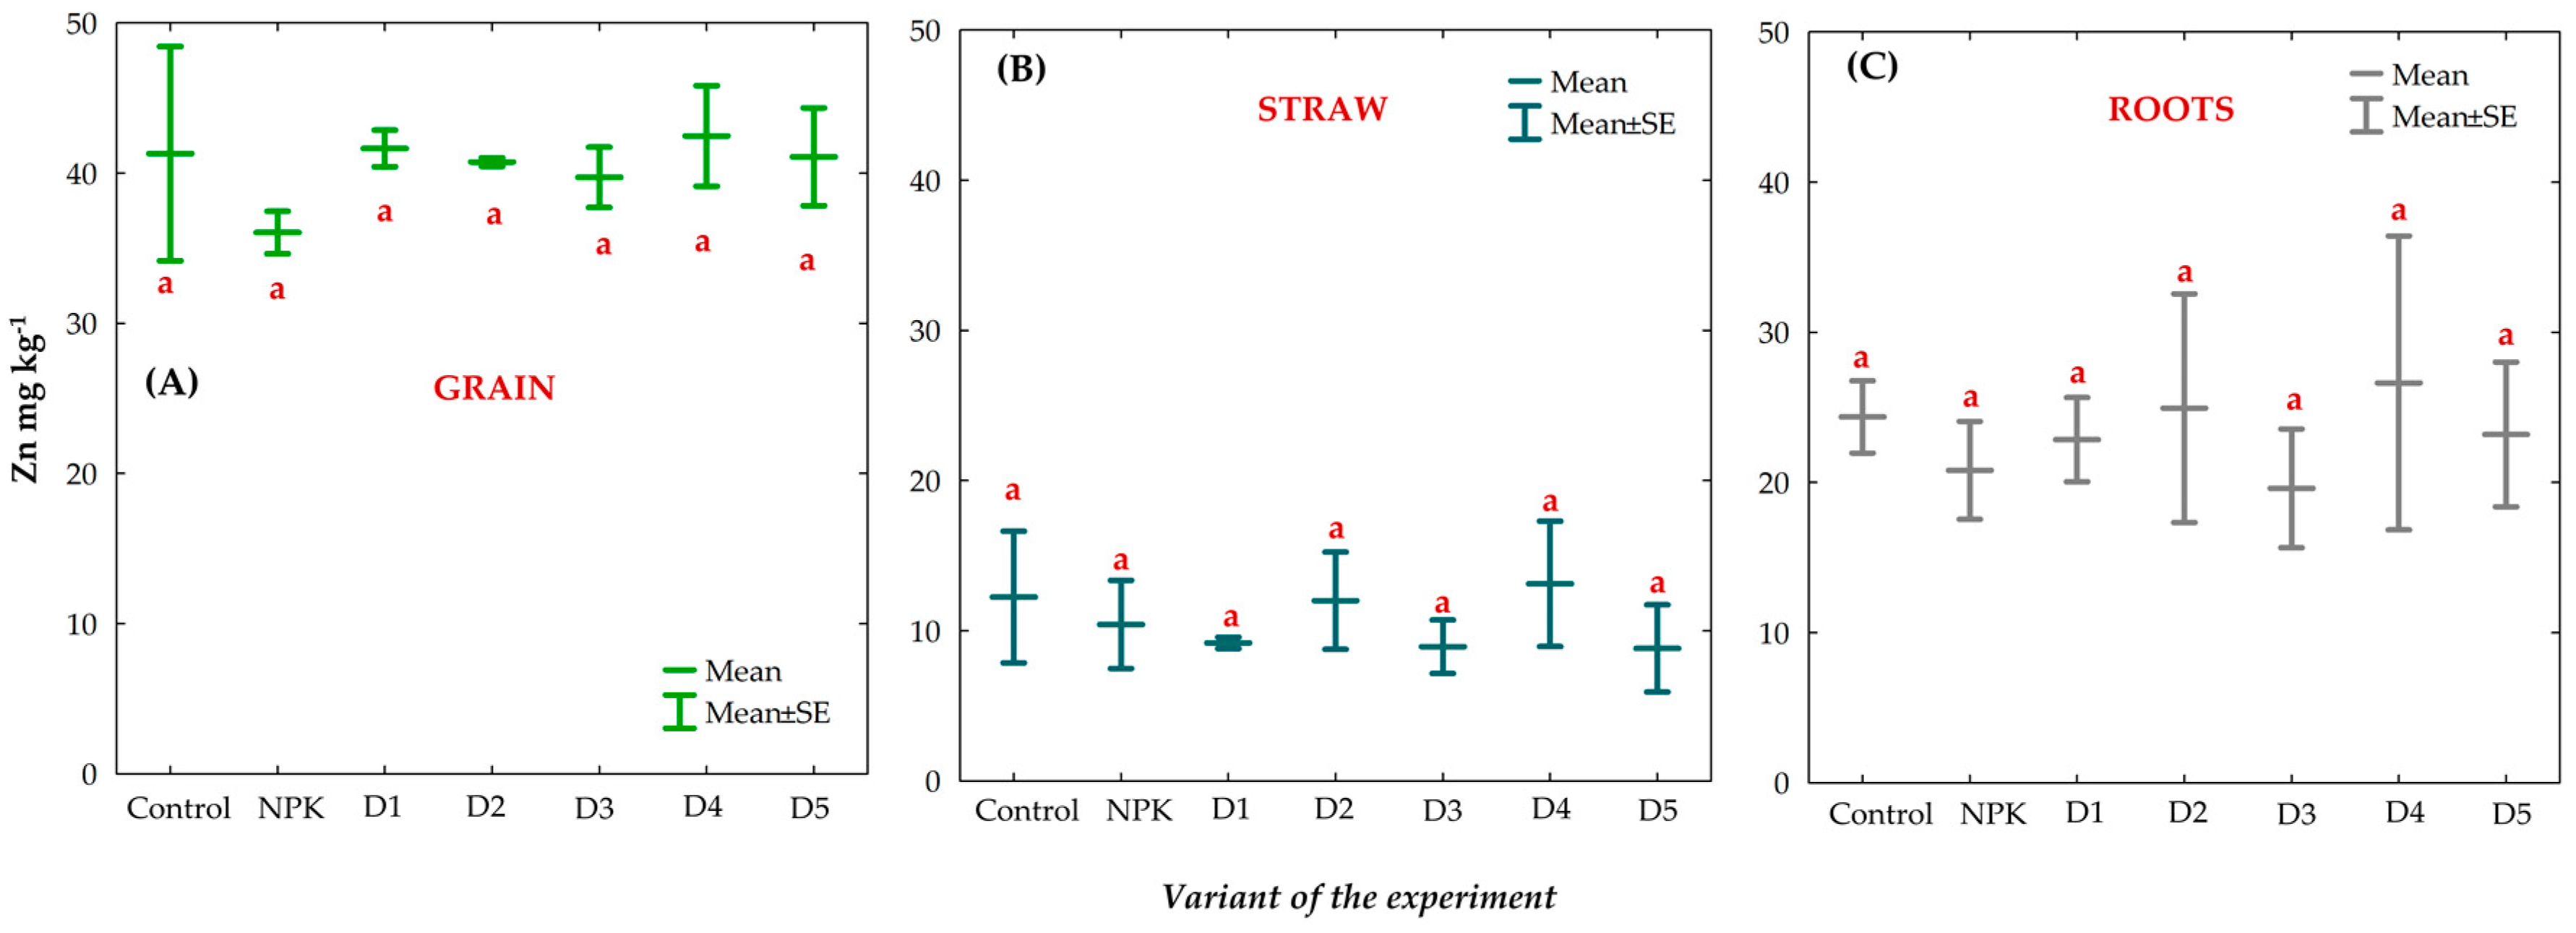
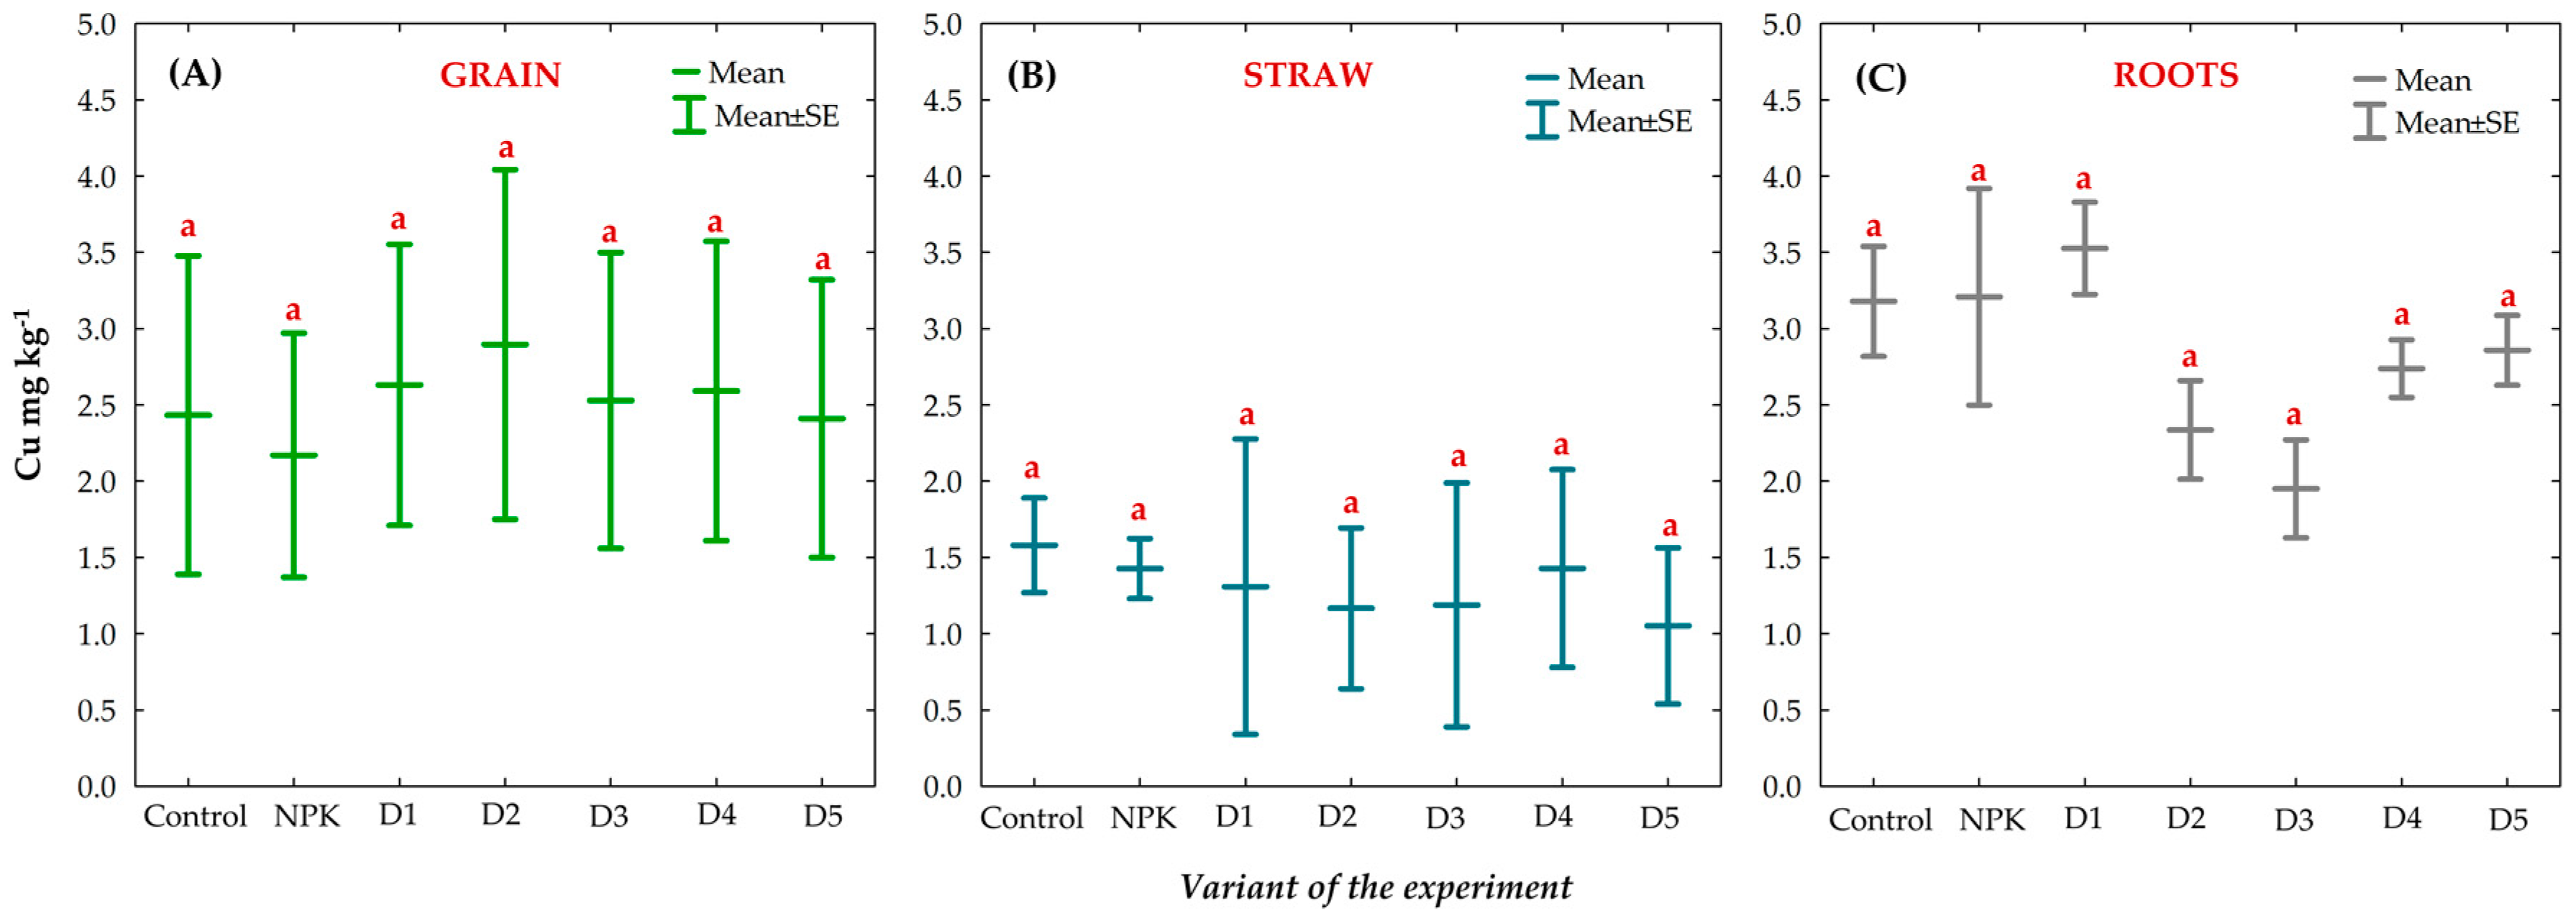
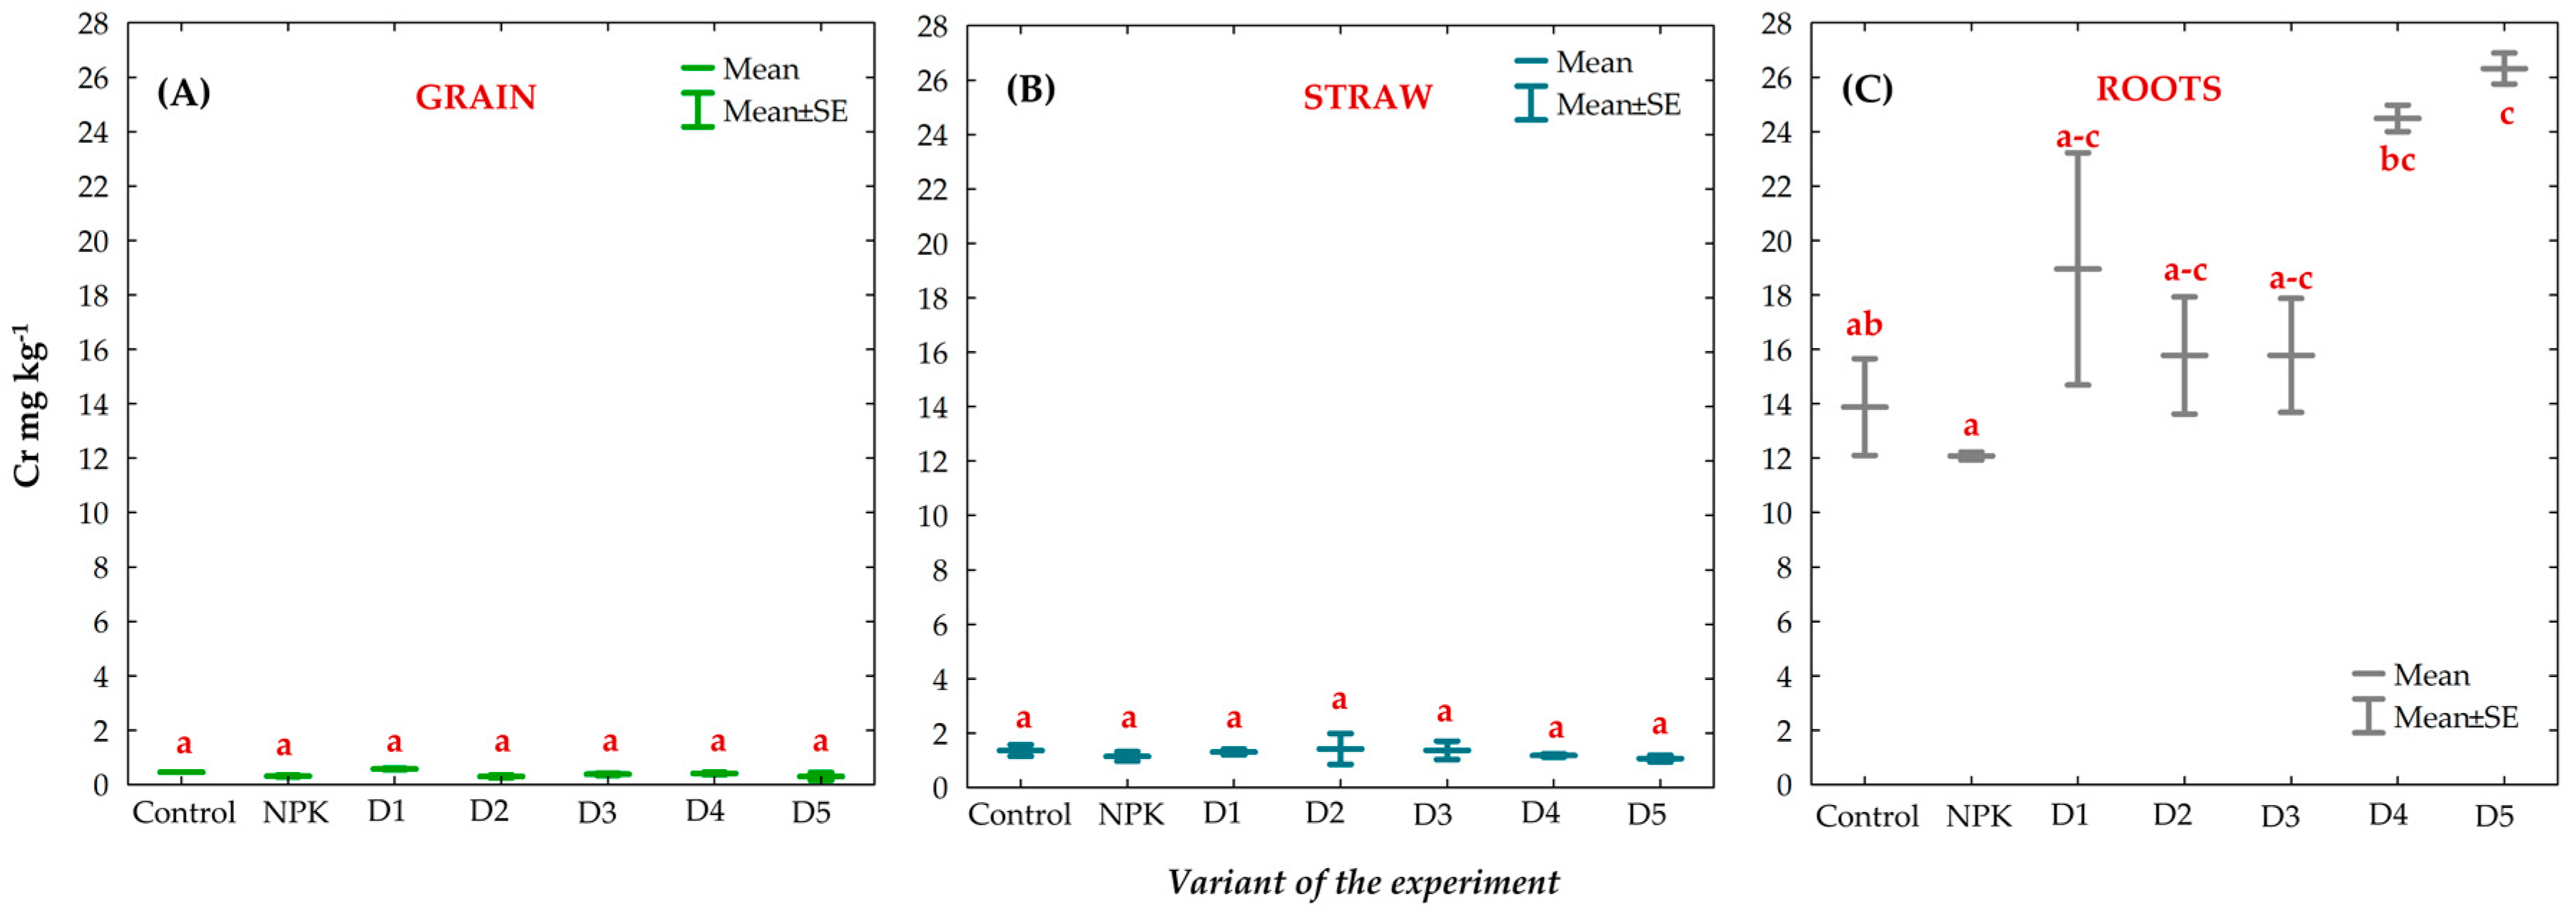
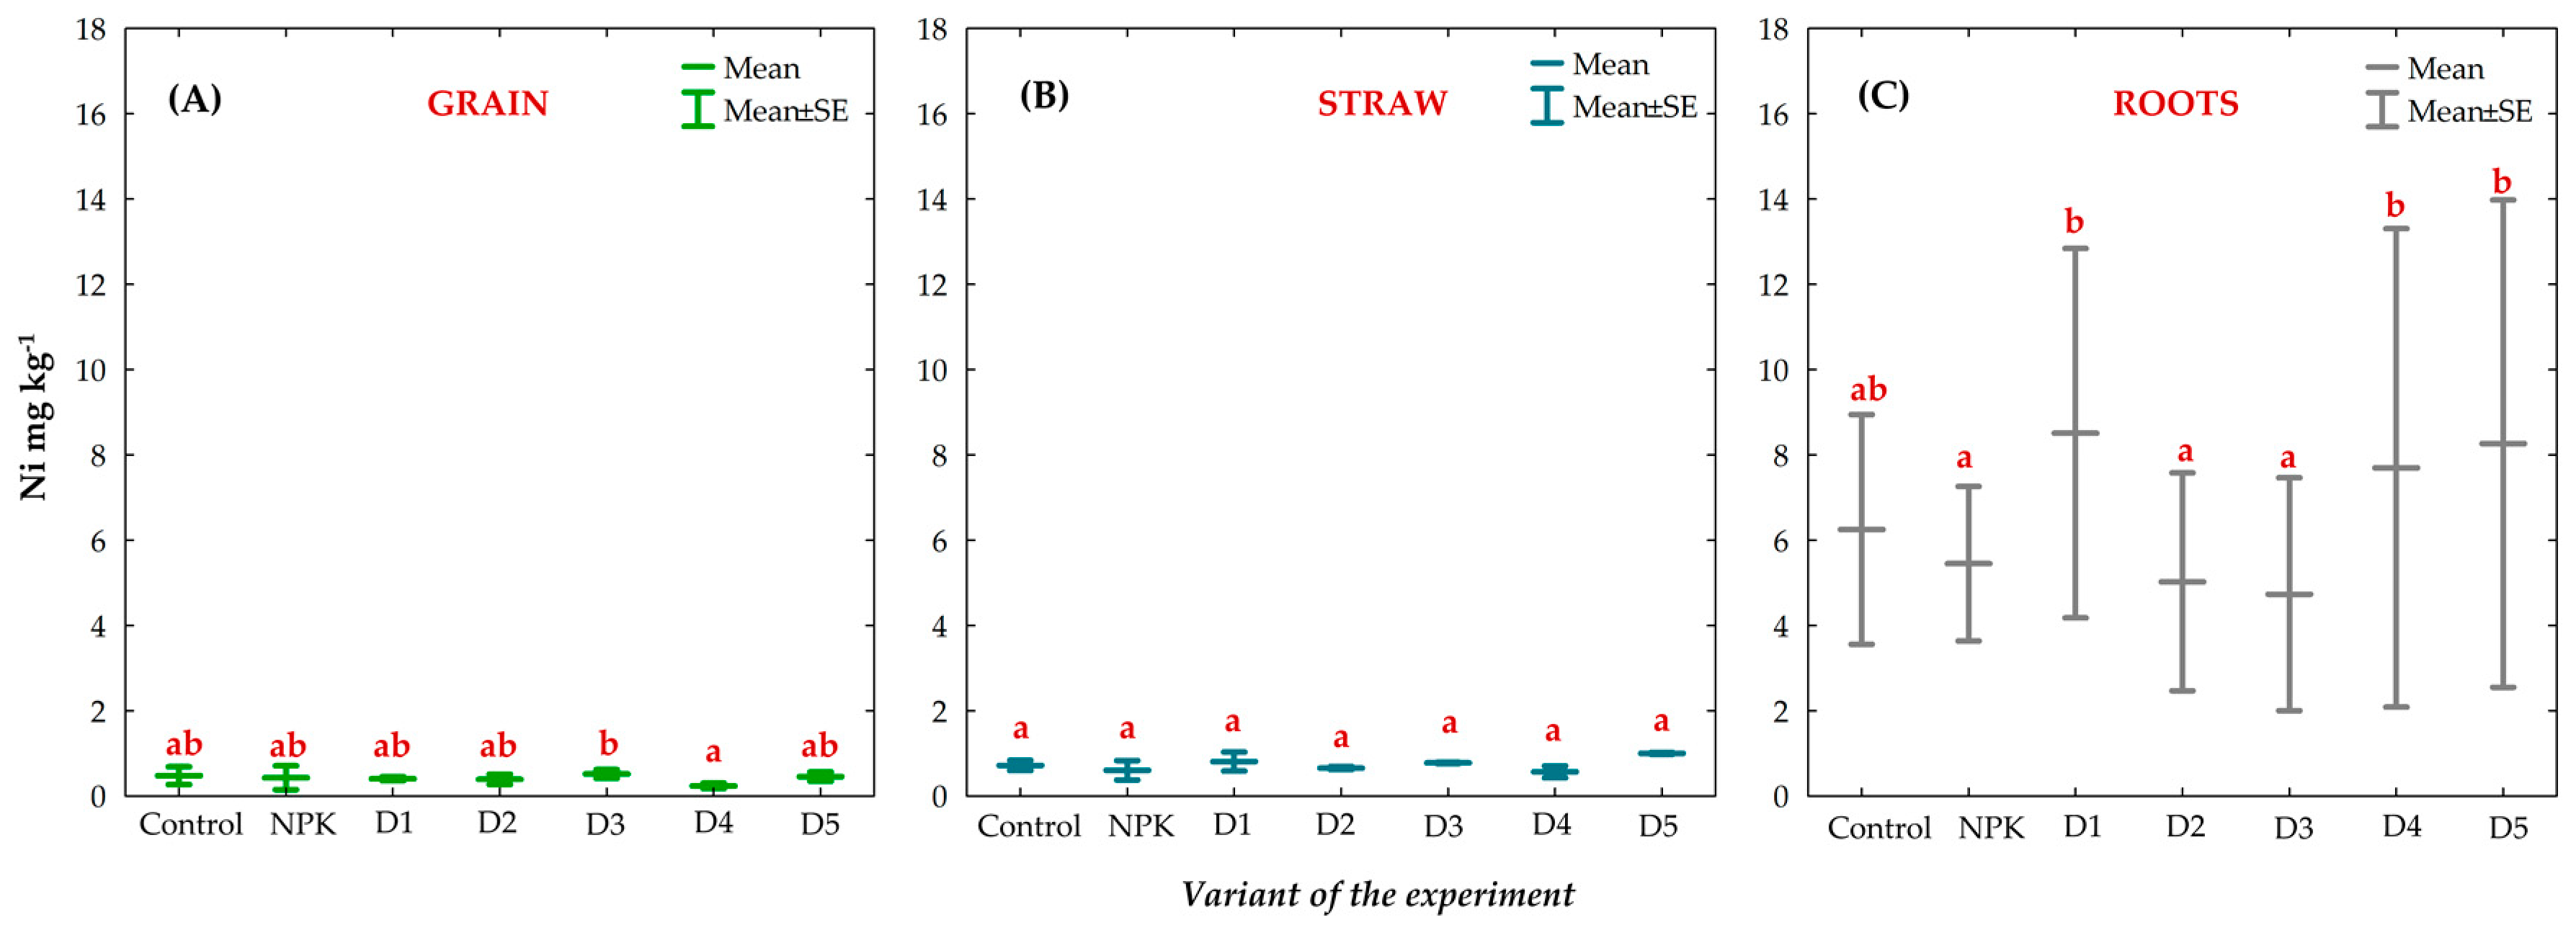
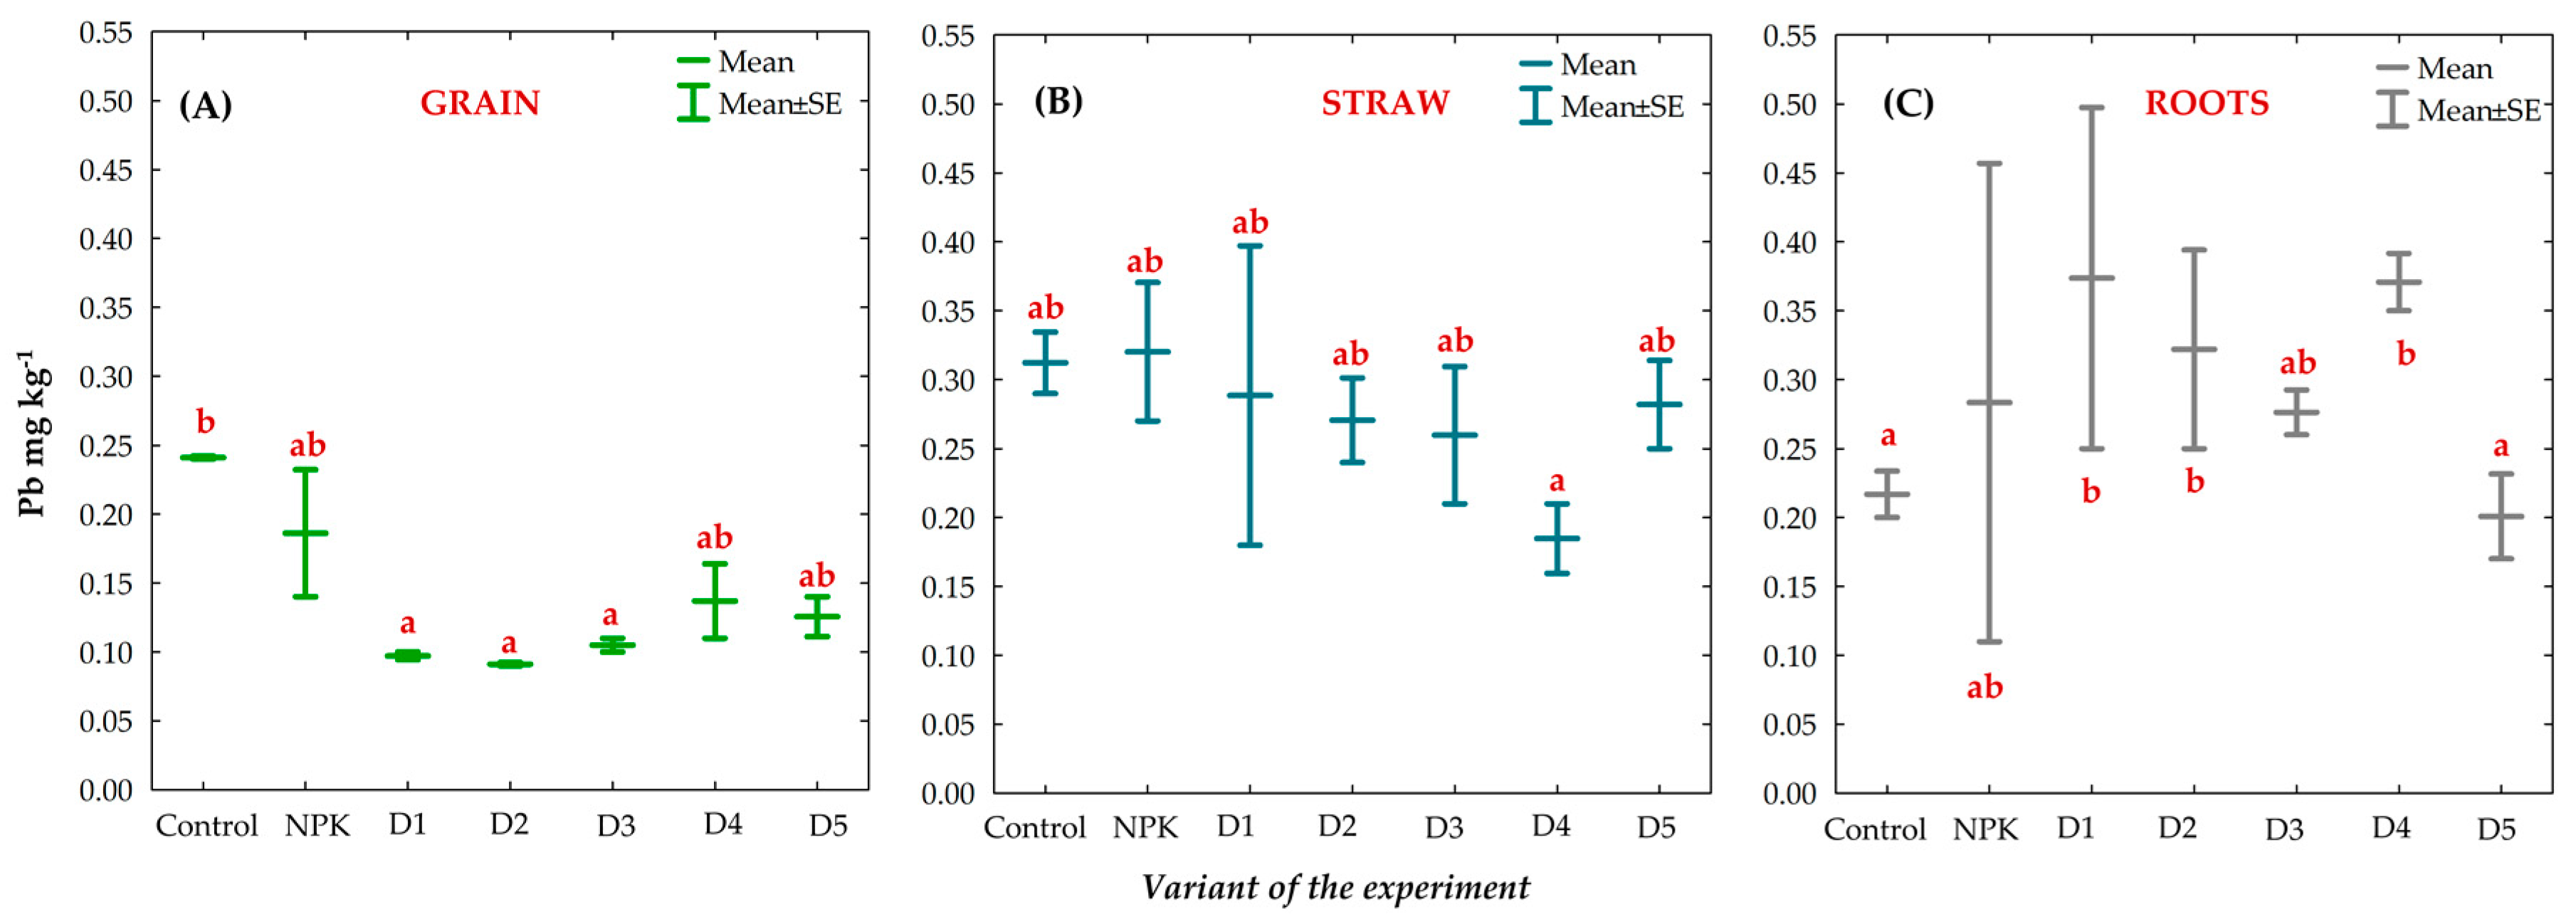
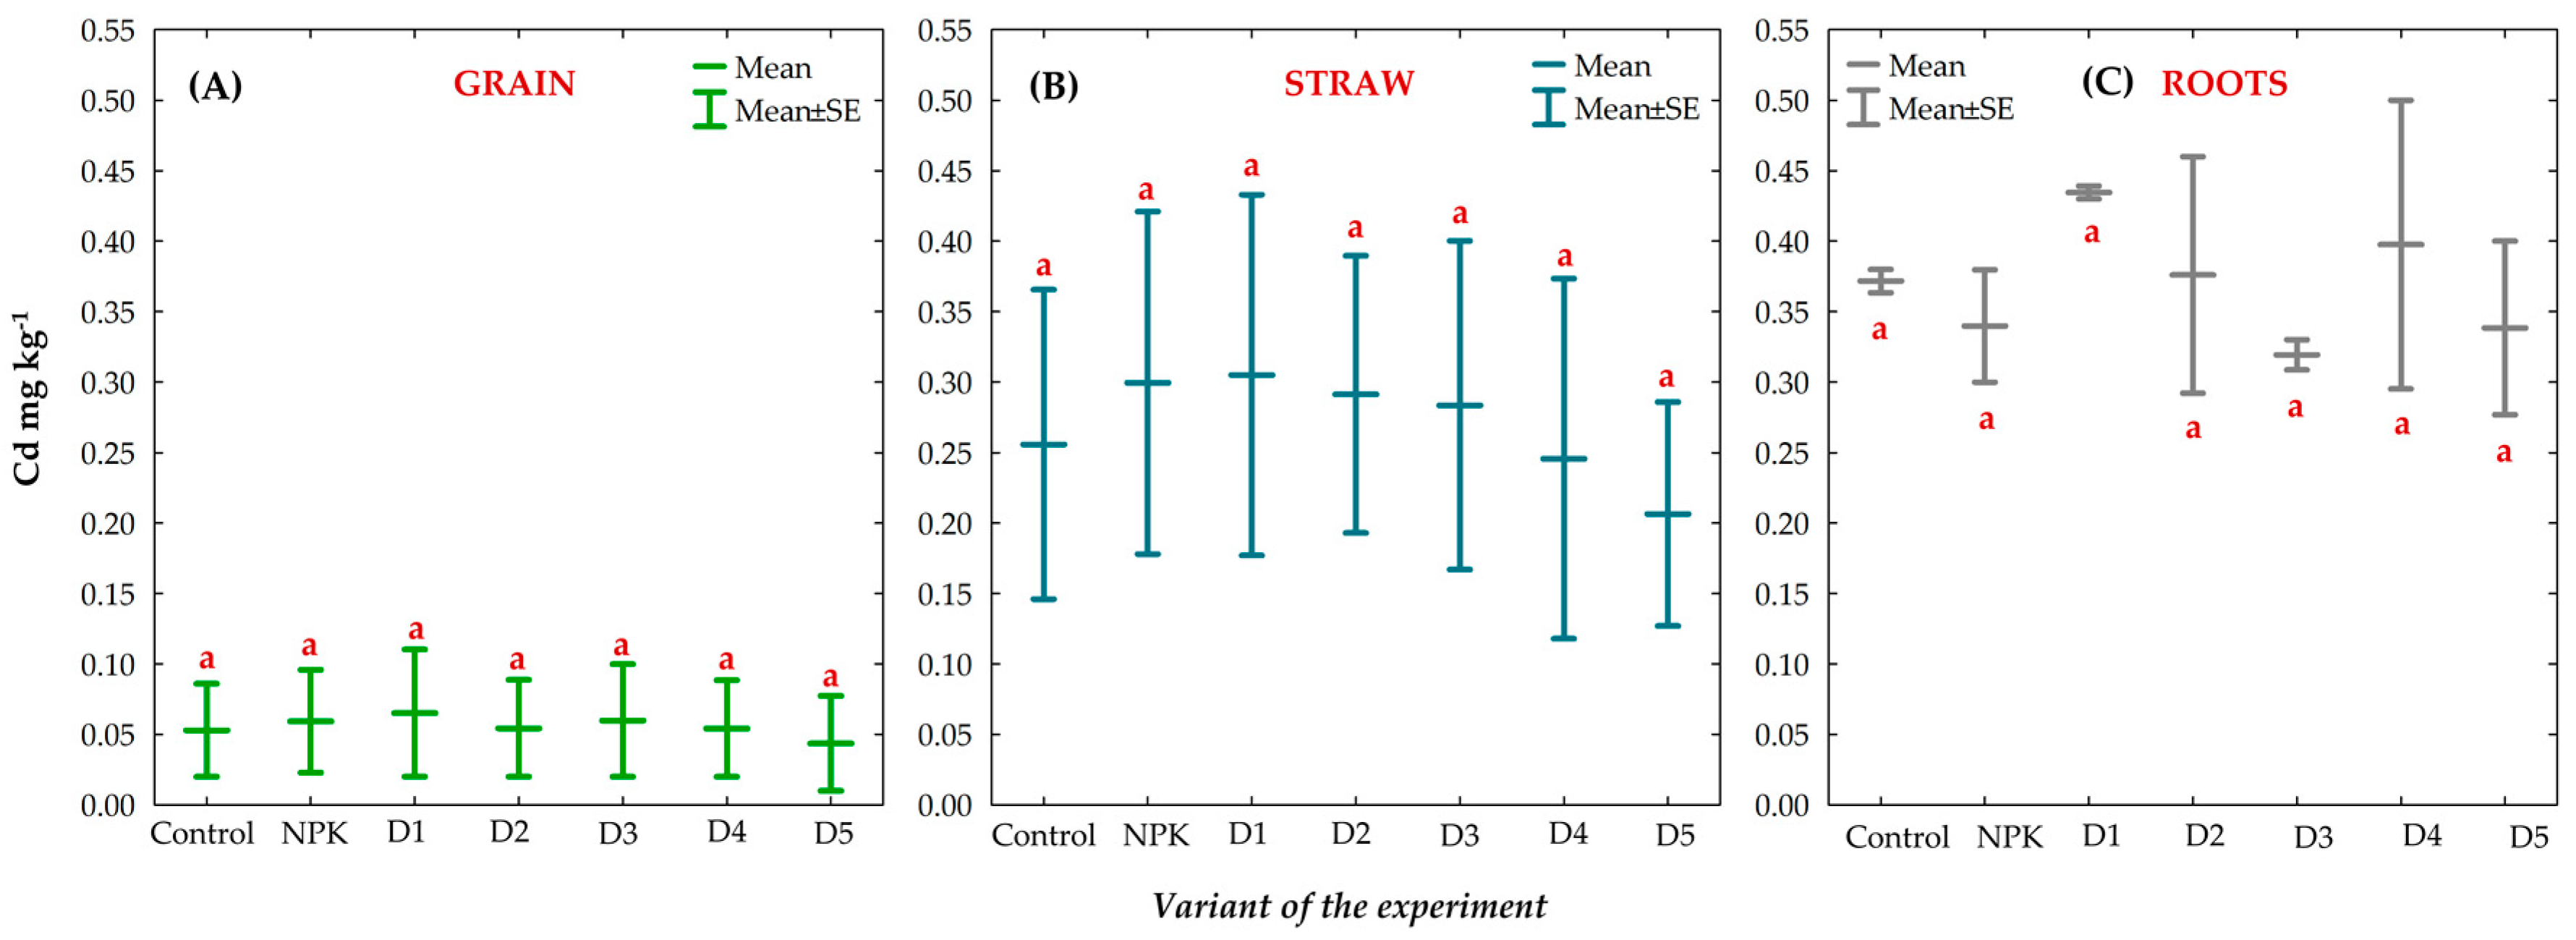
3.8. Effect of BAs on the Concentration of Trace Elements (TEs) in Winter Oilseed Rape Plants

The mean Zn content in the different parts of the winter oilseed rape plants varied throughout the study period (Figure 9A–C). Irrespective of the experimental object, the highest concentrations of Zn were found in the grains, while the lowest was detected in the straw. The concentrations of Zn in the grains, straw, and roots in the individual experimental variants was in the range of 36.06–42.48 mg kg−1, 8.84–13.14 mg kg−1, and 19.62–26.63 mg kg−1, respectively (Figure 9A–C). The lowest Zn concentration in the grains was detected in the plants from the NPK object, and the highest in the plants from the D4 object (Figure 9A). In turn, the lowest mean Zn content in straw was determined in object D5, and the highest value was found in object D4 (Figure 9B). In the case of roots, the lowest mean content of Zn was recorded in object D3, and the highest level was determined in plants fertilized with BAs at the D4 dose (Figure 9C). Despite these differences, the statistical analysis did not show a significant effect of the fertilization on the Zn content in the individual parts of winter oilseed rape cultivated in the chernozem during the study. It is noteworthy that the mean Zn content in the individual plant parts varied throughout the study, as evidenced by the high SE values (Figure 9A–C).
The Cu concentration in the individual parts of the analyzed plants varied during the study period. In general, higher Cu values were recorded in the roots, followed by the grains. The lowest content was detected in the straw (Figure 10A–C). The mean Cu content in the grains was similar in all experimental objects and ranged from 2.17 to 2.89 mg kg−1. However, during the study period, the Cu contents in the oilseed rape grains varied significantly (Figure 10A). Similar findings were provided by the analysis of the straw, i.e., the mean Cu content ranged from 1.05 in object D5 to 1.58 mg kg−1 in the control (Figure 10B). Higher concentrations of Cu were found in the roots of the analyzed plant, with the mean content of this element ranging from 1.95 to 3.53 mg kg−1 during the study period. The lowest concentration of this element was observed in plants fertilized with BAs at the D3 dose, while its highest amount was detected in NPK-fertilized plants (Figure 10C). Despite these differences, there was no statistically significant effect of the fertilization applied in the experiment on the change of Cu content in grain, straw, and roots of the winter oilseed rape plants.
The mean Cr content in the winter oilseed rape parts determined in the study is shown in Figure 11A–C. Regardless of the experimental object, the lowest Cr concentration was found in the grains, while the highest in the roots. The utilized fertilization variant did not exert a significant effect on the Cr concentration in the winter oilseed rape grains and straw. The mean content of Cr in the grains ranged from 0.30 mg kg−1 (D2, D5) to 0.57 mg kg−1 (D1). The straw contained 1.07–1.41 mg kg−1 Cr on average, with the lowest amount detected in the plants fertilized with the highest ash dose (D5) and the highest content in the D2 fertilization variant (Figure 11A,B). A different relationship was observed in the roots, where the mean Cr content increased together with the applied doses of BAs (the mean Cr concentration in the roots of plants from the control and NPK objects was almost twice as low as in objects D4 and D5) (Figure 11C).
The highest concentration of Ni was detected in the winter oilseed rape roots, and its smallest amount was determined in the grains and straw (Figure 12A–C). During the study, the concentration of Ni in the roots ranged from 4.73 to 8.51 mg kg−1. The lowest content of Ni was found in the plants fertilized with the D3 dose of BAs, while the highest in the D1 object. The Ni concentration in the roots of plants D1, D4, and D5 was significantly higher than that in other objects. In addition, the concentration of Ni in the roots varied significantly throughout the study, ranging from 2.00 to 13.97 mg kg−1 in all experimental objects (Figure 12C). During the study, the mean Ni content was in the range of 0.24–0.52 mg kg−1 in the grains and 0.57–1.00 mg kg−1 in the straw. Despite these differences, the mean content of Ni in the grains and straw of the winter oilseed rape did not differ significantly between the experimental variants (Figure 12A,C).
The lowest and highest mean Pb levels were recorded in the winter oilseed rape grains and roots, respectively (Figure 13A–C). Generally, lower Pb amounts in the grains were found in the plants fertilized with the BAs than in the control and NPK treatment (Figure 13A). Similar results were obtained for the straw, where the Pb concentration ranged from 0.19 to 0.32 mg kg−1 during the study period (Figure 13B). Different relationships were determined in the case of the roots of the analyzed plants. In the objects fertilized with the BAs, the Pb content was generally higher (Figure 13C).
The highest mean Cd content was detected in the winter oilseed rape roots, while the lowest was found in grains, regardless of the fertilization variant (Figure 14A–C). The detected concentration of Cd in the grains, straw, and roots were in the ranges of 0.04–0.06, 0.21–0.31, and 0.32–0.43 mg kg−1, respectively, during the study period. Despite the differences in Cd content in the grains, straw, and roots, there was no statistically significant effect of the applied fertilization on the concentration of this element (Figure 14A–C).

4. Discussion

Elements contained in BAs are classified as major, minor, and TEs. The concentration of TEs in BAs is highly variable due to the different origin and species composition of the biomass. The majority of elements present in plant biomasses are TEs (<0.1%), with the exception of Al, B, Ba, Ca, Cl, Cr, Fe, K, Mg, Mn, Na, O, P, S, Si, Sr, and Zn [17]. The use of ashes produced via combustion of various fuels, including biomasses, poses a problem related to the potential introduction of substantial amounts of TEs into soils. After deposition in soils, they undergo various transformations depending on soil properties [30,31,32]. Elucidation of the mechanisms of transformation of trace elements in soils, especially in the presence of various waste materials, is one of the most important tasks in environmental sciences [33,34]. Given the considerable differences in their quality and chemical composition, including the content of TEs, ashes should be analyzed in detail before application as crop fertilizers, and their impact on various soil properties should be monitored continuously [8]. The effect of fertilization with biomass combustion ash on the content of TEs in the soil depends primarily on the concentration of these elements in the ash and the amount of ashes used for soil treatments [35].
The ashes originating from the combustion of agricultural and forest biomasses analyzed in the present study and used to fertilize the Gleyic Chernozem soil exhibited a varied content of analyzed trace elements. The highest content in the ashes used in the experiment was determined for Zn and Cu (Table 1). These elements are important micronutrients necessary for the proper growth and development of plants; however, in excess amounts, they may become toxic to plants and other living organisms. The biomass combustion ashes used in the experiment had a substantial content of Cr, followed by Pb and Ni (Table 1). Elevated amounts of TEs, most often Pb, in biomass combustion ashes are reported sporadically [13,14].
Due to the alkaline reaction of ashes, the trace elements contained therein are present in hard-to-reach forms, i.e., they do not pose a risk to the environment [13]. It is generally accepted that the solubility and mobility of most trace elements contained in BAs and coal combustion ashes in the environment are clearly pH-dependent, and their alkaline nature inhibits the release of Al, Cd, Co, Cu, Fe, Hg, Mn, Ni, Pb, Sn, Ti, and Zn. In contrast, high pH may result in an increased release of As, B, Cr, F, Mo, Sb, Se, V, and W [17,35].
Normal levels of Zn, Cu, Pb, Ni, Cd, and Cr in soils range from 0.0001 to 0.065%. When their content in the soil increases above 0.1%, these elements become toxic to plants [30,35,36]. The present study demonstrated that the application of BAs contributed to significant differences in the mean content of total Cu forms in the surface layer of the Gleyic Chernozem soil (Figure 4E). The mean Cu content in the control, NPK-fertilized soil, and soil analyzed before starting the experiment (0) had significantly lower values than in the soil fertilized with BAs. The greatest increase in the content of the total forms of this element during the three study years was exhibited by the soil fertilized with the highest BA dose of 2.5 Mg ha−1 (D5). The level of Zn, which was characterized by the highest concentration in the BAs used in the experiment, did not show any significant changes in the chernozem soil. The mean Zn values were higher than in the control, but generally lower than in the soil analyzed before the experiment (Figure 3E). In the case of the other analyzed elements, including those exerting phytotoxic effects, such as Cd and Pb, significant changes in their content were observed compared to the soil samples analyzed before the experiment. This suggests that the application of BAs did not cause significant changes in the soil contamination levels, and these ashes can be used in agriculture. As reported by Gibczyńska et al. (2014), the use of biomass combustion ashes significantly increases the content of Cu, Mn, Ni, and Zn in soils, but has no effect on the content of Cd and Pb [18]. This is consistent with the present results.
Elements such as Cd, Co, Cr, Cu, Fe, Pb, Ni, and Zn contained in BAs are generally found in trace amounts and in various chemical forms, differing in their mobility and bioavailability [37]. Therefore, an analysis of their total content is insufficient to assess their potential environmental impact. Through the determination of the chemical forms of elements contained in ashes, the speciation analysis used for evaluation of this type of waste helps identify the share of the most mobile and bioavailable fractions, which facilitates estimation of their potential impact on the environment [38]. The lowest amounts of trace elements contained in the BAs used in this experiment were detected for the most mobile and bioavailable F1 fraction. In the biomass combustion ashes used in the experiment, residual fraction F4 accounted for the highest content of Zn, Cr, and Pb, i.e., 71, 96, and 89%, respectively (Table 1). Such a large share of fraction F4 of these elements proves their low availability to plant roots. Different dependencies were observed in the case of Cu, Ni, and Cd, which were characterized by the largest share of reducible fraction F2. It is believed that the elements associated with this fraction are absorbed to a lesser extent; nevertheless, in specific conditions, e.g., low pH or altered oxidation–reduction potential, this fraction can become soluble, exchangeable, and bioavailable [38]. Similar results were also reported by Jukić et al. (2017), who found the lowest content of fraction F1 and the highest content of fraction F4 in ashes [38]. Based on the present results, it can be concluded that the majority of the determined elements are difficult to leach in normal natural conditions, and the use of ashes in agriculture poses a relatively low risk to the environment, which was also confirmed by the determined RAC indexes (Table 1). As reported by Koniuszy-Nycz (2018), the mobile forms of metals contained in biomass combustion ashes, with the potential to migrate from the ash to water and soil, account for 0% (Zn, Pb, Cr, Cd), several percent (Fe, Cu, Co), or 10% (Ni) [37].
There was no significant effect of the biomass combustion ashes on changes in the content of the individual trace elements fractions in the surface layer of the Gleyic Chernozem soil. In the case of Zn, Cr, and Pb, the residual F4 fraction had the largest share, whereas the exchangeable/extractable F1 fraction was the least abundant, regardless of the applied fertilization (Figure 4A–D, Figure 6A–D and Figure 8A–D). In this respect, the analyzed objects fertilized with the BAs for three years did not differ from the soil analyzed before the experiment. In turn, fraction F2 had the largest share in the case of Cu, Ni, and Cd. In comparison with the content of this fraction in the soil before the experiment, the control, and the NPK variant, its content did not exhibit a significant increase in the soil over the three-year study period (Figure 4A–D, Figure 6A–D and Figure 8A–D).
The use of the Bas did not cause any significant changes in the content of the analyzed trace elements in the winter oilseed rape plants. In general, the roots contained higher levels of TEs than the grains and straw, with the exception of Zn and Cd, which were mostly accumulated by the grains of these plants, regardless of the fertilization applied (Figure 9A–C, and Figure 14A–C). It is well known that trace elements are retained to a greater extent within the root zone of the plants, and their translocation to various parts of plant depends on their chemical form or plant species [39,40]. As mentioned earlier, the mobility and bioavailability of trace elements depend mainly on soil pH. Additionally, it largely depends on the content of organic matter, granulometric composition, content of iron (Fe), manganese (Mn), and aluminum (Al) oxides, sorption capacity, water properties, type of metal, soil salinity, and soil biological properties [33,41,42]. The mobility of trace elements is also influenced by compounds secreted by plant roots, e.g., organic acids, which change soil properties, such as pH or redox potential [43]. In general, a high content of organic matter in the soil and a pH close to neutral have an impact on the transformation of trace elements into biologically inactive forms [44]. Given the factors influencing the mobility and solubility of trace elements, e.g., overall soil properties, the distribution of their chemical fractions differs between the types of soils. The mechanism of the release of these elements, their assimilation by plant roots, and their accumulation in both primary and secondary crops differ as well. The three-year study conducted on Gleyic Chernozem soil showed no significant effect of applied fertilization on the accumulation of trace elements in the analyzed parts of winter oilseed rape plants. The absence of differences between the control object and the fertilization variants may be associated with several issues. One of these factors is primarily the type and properties of soil [45]. The study was carried out on Gleyic Chernozem soil with a substantial content of organic matter, which largely influences TE sorption. In addition, the solubility of the components contained in ashes is influenced by weather conditions. In field experiments, some changes may be difficult to detect due to the variability of prevailing meteorological conditions. It is noteworthy that the ashes were used in relatively low doses in the experiment, which did not cause significant changes in the content of the total forms and chemical fractions of the trace elements in the soil. As reported by Szostek et al. (2023), biomass combustion ashes used in a short-term pot experiment significantly increased the content of Mn, Zn, Cu, Cr, and Ni in spring rape oilseed grains [11]. The slight changes in the TE accumulation in the winter oilseed rape biomass may also have resulted from the properties of the ashes used in the experiment, i.e., their alkaline reaction (Table S1). The alkaline pH value of ashes and the presence of mineral colloids with sorption properties, e.g., Fe and Mn oxides, increase the absorption of trace elements such as Pb [46,47]. It is well known that higher pH values reduce the solubility and mobility of most trace elements [11,35]. Reducing the mobility of these elements as a result of the increase of soil pH, could have caused their greater accumulation in the root zone [11]. Increased immobilization of some trace elements after treatment with ashes was indicated also by Jakubus et al. (2021) [48].
The present study has demonstrated that the use of biomass combustion ashes does not induce significant changes in the total content of trace elements and does not alter the degree of soil contamination. Due to the low amounts of the most mobile and bioavailable fractions, the fertilization of soil with biomass combustion ashes does not contribute to the spread of trace elements, especially the most toxic TEs, into various parts of the natural environment. Hence, biomass combustion ashes can be a good alternative fertilizer providing soil and plants with nutrients, in line with the principles of sustainable development.

5. Conclusions

The BAs used in the field experiment were relatively safe for the environment due to the highest content of analyzed trace elements in the residual fraction (F4). Hence, the trace elements contained in BAs, especially those with phytotoxic effects, do not spread easily in the natural environment. Due to the low concentration of trace elements on fraction F1 (the most mobility and bioavailability for plants) in BAs, most of the analyzed elements were found in winter oilseed rape plant roots. However, the BAs used as fertilizer within the three-year study period significantly increased the content of Zn and Cu in Gleyic Chernozem soil (0–30 cm). It should also be noted that BAs did not significantly influence the concentration of toxic elements in analyzed soil, i.e., Cr, Ni, Pb, and Cd. It was also found that the application of BAs did not cause any significant changes in the BCR chemical fractions of trace elements in analyzed soil. Regardless of the utilized fertilization, the residual fraction (F4) accounted for the largest percent, while the extractable/exchangeable (F1) was the smallest share. Regardless of the obtained results, the use of BAs for fertilization purposes should be monitored continuously due to the significant content of trace elements in this fertilizer. Additionally, an analysis of the content of individual trace element fractions in BAs should be carried out to assess their actual impact on the environment. This can help indicate further actions that should be taken to limit their negative environmental impact.

Supplementary Materials

The following supporting information can be downloaded at: https://www.mdpi.com/article/10.3390/agronomy13030942/s1. Section S1: Filed experiment conditions, Table S1: Physicochemical properties of ash from biomass combustion used in the experiment (mean ± standard error); Section S2: The BCR procedure scheme; Table S2: Percent share of BCR fractions in the total Zn content; Table S3: Percent share of BCR fractions in the total Cu content; Table S4: Percent share of BCR fractions in the total Cr content; Table S5: Percent share of BCR fractions in the total Ni content; Table S6: Percent share of BCR fractions in the total Pb content; Table S7: Percent share of BCR fractions in the total Cd content.

Author Contributions

M.S. conceptualization, investigation, data curation, writing—original draft preparation, writing—review and editing, methodology; E.S.-K. investigation; A.I. investigation, visualization. All authors have read and agreed to the published version of the manuscript.

Funding

The present research and Open Access fees were partially funded with a subsidy to maintain the Department of Soil Science, Environmental Chemistry, and Hydrology research potential of the University of Rzeszów for 2023.

Data Availability Statement

The entire set of raw data presented in this study is available on request from the corresponding author.

Acknowledgments

The authors would like to thank anonymous reviewers for the thorough assessment of the present paper, and their many valuable and helpful suggestions.

Conflicts of Interest

The authors declare no conflict of interest.

References

  1. Yana, S.; Nizar, M.; Irhamni; Mulyati, D. Biomass waste as a renewable energy in developing bio-based economies in Indonesia: A review. Renew. Sustain. Energy Rev. 2022, 160, 112268. [Google Scholar] [CrossRef]
  2. Cruz, N.C.; Silva, F.C.; Tarelho, L.A.C.; Rodrigues, S.M. Critical review of key variables affecting potential recycling applications of ash produced at large-scale biomass combustion plants. Resour. Conserv. Recycl. 2019, 150, 104427. [Google Scholar] [CrossRef]
  3. Zhai, J.; Burke, I.T.; Stewart, D.I. Beneficial management of biomass combustion ashes. Renew. Sustain. Energy Rev. 2021, 151, 111555. [Google Scholar] [CrossRef]
  4. Silva, F.C.; Cruz, N.C.; Tarelho, L.A.C.; Rodrigues, S.M. Use of biomass ash-based materials as soil fertilizers: Critical review of the existing regulatory framework. J. Clean. Prod. 2019, 214, 112–124. [Google Scholar] [CrossRef]
  5. Munawar, M.A.; Khoja, A.H.; Hassan, M.; Liaquat, R.; Naqvi, S.R.; Mehran, M.T.; Abdullah, A.; Saleem, F. Biomass ash characterization, fusion analysis and its application in catalytic decomposition of methane. Fuel 2021, 285, 119107. [Google Scholar] [CrossRef]
  6. Thomas, B.; Yang, J.; Mo, K.; Abdalla, J.; Hawileh, R.; Ariyachandra, E. Biomass ashes from agricultural wastes as supplementary cementitious materials or aggregate replacement in cement/geopolymer concrete: A comprehensive review. J. Build. Eng. 2021, 40, 102332. [Google Scholar] [CrossRef]
  7. Waste Framework Directive (2008/98/EC) of the European Parliament and of the Council of 19 November 2008 on waste and repealing certain Directives. Available online: http://eur-lex.europa.eu/LexUriServ/LexUriServ.do?uri=CELEX:32008L0098:EN:NOT (accessed on 1 December 2022).
  8. Zając, G.; Szyszlak-Bargłowicz, J.; Gołębiowski, W.; Szczepanik, M. Chemical Characteristics of Biomass Ashes. Energies 2018, 11, 2885. [Google Scholar] [CrossRef] [Green Version]
  9. Kramar, V. Possible utilization directions of ash from biomass combustion. Biomass ash as fertilizer in agriculture. UABIO Bioenergy Assoc. Ukr. 2020, 27, 33–36. [Google Scholar]
  10. Szpunar-Krok, E.; Szostek, M.; Pawlak, R.; Gorzelany, J.; Migut, D. Effect of Fertilisation with Ash from Biomass Combustion on the Mechanical Properties of Potato Tubers (Solanum tuberosum L.) Grown in Two Types of Soil. Agronomy 2022, 12, 379. [Google Scholar] [CrossRef]
  11. Szostek, M.; Szpunar-Krok, E.; Jańczak-Pieniążek, M.; Ilek, A. Short-Term Effect of Fly Ash from Biomass Combustion on Spring Rape Plants Growth, Nutrient, and Trace Elements Accumulation, and Soil Properties. Int. J. Environ. Res. Public Health 2023, 20, 455. [Google Scholar] [CrossRef]
  12. Pasquali, M.; Zanoletti, A.; Benassi, L.; Federici, S.; Depero, L.E.; Bontempi, E. Stabilized biomass ash as a sustainable substitute for commercial P-fertilizers. Land Degrad. Dev. 2018, 29, 2199–2207. [Google Scholar] [CrossRef]
  13. Poluszyńska, J. Possibilities of applications of fly ash from the biomass combustion in the sludge management. Prace Inst. Ceram. Mater. Bud. Pract. Inst. Ceram. I Mater. Bud. 2013, 6, 49–59. (In Polish) [Google Scholar]
  14. Trivedi, N.S.; Mandavgane, S.A.; Mehetre, S.; Kulkarni, B.D. Characterization and valorization of biomass ashes. Environ. Sci. Pollut. Res. 2016, 23, 20243–20256. [Google Scholar] [CrossRef] [PubMed]
  15. Nunes, L.J.R.; Matias, J.C.O.; Catalão, J.P.S. Biomass combustion systems: A review on the physical and chemical properties of the ashes. Renew. Sustain. Energy Rev. 2016, 53, 235–242. [Google Scholar] [CrossRef]
  16. Stankowski, S.; Sobolewska, M.; Jaroszewska, A.; Gibczyńska, M. Influence of biomass ash, lime and gypsum fertilization on macro-and microelement contents in the soil and grains of spring wheat. Soil Sci. Annu. 2018, 69, 177–183. [Google Scholar] [CrossRef]
  17. Vassilev, S.V.; Baxter, D.; Andersen, L.K.; Vassileva, C.G. An overview of the chemical composition of biomass. Fuel 2010, 89, 913–933. [Google Scholar] [CrossRef]
  18. Gibczyńska, M.; Stankowski, S.; Hury, G.; Kuglarz, K. Effects of limestone, ash from biomass and compost use on chemical properties of soil. Soil Sci. Annu. 2014, 65, 59–64. [Google Scholar] [CrossRef]
  19. Ure, A.M.; Quevauviller, P.; Muntau, H.; Griepink, B. Speciation of heavy metals in soils and sediments. an account of the improvement and harmonization of extraction techniques undertaken under the auspices of the BCR of the Commission of the European Communities. Int. J. Environ. Anal. Chem. 1993, 51, 135–151. [Google Scholar] [CrossRef]
  20. Gleyzes, C.; Tellier, S.; Astruc, M. Fractionation studies of trace elements in contaminated soils and sediments: A review of sequential extraction procedure. Trends Anal. Chem. 2002, 21, 451–467. [Google Scholar] [CrossRef]
  21. Fernández, E.; Jimènez, R.; Lallena, A.M.; Aguilar, J. Evaluation of the BCR sequential extraction procedure applied for two unpolluted Spanish soil. Environ. Pollut. 2004, 13, 355–364. [Google Scholar] [CrossRef]
  22. Pan, H.; Enerhadt, T. Fly ash as a soil amendment. Bioresources 2011, 6, 3987–4004. [Google Scholar]
  23. Karbowska, B.; Zembrzuski, W. Fractionation and Mobility of Thallium in Volcanic Ashes after Eruption of Eyjafjallajökull (2010) in Iceland. Bull. Environ. Contam. Toxicol. 2016, 97, 37–43. [Google Scholar] [CrossRef] [PubMed] [Green Version]
  24. Gwebu, S.; Tavengw, N.T.; Klink, M.J.; Mtunzi, F.M.; Modise, S.J.; Pakade, V.E. Quantification of Cd, Cu, Pb and Zn from sewage sludge by modified-BCR and ultrasound assisted-modified BCR sequential extraction methods. Afr. J. Pure Appl. Chem. 2017, 11, 9–18. [Google Scholar]
  25. WRB. World Reference Base for Soil Resources 2014; Update, World Soil Resources Reports, 106; FAO: Rome, Italy, 2015. [Google Scholar]
  26. Bank Danych o Lasach. Available online: www.bdl.lasy.gov.pl/portal/mapy (accessed on 23 December 2021).
  27. Zhang, J.; Zhang, J.; Tian, Y.; Li, N.; Kong, L.; Sun, L.; Yu, M.; Zuo, W. Changes of physicochemical properties of sewage sludge during ozonation treatment: Correlation to sludge dewaterability. Chem. Eng. J. 2016, 301, 238–248. [Google Scholar] [CrossRef]
  28. Tytła, M. Assessment of heavy metal pollution and potential ecological risk in sewage sludge from municipal wastewater treatment plant located in the most industrialized region in Poland–Case study. J. Environ. Res. Public Health 2019, 16, 2430. [Google Scholar] [CrossRef] [Green Version]
  29. Latosińska, J.; Kowalik, R.; Gawdzik, J. Risk Assessment of Soil Contamination with Trace elements from Municipal Sewage Sludge. Appl. Sci. 2021, 11, 548. [Google Scholar] [CrossRef]
  30. Adriano, D.C.; Wenzel, W.W.; Vangronsveld, J.; Bolan, N.S. Role of assisted natural remediation in environmental cleanup. Geoderma 2004, 122, 121–142. [Google Scholar] [CrossRef]
  31. Kabata-Pendias, A. Trace Elements in Soils and Plants, 3rd ed.; CRC Press: Boca Raton, NM, USA; London, UK; New York, NY, USA; Washington, DC, USA, 2001. [Google Scholar]
  32. Alvarez, A.; Catalano, S.A.; Amoroso, M.J. Heavy metal resistant strains are widespread along Streptomyces phylogeny. Mol. Phylogenet. Evol. 2013, 66, 1083–1088. [Google Scholar] [CrossRef]
  33. Barančíková, G.; Makovníková, J. The influence of humic acid quality on the sorption and mobility of heavy metals. Plant Soil Environ. 2003, 49, 565–571. [Google Scholar] [CrossRef] [Green Version]
  34. Pourret, O.; Davranche, M.; Gruau, G.; Dia, A. Rare earth elements complexation with humic acid. Chem. Geol. 2007, 243, 128–141. [Google Scholar] [CrossRef] [Green Version]
  35. Shaheen, S.M.; Tsadilas, C.D.; Rinklebe, J. A review of the distribution coefficients of trace elements in soils: Influence of sorption system, element characteristics, and soil colloidal properties. Adv. Colloid Interface Sci. 2013, 201–202, 43–56. [Google Scholar] [CrossRef] [PubMed]
  36. Ernst, W.H.O. Evolution of metal tolerance in higher plants. For. Snow Landsc. Res. 2006, 80, 251–274. [Google Scholar]
  37. Koniuszy-Nycz, J. Evaluation of leaching and bioavailability of heavy metals from industrial biomass ashes. Uniw. Zielonogórski Zesz. Nauk. Inżynieria Środowiska 2018, 167, 18–33. (In Polish) [Google Scholar] [CrossRef]
  38. Jukić, M.; Ćurković, L.; Šabarić, J.; Kerolli-Mustafa, M. Fractionation of Heavy Metals in Fly Ash from Wood Biomass Using the BCR Sequential Extraction Procedure. Bull. Environ. Contam. Toxicol. 2017, 99, 524–529. [Google Scholar] [CrossRef]
  39. Ma, L.Q.; Komar, K.M.; Tu, C.; Zhang, W.; Cai, Y.; Kennelley, E.D. A fern that hyperaccumulates arsenic. Nature 2001, 409, 579. [Google Scholar] [CrossRef]
  40. Bonanno, G. Trace element accumulation and distribution in the organs of Phragmites australis (common reed) and biomonitoring applications. Ecotoxicol. Environ. Saf. 2011, 74, 1057–1064. [Google Scholar] [CrossRef]
  41. Sheoran, V.; Sheoran, A.S.; Poonia, P. Factors affecting phytoextraction: A review. Pedosphere 2016, 26, 148–166. [Google Scholar] [CrossRef]
  42. Kushwaha, A.; Hans, N.; Kumar, S.; Rani, R. A critical review on speciation, mobilization and toxicity of lead in soilmicrobe-plant system and bioremediation strategies. Ecotoxicol. Environ. Saf. 2018, 147, 1035–1045. [Google Scholar] [CrossRef]
  43. Gerhardt, K.E.; Gerwing, P.D.; Greenberg, B.M. Opinion: Taking phytoremediation from proven technology to accepted practice. Plant Sci. 2017, 256, 170–185. [Google Scholar] [CrossRef]
  44. Gucwa-Przepióra, E.; Nadgórska-Socha, A.; Fojcik, B.; Chmura, D. Enzymatic activities and arbuscular mycorrhizal colonization of Plantago lanceolata and Plantago major in a soil root zone under heavy metal stress. Environ. Sci. Pollut. Res. 2016, 23, 4742–4755. [Google Scholar] [CrossRef] [PubMed] [Green Version]
  45. Wierzbowska, J.; Sienkiewicz, S.; Żarczyński, P.; Krzebietke, S. Environmental Application of Ash from Incinerated Biomass. Agronomy 2020, 10, 482. [Google Scholar] [CrossRef] [Green Version]
  46. Murtaza, G.; Usman, Y.; Niazi, N.K.; Usman, M.; Hussain, T. Bioaccumulation of Potentially Toxic Elements in Cereal and Legume Crops: A Review. Clean Soil Air Water 2017, 45, 1700548. [Google Scholar] [CrossRef]
  47. Shahkolaie, S.S.; Baranimotlagh, M.; Dordipour, E.; Khormali, F. Cadmium and lead immobilization in a calcareous contaminated soil using the cost-effective amendments. Arab. J. Geosci. 2019, 12, 733. [Google Scholar] [CrossRef]
  48. Jakubus, M.; Graczyk, M. The Effect of Compost and Fly Ash Treatment of Contaminated Soil on the Immobilisation and Bioavailability of Lead. Agronomy 2021, 11, 1188. [Google Scholar] [CrossRef]
Figure 1. Meteorological conditions during the study period (2019–2021).
Agronomy 13 00942 g001
Figure 2. The percentage share of chemical fractions in the total content of trace elements in the BAs used in the field experiment (%).
Agronomy 13 00942 g002
Figure 3. The mean content of BCR fractions: F1 (A), F2 (B), F3 (C), F4 (D), and total forms of Zn (E) in Gleyic Chernozem soil (0–30 cm), depending on the utilized fertilization, compared to the soil before starting the experiment (mean ± standard error) (n = 27). Explanation: a,b,c—identical letters denote no significant differences (p < 0.05) between the objects according to the Tukey’s post hoc HSD test, 0—soil before starting the experiment. D1–D5 doses of BAs: 0.5, 1.0, 1.5, 2.0, and 2.5 Mg ha−1, respectively.
Agronomy 13 00942 g003
Figure 4. The mean content of BCR fractions: F1 (A), F2 (B), F3 (C), F4 (D), and total forms of Cu (E) in Gleyic Chernozem soil (0–30 cm), depending on the utilized fertilization, compared to the soil before starting the experiment (mean ± standard error) (n = 27). Explanation: a, b, c, d—identical letters denote no significant differences (p < 0.05) between the objects according to the Tukey’s post hoc HSD test, 0—soil before starting the experiment. D1–D5 doses of BAs: 0.5, 1.0, 1.5, 2.0, and 2.5 Mg ha−1, respectively.
Agronomy 13 00942 g004
Figure 5. The mean content of BCR fractions: F1 (A), F2 (B), F3 (C), F4 (D), and total forms of Cr (E) in Gleyic Chernozem soil (0–30 cm), depending on the utilized fertilization, compared to the soil before starting the experiment (mean ± standard error) (n = 9). Explanation: a, b, c—identical letters denote no significant differences (p < 0.05) between the objects, according to the Tukey’s post hoc HSD test, 0—soil before starting the experiment. D1–D5 doses of BAs: 0.5, 1.0, 1.5, 2.0, and 2.5 Mg ha−1, respectively.
Agronomy 13 00942 g005
Figure 6. The mean content of BCR fractions: F1 (A), F2 (B), F3 (C), F4 (D), and total forms of Ni (E) in the Gleyic Chernozem soil (0–30 cm), depending on the utilized fertilization, compared to the soil before starting the experiment (mean ± standard error) (n = 9). Explanation: a, b, c—identical letters denote no significant differences (p < 0.05) between the objects according to the Tukey’s post hoc HSD test, 0—soil before starting the experiment. D1–D5 doses of BAs: 0.5, 1.0, 1.5, 2.0, and 2.5 Mg ha−1, respectively.
Agronomy 13 00942 g006
Figure 7. The mean content of BCR fractions: F1 (A), F2 (B), F3 (C), F4 (D), and total forms of Pb (E) in Gleyic Chernozem soil (0–30 cm), depending on the utilized fertilization, compared to the soil before starting the experiment (mean ± standard error) (n = 9). Explanation: a, b, c—identical letters denote no significant differences (p < 0.05) between the objects according to the Tukey’s post hoc HSD test, 0—soil before starting the experiment. D1–D5 doses of BAs: 0.5, 1.0, 1.5, 2.0, and 2.5 Mg ha−1, respectively.
Agronomy 13 00942 g007
Figure 8. The mean content of BCR fractions: F1 (A), F2 (B), F3 (C), F4 (D), and total forms of Cd (E) in Gleyic Chernozem soil (0–30 cm), depending on the utilized fertilization, compared to the soil before starting the experiment (mean ± standard error) (n = 9). Explanation: a, b, c—identical letters denote no significant differences (p < 0.05) between the objects according to the Tukey’s post hoc HSD test, 0—soil before starting the experiment. D1–D5 doses of BAs: 0.5, 1.0, 1.5, 2.0, and 2.5 Mg ha−1, respectively.
Agronomy 13 00942 g008
Figure 9. Zn concentration in individual parts of winter oilseed rape: grain (A), straw (B), and roots (C), cultivated in Gleyic Chernozem soil, depending on the utilized fertilization (mean ± standard error) (n = 27). Explanation: a—identical letters denote no significant differences (p < 0.05) between the objects according to the Tukey’s post hoc HSD test, 0—soil before starting the experiment. D1–D5 doses of BAs: 0.5, 1.0, 1.5, 2.0, and 2.5 Mg ha−1, respectively.
Agronomy 13 00942 g009
Figure 10. Cu concentration in individual parts of winter oilseed rape: grain (A), straw (B), and roots (C), cultivated in Gleyic Chernozem soil, depending on the utilized fertilization (mean ± standard error) (n = 27). Explanation: a—identical letters denote no significant differences (p < 0.05) between the objects according to the Tukey’s post hoc HSD test, 0—soil before starting the experiment. D1–D5 doses of BAs: 0.5, 1.0, 1.5, 2.0, and 2.5 Mg ha−1, respectively.
Agronomy 13 00942 g010
Figure 11. Cr concentration in individual parts of winter oilseed rape: grain (A), straw (B), and roots (C), cultivated in Gleyic Chernozem soil, depending on the utilized fertilization (mean ± standard error) (n = 27). Explanation: a—identical letters denote no significant differences (p < 0.05) between the objects according to the Tukey’s post hoc HSD test, 0—soil before starting the experiment. D1–D5 doses of BAs: 0.5, 1.0, 1.5, 2.0, and 2.5 Mg ha−1, respectively.
Agronomy 13 00942 g011
Figure 12. Ni concentration in individual parts of winter oilseed rape: grain (A), straw (B), and roots (C), cultivated in Gleyic Chernozem soil, depending on the utilized fertilization (mean ± standard error) (n = 27). Explanation: a, b—identical letters denote no significant differences (p < 0.05) between the objects according to the Tukey’s post hoc HSD test, 0—soil before starting the experiment. D1–D5 doses of BAs: 0.5, 1.0, 1.5, 2.0, and 2.5 Mg ha−1, respectively.
Agronomy 13 00942 g012
Figure 13. (AC) Pb concentration in individual parts of winter oilseed rape: grain (A), straw (B), and roots (C), cultivated in Gleyic Chernozem soil, depending on the utilized fertilization (mean ± standard error) (n = 27). Explanation: a,b—identical letters denote no significant differences (p < 0.05) between the objects according to the Tukey’s post hoc HSD test, 0—soil before starting the experiment. D1–D5 doses of BAs: 0.5, 1.0, 1.5, 2.0, and 2.5 Mg ha−1, respectively.
Agronomy 13 00942 g013
Figure 14. Cd concentration in individual parts of winter oilseed rape: grain (A), straw (B), and roots (C), cultivated in Gleyic Chernozem soil, depending on the utilized fertilization (mean ± standard error) (n = 27). Explanation: a—identical letters denote no significant differences (p < 0.05) between the objects according to the Tukey’s post hoc HSD test, 0—soil before starting the experiment. D1–D5 doses of BAs: 0.5, 1.0, 1.5, 2.0, and 2.5 Mg ha−1, respectively.
Agronomy 13 00942 g014
Table 1. The total forms and BCR chemical fractions of Zn, Cu, Cr, Ni, Pb, and Cd in the BAs used in the experiment (mean ± standard error) (n = 12).
ParameterF1F2F3F4Total FormRAC
mg kg−1%
Zn0.05 ± 0.0019.67 ± 2.34127.8 ± 9.12332 ± 13.72470 ± 2.19<1
Cu0.01 ± 0.00157.04 ± 18.29104.77 ± 3.0448.98 ± 22.74310.8 ± 1.41<1
Cr<0.0010.88 ± 0.142.17 ± 0.0974.65 ± 1.0777.7 ± 1.30<1
Ni0.08 ± 0.1718.95 ± 0.526.69 ± 0.633.03 ± 0.7928.74 ± 0.54<1
Pb<0.0010.026 ± 0.034.09 ± 0.6833.51 ± 0.1437.63 ± 0.81<1
Cd0.03 ± 0.012.71 ± 0.09<0.0010.95 ± 0.143.69 ± 0.06<1
F1—exchangeable/extractable fraction, F2—reducible fraction, F3—oxidizable fraction, F4—residual fraction. RAC < 1 no risk (safe to the environment).
Disclaimer/Publisher’s Note: The statements, opinions and data contained in all publications are solely those of the individual author(s) and contributor(s) and not of MDPI and/or the editor(s). MDPI and/or the editor(s) disclaim responsibility for any injury to people or property resulting from any ideas, methods, instructions or products referred to in the content.

