Article

Improving Wheat Yield and Phosphorus Use Efficiency through the Optimization of Phosphorus Fertilizer Types Based on Soil P Pool Characteristics in Calcareous and Non-Calcareous Soil

1
Anhui Province Key Laboratory of Farmland Ecological Conservation and Pollution Prevention/Engineering and Technology Research Center of Intelligent Manufacture and Efficient Utilization of Green Phosphorus Fertilizer of Anhui Province, College of Resources and Environment, Anhui Agricultural University, Hefei 230036, China
2
Academy of Agriculture and Forestry Sciences, Qinghai University, Xining 810016, China
3
College of Resources and Environmental Science, China Agricultural University, Beijing 100193, China
4
The UWA Institute of Agriculture and School of Agriculture & Environment, The University of Western Australia, Perth, WA 6001, Australia
*
Authors to whom correspondence should be addressed.
Agronomy 2023, 13(3), 928; https://doi.org/10.3390/agronomy13030928
Submission received: 16 February 2023 / Revised: 8 March 2023 / Accepted: 18 March 2023 / Published: 21 March 2023
(This article belongs to the Section Soil and Plant Nutrition)

Abstract

:
Irrational phosphorus (P) nutrient management practices often fail to match of P fertilizer type, soil P transformation and crop P demand, lead to increased accumulation of legacy P, reduced PUE, and pollution, affecting crop production. A pot experiment incorporating soil types and P fertilizer types (SSP, simple superphosphate; CMP, calcium magnesium phosphate; DAP, diammonium phosphate; TSP, triple superphosphate; APP, ammonium polyphosphate; CK, no P application) to establish coupling of the soil and P fertilizer types, soil P pool characteristics, crop P uptake. In calcareous soil, the available P concentrations in rhizosphere soil were higher under TSP and DAP, with the increase in NaHCO3-Pi concentration the most. In non-calcareous soil, the NaHCO3-Pi and NaOH-Pi increased the most under SSP, DAP, and TSP at anthesis. Shoot P accumulation at maturity was highest under TSP and APP, TSP and DAP, respectively, in the two soil. TSP and APP significantly increased yield and PUE in the calcareous soil, while TSP and DAP performed better in the non-calcareous soil. NaHCO3-Pi and NaOH-Po are potentially available P sources in calcareous and non-calcareous soil, which remarkably affect shoot P uptake through H2O-P. Comprehensive assessment of the relationship between soil P pool characteristics, yield and PUE, TSP and APP are recommended for application in calcareous soils and TSP and DAP for application in non-calcareous soils in wheat cropping systems.

1. Introduction

Phosphorus (P) fertilizers are critical to crop production and global food security. Strengthening intensive agricultural production will also increase the demand for P fertilizers [1,2]. China produces and consumes 34.0% and 22.5% of global P fertilizer [3]. The output of high-concentration P fertilizer accounts for 95.9% of the total P fertilizer production, mainly as ammonium P fertilizer [4]. However, the P supply capacity of different soils varies significantly due to soil properties, P fractions and P fertilizer types, resulting in different soil types requiring different P fertilizer types [5,6,7]. In calcareous soils, due to the high content of calcium carbonate in the soil, the fixation effect of calcium carbonate on P is the main factor. In contrast, P is mainly fixed by a large amount of amorphous iron oxide and alumina in acid soils. From this, P fertilizer is easily fixed and accumulated after being applied to the soil. As a result, the availability is reduced, resulting in the average in-season P use efficiency (PUE) being 3.0–21.2% [8,9]. In addition, to maximize the effectiveness of all P fertilizer types, corresponding fertilization measures should be taken according to the characteristics of different P fertilizer types [7,10]. Therefore, strategies are needed to improve fertilizer PUE by matching the soil types—P fertilizer type—cropping system in P nutrient management.
Numerous studies have investigated the effect of P fertilizer type on soil P bioavailability and crop yield [10,11,12]. However, due to differences in physical and chemical properties (e.g., solubility, acidity, and alkalinity) among P fertilizer types, fertilizer use efficiency is inconsistent between different soil types [13,14,15]. For example, whether in the neutral fluvo-aquic soil (pH 7.2) or the Eum-Orthric Anthrosols (pH 8.4), diammonium P (DAP) had the highest concentration of availability P, with 18.2–223.7% greater P uptake and 22.0–420.0% higher PUE for summer maize than simple superphosphate (SSP), calcium magnesium P (CMP) monoammonium P (MAP) and ammonium polyphosphate (APP) [7,16]. Other studies have shown that MAP and APP significantly improved available P concentration, PUE, and maize or cotton yields in calcareous soil (pH 7.81) with coarse texture compared with other P fertilizer types udder drip irrigation [17,18]. In acid yellow cinnamon soil (pH 5.0) and weakly acidic red soil (pH 6.5), DAP increased rape seed yield and PUE the most but while MAP and CMP decreased them the most [7,19]. Thus, P fertilizer has different effects on different crops and soil types.
Soil P availability can reflect crop P uptake and utilization to a certain extent but depends on the dynamic changes of various P fractions in soils [20,21]. Plant P absorption and utilization are affected by the different soil P fractions [22,23]. Classifying the different soil P fractions can quantify and explain changes in soil P pool characteristics and bioavailability [24,25]. The modified Hedley fractionation method is widely used, with soil P fractions divided into seven components: H2O-P, NaHCO3-Pi, NaHCO3-Po, NaOH-Pi, NaOH-Po, HCl-P, and residual-P [23,26,27], with further division into labile P fractions (H2O-P, NaHCO3-Pi, and NaHCO3-Po), moderately labile P fractions (NaOH-Pi and NaOH-Po), and stable P fractions (HCl-P and residue-P) according to the degree of availability [28]. Long-term P fertilizer application can significantly increase the proportion of labile inorganic P and moderately labile inorganic P but decrease the proportion of moderately stable inorganic P [29,30]. Furthermore, labile P and moderately labile P contents positively correlated with soil available P content, which can be easily absorbed and used by crops [31,32,33]. While the effects of single P fertilizer types, application rates, cropping systems, tillage, and fertilization methods on P fertilizer use efficiency and crop yield are well-known [34,35,36,37,38], it is not known how the matching pattern of P fraction transformation of different P fertilizer types in different soil types and crop P fertilizer use efficiency.
To achieve this, it is necessary to make a thorough investigation of soil P pool transformation characteristics and their bioavailability and crop requirements when P is applied to the soil. The main objectives of this study were to: (i) investigate how P fertilizer types affect soil P fraction transformation and its availability in calcareous soils and non-calcareous soils, (ii) clarify to what extent P fertilizer types effects wheat grain yield and P accumulation relate to soil P fraction concentrations and availability, (iii) identify the optimal P management practice in different soils under winter wheat. This study will provide a systematic understanding of the matching mechanism of the P fertilizer-target soil-winter wheat cropping system to help realize the highly efficient and sustainable utilization of P fertilizer and reduce the risk of environmental pollution.

2. Materials and Methods

2.1. Experimental Soils

A pot trial with winter wheat (Triticum aestivum L. cv. Fanmai 8) was conducted in a mesh greenhouse at Anhui Agriculture University (117°25′ E, 31°87′ N), using two soil types: a calcareous (fluvo-aquic) and non-calcareous (yellow cinnamon) soil from long-term no P fertilizer application plots in Bengbu, Anhui (117°38′ E, 32°96′ N) and Agricultural High Technology Zone of Anhui Agricultural University (117°20′ E, 31°93′ N), respectively. The bulk soils were collected, sundried, shade dried, crushed, and passed through a 3 mm nylon screen before filling the white plastic flowerpots. Table 1 lists the physical and chemical characteristics of the soils.
OM, TN, AN, AP and AK are used to express organic matter, total nitrogen, Alkali-hydrolyzed nitrogen, available phosphorus and available potassium, respectively. Data are presented as means of four replications with standard errors.

2.2. Experimental Design

The six fertilization treatments were no P fertilization (CK), calcium superphosphate (SSP, P 5.24%), calcium magnesium P (CMP, P 6.55%), diammonium P (DAP, P 20.07%), triple superphosphate (TSP, P 20.07%), and ammonium polyphosphate (APP, P 24.44%). Before sowing, nitrogen (N), P, and potassium (K) were mixed into the soil: 100 mg N kg−1 soil as urea, 57.2 mg P kg−1 soil as the P fertilizer corresponding to the treatments, and 91.3 mg K kg−1 soil as K2SO4, with a second N fertilizer, dosage (100 mg N kg−1 soil as urea) at wheat jointing. Each 5 L pot (height: 17 cm, diameter: 21 cm) was filled with 3.5 kg of low P soil, and the application rate of N, P (except CK) and K fertilizer was kept the same for each treatment. The experiment comprised a completely random design. Each P fertilizer treatment was executed with nine replications for 54 pots. Fifteen sterilized seeds were sown in each pot, with the seedlings thinned to eight plants per pot after emergence. The pot positions were randomly arranged and changed regularly. The pots were irrigated with tap water to maintain the soil moisture at 70% field water capacity. Pests and diseases were controlled with insecticides and fungicides according to the manufacturer’s instructions.

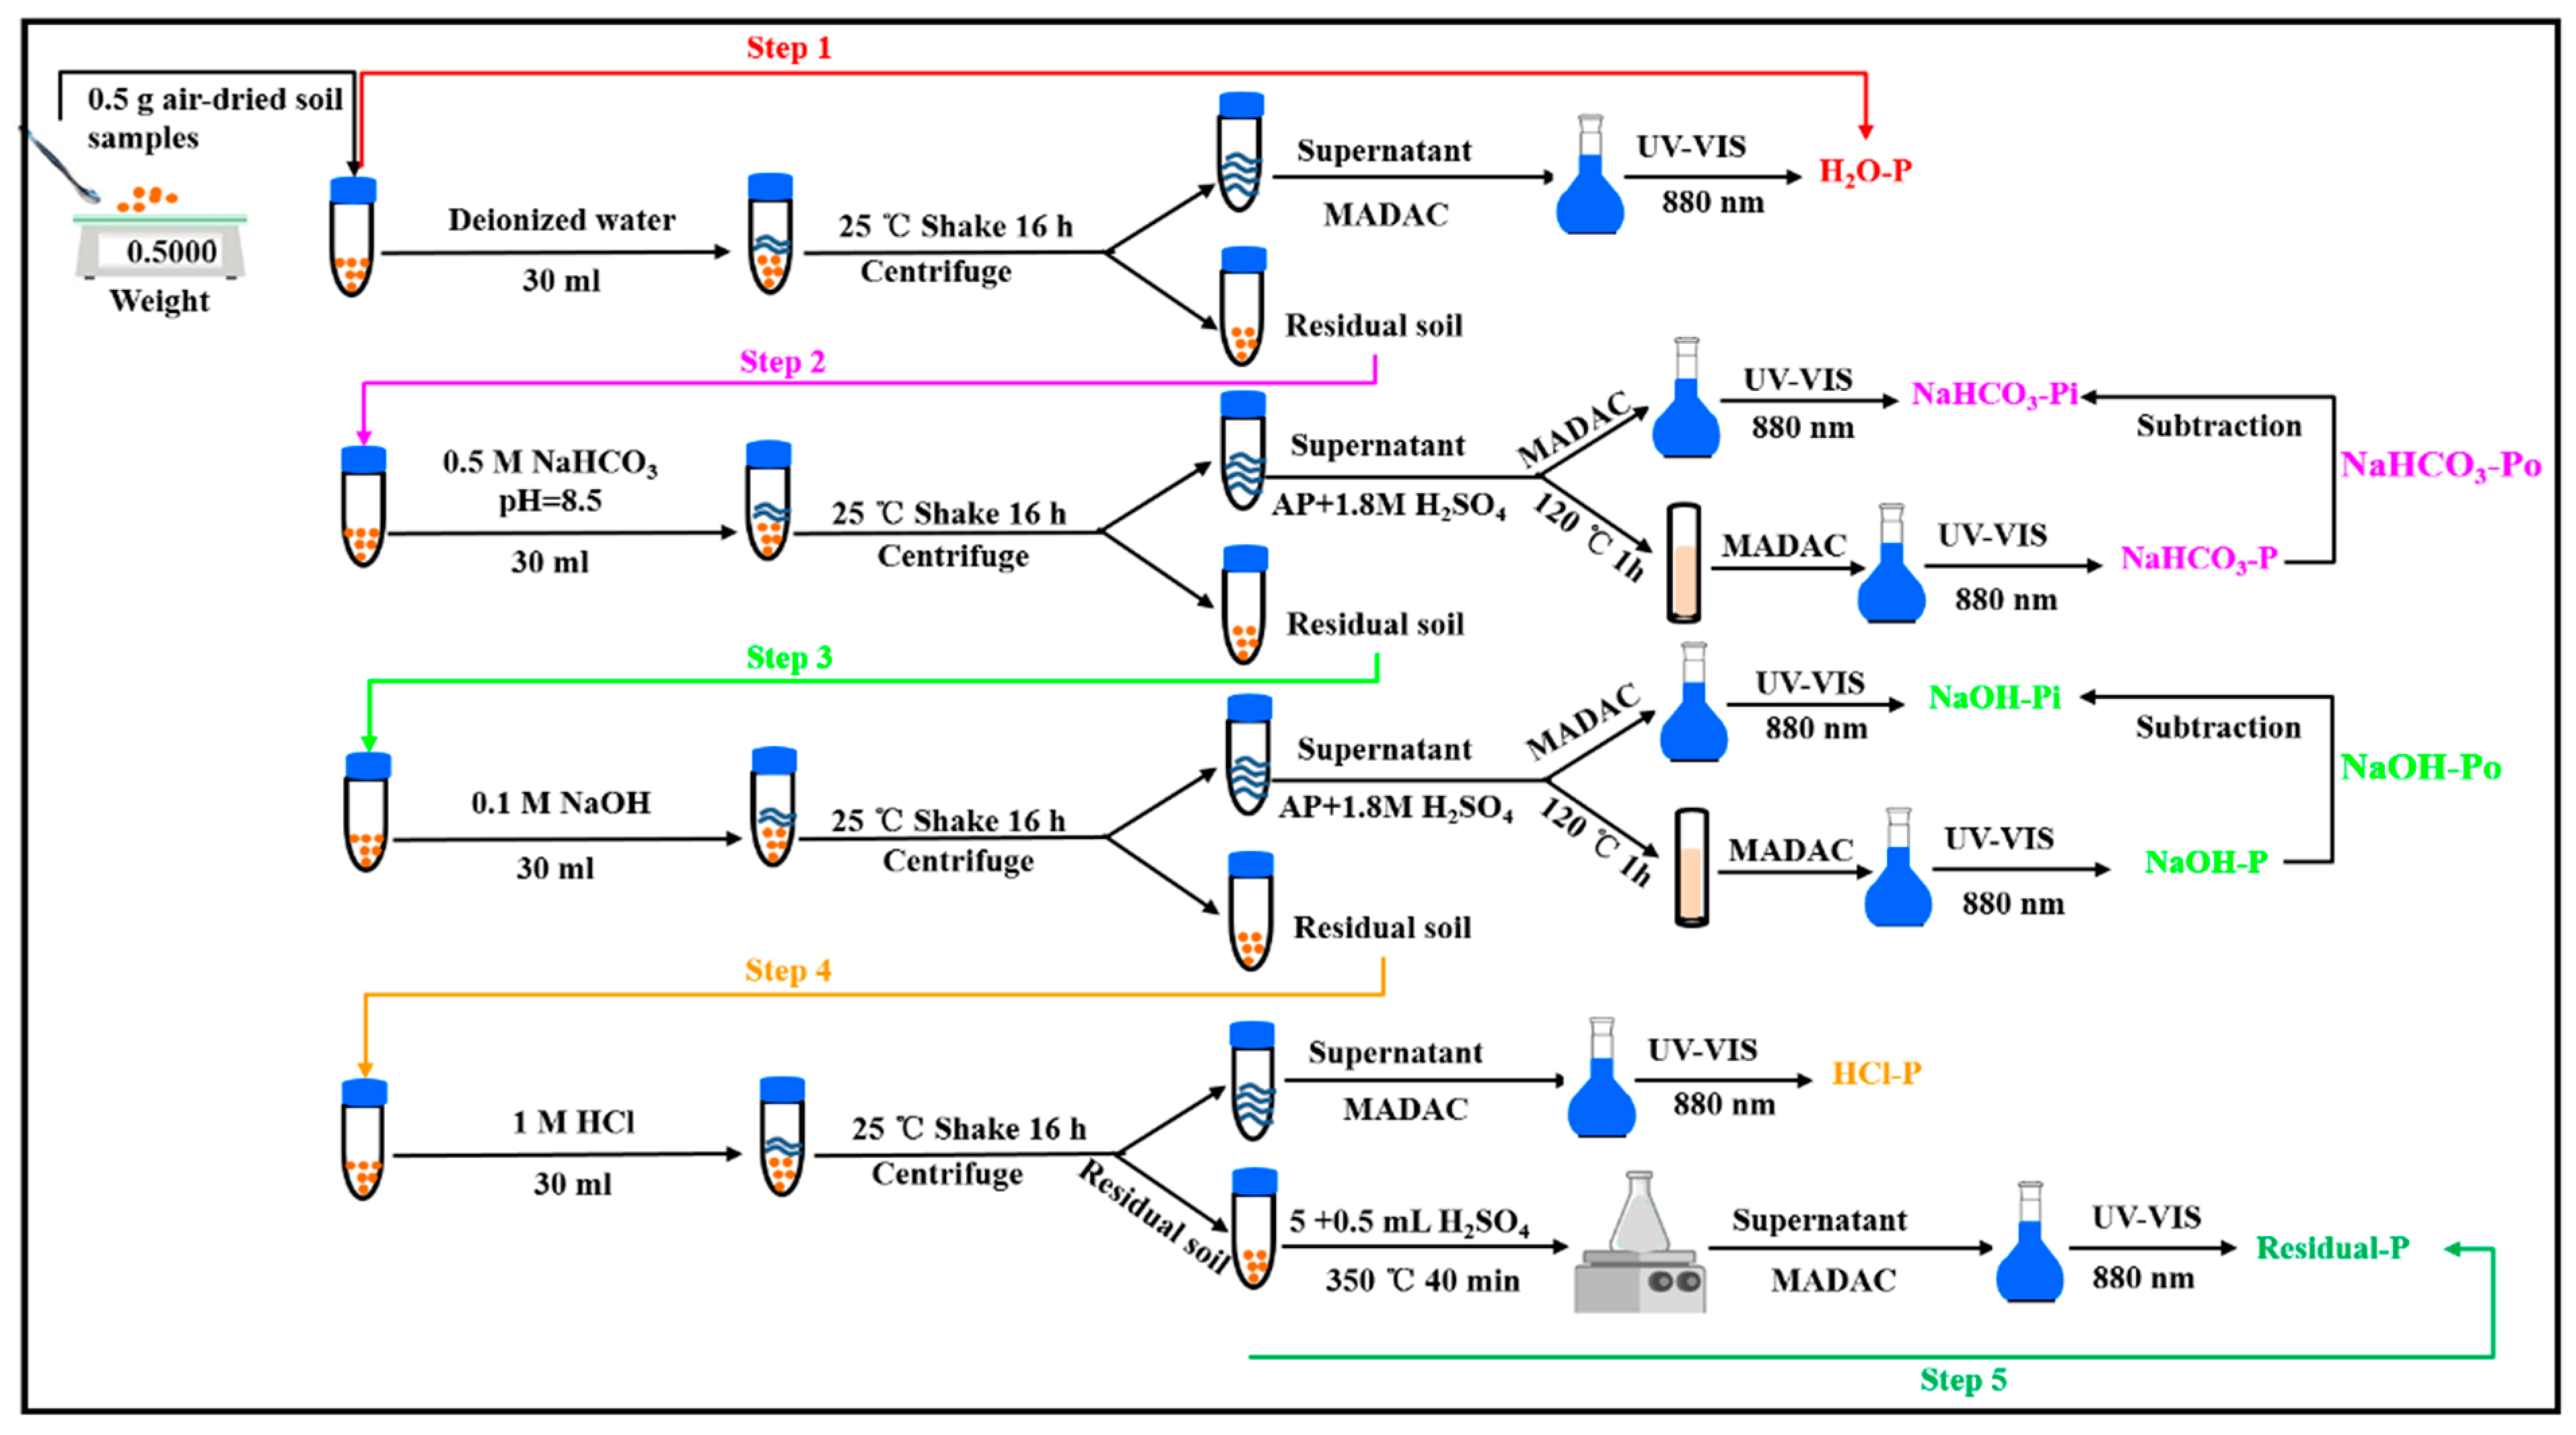
2.3. Sample Collection and Laboratory Analysis

At anthesis and maturity, wheat shoots were randomly collected from three replicate pots per treatment, harvested, and divided into stems, leaves, glumes, and grain. The plant samples were washed with tap water and ultrapure water three times, over-dried at 105 °C for 30 min to kill enzyme activities, and then dried at 65 °C until to constant weight and weighed. The crushed plant samples were digested with H2SO4-H2O2 in a graphite-digestion device (DigiBlock ST 36, LabTech, Hopkinton, MA, USA), with the P concentration of digesting solutions measured with an automatic continuous flow analyzer (San++, Skalar, Breda, Netherlands). Standard samples (GBW-10011 wheat, China) were used to verify the digestion and determination procedures. At anthesis, cleaned root samples were scanned with a WinRHIZO (Regent Instruments Inc., Québec, QC, Canada) root scanning system. The digital images were analyzed to obtain root growth parameters (root length and surface area).
Soil samples were collected at the same time as the plant samples, with the hand-shaking method adopted to obtain the non-rhizosphere and rhizosphere soil [39]. The soil samples were dried in the shade and passed through 1 mm and 0.15 mm nylon sieves to determine available P and P fractions, respectively. Soil available P was extracted with 0.5 mol L−1 NaHCO3, with the filtered liquid measured by an automatic continuous flow analyzer (San++, Skalar, Breda, Netherlands). Soil P fractions were determined following the modified Hedley continuous extraction method [26,27] (Figure 1), with the seven P fractions determined by molybdenum-antimony resistance colorimetry and UV-visible spectrophotometer (UV-1800, Shimadzu, Kyoto, Japan).

2.4. Calculation and Statistical Analysis

P accumulation, P agronomy efficiency (PAE), P use efficiency (PUE), P partial factor productivity (PPFP), and P physiological efficiency (PPE) were calculated according to Dhillon et al. [8], Yu et al. [9], and Zhao et al. [7].
Shoot P accumulation (mg pot−1) = shoot P concentration × shoot biomass
PAE (kg kg−1) = (YP − YCK)/P application rate
PUE (%) = [(UP − UCK)/P application rate] × 100
PPFP (kg kg−1) = YP/P application rate
PPE (kg kg−1) = (YP − YCK)/UP
YP and YCK are wheat grain yield under P fertilizer and the control, respectively; UP and UCK are shoot P accumulation under P fertilizer and the control, respectively.
All statistics were completed in SPSS version 22.0 (IBM SPSS Statistical, Chicago, IL, USA) and SAS version 8.0 (SAS Institute Inc., Cary, NC, USA). Two-way analysis of variance (ANOVA) was used to evaluate the effects of P fertilizer types and soil types on grain yield, soil P pool characteristics, shoot P accumulation, and P efficiency. Means and standard error of the mean were calculated for each P treatment combination, with significantly different P treatment means (according to ANOVA) compared by the least significant difference (LSD, p < 0.05). Sigmaplot version 12.5 (Systat, San Jose, CA, USA) and OriginPro version 2016 (OriginLab, Wellesley Hills, MA, USA) were used to draw graphs and regression analyses.

3. Results

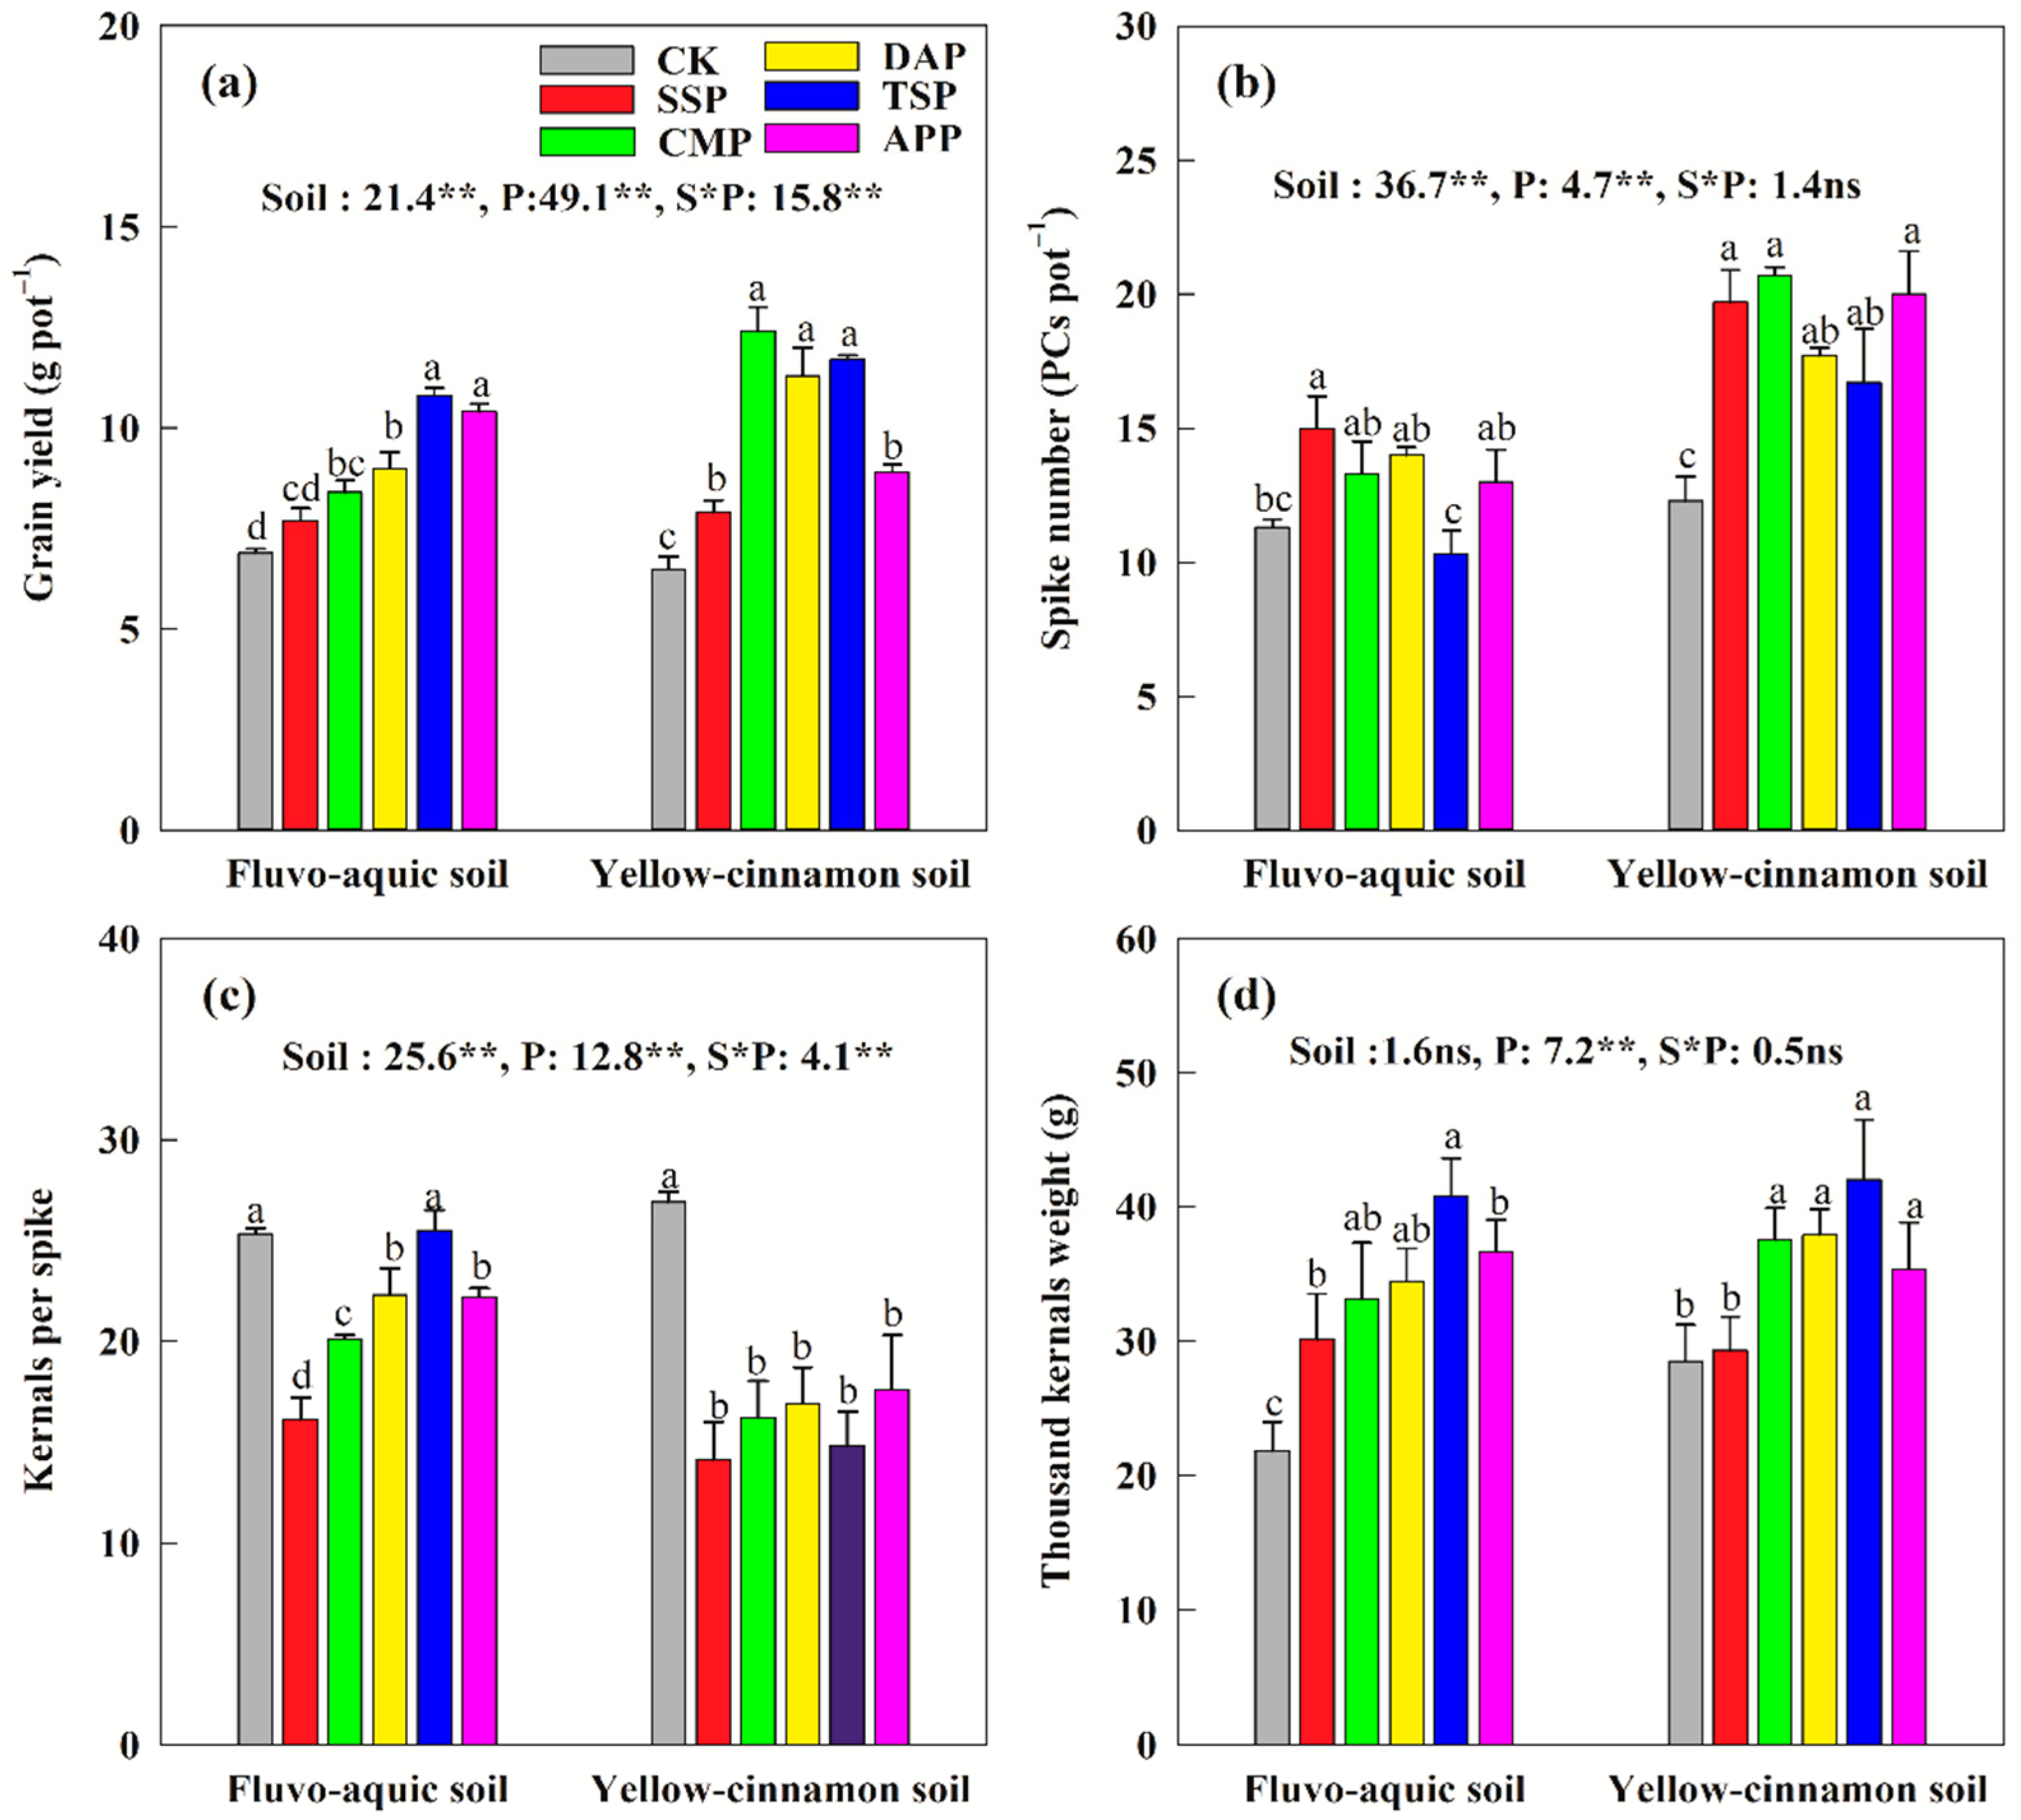
3.1. Grain Yield and Its Components

In the calcareous soil, TSP and APP had the highest grain yield among the different P fertilizer types, significantly increasing by 19.9–40.3% and 15.6–35.2%, respectively (Figure 2a). TSP also had a significantly higher spike number (14.0–58.4%) than the other P fertilizer types (Figure 2c). However, no significant differences in kernels per spike or thousand kernels weight occurred between P fertilizer types, except SSP (Figure 2b,d). In the non-calcareous soil, P fertilizer significantly increased grain yield by 21.2–90.5% compared with no P application; TSP, CMP, and DAP had the greatest effect, increasing by 79.7%, 90.5%, and 74.0%, respectively (Figure 2a). However, no significant differences occurred between treatments for spike number, kernels per spike or thousand kernels weight (Figure 2b–d).

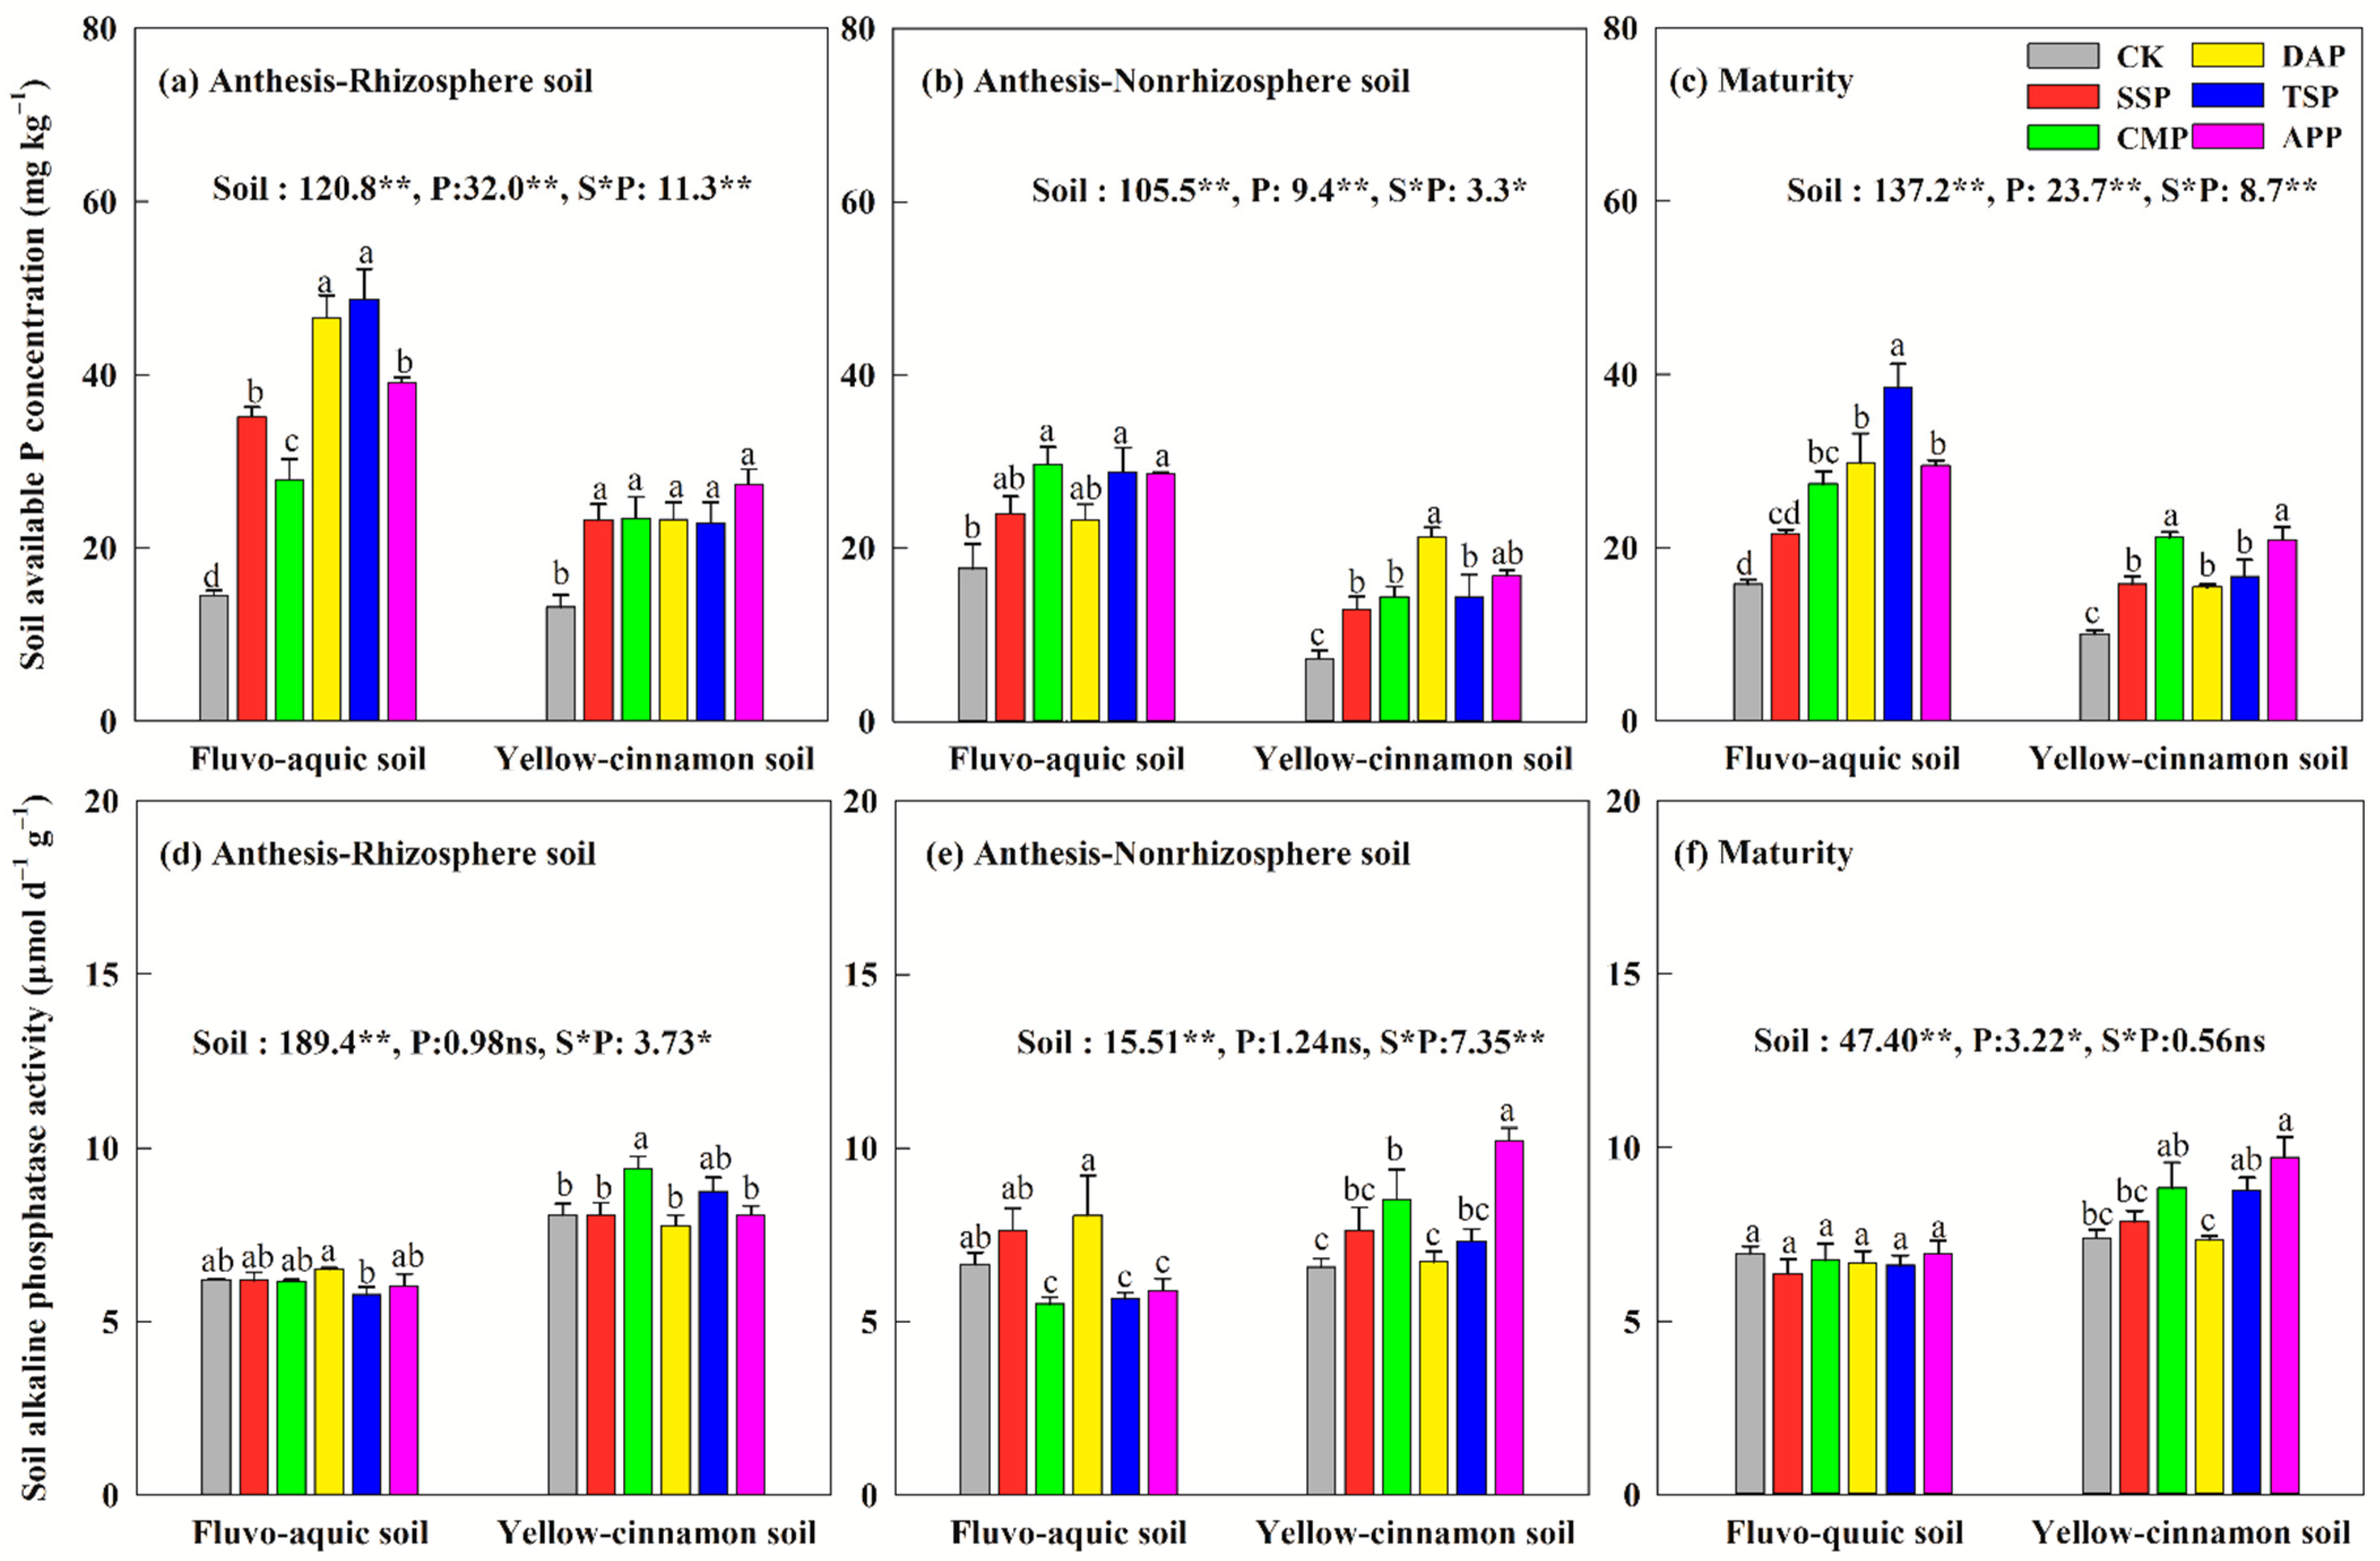
3.2. Soil Available P and Soil Alkaline Phosphatase Activity

In the calcareous soil, TSP and DAP had the highest available P concentration in rhizosphere soil at wheat anthesis. Still, no significant differences occurred in non-rhizosphere between P fertilizer treatments (Figure 3a,b). At maturity, TSP had significantly higher soil available P (30.3–77.9%) than the other P fertilizer types, followed by DAP and APP, with no significant difference between TSP and CMP (Figure 3c). In the non-calcareous soil, no significant differences in the available P concentration in rhizosphere soil occurred between P fertilizer treatments. In contrast, DAP had the highest concentration in non-rhizosphere soil, similar to APP. At maturity, CMP and APP had 27.3–34.1% and 25.4–32.2% higher soil available P concentration, respectively, than the other P fertilizer types, with no significant differences between SSP, DAP, and TSP.
In the calcareous soil, DAP had the highest alkaline phosphatase activity in rhizosphere and non-rhizosphere soil at wheat anthesis. Still, no significant differences between P fertilizer treatments occurred at maturity (Figure 3d–f). CMP had the highest alkaline phosphatase activity in rhizosphere soil in non-calcareous soil at wheat anthesis, similar to TSP. APP had the greatest increase in alkaline phosphatase activity in non-rhizosphere soil between anthesis and maturity but did not significantly differ from TSP and CMP.

3.3. Root Morphological Characteristics

Phosphorus fertilizer type significantly increased wheat’s total root length and surface area by 14.9–30.3% and 18.7–42.2% in calcareous soil and 30.2–52.1%, and 25.5–31.8% in non-calcareous soil, respectively, compared with no P (Figure 4a,b). Only CMP significantly reduced the root surface (8.5–14.4%) in non-calcareous soil compared with other P fertilizers.

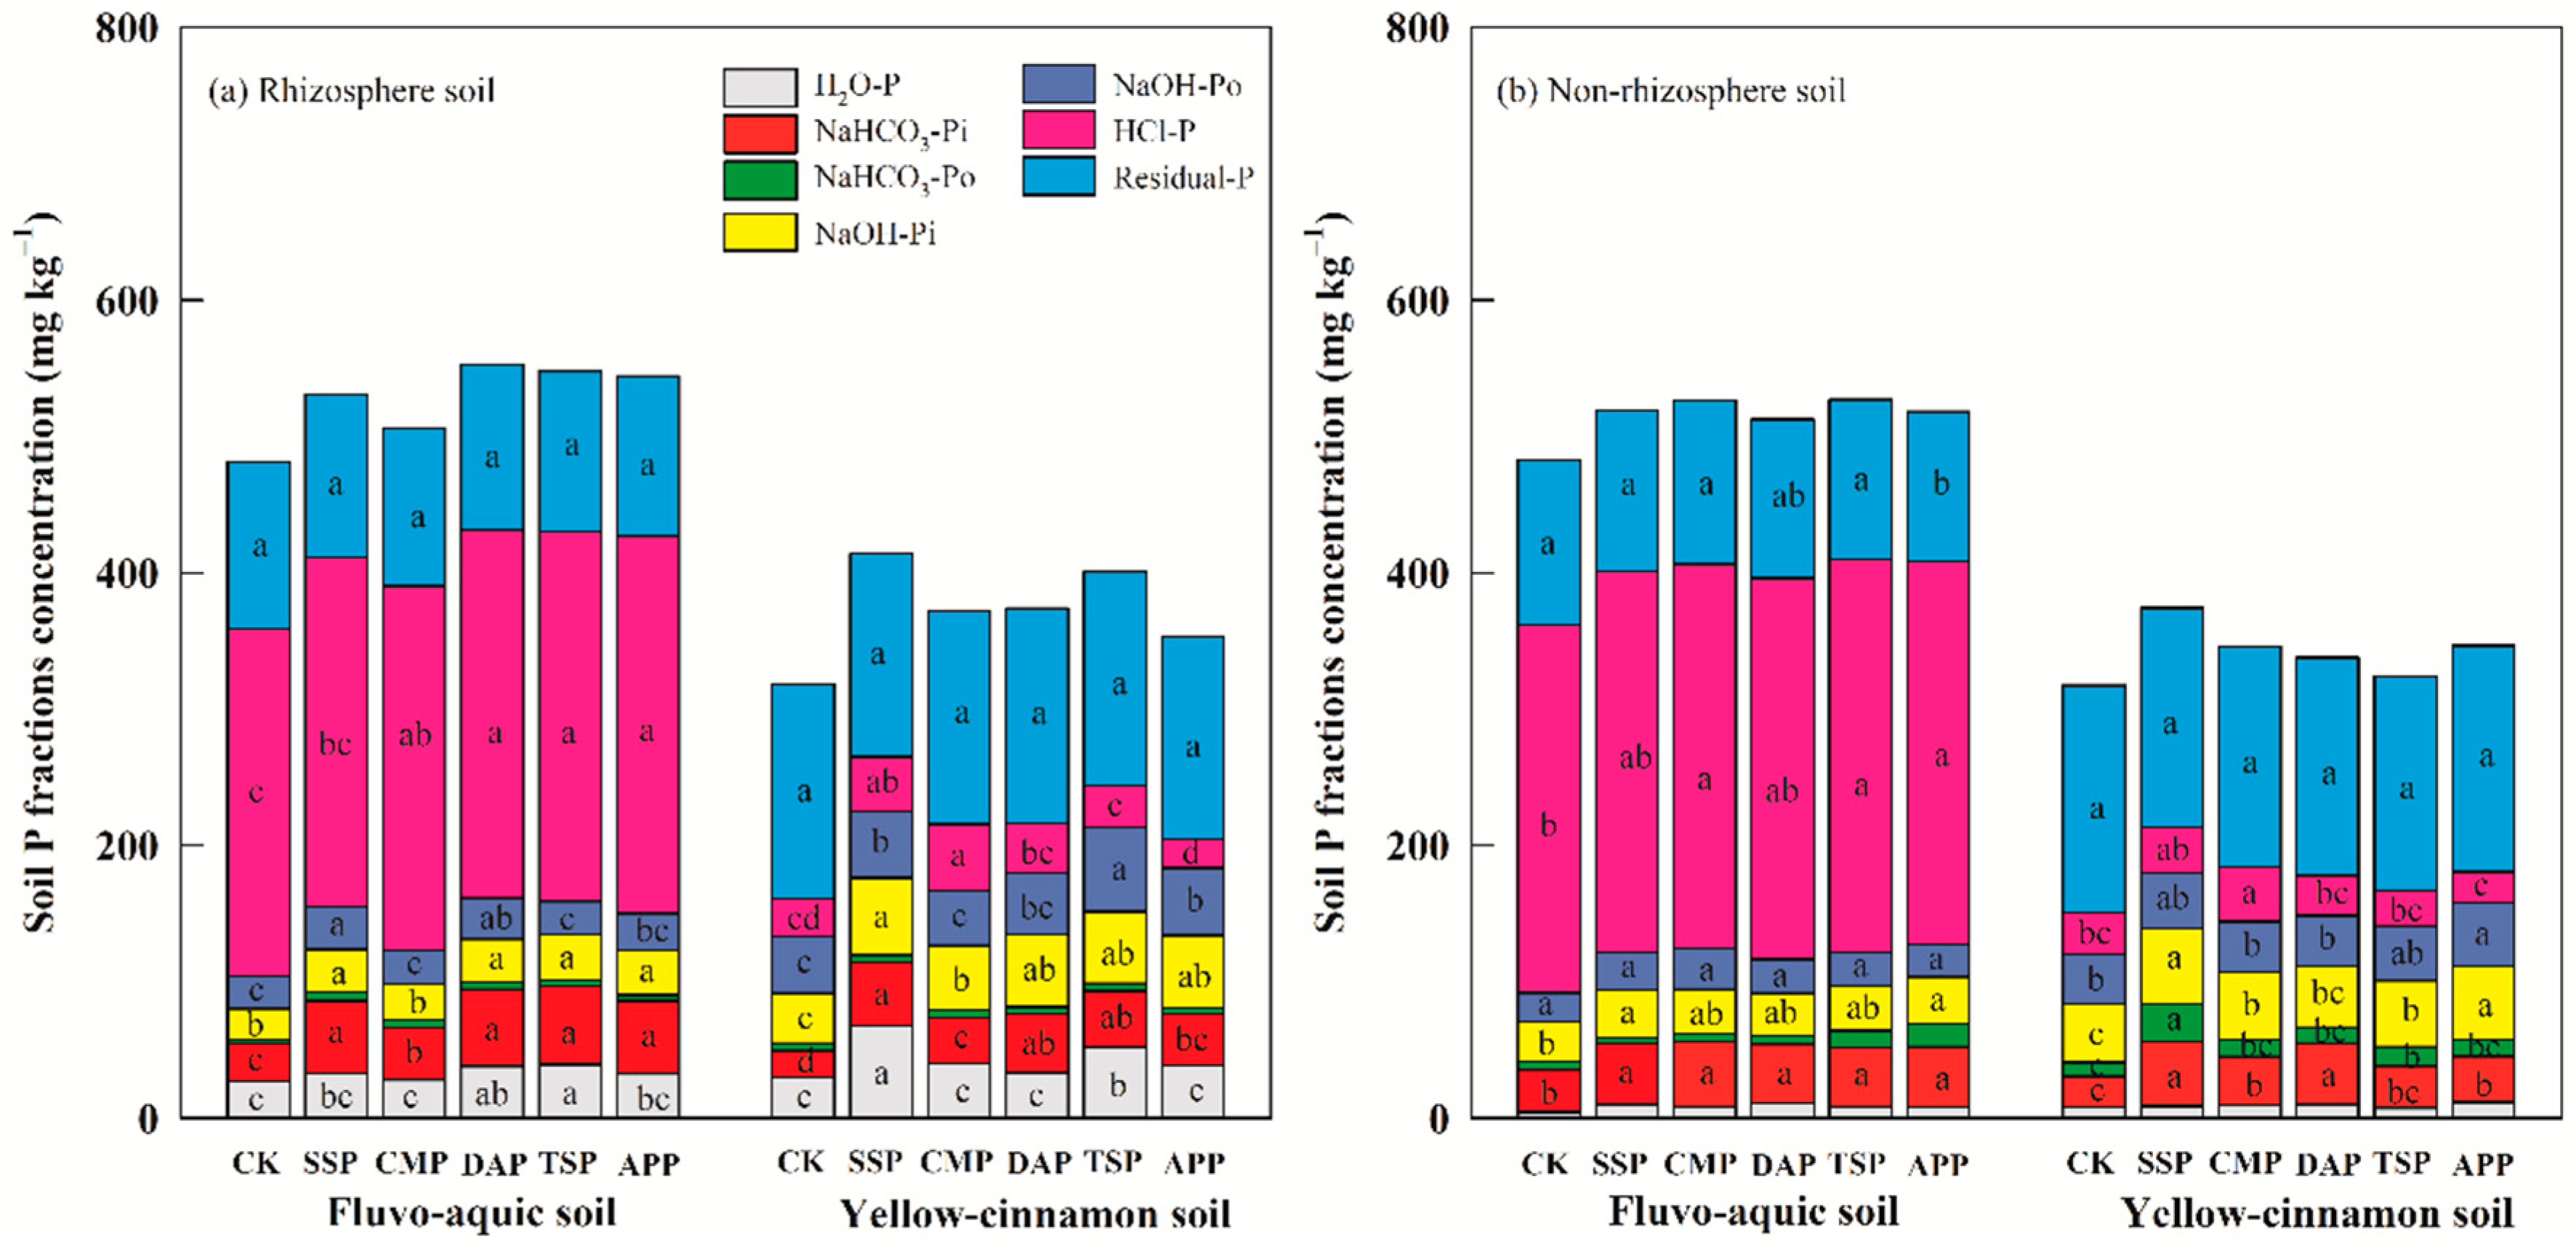
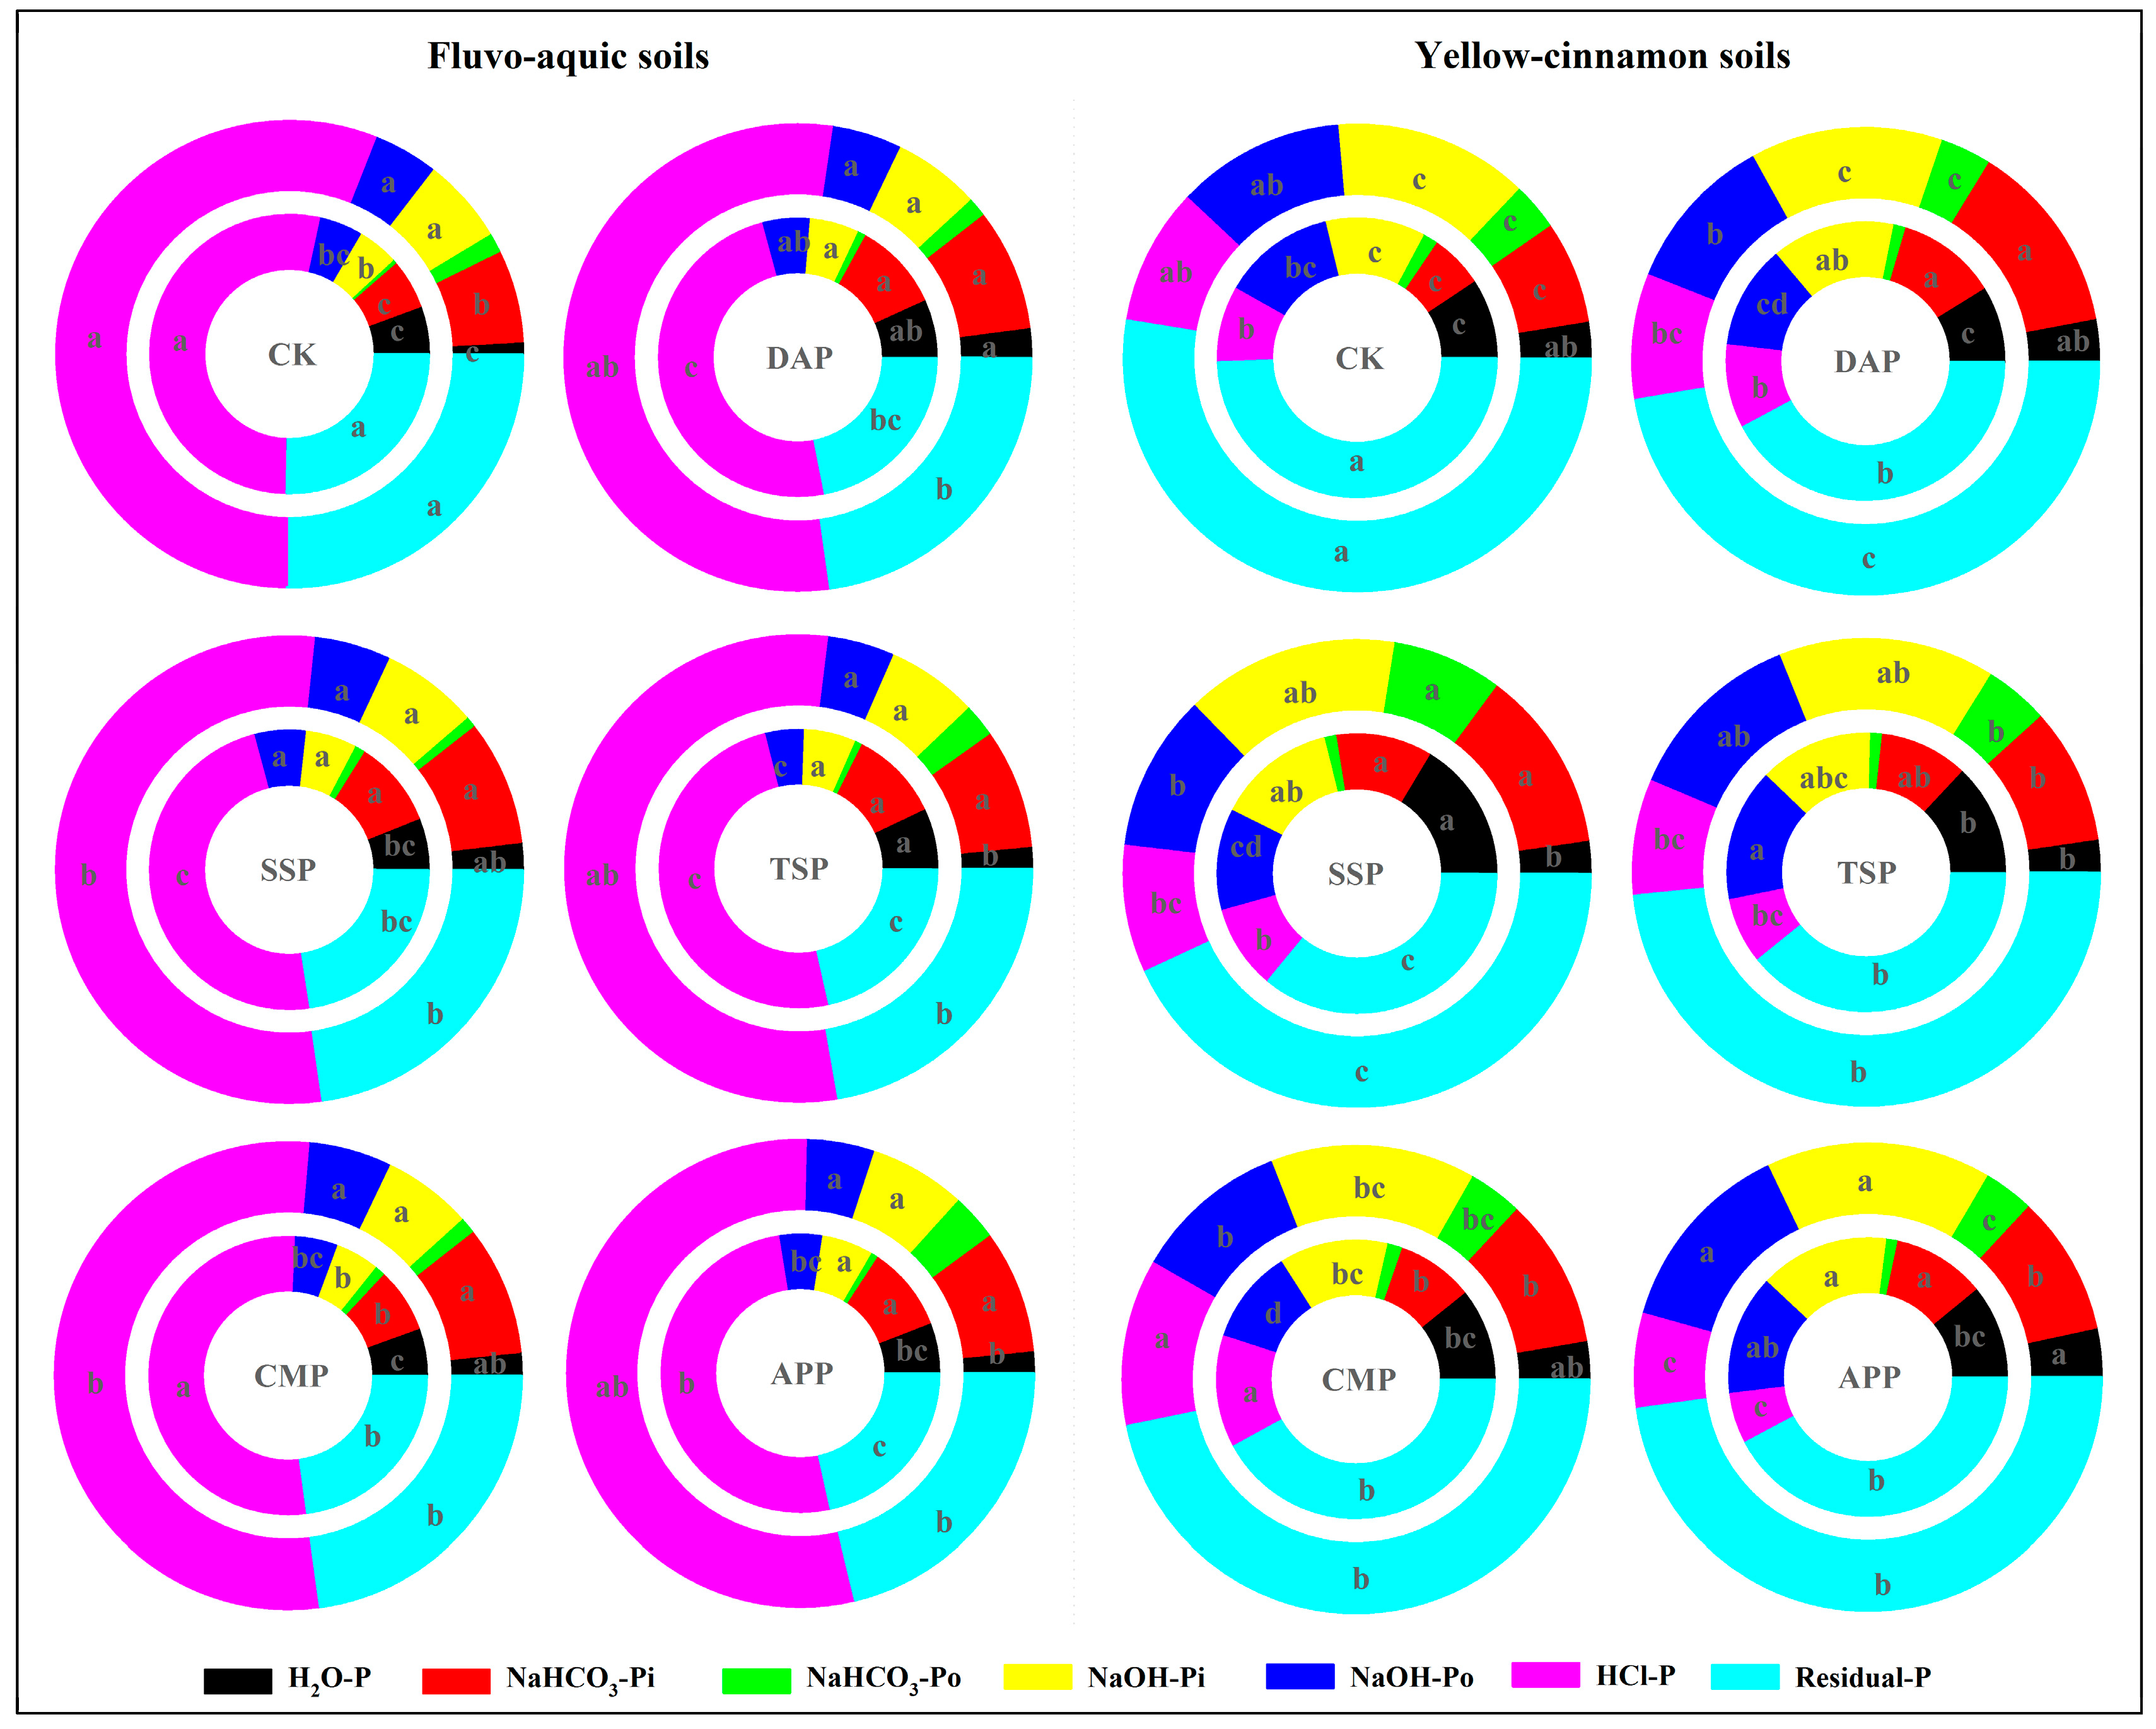
3.4. Soil P Fraction

In the calcareous soil, TSP had a significantly higher concentration and proportion of H2O-P in rhizosphere soil than the other P fertilizer treatments. In contrast, NaHCO3-Pi and NaOH-Pi did not significantly differ between TSP, SSP, DAP, and APP (Figure 5a and Figure 6). CMP had significantly lower concentrations and proportions of H2O-P (20.1% and 14.3%), NaHCO3-Pi (31.0% and 25.9%), and NaOH-Pi (20.1% and 14.2%), but a higher proportion of HCl-P (8.0%) than the other P fertilizer treatment. No significant differences in P fractions concentration and proportion occurred in non-rhizosphere soil under the different P fertilizer types. In the non-calcareous soil, SSP had the highest concentration of H2O-P, NaHCO3-Pi, NaHCO3-Po, and NaOH-Pi in rhizosphere and non-rhizosphere soil, while the concentrations of NaHCO3-Pi and NaOH-Pi in non-rhizosphere soil did not significantly differ between DAP and APP (Figure 5b). Moreover, CMP significantly increased the concentration and proportion of HCl-P in rhizosphere soil (64.1% and 35.9%) and non-rhizosphere soil (62.1% and 32.4%) (Figure 5b and Figure 6). SSP had a significantly higher proportion of residual-P in rhizosphere soil than the other P fertilizer types, but it was 8.6–22.1% lower than the non-rhizosphere soil.
The concentrations of H2O-P, NaHCO3-Pi, and NaOH-Pi positively correlated with available P, with a 1 mg kg−1 increase in the calcareous and non-calcareous soil, increasing soil available P by 0.48 and 0.13 mg kg−1, 0.80 and 0.24 mg kg−1, 1.03 and 0.42 mg kg−1, respectively (Figure 7a,b,d). However, when NaHCO3-Po increased by 1 mg kg−1, soil available P decreased by 0.34 mg kg−1 in non-calcareous soil (Figure 7c).

3.5. Shoot P Uptake

In the calcareous soil, CMP had significantly higher shoot P uptake (42.4–63.0%) at wheat anthesis than the other P fertilizer types, followed by APP, with no significant difference between DAP and TSP (Figure 8a). At maturity, shoot P significantly increased by 69.0–134.4% under different P fertilizer types compared with no P application, more so in TSP and APP (Figure 8b). Using the data of all P fertilizer treatments, when soil available P concentration increased by 1 mg kg−1, shoot P uptake increased by 1.21 and 0.60 mg pot−1 at anthesis and maturity, respectively (Figure 8c,d). In the non-calcareous soil, DAP had significantly higher shoot P uptake at anthesis than CMP, but no significant differences occurred with the other P fertilizer types (Figure 8a). At maturity, TSP, DAP, and CMP had significantly higher shoot P uptake than SSP and APP, but no significant differences occurred among the other three P fertilizer types (Figure 8b). Moreover, among the P fertilizer treatments, when soil available P increased by 1 mg kg−1, shoot P uptake increased by 1.56 mg pot−1 (Figure 8d).

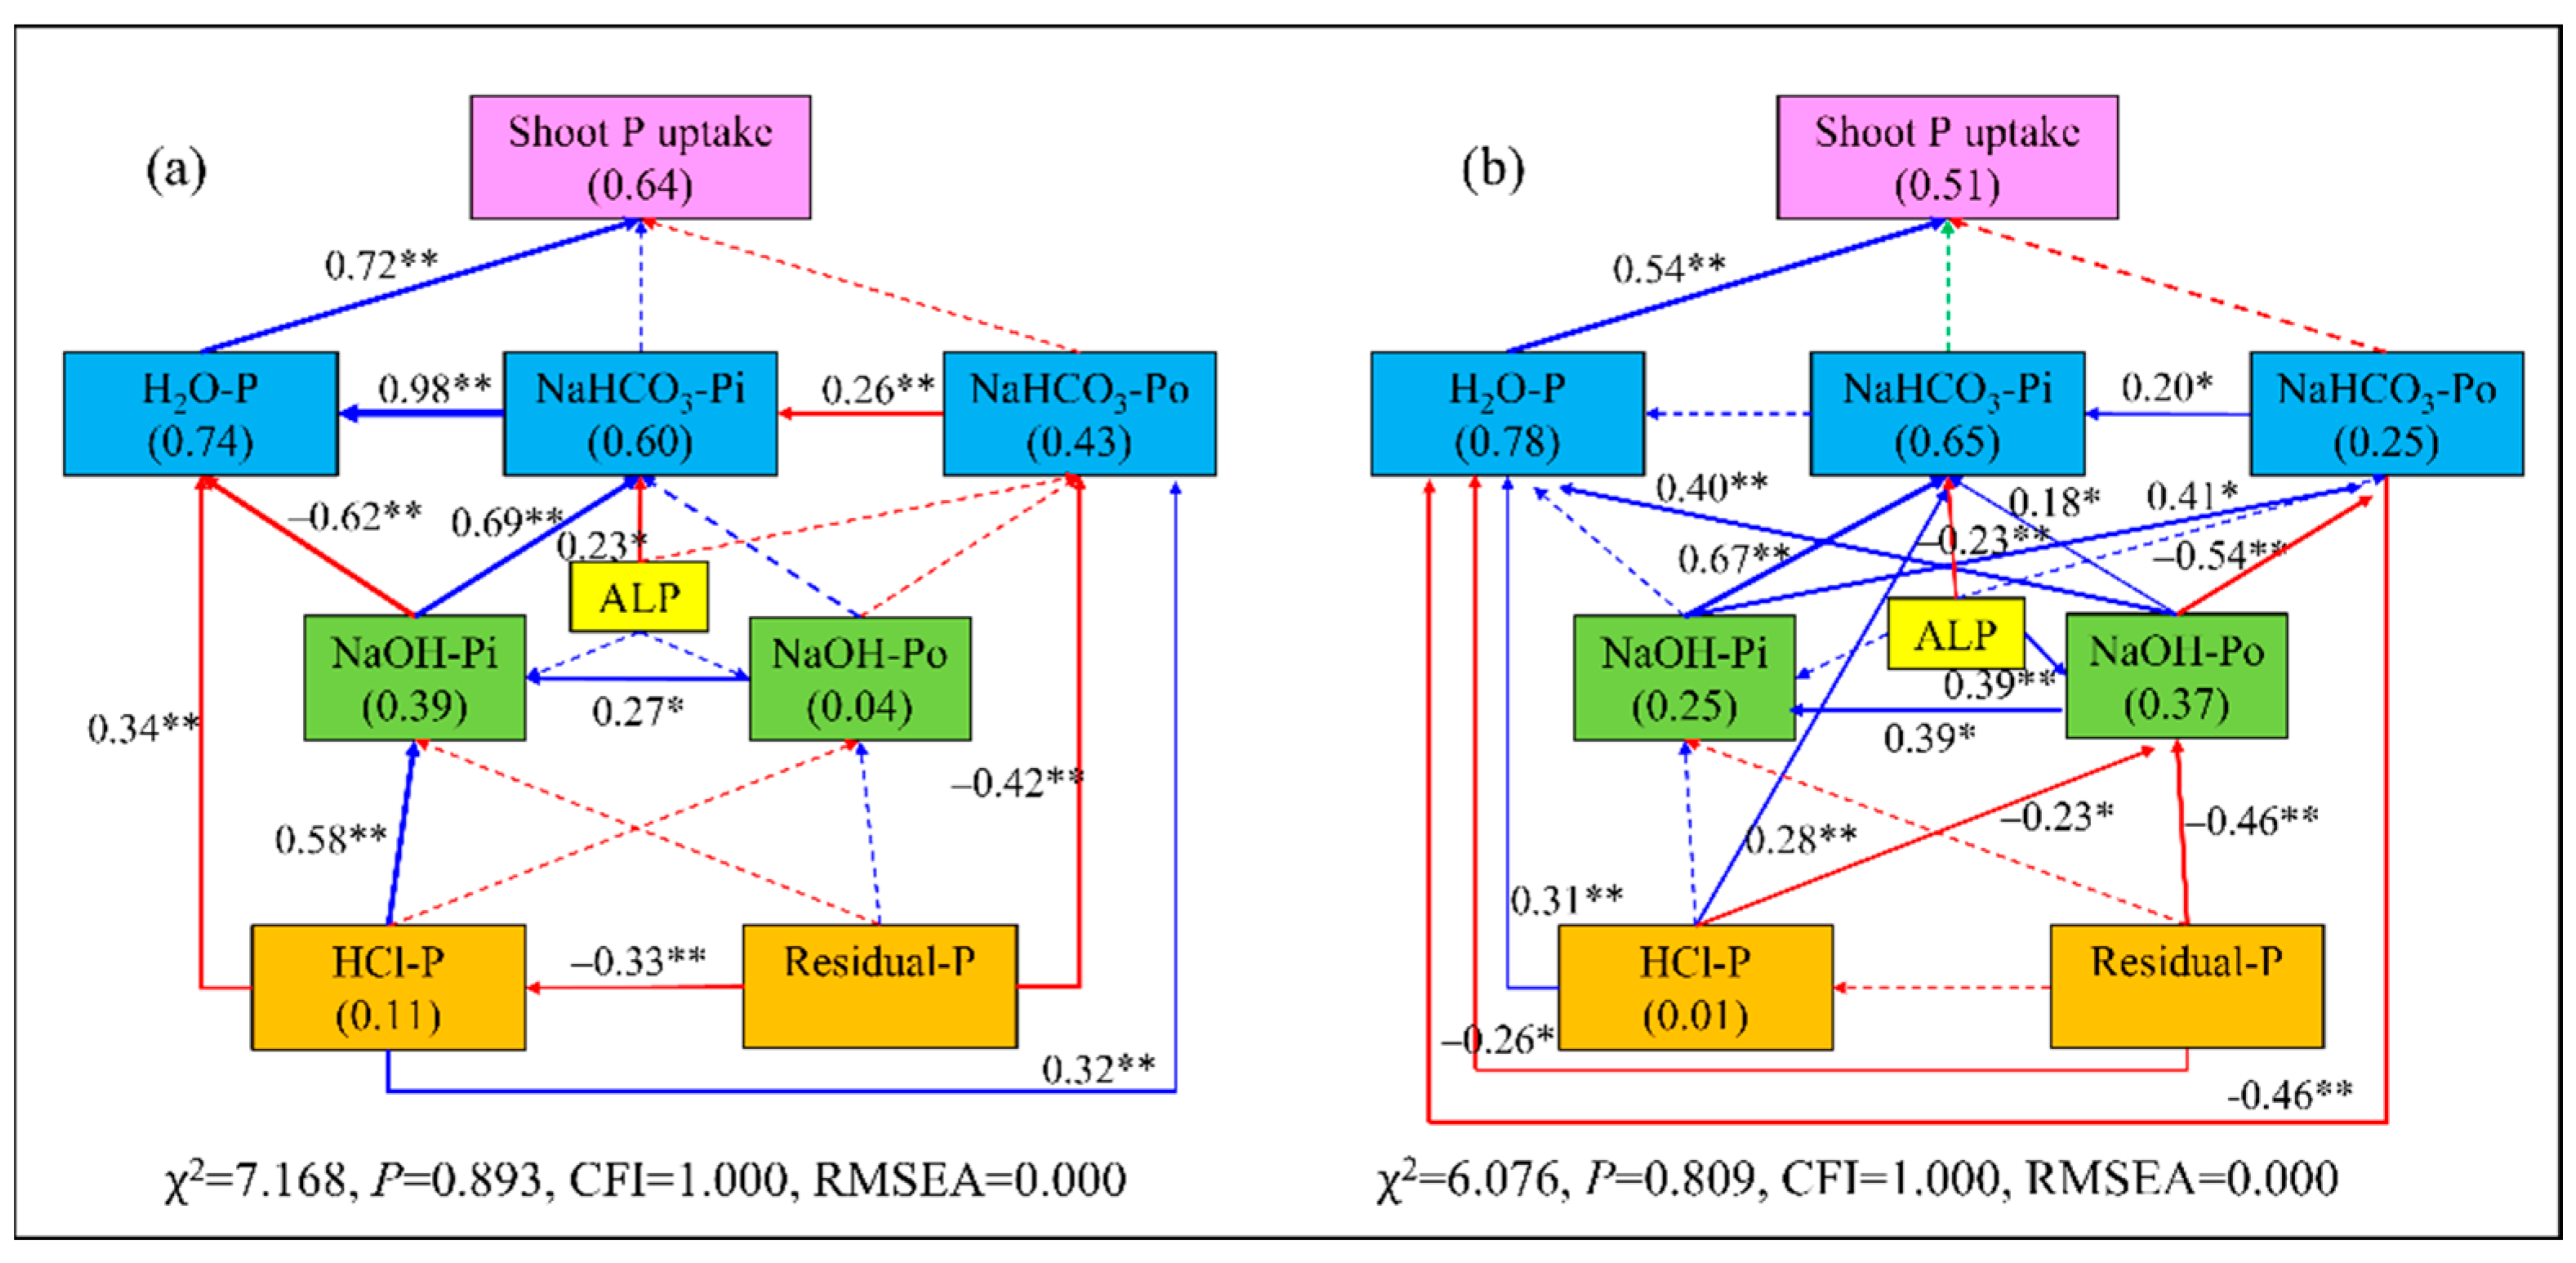
3.6. Direct and Indirect Effects of Soil P Fractions on Shoot P Uptake

Structural equation model analysis (SEM) showed that the soil P fractions had significant direct and indirect effects on shoot P uptake. The constructed SEM explained 64% and 51% of the total variation in shoot P uptake in the calcareous and non-calcareous soil, respectively (Figure 9). Of all the comprise variables, the soil H2O-P, NaHCO3-Pi and NaHCO3-Po had direct or indirect (via other P fractions and soil alkaline phosphatase activity, ALP) effects on shoot P uptake. Among multiple variables, the influence of P fertilizer on shoot P uptake was mainly explained by H2O-P and NaHCO3-Pi in the calcareous soil and by H2O-P and NaOH-Po in non-calcareous soil.

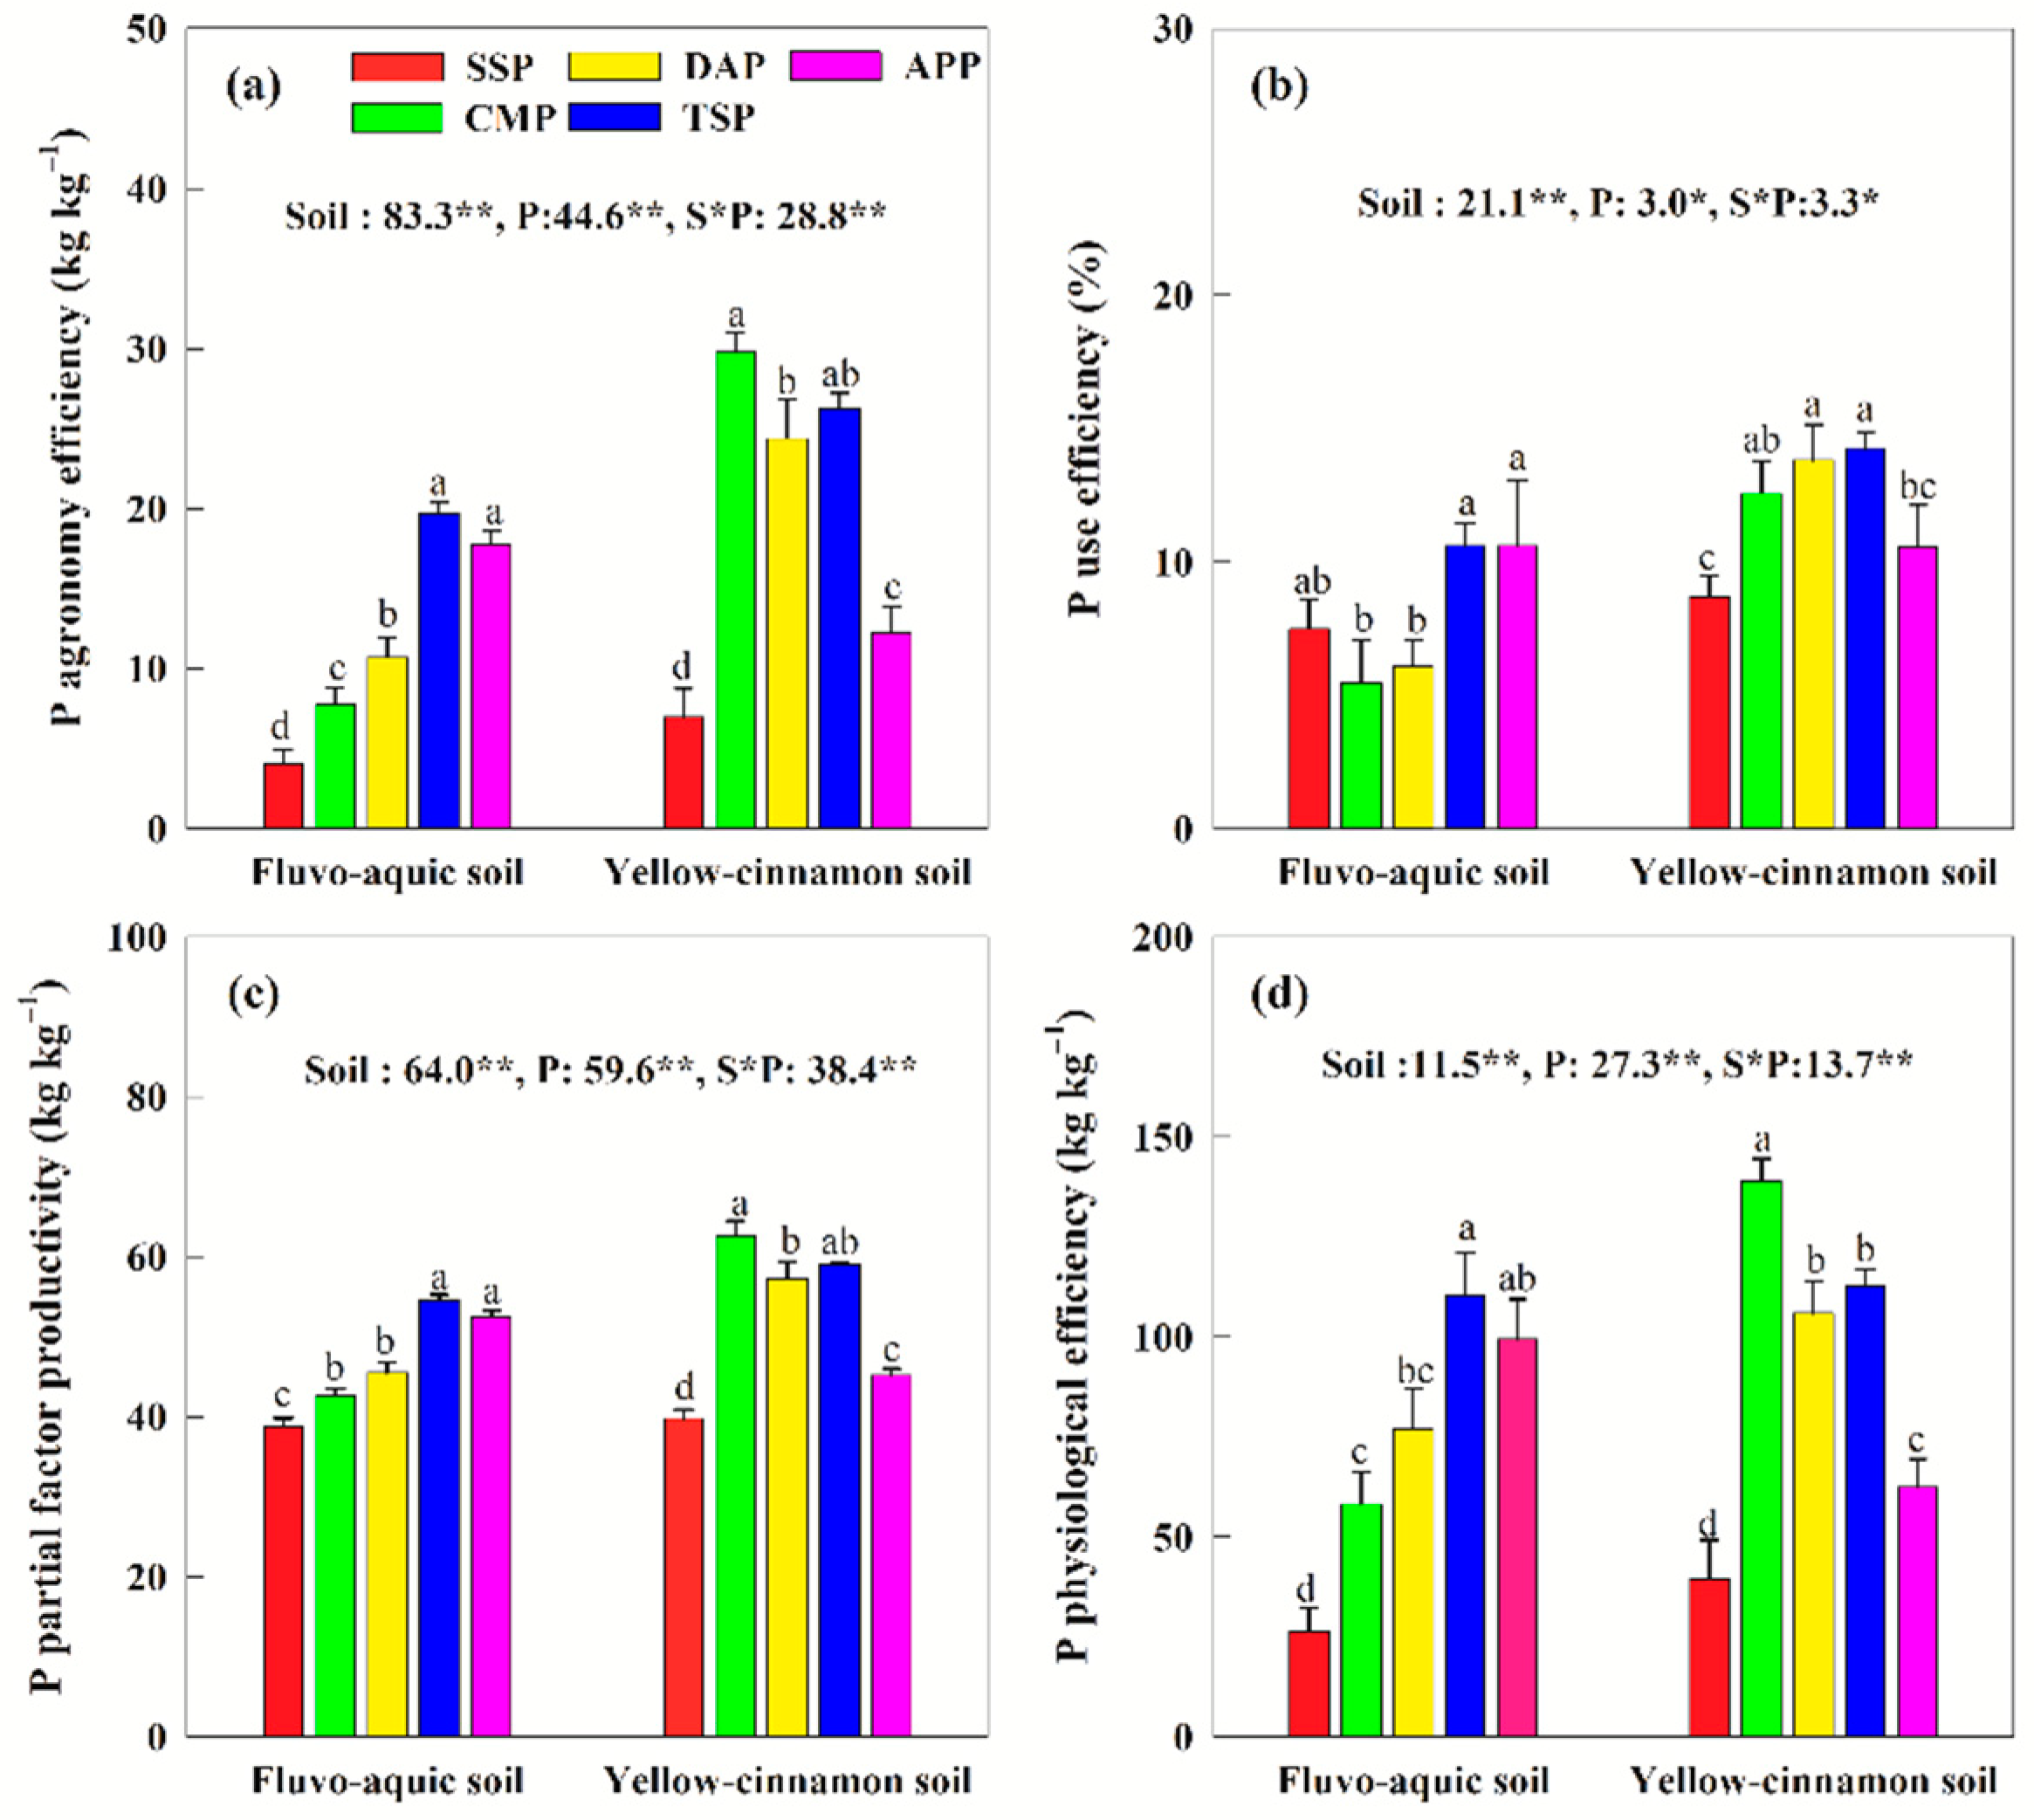
3.7. P Use Efficiency

In the calcareous soil, TSP had the highest PAE, or the PUE, PPFP, and PPE, but they did not significantly differ from APP (Figure 10a–d). In the non-calcareous soil, CMP had the highest PAE, PPFP, and PPE, but they did not significantly differ from TSP for the first two parameters. TSP had the highest PUE but did not significantly differ from DAP and CMP. SSP had relatively low PAE, PUE, PPFP, and PPE.

4. Discussion

4.1. Soil P Fraction Transformation and Availability Response to Different P Fertilizer Types

The applied TSP in calcareous soil had the most significant effect on improving soil available P concentration at wheat anthesis and maturity (62.7–690.4%), followed by DAP (31.6–221.3%). Some studies have shown that applying TSP in calcaric fluvisals soil significantly increased soil available P concentration by 122.2% compared with DAP [40,41]. However, Wang et al. [42] found that applying different P fertilizer types in irrigated meadow soil improved soil available P, with MAP being the best, followed by TSP and APP. Soil available P is absorbed and used by cereal crops, with the amount depending on the soil P budget, which varies with soil properties [6,11]. Soil pH value and calcium content are the main factors affecting the adsorption and desorption of P in calcareous soil, among which the change of soil pH value significantly affects the chemical fixation and precipitation and dissolution process of P [43]. When the pH value of calcium and magnesium phosphate compounds changes with the application of different P fertilizer types, the adsorbed P can have a desorption reaction, which makes P transfer from the solid phase to the liquid phase and improves the availability of soil P [44,45]. For high crop yields, an adequate soil P pool must be established to improve soil fertility gradually. P fertilizer application is the primary measure for improving the soil available P pool [32,46]. Meanwhile, the effectiveness of P fertilizer, shoot/root P uptake, and crop yield are related to P fertilizer type and the soil P fractions [47,48,49]. In our study, the dominant P fractions in non-calcareous soil were residual-P and HCl-P, in line with the finding of Shaheen et al. [50], who reported that the HCl-P fraction made up 58% of calcareous soil of Egypt, with the relative proportion of P fractions in the order HCl-P > residual-P > NaOH-P > NaHCO3-P. Residual-P is the component of occluded soil P, a predominantly organic P mixture of slightly soluble Ca-P and lignin, while HCl-P is mainly apatite-P in calcareous soil [51]. Due to the high concentration of calcium ions in calcareous soil, P and calcium ions easily precipitation to form calcium-P, creating acid-soluble components and reducing soil P availability [49,52]. Various studies have indicated that the higher the correlation between soil available P and a P fraction, the higher the availability of the P fraction [6,10,16]. In this study, soil available P positively correlated with the concentration of H2O-P, NaHCO3-Pi, and NaOH-Pi, which significantly increased with TSP and DAP in the calcareous soil while significantly reducing the proportions of HCl-P and residue-P. This indicates that TSP and DAP can promote the conversion of moderately active and stable P fractions to active P fractions in calcareous soil, improving the availability of P, which agrees with the findings of Mahmood et al. [49], who reported that NaHCO3-Pi was the main fraction absorbed by crops due to its high absolute concentration. The NaOH-P pool had a complementary effect on soil available P in calcareous cinnamon soil.
In contrast to calcareous soil, applied TSP and DAP or SSP has a good effect on increasing the concentration of soil available P, NaHCO3-Pi, and NaOH-Pi in non-calcareous soil. According to Pearson’s correlation between each P fraction and available P concentration, NaHCO3-Pi and NaOH-Pi had significant positive correlations with soil available P, indicating that they are critical supplies of available P in non-calcareous soil, and their increased concentration could directly improve P availability. Similarly, NaOH-Pi (comprising Al-P and Fe-P) also had a significant positive correlation with available P in vertisols in the central highlands of Ethiopia and Himalayan acid alfisol in India [53,54]. In contrast, Ca2-P and Al-P had a significant positive correlation with available P in cinnamon soil, but Fe-P had a negative relationship with available P in northwest China [55]. In this study, the texture of the non-calcareous soil is relatively heavy, and the P fractions are mainly residual-P, followed by NaOH-Pi and NaOH-Po. According to the results of a long-term field experiment, the P fertilizer on P reaction products is related to soil particle size fractionation. Still, P fixation in clay can be divided into (1) adsorption by the iron-aluminum oxide exchange complex and (2) fixation by the layered lattice of silicate clay [56,57]. Under SSP and DAP, the proportion of residue-P in the rhizosphere soil at wheat anthesis significantly decreased relative to the other P fertilizer types, possibly because P fertilizer hinders/curtails the conversion of active P to stable P and reduces soil P fixation, whether in Eum-Orthic Anthrosols (pH 8.24) on the Loess Plateau of China or in a Mollisol (silt-loam soil, pH 6.5) in Kansas, US [49,58]. It is also possible that wheat root activity has a higher rate of proton secretion at anthesis than at the early vegetative growth stage or late growth stage, accelerating soil organic P mineralization and releasing inorganic P required by microorganisms and plants, thus activating stable P in soil [59,60].

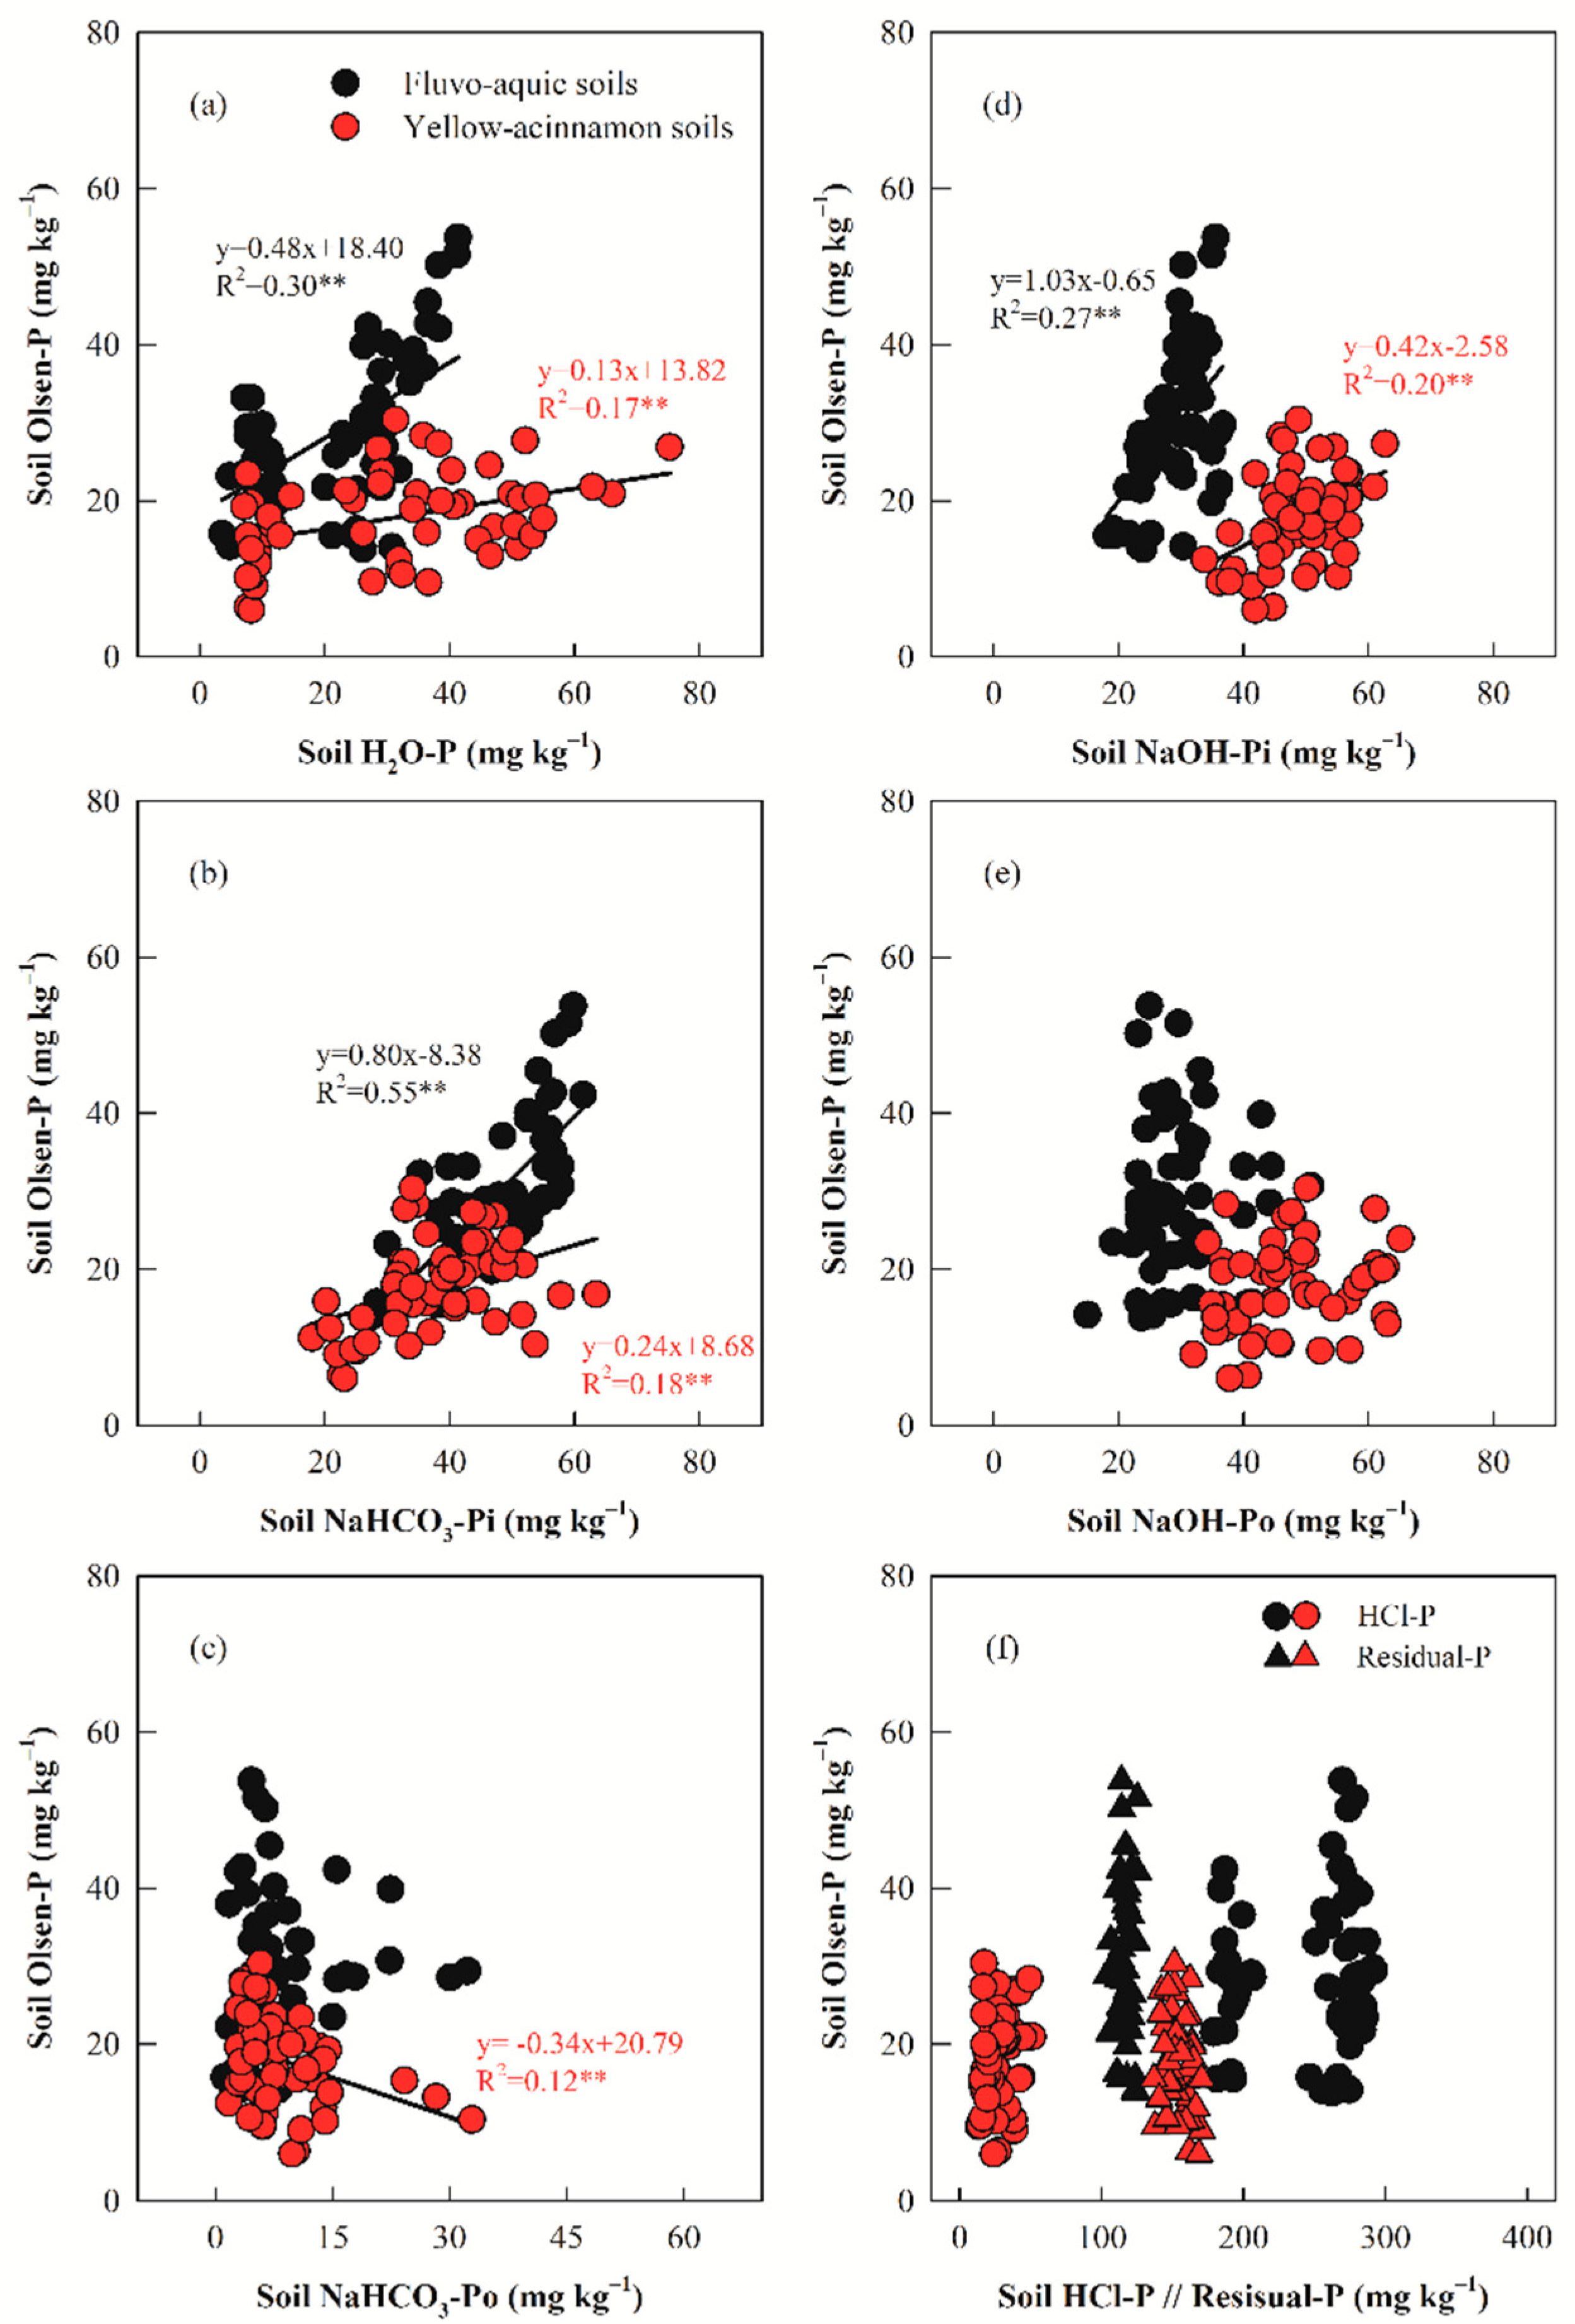
4.2. Relationship between Shoot P Uptake and Soil P Fraction

In the present study, significantly positive correlations were observed between wheat P uptake and labile and moderately labile P fractions, indicating that these variables have potential control effects on wheat P uptake. The application of P fertilizer increased soil Pi and resulted in a greater proportion of labile P in Andisols [61]. In our study, labile and moderately labile P fractions represent phyto-available P, and three P fractions (NaHCO3-Pi, NaOH-Pi and NaOH-Po) have positive and negative through H2O-P effects on wheat P uptake. Additionally, the contribution of soil H2O-P to wheat P uptake in calcareous soil was greater than that in non-calcareous soil. In calcareous soil, applied P fertilizer increased the NaHCO3-Pi concentration and decreased the NaOH-Pi and HCl-P, while the non-calcareous soil was dominated by an increased NaOH-Po concentration. Moreover, HCl-P was an important source of P profited from wheat in addition to H2O-P, NaHCO3-Pi, and NaOH-P, which was in line with the results of field trails carried out on the paddy soil (sandy loam, pH 5.22) [62]. Other field experiment has shown that soil microbial biomass P was the most crucial intruded factor controlling P uptake in high available P level soil. In contrast, soil microbial biomass C and NaOH-Pi were the best-intruded factors in low available P level soil [63]. This is because there are differences in the P fractions of microbial biomass, mineralization rate of Po and microbial community structure after P application in the two soils. Therefore, further research is needed to elucidate the microbial community structure changes after P application, especially the microorganisms with P solubilizing function, to provide new insights for accurately matching soil P pool-crop demand-P fertilizer.

4.3. Shoot P Accumulation and Grain Yield Response to Different P Fertilizer Types

Crop yield is the primary goal of intensive agricultural production. That is, P fertilizer that matches high grain yield must be preferred under the premise of efficient utilization of P. Although many studies have investigated the effect of P fertilizer on crop P accumulation and yield, P fertilizer efficiency is directly related to its composition and forms [6,16], crop variety [8,34], and soil type [7,11]. Applying TSP and APP in the calcareous soil and TSP and DAP in the non-calcareous soil increased shoot P accumulation and grain yield the most. In a pot experiment using cinnamon soil as calcareous soil (pH 8.06), shoot P accumulation and PUE under APP significantly increased by 59.3% and 70.2% compared with those under SSP [64]. Another study showed that MAP increased crop yield by 10.1% and 28.1% compared with SSP and DAP, respectively [65]. Moreover, field experiments have shown that aboveground biomass and crop yield under TSP did not significantly differ from APP and DAP in calcareous soil [16,66]. Our results align with those of Phillips et al. [67], who found that DAP did not reduce winter wheat forage and grain yield on acid soil compared with TSP. In some studies, a significant positive correlation occurred between shoot P accumulation and soil available P concentration [16,37]. In contrast, no significant relationships between grain yield and soil available P concentration have been reported in the major wheat-growing regions of China [11,68]. In addition, Mariotte et al. [69] found no significant relationship between plant P uptake and soil available P in a well-drained sandy loam red kurosol with pH 5.5 in Australia. In the current study, a positive correlation occurred between shoot P accumulation and soil available P irrespective of soil type, indicating that TSP or DAP can increase soil available P concentration, promote P uptake, accumulation, and transport in aboveground organs, and improve grain yield and PUE.

5. Conclusions

Different P fertilizer types applications significantly assumed soil P transformation characteristics, grain yield, P uptake and PUE in calcareous and non-calcareous soil-grown winter wheat. In calcareous soil, the Olsen-P concentration in the rhizosphere soil of TSP and DAP treatment was the highest, and the concentration and proportion of H2O-P and NaHCO3-Pi in the labile P fractions were significantly increased, while the proportion of the stable P fraction was decreased. Moreover, the application of TSP and APP can rapidly supplement the P consumption of calcareous soil and continue to maintain the optimal P concentration required by wheat, resulting in higher P uptake, yield and PUE. In non-calcareous soil, the P fractions were primarily residual-P and NaOH-Pi/o, with TSP and DAP significantly increasing the concentrations of NaHCO3-Pi and NaOH-Pi, which positively correlated with soil available P, thus promoting wheat P uptake, as to achieve high grain yield and high PUE. Comprehensive analysis showed the opportunity to increase wheat production with P fertilizer and sustainability through integrated soil P pool-crop P demand-P fertilizer systems. TSP and APP are recommended for calcareous soils, and TSP and DAP for non-calcareous soils. This study provides fundamental data for rational P management practice and offers useful information for policymakers, fertilizer producers, agricultural technology extenders and farmers.

Author Contributions

All authors contributed to the manuscript’s conception. L.L. wrote the first draft of the manuscript, and all authors commented on previous versions. All authors have read and agreed to the published version of the manuscript.

Funding

The authors are thankful to the Major Science and Technology Project of Anhui Province (202103a06020012) and the Fertilizer Efficient Application Technology Innovation and Training Service Project (22352004) for providing financial support.

Data Availability Statement

This study includes all supporting data, which can be obtained from the corresponding authors upon request.

Acknowledgments

The author would like to thank the reviewers for their valuable comments and suggestions for this work.

Conflicts of Interest

The authors declare no conflict of interest.

References

  1. Tilman, D.; Balzer, C.; Hill, J.; Befort, B.L. Global food demand and the sustainable intensification of agriculture. Proc. Natl. Acad. Sci. USA 2011, 108, 20260–20264. [Google Scholar] [CrossRef] [PubMed] [Green Version]
  2. Roy, B.B.; Chowdhury, R.B.; Baroi, A.R.; Rahman, S.; Powers, S.M.; Milne, N.; Sujauddin, M. Unravelling the anthropogenic pathways of phosphorus in the food production and consumption system of Bangladesh through the lens of substance flow analysis. J. Ind. Ecol. 2019, 23, 1439–1455. [Google Scholar] [CrossRef]
  3. Food and Agriculture Organization of the United Nations (FAO). FAOSTAT Technical Report. Available online: https://www.fao.org/home/zh/ (accessed on 20 May 2022).
  4. China Phosphate Fertilizer Industry Association. A Review of the Development of Phosphate Fertilizer Industry in 2020. Available online: https://www.cpia.org/ (accessed on 28 August 2022).
  5. Moreira, A.; Sfredo, G.J.; Moraes, L.A.C.; Fageria, N.K. Agronomic Efficiency of Two Types of Lime and Phosphate Fertilizer Sources in Brazilian Cerrado Soils Cultivated with Soybean. Commun. Soil Sci. Plant Anal. 2014, 45, 2319–2330. [Google Scholar] [CrossRef]
  6. Meyer, G.; Bell, M.J.; Doolette, C.L.; Brunetti, G.; Zhang, Y.Q.; Lombi, E.; Kopittke, P.M. Plant-Available Phosphorus in Highly Concentrated Fertilizer Bands: Effects of Soil Type, Phosphorus Form, and Coapplied Potassium. J. Agric. Food Chem. 2020, 68, 7571–7580. [Google Scholar] [CrossRef] [PubMed]
  7. Zhao, Y.N.; Li, R.K.; Huang, Y.F.; Sun, X.M.; Qin, W.; Wei, F.F.; Ye, Y.L. Effects of various phosphorus fertilizers on maize yield and phosphorus uptake in soils with different pH values. Arch. Agron. Soil Sci. 2021, 68, 1746–1754. [Google Scholar] [CrossRef]
  8. Dhillon, J.; Torres, G.; Driver, E.; Figueiredo, B.; Raun, W.B. World Phosphorus Use Efficiency in Cereal Crops. Agron. J. 2017, 109, 1670–1677. [Google Scholar] [CrossRef] [Green Version]
  9. Yu, X.; Keitel, C.; Dijkstra, F.A. Global analysis of phosphorus fertilizer use efficiency in cereal crops. Glob. Food Secur. 2021, 29, 100545. [Google Scholar] [CrossRef]
  10. Li, S.X.; Wang, Z.H.; Stewart, B.A. Differences of some leguminous and nonleguminous crops in utilization of soil phosphorus and responses to phosphate fer-tilizers. Adv. Agron. 2011, 110, 125–249. [Google Scholar] [CrossRef]
  11. Bai, Z.H.; Li, H.G.; Yang, X.Y.; Zhou, B.K.; Shi, X.J.; Wang, B.R.; Li, D.C.; Shen, J.B.; Chen, Q.; Qin, W.; et al. The critical soil P levels for crop yield, soil fertility and environmental safety in different soil types. Plant Soil 2013, 372, 27–37. [Google Scholar] [CrossRef]
  12. Hopkins, B.G.; Hansen, N.C. Phosphorus Management in High-Yield Systems. J. Environ. Qual. 2019, 14, 7669. [Google Scholar] [CrossRef] [Green Version]
  13. Erro, J.; Baigorri, R.; Yvin, J.-C.; Garcia-Mina, J.M. 31 P NMR Characterization and Efficiency of New Types of Water-Insoluble Phosphate Fertilizers to Supply Plant-Available Phosphorus in Diverse Soil Types. J. Agric. Food Chem. 2011, 59, 1900–1908. [Google Scholar] [CrossRef]
  14. Lu, D.J.; Song, H.; Jiang, S.T.; Chen, X.Q.; Wang, H.Y.; Zhou, J.M. Integrated Phosphorus Placement and Form for Improving Wheat Grain Yield. Agron. J. 2019, 111, 1998–2004. [Google Scholar] [CrossRef] [Green Version]
  15. Wang, X.W.; Gao, Y.J.; Hu, B.W.; Chu, G.X. Comparison of the hydrolysis characteristics of three polyphosphates and their effects on soil phosphorus and micronutrient availability. Soil Use Manag. 2019, 35, 664–674. [Google Scholar] [CrossRef]
  16. Ji, B.J.; Li, W.H.; Xu, M.Y.; Niu, J.C.; Zhang, S.L.; Yang, X.Y. Varying synthetic phosphorus varieties lead to different fractions in calcareous soil. Sci. Agric. Sin. 2021, 54, 2581–2594. [Google Scholar]
  17. Li, Q.J.; Zhang, Y.; Harlhax, Y.; Feng, G. Phosphorus utilization efficiency and yield responses of drip irrigated cotton under plastic film mulching to three types of water soluble phosphorus fertilizers. Cotton Sci. 2018, 30, 172–179. [Google Scholar]
  18. Zhang, H.Y.; Zhang, J.; Zhang, F.L.; Liu, D.; Wei, C.Z. Effects of different phosphorus fertilizers on soil phosphorus availability and maize yield under drip irrigation. J. Soil Water Conserv. 2019, 33, 189–195. [Google Scholar]
  19. Wang, Y.K.; Cai, Z.J.; Feng, G. Effects of different phosphorus application techniques on phosphorus availability in a rape system in a red soil. Acta Pedol. Sin. 2023, 60, 235–246. [Google Scholar]
  20. Weihrauch, C.; Opp, C. Ecologically relevant phosphorus pools in soils and their dynamics: The story so far. Geoderma 2018, 325, 183–194. [Google Scholar] [CrossRef]
  21. Han, Y.; Chen, X.W.; Choi, B. Effect of Freeze–Thaw Cycles on Phosphorus Fractions and Their Availability in Biochar-Amended Mollisols of Northeast China (Laboratory Experiment). Sustainability 2019, 11, 1006. [Google Scholar] [CrossRef] [Green Version]
  22. Milić, S.; Ninkov, J.; Zeremski, T.; Latković, D.; Šeremešić, S.; Radovanović, V.; Žarković, B. Soil fertility and phosphorus fractions in a calcareous chernozem after a long-term field experiment. Geoderma 2018, 339, 9–19. [Google Scholar] [CrossRef]
  23. Liao, D.; Zhang, C.C.; Lambers, H.; Zhang, F.S. Adding intercropped maize and faba bean root residues increases phosphorus bioavailability in a calcareous soil due to organic phosphorus mineralization. Plant Soil 2022, 476, 201–218. [Google Scholar] [CrossRef]
  24. Cherubin, M.R.; Franco, A.L.C.; Cerri, C.E.P.; Karlen, D.L.; Pavinato, P.S.; Rodrigues, M.; Davies, C.A.; Cerri, C.C. Phosphorus pools responses to land-use change for sugarcane expansion in weathered Brazilian soils. Geoderma 2016, 265, 27–38. [Google Scholar] [CrossRef]
  25. Menezes-Blackburn, D.; Giles, C.; Darch, T.; George, T.S.; Blackwell, M.; Stutter, M.; Shand, C.; Lumsdon, D.; Cooper, P.; Wendler, R.; et al. Opportunities for mobilizing recalcitrant phosphorus from agricultural soils: A review. Plant Soil 2017, 427, 5–16. [Google Scholar] [CrossRef] [Green Version]
  26. Hedley, M.J.; Steaward, J.W.B.; Chauhan, B.S. Changes in inorganic and organic soil phosphorus fractions induced by cultivation practices and by laboratory incubations. Soil Sci. Soc. Am. J. 1982, 46, 970–976. [Google Scholar] [CrossRef]
  27. Sui, Y.; Thompson, M.L.; Shang, C. Fractionation of Phosphorus in a Mollisol Amended with Biosolids. Soil Sci. Soc. Am. J. 1999, 63, 1174–1180. [Google Scholar] [CrossRef]
  28. Li, L.; Liang, X.Q.; Ye, Y.S.; Zhao, Y.; Zhang, Y.X.; Jin, Y.; Yuan, J.L.; Chen, Y.X. Effects of repeated swine manure applications on legacy phosphorus and phosphomonoesterase activities in a paddy soil. Biol. Fertil. Soils 2014, 51, 167–181. [Google Scholar] [CrossRef]
  29. Liu, J.; Li, C.Y.; Xing, Y.W.; Wang, Y.; Xue, Y.L.; Wang, C.R.; Dang, T.H. Effects of long-term fertilization on soil organic phosphorus fractions and wheat yield in farmland of Loess Plateau. J. Appl. Ecol. 2020, 31, 157–164. [Google Scholar]
  30. Zhang, L.C.; Chen, J.J.; Chu, G.X. Legacy phosphorus in calcareous soil under 33 years of P fertilizer application: Implications for efficient P management in agriculture. Soil Use Manag. 2022, 38, 1380–1393. [Google Scholar] [CrossRef]
  31. Feng, Y.H.; Zhang, Y.Z.; Huang, Y.X. Effects of phosphatezation on organic phosphorus fractions and their seasonal variations and bioavailabilities of paddy soils in Hunan Province. J. Plant Nutr. Fert. 2010, 16, 634–641. [Google Scholar]
  32. Johnston, A.E.; Poulton, P.R. Phosphorus in Agriculture: A Review of Results from 175 Years of Research at Rothamsted, UK. J. Environ. Qual. 2019, 48, 1133–1144. [Google Scholar] [CrossRef] [Green Version]
  33. Xu, X.F.; Mi, Q.; Liu, D.; Fu, S.L.; Wang, X.G.; Guo, D.Y.; Zhou, W. Effect of phosphorus fertilizer rate on phosphorus fractions contents in calcareous soil and phosphorus accumulation amount in crop. Chin. J. Eco-Agric. 2021, 29, 1857–1866. [Google Scholar]
  34. Valkama, E.; Uusitalo, R.; Ylivainio, K.; Virkajarvi, P.; Turtola, E. Phosphorus fertilization: A meta-analysis of 80 years of re-search in Finland. Agric. Ecosyst. Environ. 2009, 130, 75–85. [Google Scholar] [CrossRef]
  35. Tang, X.; Shi, X.; Ma, Y.; Hao, X. Phosphorus efficiency in a long-term wheat–rice cropping system in China. J. Agric. Sci. 2010, 149, 297–304. [Google Scholar] [CrossRef]
  36. Johnston, A.E.; Poulton, P.R.; Fixen, P.E.; Curtin, D. Phosphorus: Its efficient use in agriculture. Adv. Agron. 2014, 123, 177–228. [Google Scholar]
  37. Singh, J.; Brar, B.S.; Sekhon, B.S.; Mavi, M.S.; Singh, G.; Kaur, G. Impact of long-term phosphorous fertilization on Olsen-P and grain yields in maize–wheat cropping sequence. Nutr. Cycl. Agroecosystems 2016, 106, 157–168. [Google Scholar] [CrossRef]
  38. Moreira, A.; Moraes, L.A.C.; Petineli, R. Phosphate Fertilizer in Soybean-Wheat Cropping System Under No-Till Management. Front. Sustain. Food Syst. 2020, 4. [Google Scholar] [CrossRef]
  39. Katznelson, H.; Bose, B. Metabolic activity and phosphate-dissolving capability of bacterial isolates from wheat roots, rhizosphere, and non-rhizosphere soil. Can. J. Microbiol. 1959, 5, 673–678. [Google Scholar] [CrossRef] [PubMed]
  40. Zhang, Y.P.; Chen, Q.; Li, Y.; Li, G.S.; Sun, M.; Liu, Z.H. Effect of phosphorus levels on form and bioavailability of inorganic P in plough layer of cinnamon soil in Shandong province. Chin. Agric. Sci. Bull. 2008, 24, 245–248. [Google Scholar]
  41. Chen, B.L.; Sheng, J.D.; Jiang, P.A.; Liu, Y.G. Effect of applying different forms and rates of phosphoric fertilizer on phosphorus efficiency and cotton yield. Cotton Sci. 2010, 22, 49–56. [Google Scholar]
  42. Wang, Y.Y.; Gong, H.D.; Wang, X.Y.; Tu, Y.F.; Song, H.Y.; Chen, B.L.; Sheng, J.D. Effects of phosphorus application on inorganic phosphorus forms and available phosphorus in irrigated meadow soil. J. Agric. Resour. Environ. 2023, 40, 135–142. [Google Scholar]
  43. Adhami, E.; Ronaghi, A.; Karimian, N.; Molavi, R. Transformation of phosphorus in highly calcareous soils under field capac-ity and waterlogged conditions. Soil Res. 2012, 50, 249–255. [Google Scholar] [CrossRef]
  44. Maharajan, T.; Ceasar, S.A.; Krishna, T.P.A.; Ignacimuthu, S. Management of phosphorus nutrient amid climate change for sustainable agriculture. J. Environ. Qual. 2021, 50, 1303–1324. [Google Scholar] [CrossRef] [PubMed]
  45. Wang, Q.; Chen, Y.H.; Zhang, N.Y.; Qin, Z.H.; Jin, Y.W.; Zhu, P.; Peng, C.; Colinet, G.; Zhang, S.X. Phosphorus adsorption and desorption characteristics as affected by long-term phosphorus application in black soil. J. Plant Nutr. Fert. 2022, 28, 1569–1581. [Google Scholar]
  46. Gatiboni, L.C.; Schmitt, D.E.; Tiecher, T.; Veloso, M.G.; Dos Santos, D.R.; Kaminski, J.; Brunetto, G. Plant uptake of legacy phosphorus from soils without P fertilization. Nutr. Cycl. Agroecosystems 2021, 119, 139–151. [Google Scholar] [CrossRef]
  47. Boschetti, N.G.; Quintero, C.E.; Giuffre, L. Phosphorus fractions of soils under Lotus corniculatus as affected by different phosphorus fertilizers. Biol. Fertil. Soils 2008, 45, 379–384. [Google Scholar] [CrossRef]
  48. Uygur, V.; Durgun, B.; Senol, H. Chemical Fractions of Phosphorus: The Effect of Soil Orders, Soil Properties, and Land Use. Commun. Soil Sci. Plant Anal. 2017, 48, 1319–1335. [Google Scholar] [CrossRef]
  49. Mahmood, M.; Tian, Y.; Ma, Q.X.; Ahmed, W.; Mehmood, S.; Hui, X.L.; Wang, Z.H. Changes in Phosphorus Fractions and Its Availability Status in Relation to Long Term P Fertilization in Loess Plateau of China. Agronomy 2020, 10, 1818. [Google Scholar] [CrossRef]
  50. Shaheen, S.M.; Tsadilas, C.D.; Stamatiadis, S. Inorganic phosphorus forms in some entisols and aridisols of Egypt. Geoderma 2007, 142, 217–225. [Google Scholar] [CrossRef]
  51. Weil, R.R.; Brady, N.C. The Nature and Properties of Soils, 15th ed.; Pearson Education: Columbus, OH, USA, 2017. [Google Scholar]
  52. Khorshid, M.S.H.; Kruse, J.; Semella, S.; Vohland, M.; Wagner, J.F.; Thiele-Bruhn, S. Phosphorus fractions and speciation in rural and urban calcareous soils in the semiarid region of Sulaimani city, Kurdistan, Iraq. Environ. Earth Sci. 2019, 78, 531. [Google Scholar] [CrossRef]
  53. Kumar, A.; Suri, V.K.; Choudhary, A.K. Influence of inorganic phosphorus, VAM fungi, and irrigation regimes on crop productivity and phosphorus transformations in okra (Abelmoschus esculentus L.)-pea (Pisum sativum L.) cropping system in an acid alfisol. Commun. Soil Sci. Plan. 2014, 45, 953–967. [Google Scholar] [CrossRef]
  54. Hailu, H.; Keskinen, R.; Woldetsadik, D.; Mamo, T. Different Indices as Indicators of Phosphorus Availability to Wheat on Vertisols in Central Highlands of Ethiopia. Commun. Soil Sci. Plant Anal. 2022, 53, 3029–3044. [Google Scholar] [CrossRef]
  55. Cao, D.Y.; Lan, Y.; Liu, Z.Q.; Yang, X.; Liu, S.N.; He, T.Y.; Wang, D.I.; Meng, J.; Chen, W.F. Responses of organic and inorganic phosphorus fractions in brown earth to successive maize stover and biochar application: A 5-year field experiment in Northeast China. J. Soils Sediments 2020, 20, 2367–2376. [Google Scholar] [CrossRef]
  56. Varinderpal-Singh.; Dhillon, N.S.; Raj-Kumar.; Brar, B.S. Long-term effects of inorganic fertilizers and manure on phosphorus reaction products in a Typic Ustochrept. Nutr. Cycl. Agroecosys. 2006, 76, 29–37. [Google Scholar] [CrossRef]
  57. Van der Bom, F.J.T.; McLaren, T.I.; Doolette, A.L.; Magid, J.; Frossard, E.; Oberson, A.; Jensen, L.S. Influence of long-term phosphorus fertilisation history on the availability and chemical nature of soil phosphorus. Geoderma 2019, 355, 113909. [Google Scholar] [CrossRef]
  58. Coelho, M.J.A.; Diaz, D.R.; Hettiarachchi, G.M.; Hansel, F.D.; Pavinato, P.S. Soil phosphorus fractions and legacy in a corn-soybean rotation on Mollisols in Kansas, USA. Geoderma Reg. 2019, 18, e00228. [Google Scholar] [CrossRef]
  59. Wang, X.C.; Deng, X.Y.; Pu, T.; Song, C.; Yong, T.W.; Yang, F.; Sun, X.; Liu, W.G.; Yan, Y.H.; Du, J.B.; et al. Contribution of interspecific interactions and phosphorus application to increasing soil phosphorus availability in relay intercropping systems. Field Crop. Res. 2017, 204, 12–22. [Google Scholar] [CrossRef]
  60. Yu, F.Y.; Li, W.; Gao, X.K.; Li, P.; Fu, Y.H.; Yang, J.Y.; Li, Y.J.; Chang, H.Q.; Zhou, W.L.; Wang, X.G.; et al. Genotype difference in the physiological characteristics of phosphorus acquisition by wheat seedlings in alkaline soils. Plant, Soil Environ. 2020, 66, 506–512. [Google Scholar] [CrossRef]
  61. Velásquez, G.; Calabi-Floody, M.; Poblete-Grant, P.; Rumpel, C.; Demanet, R.; Condron, L.; Mora, M.L. Fertilizer effects on phosphorus fractions and organic matter in Andisols. J. Soil Sci. Plant Nutr. 2016, 16, 294–304. [Google Scholar] [CrossRef] [Green Version]
  62. Yan, J.Y.; Ren, T.; Wang, K.K.; Li, H.Z.; Li, X.K.; Cong, R.H.; Lu, J.W. Improved crop yield and phosphorus uptake through the optimization of phosphorus fertilizer rates in an oilseed rape-rice cropping system. Field Crop. Res. 2022, 286. [Google Scholar] [CrossRef]
  63. Wang, K.K.; Ren, T.; Yan, J.Y.; Zhu, D.D.; Liao, S.P.; Zhang, Y.Y.; Lu, Z.F.; Cong, R.H.; Li, X.K.; Lu, J.W. Straw returning medi-ates soil microbial biomass carbon and phosphorus turnover to enhance soil phosphorus availability in a rice-oilseed rape rotation with different soil phosphorus levels. Agric. Ecosyst. Environ. 2022, 335, 107991. [Google Scholar] [CrossRef]
  64. Guo, D.Y.; Yuan, Y.Y.; Zeng, X.; Chen, B.; Wei, W.J.; Cui, Y.; Yuan, M.; Sun, L.R. Effect of phosphorus fertilizer on maize growth and inorganic phosphorus fractions in a calcareous soil. J. Soil Water Conserv. 2021, 35, 243–249. [Google Scholar]
  65. Alkhader, A.M.F.; Abu, R.A.M.; Rusan, M.J. The effect of phosphorus fertilizers on the growth and quality of lettuce (Lactuca sativa L.) under greenhouse and field conditions. J. Food Agric. Environ. 2013, 11, 777–783. [Google Scholar]
  66. Akhtar, M.; Yaqub, M.; Naeem, A.; Ashraf, M.; Hernandez, V.E. Improving phosphorus uptake and wheat productivity by phosphoric acid application in alkaline calcareous soils. J. Sci. Food Agric. 2015, 96, 3701–3707. [Google Scholar] [CrossRef] [PubMed]
  67. Phillips, S.B.; Raun, W.R.; Johnson, G.V.; Thomason, W.E. Effect of dual applied phosphorus and gypsum on wheat forage and grain yield. J. Plant Nutr. 2000, 23, 251–261. [Google Scholar] [CrossRef]
  68. Huang, Q.N.; Dang, H.Y.; Huang, T.M.; Hou, S.B.; Wang, Z.H. Evaluation of farmers’ fertilizer application and fertilizer reduction potentials in major wheat production regions of China. Sci. Agric. Sin. 2020, 53, 4816–4834. [Google Scholar]
  69. Mariotte, P.; Cresswell, T.; Johansen, M.P.; Harrison, J.J.; Keitel, C.; Dijkstra, F.A. Plant uptake of nitrogen and phosphorus among grassland species affected by drought along a soil available phosphorus gradient. Plant Soil 2020, 448, 121–132. [Google Scholar] [CrossRef]
Figure 1. Modified Hedley sequential soil P fractions extraction method. Pi and Po denote inorganic and organic P, respectively.
Agronomy 13 00928 g001
Figure 2. Grain yield (a) and its components (bd) for winter wheat as affected by P fertilizer types in calcareous and non-calcareous soil. Data are presented as means of three replications with standard errors. Different lowercase letters indicate significant mean differences between P fertilizer types in the same soil (LSD, p < 0.05). Probabilities of F-statistics for P fertilizer types effects are presented at the top of each figure. (**, ns) significantly difference at p < 0.01 and p > 0.05, respectively.
Agronomy 13 00928 g002
Figure 3. Soil available P concentration and soil alkaline phosphatase activity as affected by P fertilizer type in calcareous and non-calcareous soil. Data are presented as means of three replications with standard errors. Different lowercase letters indicate significant mean differences between P fertilizer types in the same soil (LSD, p < 0.05). Probabilities of F-statistics for P fertilizer types effects are presented at the top of each figure. (*, **, ns) significantly difference at p < 0.05, p < 0.01 and p > 0.05, respectively.
Agronomy 13 00928 g003
Figure 4. Total root length (a) and total root surface area (b) as affected by P fertilizer type in calcareous and non-calcareous soil. Data are presented as means of three replications with standard errors. Different lowercase letters indicate significant mean differences between P fertilizer types in the same soil (LSD, p < 0.05).
Agronomy 13 00928 g004
Figure 5. Soil P fraction concentration in rhizosphere soil (a) and non-rhizosphere soil (b) as affected by P fertilizer type in calcareous and non-calcareous soil. Data are presented as means of three replications with standard errors. Different lowercase letters indicate significant mean differences between P fertilizer types in the same soil (LSD, p < 0.05).
Agronomy 13 00928 g005
Figure 6. Percentage of each P fraction to total P as affected by P fertilizer type in calcareous and non-calcareous soil. The small and large circles indicate rhizosphere and non-rhizosphere soils under the same P fertilizer treatment. Data are presented as means of three replications with standard errors. Different lowercase letters indicate significant mean differences between P fertilizer types in the same soil (LSD, p < 0.05).
Agronomy 13 00928 g006
Figure 7. Relationships between soil Olsen-P and H2O-P (a), NaHCO3-Pi (b), NaHCO3-Po (c), NaOH-Pi (d), NaOH-Po (e), and HCl-P or residual-P (f) in calcareous and non-calcareous soil. ** significant at 0.01 level.
Agronomy 13 00928 g007
Figure 8. Effect of P fertilizer type on shoot P accumulation at anthesis (a) and maturity (b), and the relationships between soil Olsen-P and shoot P accumulation at anthesis (c) and maturity (d) in calcareous and non-calcareous soil. Data are presented as means of three or six replications with standard errors. Different lowercase letters indicate significant mean differences between P fertilizer types in the same soil (LSD, p < 0.05). Probabilities of F-statistics for P fertilizer types effects are presented at the top of (a,b). (**, ns) significantly difference at p < 0.01 and p > 0.05, respectively.
Agronomy 13 00928 g008
Figure 9. Structural equation model analysis (SEM) examining the direct and indirect effects of soil P fractions on shoot P uptake of winter wheat grown on the calcareous soil (a) and non-calcareous soil (b). ALP, alkaline phosphatase activity. The numbers within the boxes show the explained percentages of the variance by the predictor variables. The blue and red lines/arrows indicate positive and negative relationships. The numbers above the lines denote the standardized path coefficients (* p < 0.05, ** p < 0.01), the thickness of the lines indicates the magnitudes of the causal relationship. Solid and dashed lines indicate significant and insignificant paths, respectively.
Agronomy 13 00928 g009
Figure 10. Phosphorus agronomy efficiency (a), P use efficiency (b), P partial factor productivity (c) and P physiological efficiency (d) as affected by P fertilizer type in calcareous and non-calcareous soil. Data are presented as means of three replications with standard errors. Different lowercase letters indicate significant mean differences between P fertilizer types in the same soil (LSD, p < 0.05). Probabilities of F-statistics for P fertilizer-type effects are presented at the top of each figure. (*, **) significantly difference at p < 0.05 and p < 0.01, respectively.
Agronomy 13 00928 g010
Table 1. Physical and chemical properties of the soil before sowing.
Soil TypesTextureOMTNANAPAKpH
(g kg−1)(g kg−1)(mg kg−1)(mg kg−1)(mg kg−1)
Fluvo-aquicSandy loam11.7 ± 0.20.65 ± 0.0156.1 ± 2.34.9 ± 0.1101.3 ± 0.78.04 ± 0.1
Yellow cinnamonClay loam14.9 ± 0.30.93 ± 0.0169.9 ± 1.24.1 ± 0.2150.0 ± 3.97.17 ± 0.1
Disclaimer/Publisher’s Note: The statements, opinions and data contained in all publications are solely those of the individual author(s) and contributor(s) and not of MDPI and/or the editor(s). MDPI and/or the editor(s) disclaim responsibility for any injury to people or property resulting from any ideas, methods, instructions or products referred to in the content.

