Article

Leaf Trait Hyperspectral Characterization of Castanea sativa Miller Affected by Dryocosmus kuriphilus Yasumatsu

by
Dimas Pereira-Obaya
1,*,
Fernando Castedo-Dorado
2,
Enoc Sanz-Ablanedo
1,
Karen Brigitte Mejía-Correal
1 and
José Ramón Rodríguez-Pérez
1
1
Grupo de Investigación en Geomática e Ingeniería Cartográfica (GEOINCA), Universidad de León, Avenida de Astorga sn, 24401 Ponferrada, León, Spain
2
Departamento de Ingeniería y Ciencias Agrarias, Universidad de León, Avenida de Astorga sn, 24401 Ponferrada, León, Spain
*
Author to whom correspondence should be addressed.
Agronomy 2023, 13(3), 923; https://doi.org/10.3390/agronomy13030923
Submission received: 8 February 2023 / Revised: 9 March 2023 / Accepted: 18 March 2023 / Published: 20 March 2023
(This article belongs to the Special Issue Advances in Field Spectroscopy in Agriculture)

Abstract

:
While populations of the Asian chestnut gall wasp (Dryocosmus kuriphilus Yasumatsu), an invasive pest affecting the European chestnut (Castanea sativa Miller), have started to be controlled biologically, this pest still conditions chestnut tree development. With the aim of assessing plant health status as a means of monitoring gall wasp infestation, we used a field spectroradiometer to collect data from leaves taken from 83 trees in two chestnut orchards. We calculated characteristic spectral signatures for pest infestation, and after training and validation, developed classifiers to distinguish between different infestation levels. Several partial least square discriminant analysis (PLS-DA) and random forest (RF) models were fitted with reflectance and transformed values to obtain characteristic curves reflecting infestation. Four wavelengths (560 nm, 680 nm, 1400 nm, and 1935 nm) were identified as showing the greatest differences between curves. The best overall accuracy (69.23%) was achieved by an RF model fitted with reflectance transformed values. Lower overall accuracy (26.92%) was achieved in distinguishing between infestation levels. In conclusion, while more specific differences in infestation levels were not detectable, our method successfully discriminated between gall absence and presence.

1. Introduction

The European chestnut (Castanea sativa Miller) grows mainly in southern and western Europe, where there is a long tradition of chestnut cultivation for fruit and wood [1]. In Spain, around 50,000 ha of stands are managed for fruit, producing around 40,000 tonnes annually [2]. The main chestnut producing areas in Spain are Galicia and Castilla y León [3]. Our study was conducted in the Bierzo region of Castilla y León, where chestnuts cover an area of some 20,000 ha and produce 8000 tonnes of fruit annually, leaving an annual income for owners of close to 15 million euros. In the last 20 years, numerous new chestnut tree plantations have been established, further increasing production.
Chestnut production is currently challenged by several biotic sources of stress. A major insect pest in chestnut orchards is the Asian chestnut gall wasp (Dryocosmus kuriphilus Yasumatsu; Hymenoptera: Cynipidae) (e.g., [4]). This invasive species, widespread in many countries, including Spain, is a major source of concern. In El Bierzo, this pest, first detected in the spring of 2017, is now present throughout the region [5]. Although C. sativa is considered a susceptible species, variability in gall wasp infestation has been reported for different varieties, suggesting a genotype-dependent variation in susceptibility [6,7,8]. Moreover, differences have been reported for trees of the same variety, likely due to specific features of individual trees within populations [9].
The galling activity of D. kuriphilus prevents or inhibits the development of normal shoots and leads to the production of abnormal plant structures [10]. Over the long term, the decreased capacity to develop buds can result in malformation of the branch architecture and general deterioration of the crown [11]. The reduced leaf area in affected trees can lead to a gradual loss of photosynthetic biomass and a decrease in tree vigour [12]. Studies that have quantified the impact of gall wasp infestation have reported fruit production reduced by up to 80% in heavily infested trees [13], a decline in the chestnut component of honey [14], and a marked reduction in radial growth [15].
Gall wasp infestation is expected to be reduced over the medium term by the parasitoid Torymus sinensis, released in El Bierzo from 2018, although establishment of the parasitoid continues to be low in many areas of Spain [16]. Of great interest, however, in areas where ecosystem services are economically important, is the development of non-invasive techniques that allow early gall wasp infestation assessment.
Innovative approaches to health status monitoring need to be tested, especially techniques for early pest detection. Potentially useful techniques are remote sensing (using unmanned aerial vehicles (UAVs), satellite, etc) using optical sensors and close-range instruments such as field spectroradiometers. Hyperspectral spectroscopy has been successfully used for this purpose, as described in reviews by Cheshkova [17] and Terentev et al. [18].
In agriculture, field spectroscopic methods have been applied to different kinds of crops, e.g., for early detection of various diseases in vineyards by Junges et al. [19] and Nguyen et al. [20] and in tomato fields by Cen et al. [21]. Spectroscopic techniques have been also applied to chestnut orchards; e.g., Pádua et al. [22] used a UAV-mounted multispectral sensor to determine tree health status. While no chestnut gall wasp research to date has used an optical sensor for detection purposes, studies have been conducted of distribution patterns at regional and plot scale [23,24], leaf yellowing [25], and pest impact on crown and branch architecture [11,26].
At the leaf level, classification, and discriminant analysis (DA) methods based on the visible (VIS), near infrared (NIR), and short-wave infrared (SWIR) spectra have been used to identify diseased and healthy plants. Frequently used algorithms for DA based on hyperspectral data include partial least squares (PLS) [27,28,29], when the number of variables is high, and also machine learning algorithms such as random forest (RF) [27] and support vector machines (SVM) [30].
Our objectives, based on using a field hyperspectral spectroradiometer to measure leaf reflectance in two chestnut orchards where the Asian chestnut gall wasp has been detected, were: first, to obtain a characteristic spectral signature for different gall wasp infestation levels, and, second, to develop PLS-DA and RF models that distinguish between different degrees of infestation.

2. Materials and Methods

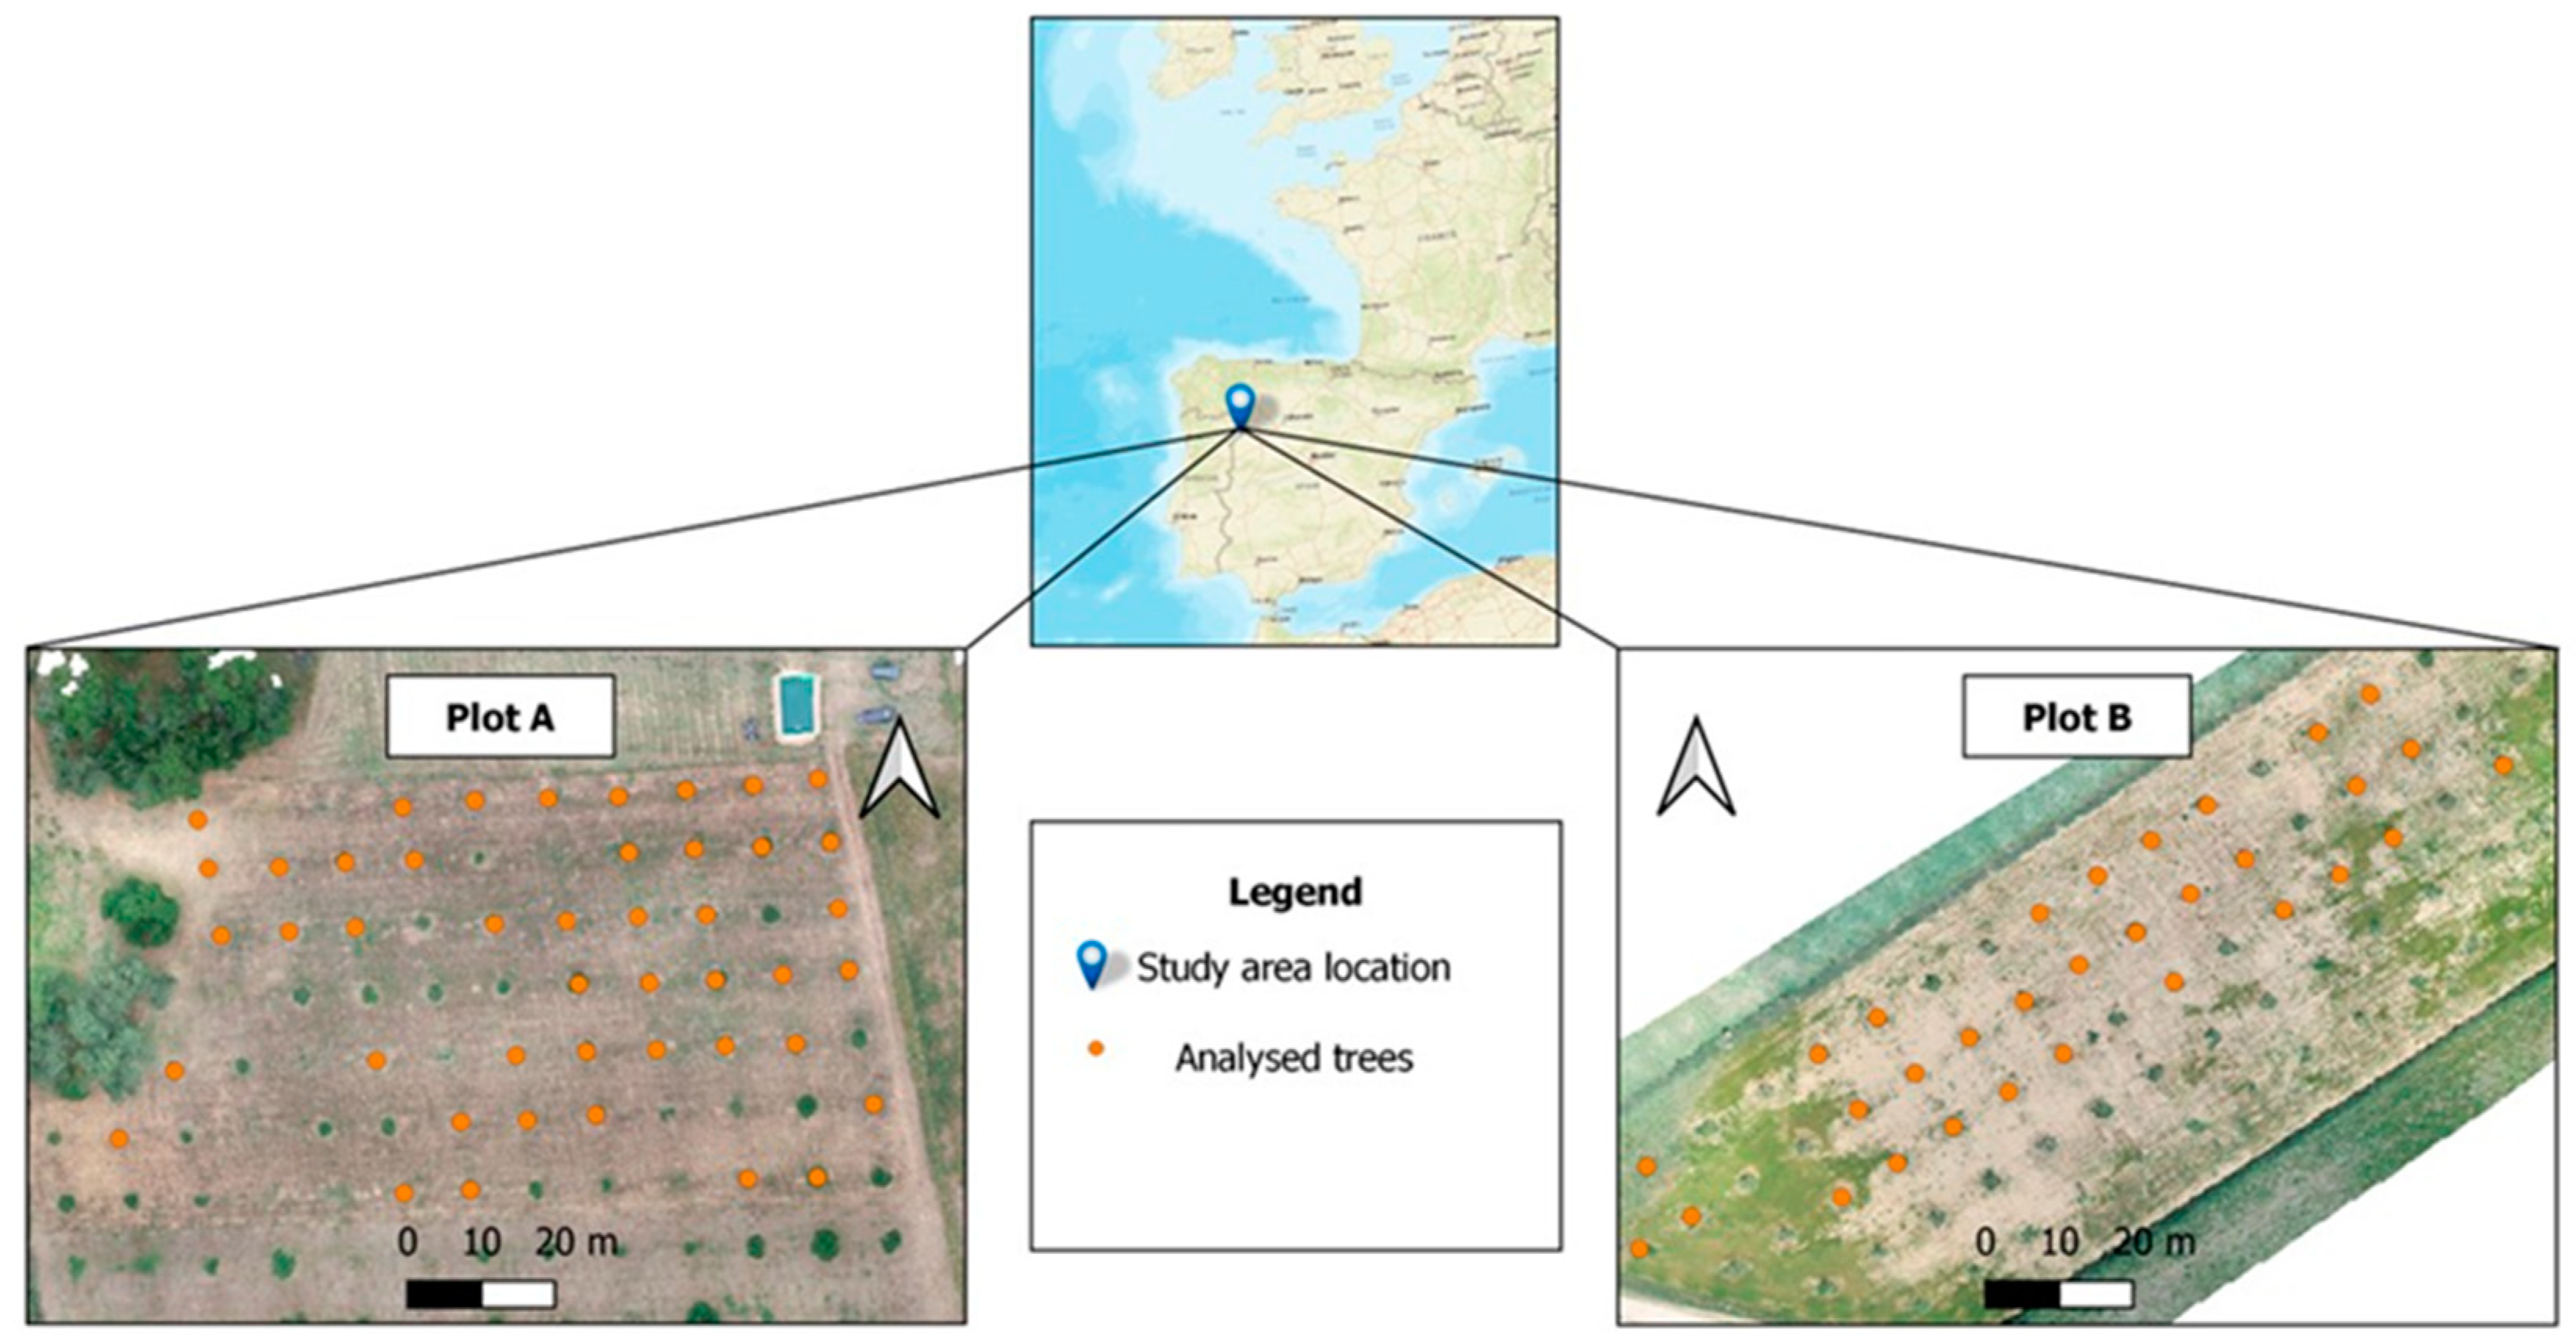
2.1. Study Area and Sampling Design

Our research was carried out in two chestnut (C. sativa Mill.) orchards located in Robledo de las Traviesas in El Bierzo (Castilla y Leon region, north-western Spain). While the main chestnut variety in both orchards is the same (Parede roja), irrigation systems and grid spacing differ between the studied plots. Figure 1 shows the location of the plots and Table 1 summarizes their main characteristics.

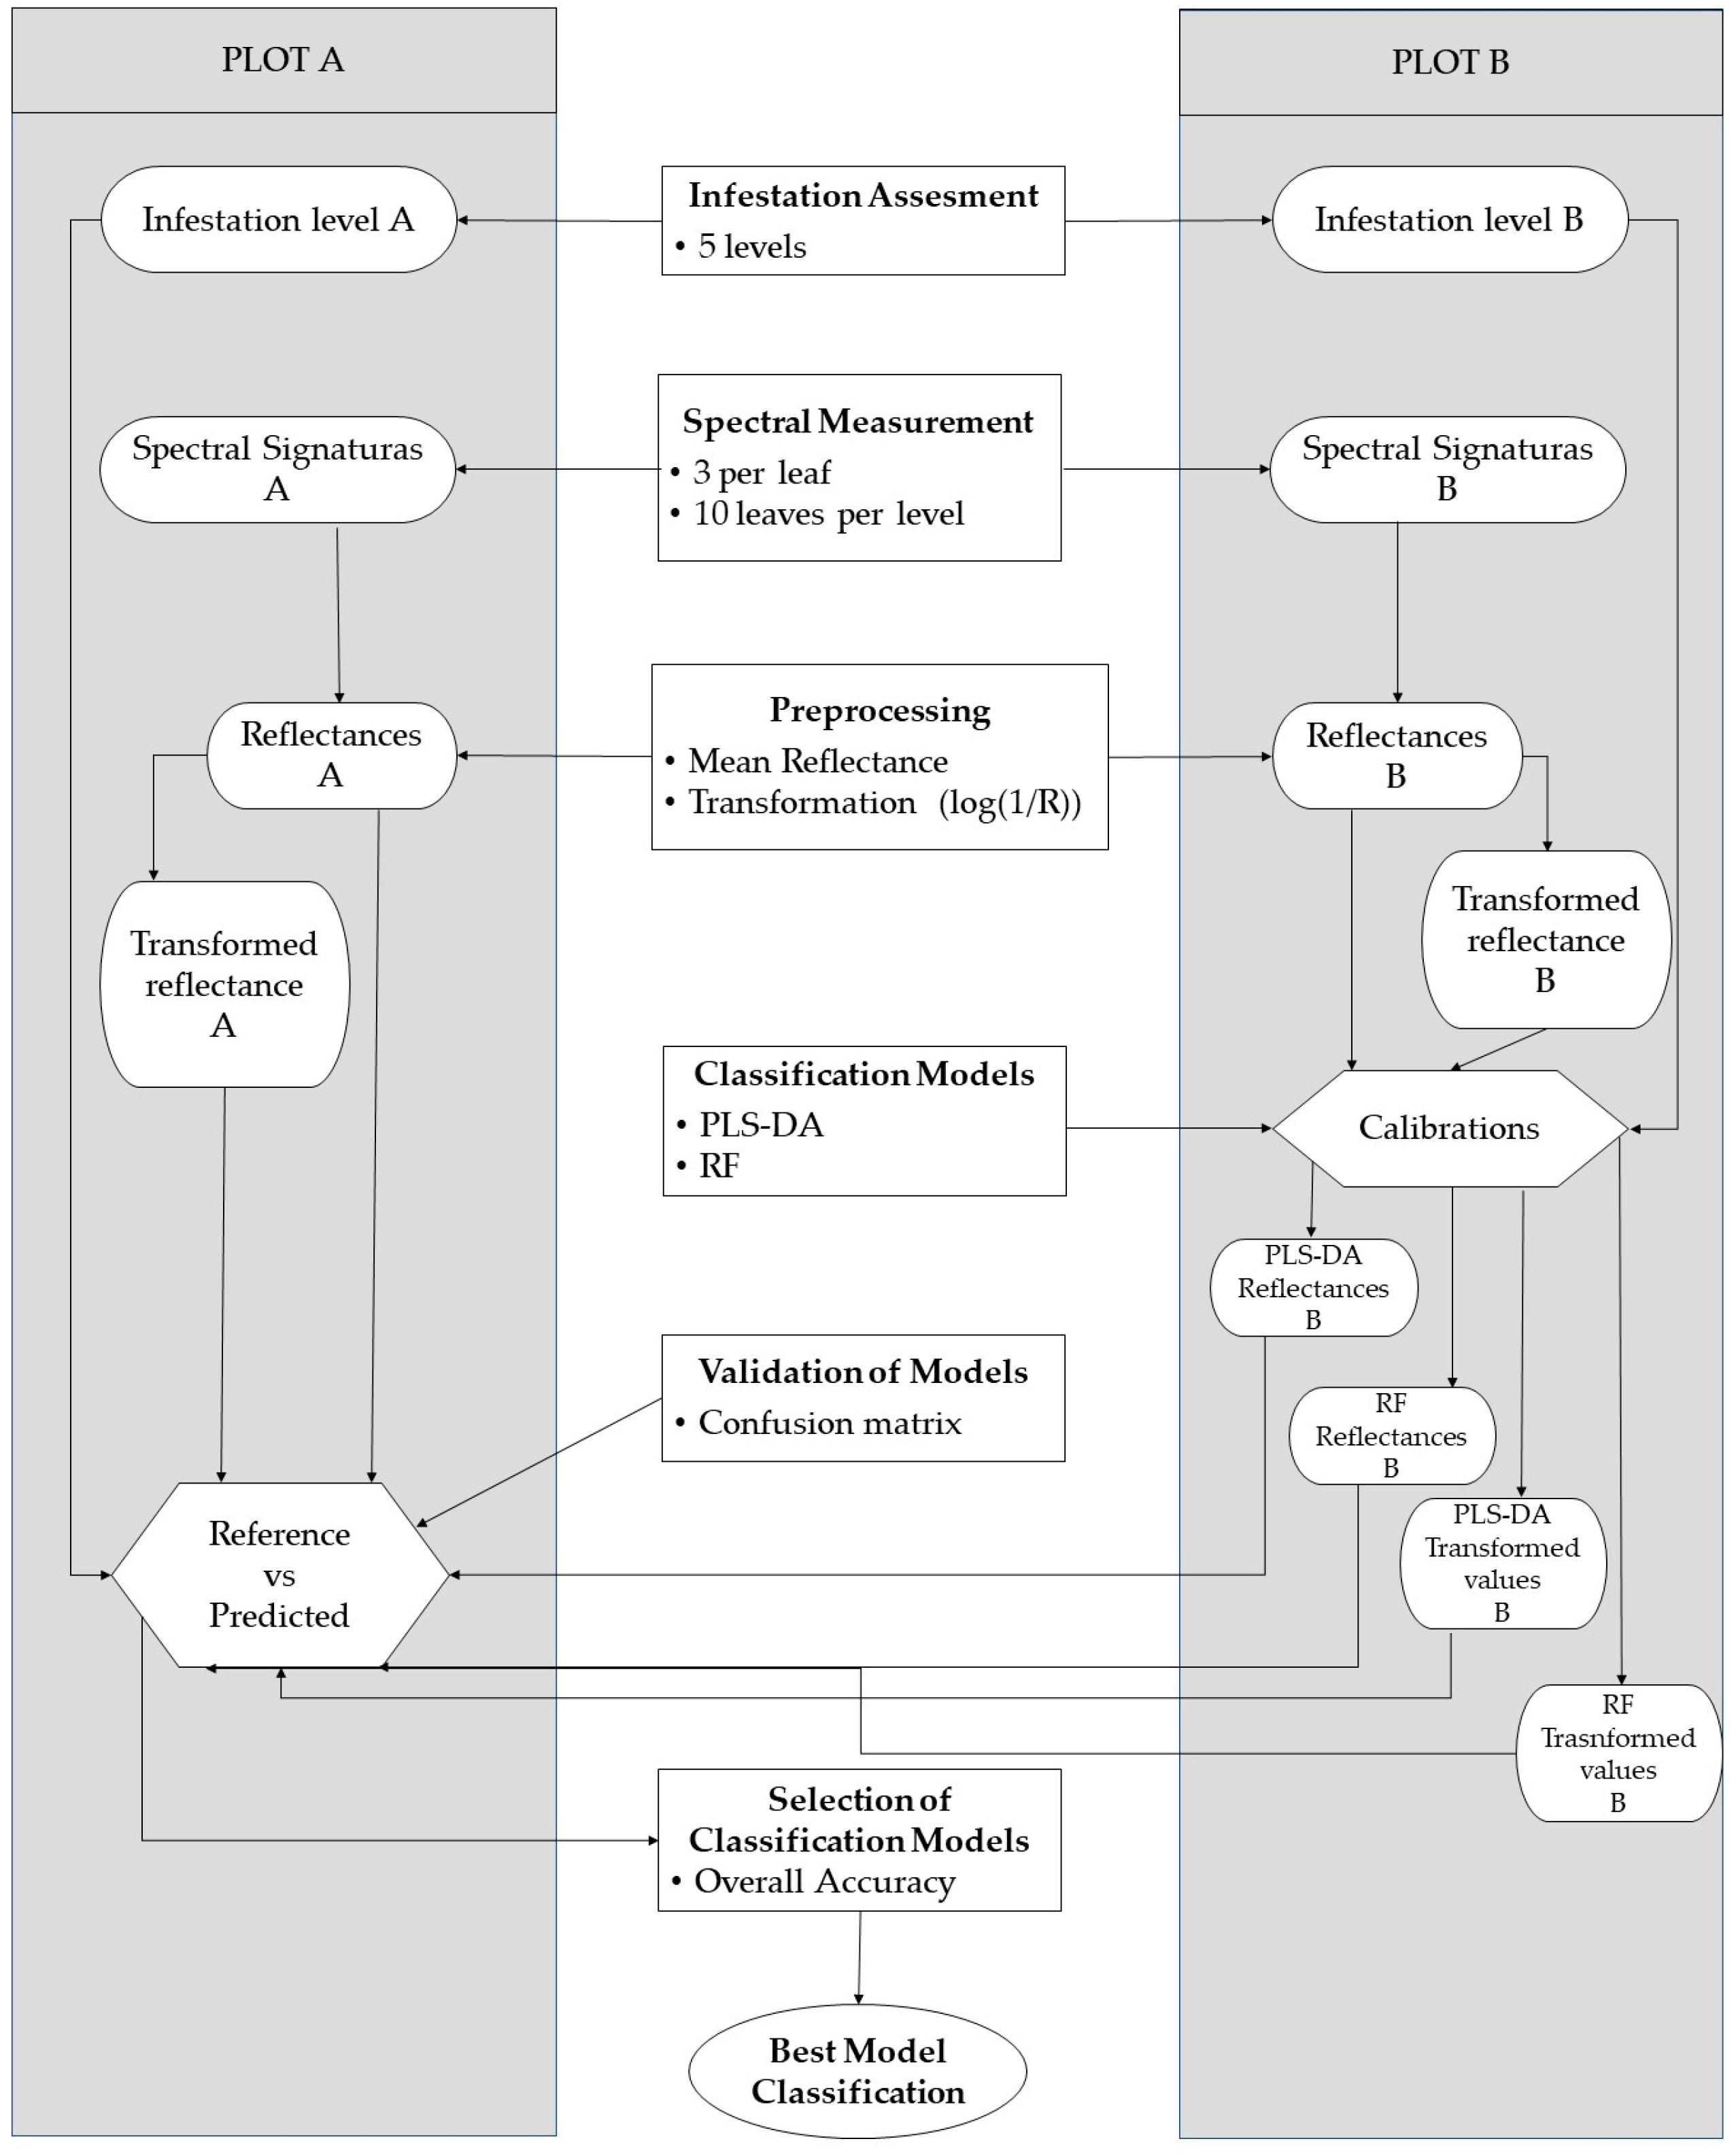
2.2. Experimental Workflow

Figure 2 depicts workflow steps for the proposed methodology. Fieldwork consisted of visually assessing chestnut gall wasp infestation and making spectral measurements using a field spectroradiometer. Preprocessing involved transforming mean reflectance values. Classification models were then fitted so as to identify the best classifier.

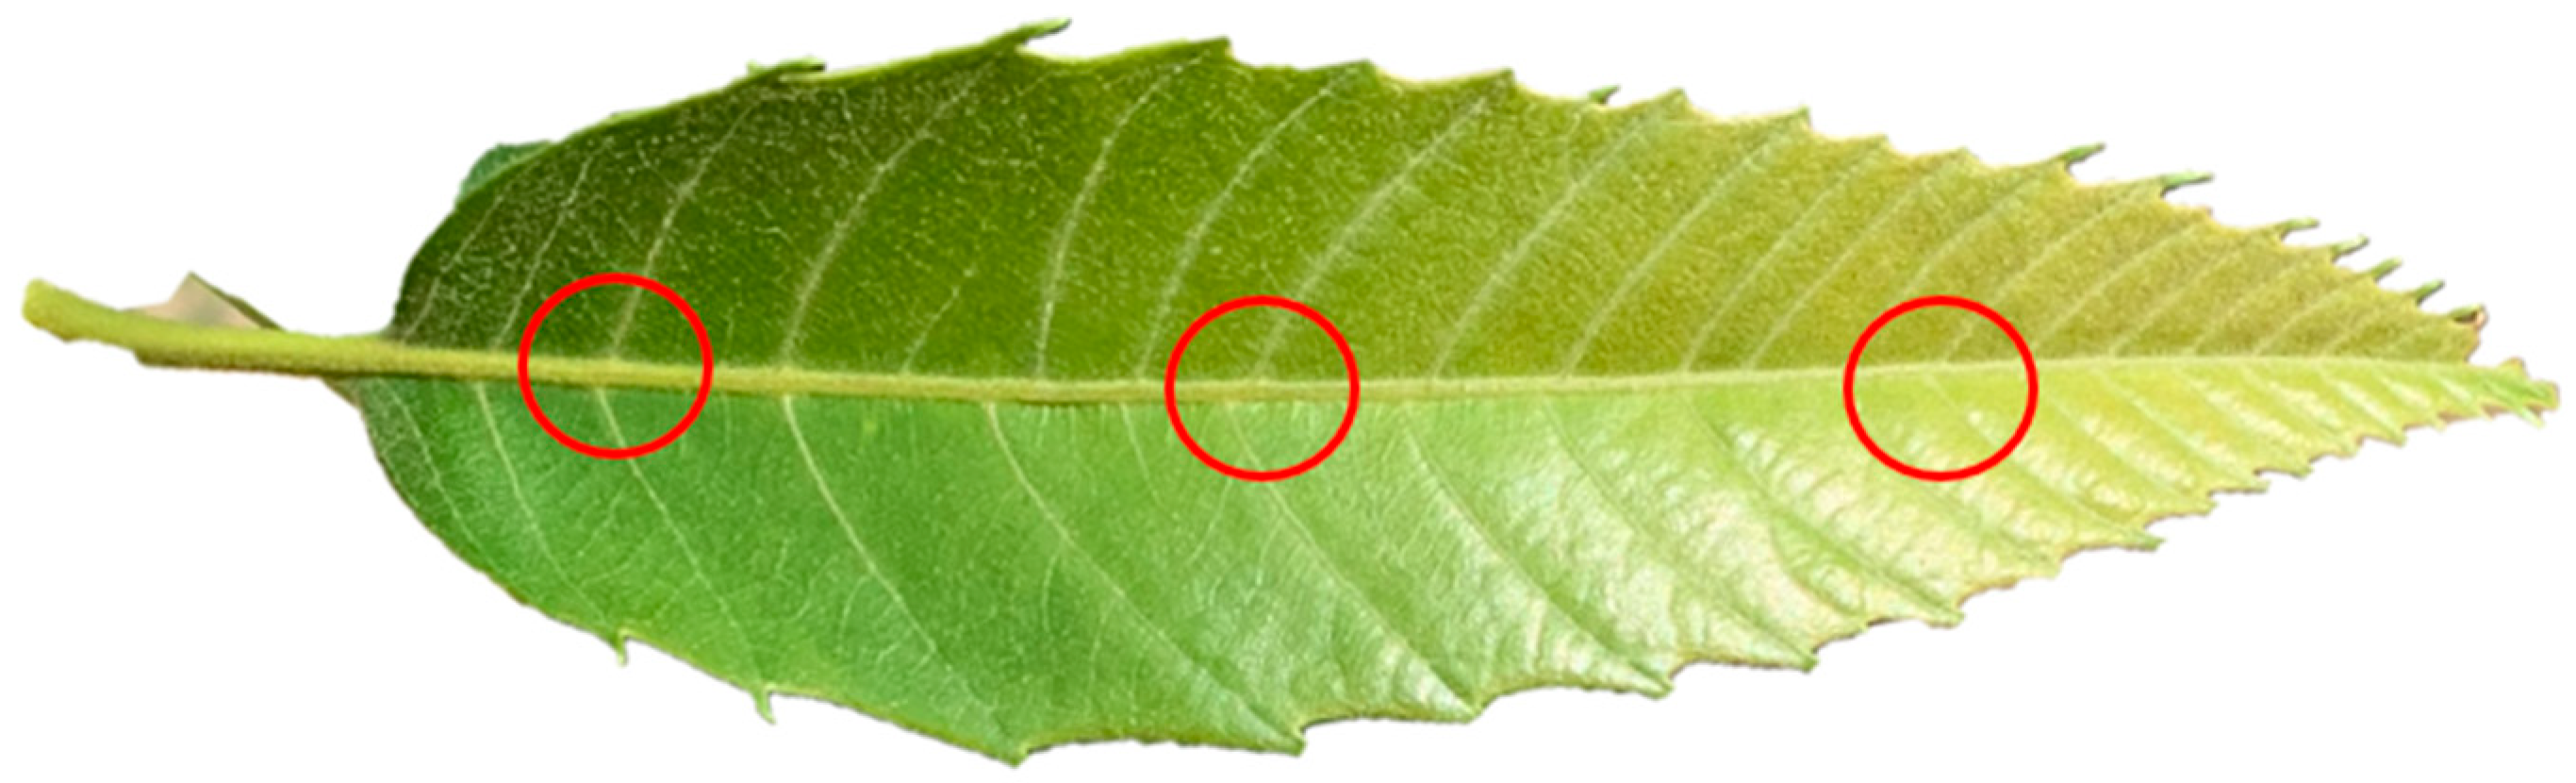
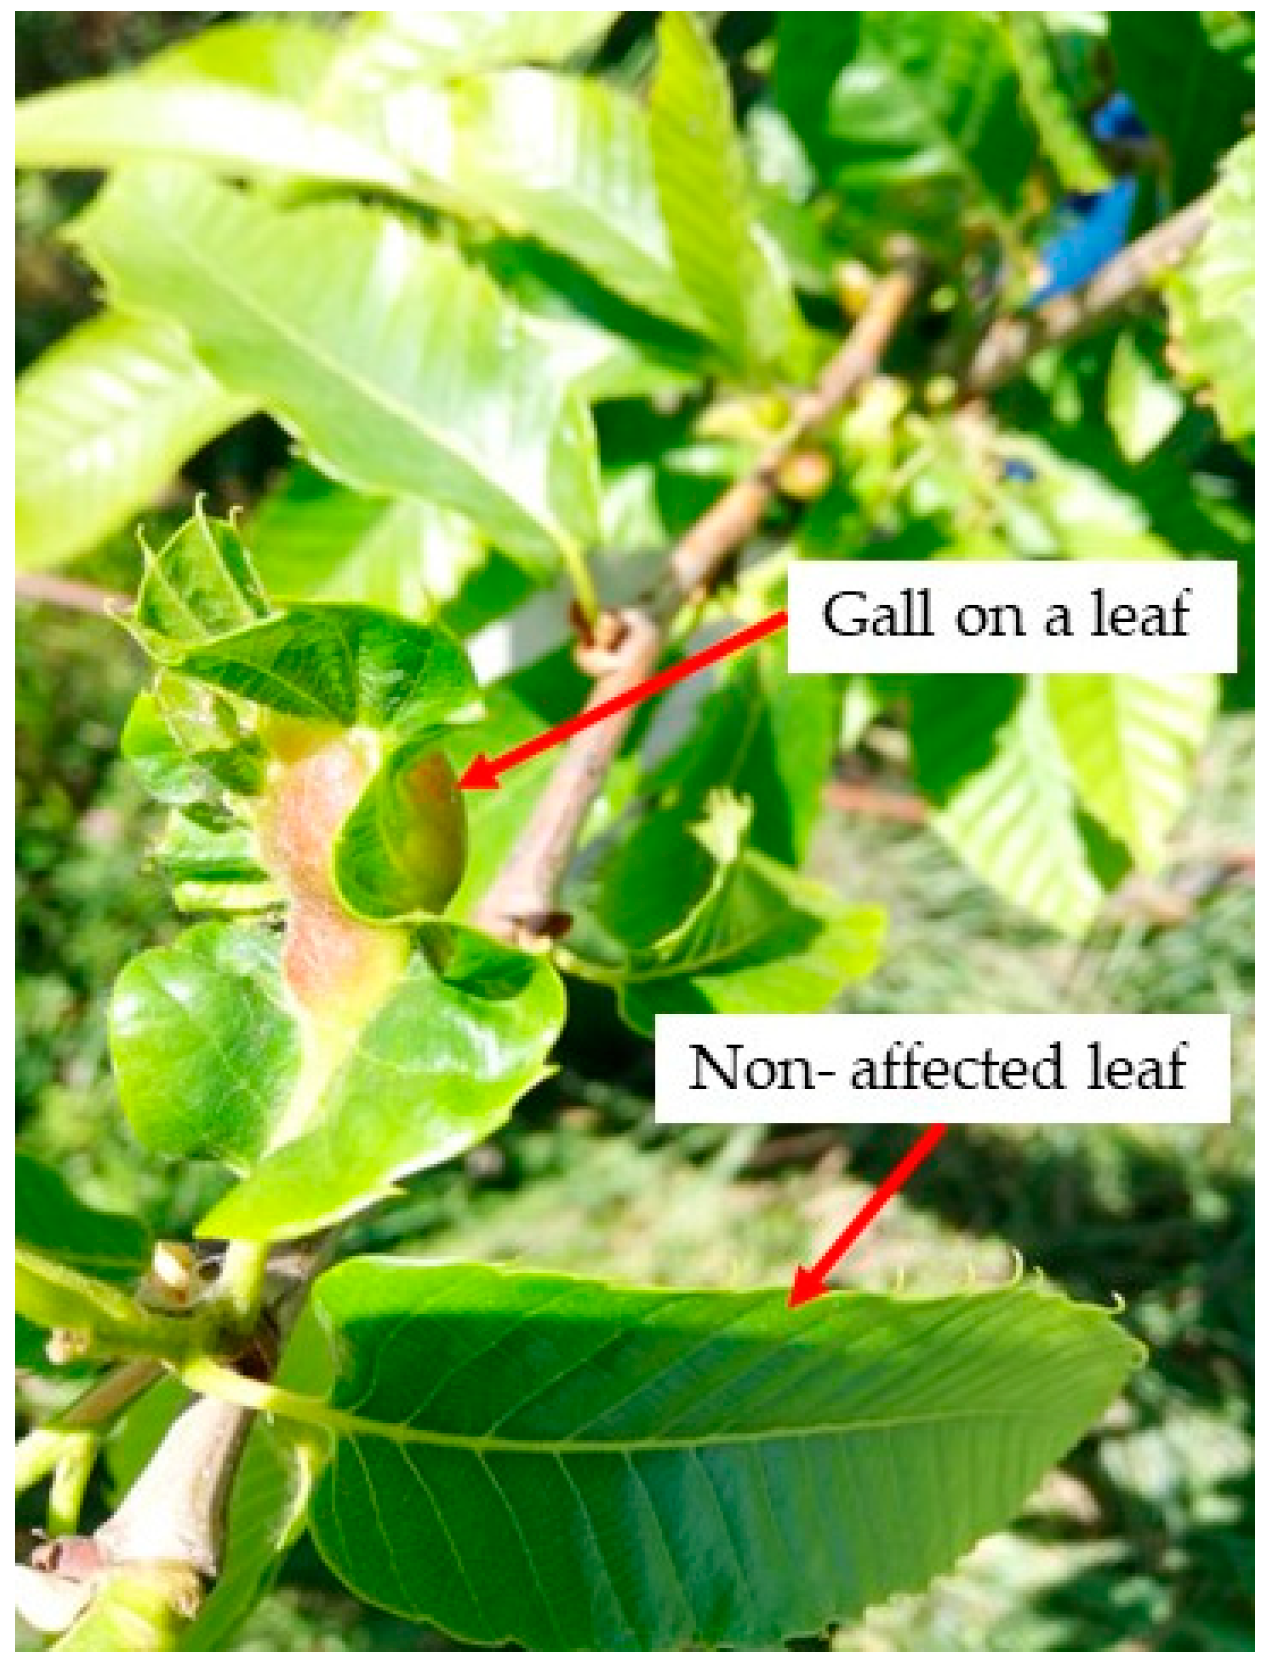
2.3. Assessing Gall Wasp Infestation Levels

To assess gall wasp impact, following Gehring et al. [11], we analysed how the pest affected branch architecture. In July 2022, for 83 trees, 4 branches each were selected for analysis based on their orientation: 211 branches from plot A and 123 branches from plot B (total 334 branches). Only shoots that had grown during 2022 were analysed. Measurements made were the annual growth of each branch, the number of buds, the number of buds with galls, and the number of galls. Ratios were calculated as useful infestation indicators: the number of galls versus the number of buds [6], and the number of affected buds versus the total number of buds [26,31]. The ratio between affected and non-affected buds for each branch was also calculated as a percentage, as follows:
Percentage infestation = (NAb/Nb) × 100
where NAb is the number of affected buds and Nb is the total number of buds. Based on this indicator and on Gehring et al. [26], five infestation levels were defined, as described in Table 2, where health status of the samples from each plot is also summarized.

2.4. Field Spectroradiometer Measurements

Hyperspectral measurements of the energy reflected by leaves were made using an ASD FieldSpec 4 spectroradiometer (Analytical Spectral Devices Inc., Boulder, CO, USA), a hyperspectral sensor (with a 1.5 m fibre optic cable and 25° field-of-view) that captures information along the electromagnetic spectrum from 350 nm to 2500 nm at 1 nm intervals. A contact probe with a halogen bulb was also used.
A measurement protocol was defined, based on spectroradiometer user guide recommendations [32]. First, the sensor was calibrated using a white reference panel that reflected 99% of the incoming energy. Second, a white reflectance reference value was obtained for each leaf before measurement. Third, individual leaves were measured using exactly the same procedure (Figure 3): starting near the petiole and gradually moving to the apex, three measurements were made on the beam to obtain a representative reflectance value for each leaf.
It was decided to work with two different plots to adjust and validate the classification models. Furthermore, to ensure a health status that reflected the whole sample, selected from all the analysed branches for each chestnut gall wasp infestation level were at least 10 leaves, resulting in 102 samples for spectral measurement. By this way as it is possible to see in Table 3, the training set consists of 49 measurements from plot B, while 52 leaves were measured in plot A to form the validation data set.

2.5. Preprocessing

Using Unscramble (CAMO Analytics, Montclair, NJ, USA), principal component analysis (PCA) was applied to identify spectral bands with high variability rates and to detect outliers. Since all measurements were made in the same conditions, no transformation was necessary. However, since reflectance transformations can improve the detection of changes in spectral traits in response to stress or disease [33,34], the reflectance values were transformed, as follows:
Transformed reflectance = log(1/reflectance)
Leaf measurements were grouped according to the absence and presence of gall wasp infestation so as to obtain a characteristic spectral signature for each group. Grouping was performed for both reflectance and transformed values. The 350–450 nm wavelength was excluded because of the associated noise. Following Pithan et al. [29], and taking gall-free leaves as a reference, the reflectance and transformed spectral signatures were normalized. This transformation, which did not change spectral values, enabled detection of wavelengths where infestation differences were greatest.

2.6. Classification (Training and Validation)

Several models (in which reflectance and transformed values operated as predictor variables) were constructed to classify infestation levels and distinguish between gall absence and presence in leaves. We used two classification algorithms, namely, PLS-DA, optimal when the number of variables is greater than the number of records [35], and RF, a widely used machine learning approach. The complete classification procedure, developed in R language (v.4.2.1, R Core Team 2022), used the caret and randomForest packages.
To train the models, we defined three spectral datasets (Table 4): the full electromagnetic spectrum, four wavelengths chosen on the basis of normalized reflectance and transformed values that allowed two further variables sets to be obtained, and a dataset based on establishing a 10 nm interval around the average interval value for each of the four selected wavelengths.
Different samples were used for the training and validation sets, composed of 49 spectral measurements obtained from plot B plus 50 spectral measurements obtained from plot A, respectively. In the validation procedure, overall classification accuracy was calculated as follows:
Overall accuracy = (TP + TN)/(TP + TN + FP + FN)
where TP is the number of true positives, TN is the number of true negatives, FP is the number of false positives, and FN is the number of false negatives.

3. Results

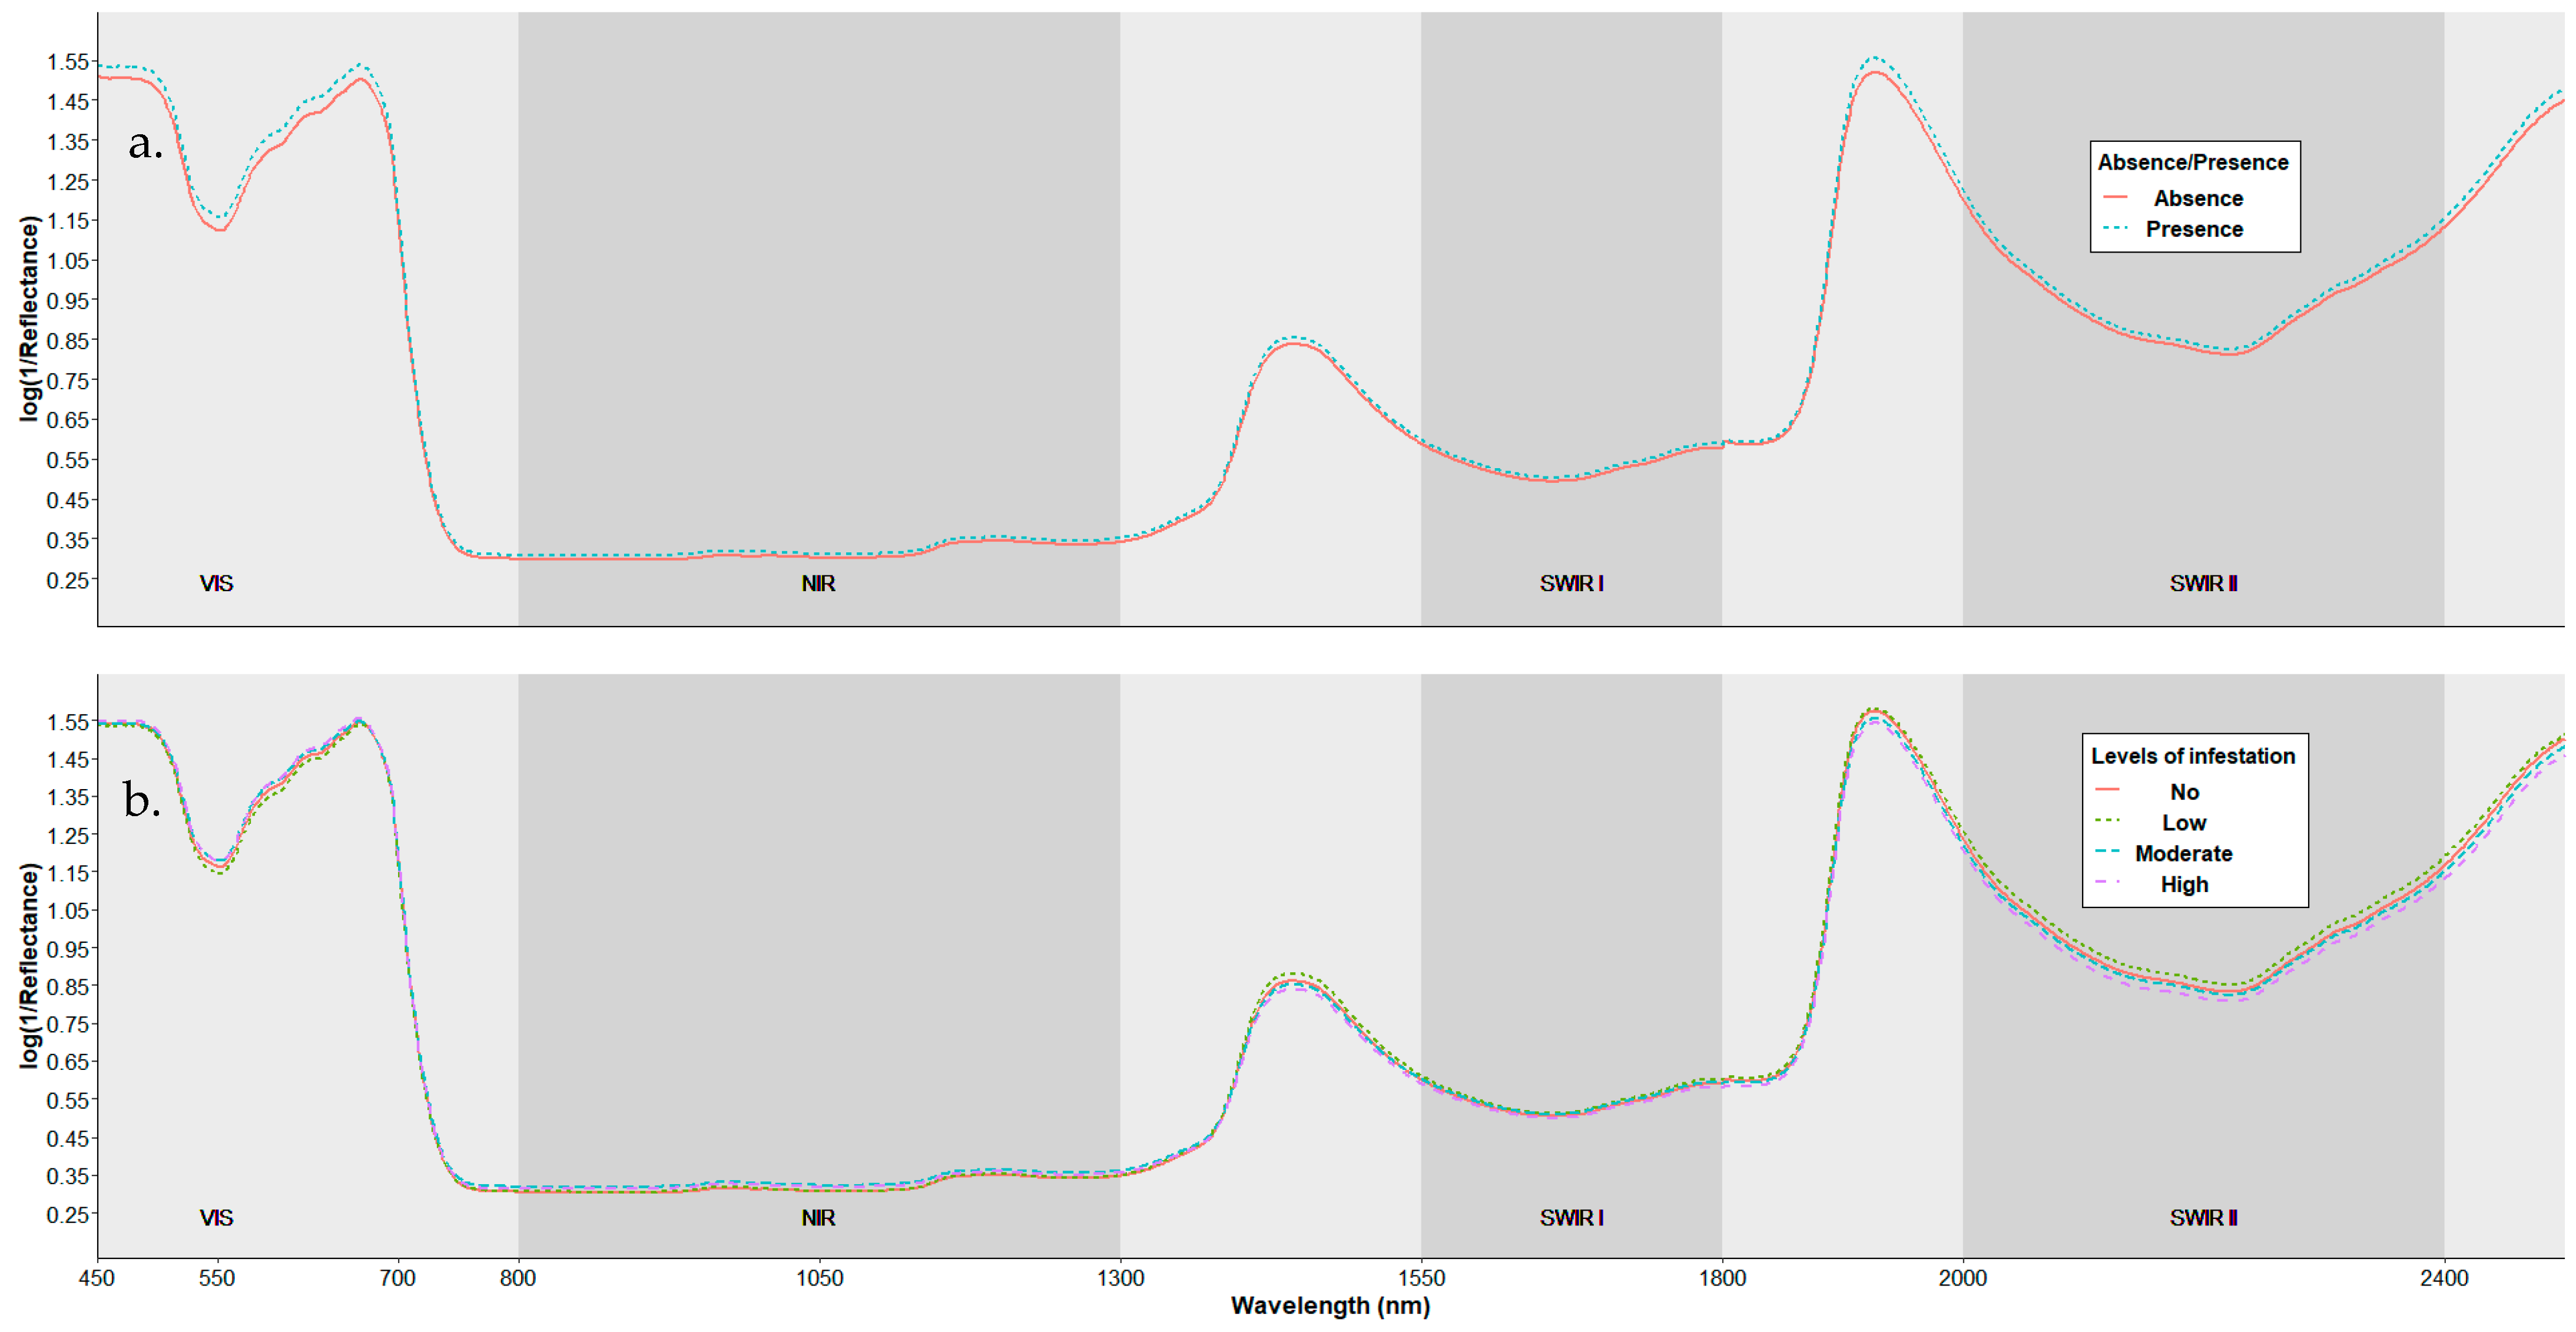
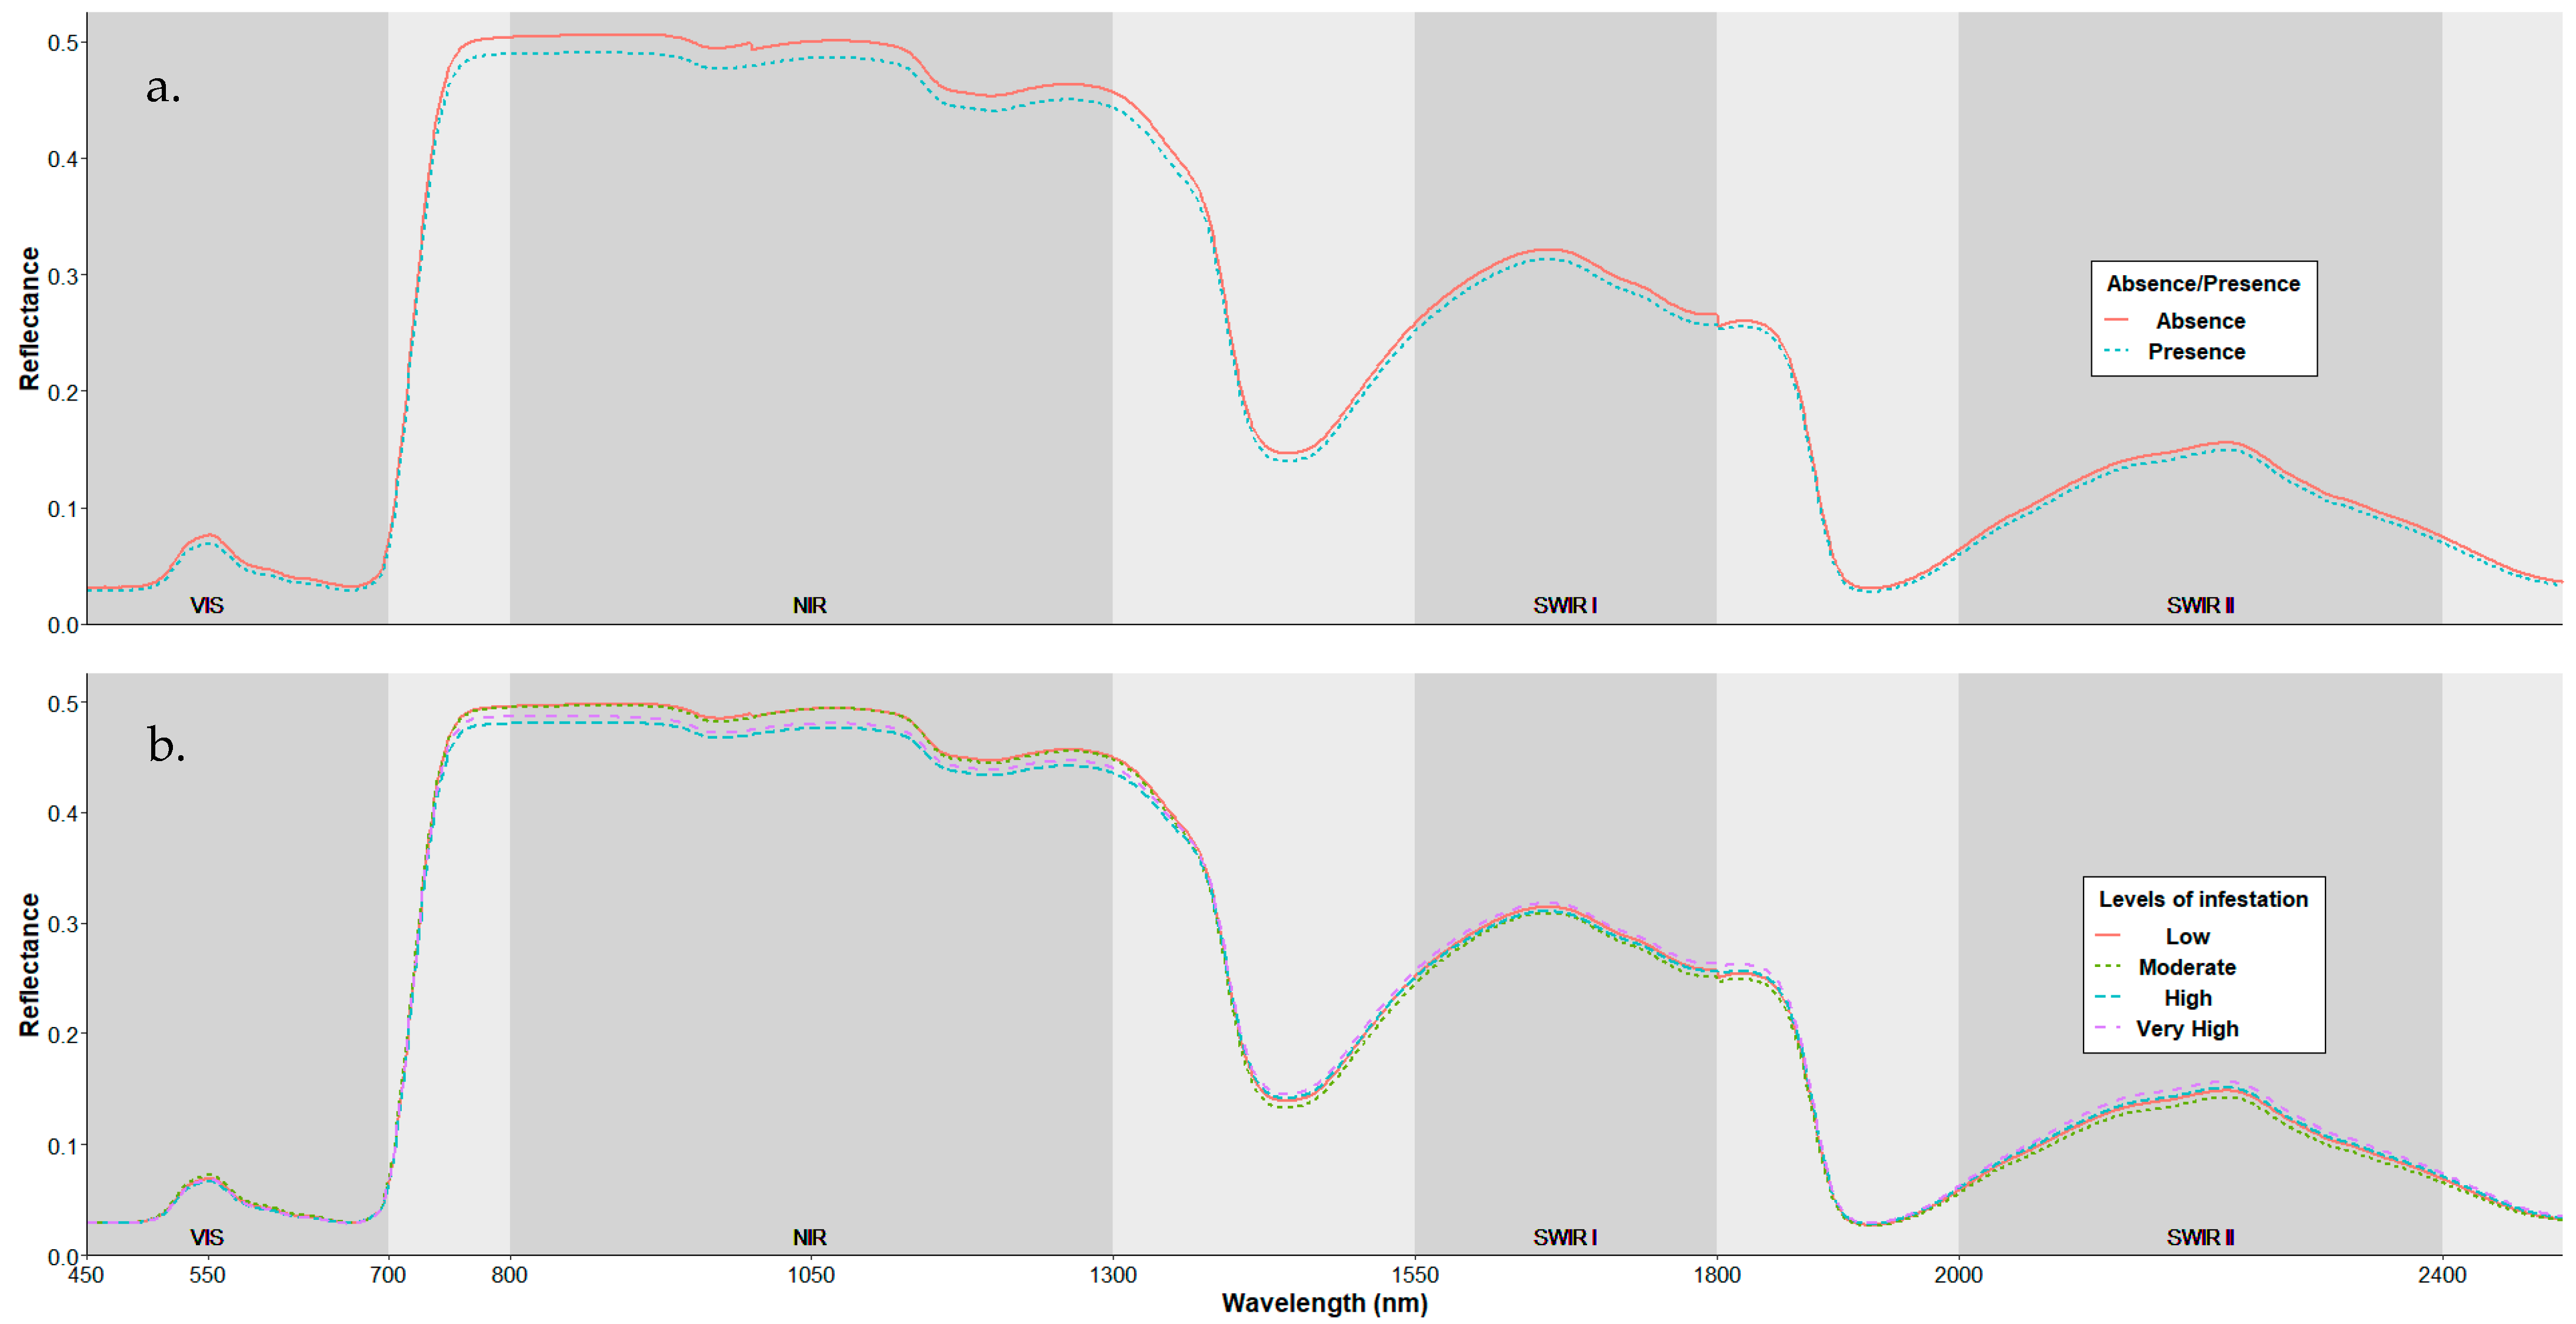
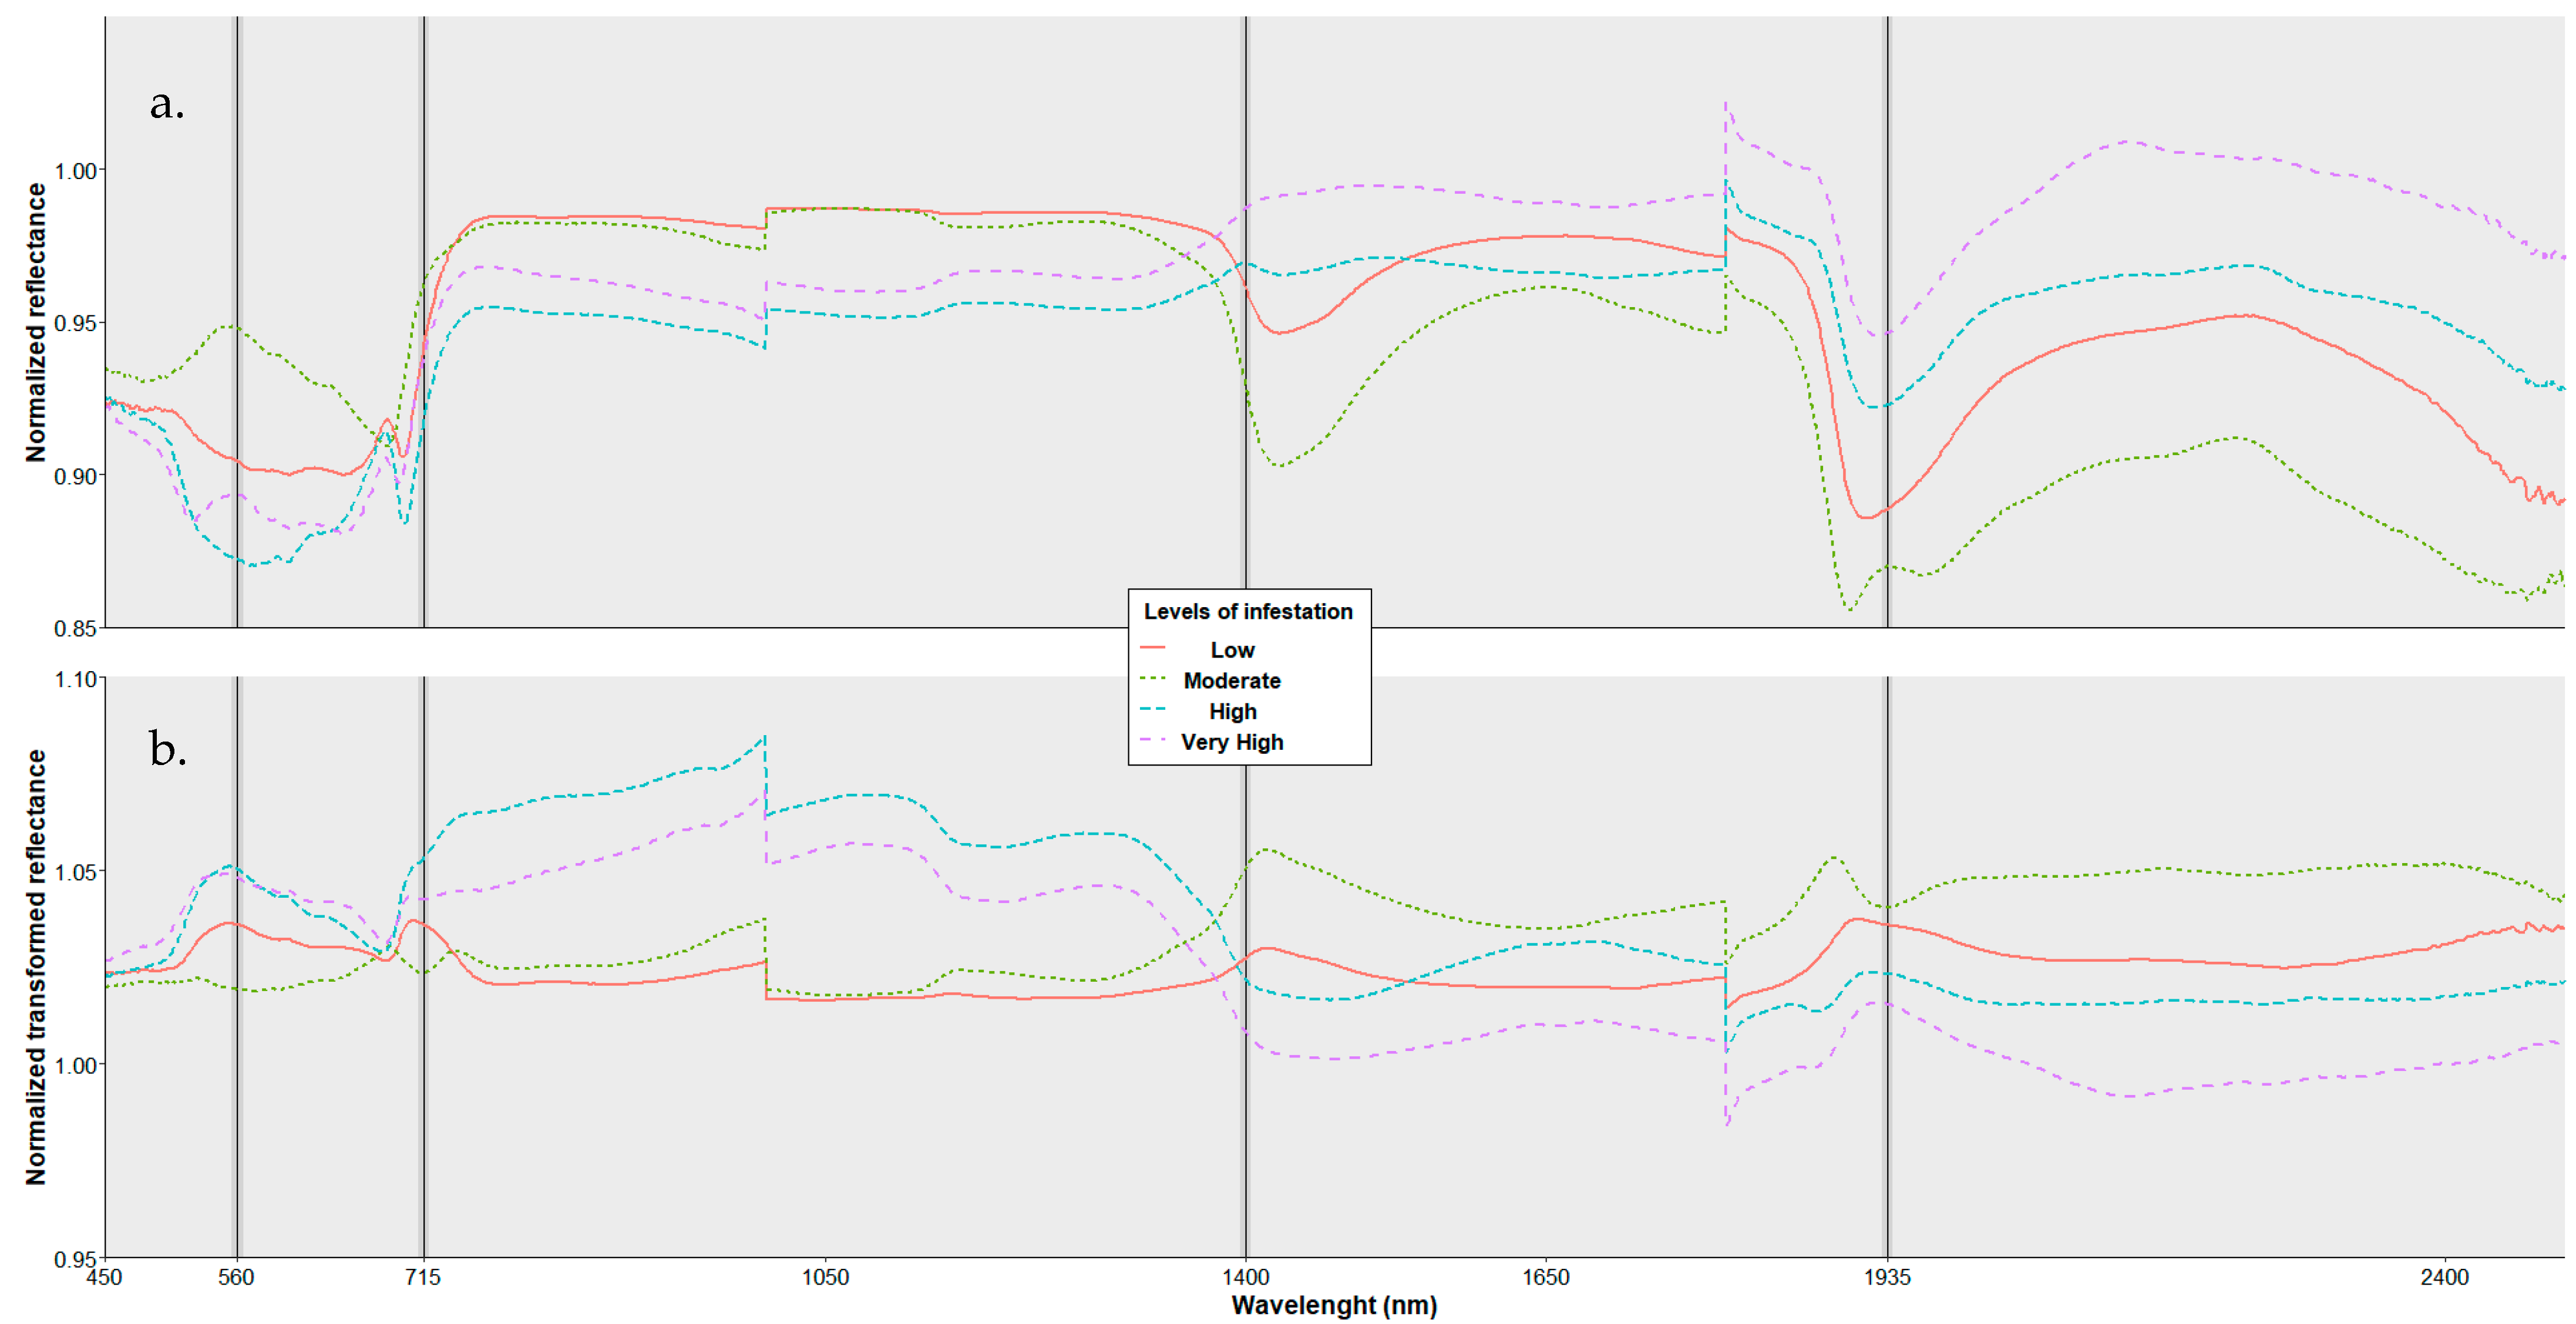
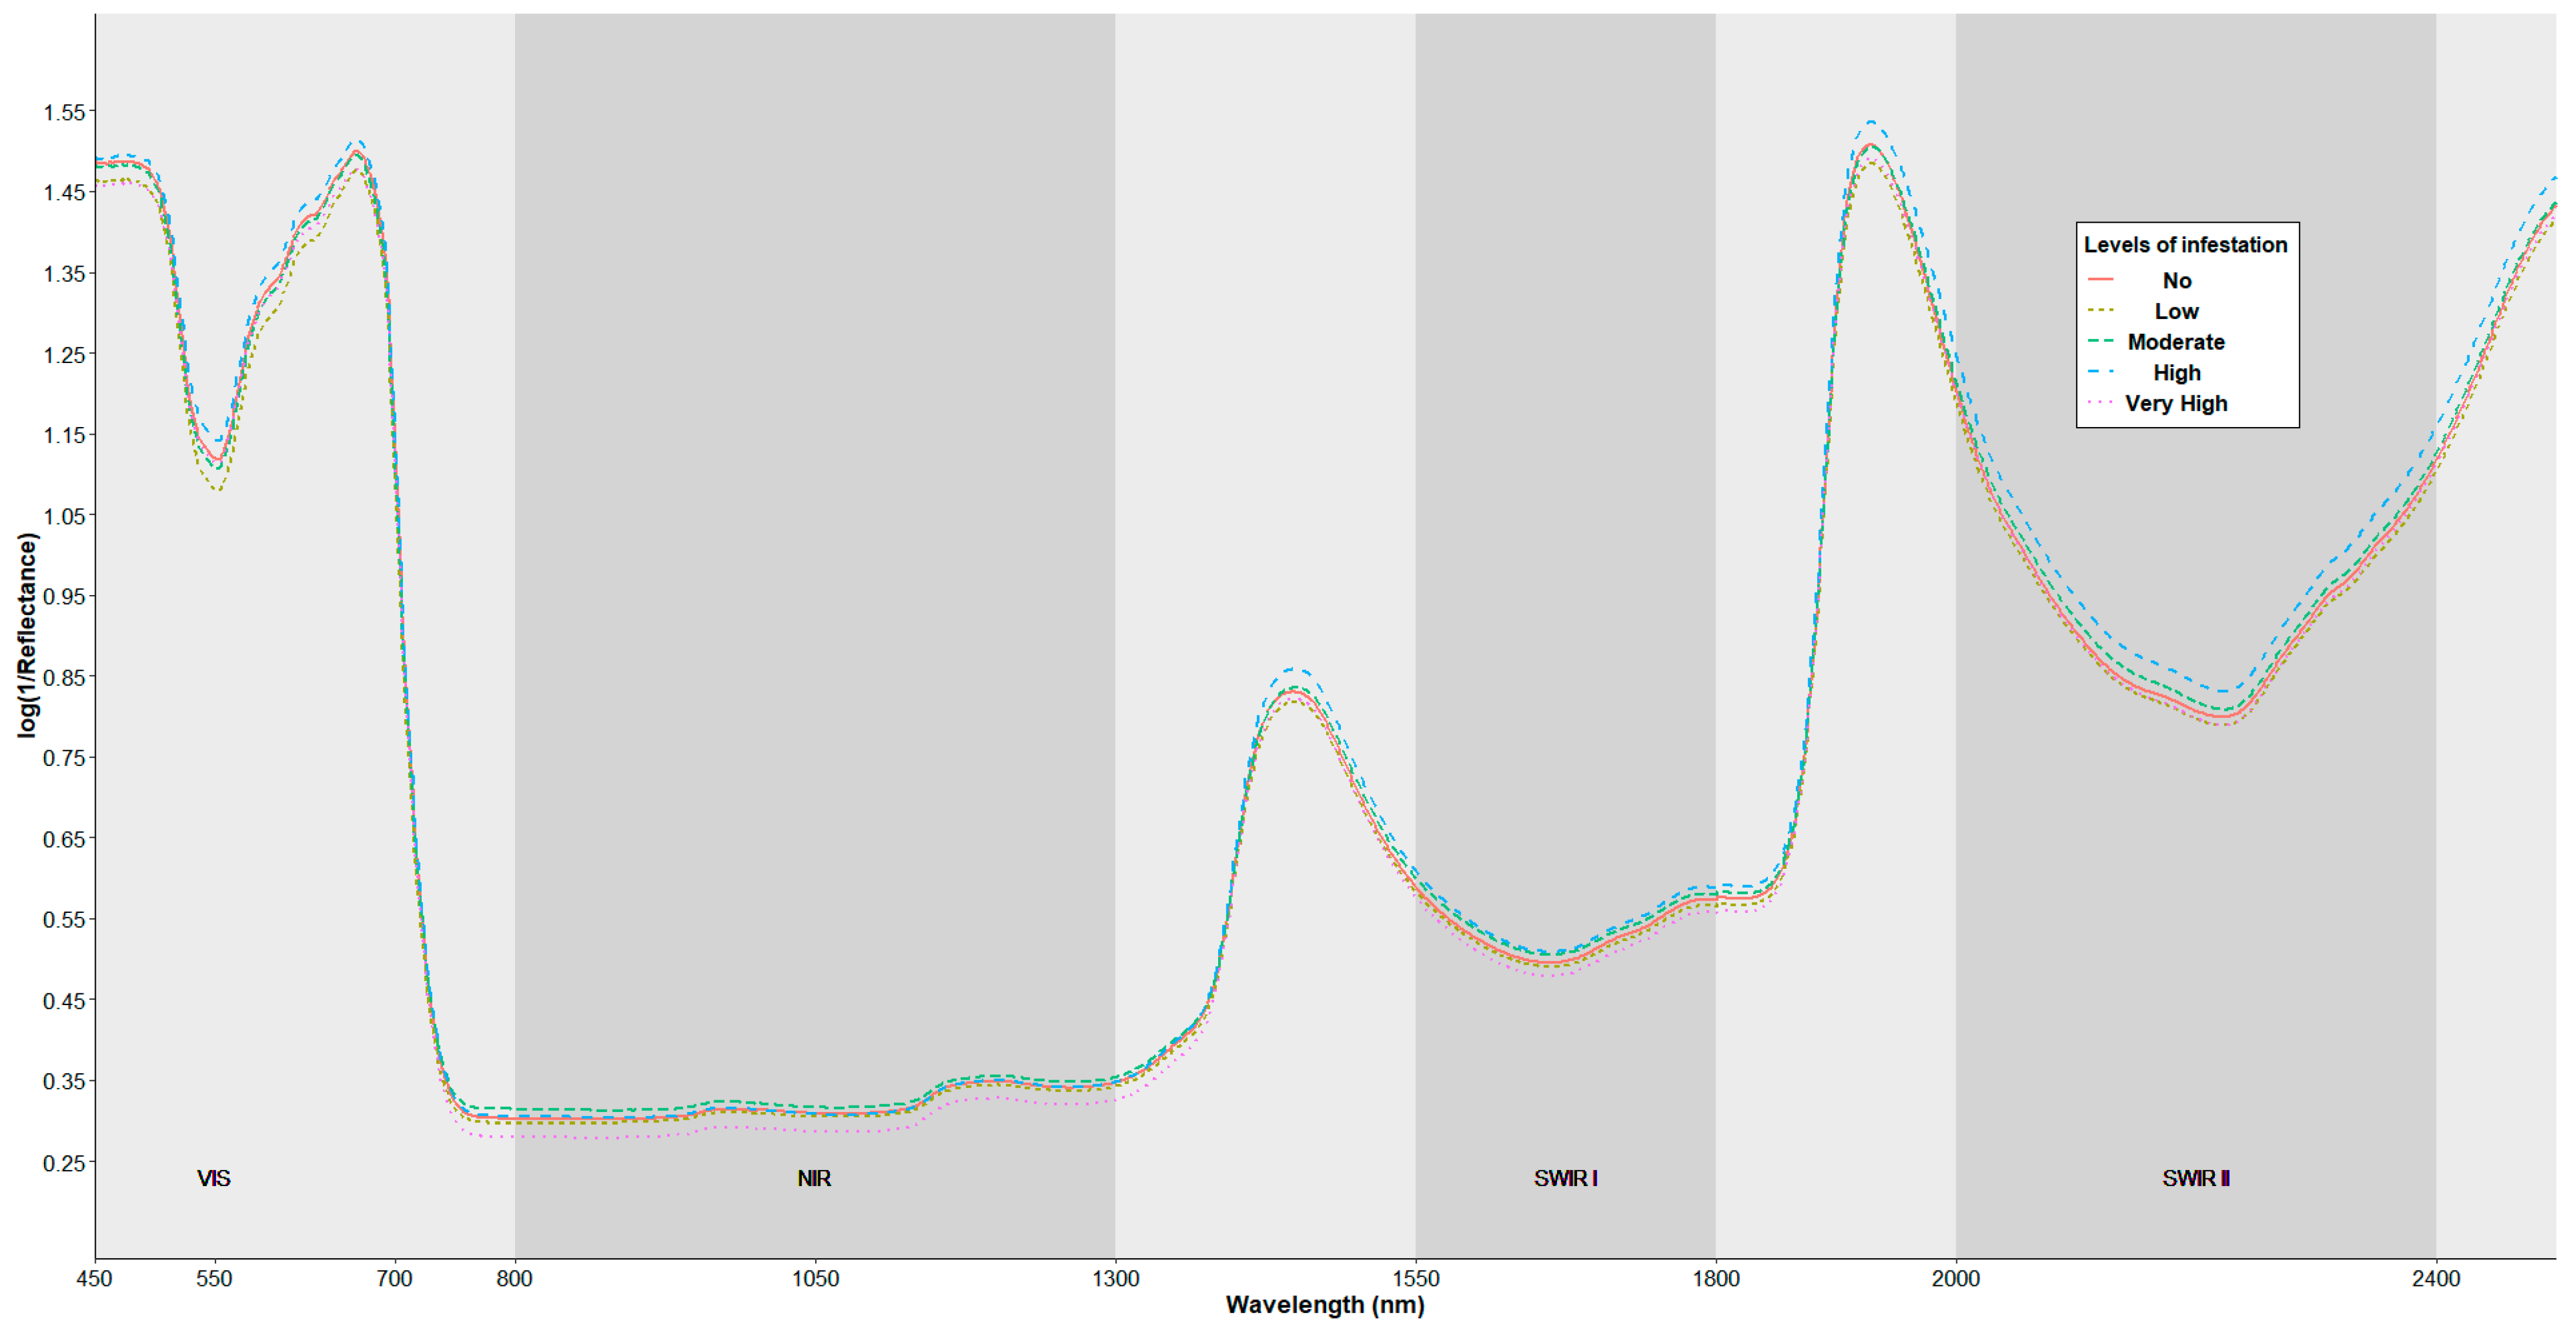
3.1. Spectral Characterization

Calculated from the reflectance measurements, taking the sample average for each infestation level, were characteristic spectral signatures, distinguishing between gall absence and presence and between different levels of infestation (Figure 4).
The average signature associated with gall absence and presence revealed differences in some electromagnetic spectrum regions. Appreciable differences appeared in the green peak at around 560 nm (Figure 4a), increased to 750 nm (just before the NIR plateau), remained constant in the NIR band until 1300 nm, and became visible again at 1600 and 2200 nm in the SWIR band. A p-value lower that 0.05 (Mann–Whitney test) confirmed that this difference in spectral traits was significant. Differences were also evident between the five infestation levels (Figure 4b) but were not confirmed to be statistically significant.
Figure 5 shows spectral characterization using transformed values. Differences were smaller, mainly in the NIR band, but were confirmed when gall absence and presence were analysed.

3.2. Variable Selection

Figure 6 shows characteristic spectral traits for the reflectance values (Figure 6a) and the transformed values (Figure 6b) associated with each infestation level once normalized to the spectral features of infestation-free samples, i.e., for gall-free leaves. Visual inspection of the normalized curves identified four wavelengths (indicated by black lines in Figure 6) as potential variables for the classification models. In the VIS region around the green peak (560 nm), differences between the spectral curves are evident, and become distinguishable again just before the NIR (715 nm), while in the SWIR region, two wavelengths (1440 and 1935 nm) show differences, probably due to changes in water content.

3.3. Classification Results

Based on the significant differences detected for the characteristic spectral signatures, classification was performed, initially only for the infestation absence and presence classes. PLS-DA and RF models were fitted using the three different datasets (the entire electromagnetic spectrum, four ±10 nm intervals, four wavelengths) and for both reflectance (raw and transformed) values. Table 5 reports the results, including overall accuracy percentages. The models fitted with transformed values appeared to yield better results than the models fitted with reflectance values. The RF models performed better than the PLS-DA models as the size of the variables decreased. The best model, with overall accuracy of 69.23% (for a 95% confidence interval), was ultimately the RF model based on reflectance transformed values and four wavelengths (560 nm, 680 nm, 1400 nm, and 1935 nm).
This RF classifier and the corresponding variables were used to discriminate between the five infestation levels (none, low, moderate, high, very high). The confusion matrix in Table 6 shows that overall classifier accuracy regarding infestation levels was 26.92%, with the high confusion between the infestation levels possibly due to similarities. Figure 7, which depicts the transformed signatures for each infestation level, shows that only the high infestation level seems to be visually different, but the fact that the difference is not statistically significant explains the low accuracy value.

4. Discussion

We investigated changes in reflectance and transformed values for chestnut tree leaves caused by chestnut gall wasp infestation, classifying the different infestation levels using hyperspectral field spectroscopy. This technique has previously been used to analyse other issues, such as disease and nutritional deficiency, that alter the surface of leaves. The field spectroradiometer could be used as a non-destructive means of monitoring and assessing pest infestation and could aid the selection of other sensors, bearing in mind spectral resolution values.
Our leaf hyperspectral sampling methodology was based on the use of a contact probe, which avoids the need to apply detrending functions or other filtering transformations, as described elsewhere [21,36]. The only transformation performed in our case, following Gitelson et al. [34], was to apply Equation (2), as this could help to better distinguish between different infestation levels.
Several models were fitted to distinguish between leaves from branches with and without galls. The models achieved satisfactory accuracy values that coincided with visually observed differences (Figure 3 and Figure 4) and statistically significant differences between reflectance and transformed spectral values. The best performing model (overall accuracy 69.23%) was an RF model based on transformed values and four wavelengths (560 nm, 680 nm, 1400 nm, and 1935 nm), with transformed traits enhancing signature differences. Nguyen et al. [20] achieved 95.30% overall accuracy in detecting grapevine leaves affected by a virus, and other works [27,37] also obtained better accuracy rates than achieved in our research. Although their study was based on the use of hyperspectral cameras and overall leaf values, the fact that Cen et al. [21] obtained high accuracy values (88.6%) in distinguishing between affected and non-affected leaves demonstrates that hyperspectral techniques are capable of discriminating between healthy and diseased leaves.
We also attempted to classify five different infestation levels using characteristic transformed curves as variables in an RF model. The overall accuracy obtained, 26.92%, was to be expected, given that the training and validation samples did not show significant differences.
Hyperspectral leaf measurement information clearly identifies affectation by disease, nutritional deficiency, and water stress [19,28,29]. However, as shown by the error rates in Table 5, the model as fitted was not capable of classifying between five different chestnut gall wasp infestation levels. A possible explanation is that the same branch may have visibly infested leaves and gall-free leaves (see Figure 8). On this basis, and considering the crown and branch infestation pattern, it may be that the infestation classification that we used (following Gehring et al. [26]) was not appropriate for assessing how the gall wasp affects leaf and canopy reflectance.
Spectral sensors have already been used by Pádua et al. [22], and high-resolution satellite imaging is used for other crops, such as the olive [38]. Remote sensing, which undoubtedly has potential for monitoring health status over large areas, is capable of accurate disease detection [39,40,41,42,43]. Therefore, given our results after normalization of the reflectance and transformed values for four wavelengths, we suggest that spectral sensors that capture these wavelengths should be used to scale up research into discriminating between healthy and diseased crops.

5. Conclusions

A field spectroscopy method was used to classify different gall wasp infestation levels in chestnuts, with leaf reflectance transformed values to characterize infestation levels. Both reflectance and transformed values were included as variables in different PLS-DA and RF models designed to distinguish between gall absence and presence, with the best overall accuracy (69.23%) achieved by an RF model fitted with transformed values. Lower overall accuracy (26.92%) was achieved for the classification aimed at distinguishing between five infestation levels ranging from none to very high.
Our findings enable us to conclude the following: the use of transformed reflectance values for the models enhances infestation differences; PLS-DA models work better with large sets of variables; RF models improve as the number of variables decreases; characteristic spectral signatures (raw and transformed reflectance values) can be obtained for different infestation levels; and, finally, gall absence versus presence is detectable, but not more specific differences in infestation levels.
In sum, our findings suggest that field spectroscopy could be a useful non-destructive tool for monitoring Asian chestnut gall wasp infestations. Even if differences are not very great, they could be useful when choosing remote sensors based on their spectral resolution and in upscaling this health monitoring technique.

Author Contributions

Conceptualization, D.P.-O. and J.R.R.-P.; methodology, D.P.-O., F.C.-D. and J.R.R.-P.; software, D.P.-O. and E.S.-A.; formal analysis, D.P.-O. and J.R.R.-P.; investigation, D.P.-O., F.C.-D., E.S.-A., K.B.M.-C. and J.R.R.-P.; writing—original draft preparation, D.P.-O., F.C.-D., K.B.M.-C. and J.R.R.-P.; writing—review and editing, D.P.-O. and J.R.R.-P.; supervision and project administration, J.R.R.-P. All authors have read and agreed to the published version of the manuscript.

Funding

This research received no external funding.

Data Availability Statement

Data sharing not applicable.

Acknowledgments

The authors acknowledge the assistance of Begoña Diez Álvarez and José M. Rodríguez Gómez for providing access to chestnut trees and fieldwork support. Dimas Pereira-Obaya gratefully acknowledges financial support provided by the European Social Fund, Operational Program of Castilla y León and of the Junta de Castilla y León, through the Consejería de Educación (grants for pre-doctoral research 2020).

Conflicts of Interest

The authors declare no conflict of interest. The authors declare that they have no known competing financial interests or personal relationships that could have appeared to influence the work reported in this paper.

References

  1. Conedera, M.; Manetti, M.C.; Giudici, F.; Amorini, E. Distribution and Economic Potential of the Sweet Chestnut (Castanea sativa Mill.) in Europe. Ecol. Mediterr. 2004, 30, 179–193. [Google Scholar] [CrossRef]
  2. FAOSTAT. Available online: https://www.fao.org/faostat/en/#data/QCL (accessed on 30 January 2023).
  3. Biaggi, M.D.; Beccaro, G.; Casey, J.; Riqué, P.H.; Conedera, M.; Gomes-Laranjo, J.; Fulbright, D.W.; Nishio, S.; Serdar, Ü.; Zou, F.; et al. Distribution, Marketing, and Trade. In The Chestnut Handbook; CRC Press: Boca Raton, FL, USA, 2019; ISBN 978-0-429-44560-6. [Google Scholar]
  4. Fernandes, P.; Colavolpe, M.B.; Serrazina, S.; Costa, R.L. European and American Chestnuts: An Overview of the Main Threats and Control Efforts. Front. Plant Sci. 2022, 13, 951844. [Google Scholar] [CrossRef] [PubMed]
  5. Gil-Tapetado, D.; Gomez, J.F.; Cabrero-Sanudo, F.J.; Nieves-Aldrey, J.L. Distribution and Dispersal of the Invasive Asian Chestnut Gall Wasp, Dryocosmus kuriphilus (Hymenoptera: Cynipidae), across the Heterogeneous Landscape of the Iberian Peninsula. Eur. J. Entomol. 2018, 115, 575–586. [Google Scholar] [CrossRef] [Green Version]
  6. Sartor, C.; Dini, F.; Torello Marinoni, D.; Mellano, M.G.; Beccaro, G.L.; Alma, A.; Quacchia, A.; Botta, R. Impact of the Asian Wasp Dryocosmus kuriphilus (Yasumatsu) on Cultivated Chestnut: Yield Loss and Cultivar Susceptibility. Sci. Hortic. 2015, 197, 454–460. [Google Scholar] [CrossRef]
  7. Míguez-Soto, B.; Chamorro, E.M.; López, J.F. TOLERANCIA A LA AVISPA DEL CASTAÑO (DRYOCOSMUS KURIPHILUS) EN VARIEDADES TRADICIONALES DE FRUTO E HÍBRIDOS INTERESPECÍFICOS. 2018. Available online: https://lourizan.xunta.gal/es/transferencias/tolerancia-la-avispa-del-castano-dryocosmus-kuriphilus-envariedades-tradicionales-de (accessed on 21 July 2022).
  8. Nugnes, F.; Gualtieri, L.; Bonsignore, C.P.; Parillo, R.; Annarumma, R.; Griffo, R.; Bernardo, U. Resistance of a Local Ecotype of Castanea sativa to Dryocosmus kuriphilus (Hymenoptera: Cynipidae) in Southern Italy. Forests 2018, 9, 94. [Google Scholar] [CrossRef] [Green Version]
  9. Bombi, P.; Fedi, C.; Zapparoli, M.; Cammarano, M.; Guidolotti, G.; Pallozzi, E.; Gaudet, M.; Mattioni, C.; Cherubini, M.; Beritognolo, I.; et al. Infestation Potential of Dryocosmus kuriphilus Yasumatsu, 1951 (Hymenoptera: Cynipidae) in Different Natural Populations of Castanea sativa Miller: An Experimental Ex Situ Test. Int. J. Pest Manag. 2019, 65, 147–153. [Google Scholar] [CrossRef]
  10. Maltoni, A.; Mariotti, B.; Jacobs, D.; Tani, A. Pruning Methods to Restore Castanea sativa Stands Attacked by Dryocosmus kuriphilus. New For. 2012, 43, 869–885. [Google Scholar] [CrossRef]
  11. Gehring, E.; Bellosi, B.; Quacchia, A.; Conedera, M. Assessing the Impact of Dryocosmus kuriphilus on the Chestnut Tree: Branch Architecture Matters. J. Pest Sci. 2018, 91, 189–202. [Google Scholar] [CrossRef]
  12. Kato, K.; Hijii, N. Effects of Gall Formation by Dryocosmus kuriphilus Yasumatsu (Hym., Cynipidae) on the Growth of Chestnut Trees. J. Appl. Entomol. 1997, 121, 9–15. [Google Scholar] [CrossRef]
  13. Battisti, A.; Benvegnù, I.; Colombari, F.; Haack, R.A. Invasion by the Chestnut Gall Wasp in Italy Causes Significant Yield Loss in Castanea sativa Nut Production. Agric. For. Entomol. 2014, 16, 75–79. [Google Scholar] [CrossRef]
  14. Gehring, E.; Kast, C.; Kilchenmann, V.; Bieri, K.; Gehrig, R.; Pezzatti, G.B.; Conedera, M. Impact of the Asian Chestnut Gall Wasp, Dryocosmus kuriphilus (Hymenoptera, Cynipidae), on the Chestnut Component of Honey in the Southern Swiss Alps. J. Econ. Entomol. 2018, 111, 43–53. [Google Scholar] [CrossRef] [PubMed]
  15. Marcolin, E.; Pividori, M.; Colombari, F.; Manetti, M.C.; Pelleri, F.; Conedera, M.; Gehring, E. Impact of the Asian Gall Wasp Dryocosmus kuriphilus on the Radial Growth of the European Chestnut Castanea sativa. J. Appl. Ecol. 2021, 58, 1212–1224. [Google Scholar] [CrossRef]
  16. Nieves-Aldrey, J.L.; Gil-Tapetado, D.; Gavira, O.; Boyero, J.R.; Polidori, C.; Lombardero, M.J.; Blanco, D.; Rey del castillo, C.; Rodriguez Rojo, P.; Vela, J.M.; et al. Torymus Sinensis Kamijo, a Biocontrol Agent against the Invasive Chestnut Gall Wasp Dryocosmus kuriphilus Yasumatsu in Spain: Its Natural Dispersal from France and the First Data on Establishment after Experimental Releases. For. Syst. 2019, 28, e001. [Google Scholar] [CrossRef] [Green Version]
  17. Cheshkova, A.F. A Review of Hyperspectral Image Analysis Techniques for Plant Disease Detection and Identif Ication. Vavilov J. Genet. Breed. 2022, 26, 202–213. [Google Scholar] [CrossRef] [PubMed]
  18. Terentev, A.; Dolzhenko, V.; Fedotov, A.; Eremenko, D. Current State of Hyperspectral Remote Sensing for Early Plant Disease Detection: A Review. Sensors 2022, 22, 757. [Google Scholar] [CrossRef]
  19. Junges, A.H.; Almança, M.A.K.; Fajardo, T.V.M.; Ducati, J.R. Leaf Hyperspectral Reflectance as a Potential Tool to Detect Diseases Associated with Vineyard Decline. Trop. Plant Pathol. 2020, 45, 522–533. [Google Scholar] [CrossRef]
  20. Nguyen, C.; Sagan, V.; Maimaitiyiming, M.; Maimaitijiang, M.; Bhadra, S.; Kwasniewski, M.T. Early Detection of Plant Viral Disease Using Hyperspectral Imaging and Deep Learning. Sensors 2021, 21, 742. [Google Scholar] [CrossRef]
  21. Cen, Y.; Huang, Y.; Hu, S.; Zhang, L.; Zhang, J. Early Detection of Bacterial Wilt in Tomato with Portable Hyperspectral Spectrometer. Remote Sens. 2022, 14, 2882. [Google Scholar] [CrossRef]
  22. Pádua, L.; Marques, P.; Martins, L.; Sousa, A.; Peres, E.; Sousa, J.J. Monitoring of Chestnut Trees Using Machine Learning Techniques Applied to UAV-Based Multispectral Data. Remote Sens. 2020, 12, 3032. [Google Scholar] [CrossRef]
  23. Castedo-Dorado, F.; Álvarez-Álvarez, P.; Cuenca Valera, B.; Lombardero, M.J. Local-Scale Dispersal Patterns and Susceptibility to Dryocosmus kuriphilus in Different Castanea Species and Hybrid Clones: Insights from a Field Trial. New For. 2021, 54, 9–28. [Google Scholar] [CrossRef]
  24. Gil-Tapetado, D.; Castedo-Dorado, F.; Lombardero, M.J.; Martel, J.; Álvarez-Álvarez, P. Spatial Propagation and Patterns of Abundance of Dryocosmus kuriphilus throughout an Invaded Region. J. Appl. Entomol. 2021, 145, 10–25. [Google Scholar] [CrossRef]
  25. Bertoldi, D.; Miorelli, P.; Pedrazzoli, F.; Delugan, S.; Deromedi, M.; Maresi, G. Investigations on Yellowing of Chestnut Crowns in Trentino (Alps, Northern Italy). IForest 2020, 13, 466–472. [Google Scholar] [CrossRef]
  26. Gehring, E.; Bellosi, B.; Reynaud, N.; Conedera, M. Chestnut Tree Damage Evolution Due to Dryocosmus kuriphilus Attacks. J. Pest Sci. 2020, 93, 103–115. [Google Scholar] [CrossRef]
  27. Barreto, A.; Paulus, S.; Varrelmann, M.; Mahlein, A.-K. Hyperspectral Imaging of Symptoms Induced by Rhizoctonia Solani in Sugar Beet: Comparison of Input Data and Different Machine Learning Algorithms. J. Plant Dis. Prot. 2020, 127, 441–451. [Google Scholar] [CrossRef]
  28. Fallon, B.; Yang, A.; Lapadat, C.; Armour, I.; Juzwik, J.; Montgomery, R.A.; Cavender-Bares, J. Spectral Differentiation of Oak Wilt from Foliar Fungal Disease and Drought Is Correlated with Physiological Changes. Tree Physiol. 2020, 40, 377–390. [Google Scholar] [CrossRef] [PubMed]
  29. Pithan, P.A.; Ducati, J.R.; Garrido, L.R.; Arruda, D.C.; Thum, A.B.; Hoff, R. Spectral Characterization of Fungal Diseases Downy Mildew, Powdery Mildew, Black-Foot and Petri Disease on Vitis Vinifera Leaves. Int. J. Remote Sens. 2021, 42, 5680–5697. [Google Scholar] [CrossRef]
  30. Huang, L.; Zhang, H.; Ruan, C.; Huang, W.; Hu, T.; Zhao, J. Detection of Scab in Wheat Ears Using in Situ Hyperspectral Data and Support Vector Machine Optimized by Genetic Algorithm. Int. J. Agric. Biol. Eng. 2020, 13, 182–188. [Google Scholar] [CrossRef]
  31. Kotobuki, K.; Mori, K.; Sato, Y. Two Methods to Estimate the Tree Damage by Chestnut Gall Wasp, Dryocosmus kuriphilus Yasumatsu. Bull. Fruit Tree Res. Stn. Ser. A. Hiratsuka 1985, 12, 29–36. [Google Scholar]
  32. ASD Inc. FieldSpec 4 User Guide. Available online: https://www.malvernpanalytical.com/en/learn/knowledge-center/user-manuals/fieldspec-4-user-guide (accessed on 27 November 2022).
  33. Zahir, S.A.D.M.; Omar, A.F.; Jamlos, M.F.; Azmi, M.A.M.; Muncan, J. A Review of Visible and Near-Infrared (Vis-NIR) Spectroscopy Application in Plant Stress Detection. Sens. Actuators Phys. 2022, 338, 113468. [Google Scholar] [CrossRef]
  34. Gitelson, A.; Solovchenko, A. Non-Invasive Quantification of Foliar Pigments: Possibilities and Limitations of Reflectance- and Absorbance-Based Approaches. J. Photochem. Photobiol. B 2018, 178, 537–544. [Google Scholar] [CrossRef]
  35. Lee, L.C.; Liong, C.-Y.; Jemain, A.A. Partial Least Squares-Discriminant Analysis (PLS-DA) for Classification of High-Dimensional (HD) Data: A Review of Contemporary Practice Strategies and Knowledge Gaps. Analyst 2018, 143, 3526–3539. [Google Scholar] [CrossRef] [PubMed]
  36. Appeltans, S.; Pieters, J.G.; Mouazen, A.M. Potential of Laboratory Hyperspectral Data for In-Field Detection of Phytophthora Infestans on Potato. Precis. Agric. 2022, 23, 876–893. [Google Scholar] [CrossRef]
  37. Ramos, A.P.M.; Gomes, F.D.G.; Pinheiro, M.M.F.; Furuya, D.E.G.; Gonçalvez, W.N.; Junior, J.M.; Michereff, M.F.F.; Blassioli-Moraes, M.C.; Borges, M.; Alaumann, R.A.; et al. Detecting the Attack of the Fall Armyworm (Spodoptera Frugiperda) in Cotton Plants with Machine Learning and Spectral Measurements. Precis. Agric. 2022, 23, 470–491. [Google Scholar] [CrossRef]
  38. Hornero, A.; Hernández-Clemente, R.; North, P.R.J.; Beck, P.S.A.; Boscia, D.; Navas-Cortes, J.A.; Zarco-Tejada, P.J. Monitoring the Incidence of Xylella Fastidiosa Infection in Olive Orchards Using Ground-Based Evaluations, Airborne Imaging Spectroscopy and Sentinel-2 Time Series through 3-D Radiative Transfer Modelling. Remote Sens. Environ. 2020, 236, 111480. [Google Scholar] [CrossRef]
  39. Lin, Q.; Huang, H.; Wang, J.; Huang, K.; Liu, Y. Detection of Pine Shoot Beetle (PSB) Stress on Pine Forests at Individual Tree Level Using UAV-Based Hyperspectral Imagery and Lidar. Remote Sens. 2019, 11, 2540. [Google Scholar] [CrossRef] [Green Version]
  40. Wu, W.; Zhang, Z.; Zheng, L.; Han, C.; Wang, X.; Xu, J.; Wang, X. Research Progress on the Early Monitoring of Pine Wilt Disease Using Hyperspectral Techniques. Sensors 2020, 20, 3729. [Google Scholar] [CrossRef]
  41. Xi, G.; Huang, X.; Xie, Y.; Gang, B.; Bao, Y.; Dashzebeg, G.; Nanzad, T.; Dorjsuren, A.; Enkhnasan, D.; Ariunaa, M. Detection of Larch Forest Stress from Jas’s Larch Inchworm (Erannis Jacobsoni Djak) Attack Using Hyperspectral Remote Sensing. Remote Sens. 2022, 14, 124. [Google Scholar] [CrossRef]
  42. Ahamed, T. Big Data Scheme from Remote Sensing Applications: Concluding Notes for Agriculture and Forestry Applications. In Remote Sensing Application: Regional Perspectives in Agriculture and Forestry; Ahamed, T., Ed.; New Frontiers in Regional Science: Asian Perspectives; Springer Nature: Singapore, 2022; pp. 351–361. ISBN 978-981-19021-3-0. [Google Scholar]
  43. Duarte, A.; Borralho, N.; Cabral, P.; Caetano, M. Recent Advances in Forest Insect Pests and Diseases Monitoring Using UAV-Based Data: A Systematic Review. Forests 2022, 13, 911. [Google Scholar] [CrossRef]
Figure 1. Study site in Robledo de las Traviesas (42°42′27.65″ N, 6°26′13.54″ W). For both plots, the analysed trees are depicted in an UAV orthoimage.
Agronomy 13 00923 g001
Figure 2. Workflow, as follows: 1. Infestation assessment; 2. Spectral measurements; 3. Spectral data preprocessing; 4. Classification model fittings; 5. Classification model validations; 6. Best classifier selection.
Agronomy 13 00923 g002
Figure 3. The red circles represent the indicative location of the probe for spectral measurements (indicate that the probe is 10 mm in diameter).
Agronomy 13 00923 g003
Figure 4. Spectral characterization using reflectance values, based on gall absence or presence (a) and on different infestation levels (b).
Agronomy 13 00923 g004
Figure 5. Spectral characterization using transformed values, based on gall absence or presence (a) and on different infestation levels (b).
Agronomy 13 00923 g005
Figure 6. Characteristic spectral traits associated with infestation levels after normalization of reflectance values (a) and transformed values (b). Black vertical lines indicate the four wavelengths selected as predictor variables for the classification models.
Agronomy 13 00923 g006
Figure 7. Transformed signatures associated with different infestation levels.
Agronomy 13 00923 g007
Figure 8. Chestnut wasp gall affected leaf and healthy leaf on the same branch.
Agronomy 13 00923 g008
Table 1. Main plot characteristics.
PlotCoordinatesCastanea sativa VarietyIrrigation
System
SpacingTrees, n
A42°42′27.65″ N
6°26′13.54″ W
Parede rojaDrip8.5 m × 8.5 m52
B42°42′35.5″ N
6°26′5.28″ W
Manual9 m × 9 m31
Geographic coordinates refer to WGS84.
Table 2. Branches assessed in both study plots (n = 334).
Infestation LevelsPlot A (n = 211)Plot B (n = 123)
None (0%)173
Low (≤30)3025
Moderate (>30 and ≤40)2323
High (>40 and ≤60)7939
Very high (>60)6233
Table 3. Description of the datasets distinguishing by plot and purpose (training and validation).
Infestation LevelsPlot A
Validation Set
Plot B
Training Set
None (0%)1110
Low (≤30)109
Moderate (>30 and ≤40)1010
High (>40 and ≤60)1010
Very high (>60)1110
Table 4. Spectral datasets.
Spectral DatasetWavelengths Included
All spectra[450:2500 nm]
±10 nm intervals[555:565 nm], [665:685 nm], [1395:1405 nm], [1930:1940 nm]
Four wavelengths(560 nm, 680 nm, 1400 nm, 1935 nm)
Table 5. Classification model overall accuracy (%) as a performance indicator.
MethodSet of VariablesReflectance
Overall Accuracy (%)
Transformed Values
Overall Accuracy (%)
PLS-DAall the spectra59.6257.69
±10 nm intervals53.8559.62
4 wavelengths53.8559.62
RFall the spectra51.9250
±10 nm intervals67.3169.23
4 wavelengths67.3169.23
Table 6. Confusion matrix for infestation levels (N, none; L, low; M, moderate, H, high; VH, very high).
Reference Values
NLMHVH
Predicted valuesN41105
L41113
M51202
H33112
VH30026
Disclaimer/Publisher’s Note: The statements, opinions and data contained in all publications are solely those of the individual author(s) and contributor(s) and not of MDPI and/or the editor(s). MDPI and/or the editor(s) disclaim responsibility for any injury to people or property resulting from any ideas, methods, instructions or products referred to in the content.

