Article

A Comparison of Different Remote Sensors for Ramie Leaf Area Index Estimation

College of Agriculture, Hunan Agricultural University, Changsha 410128, China
*
Author to whom correspondence should be addressed.
Agronomy 2023, 13(3), 899; https://doi.org/10.3390/agronomy13030899
Submission received: 1 March 2023 / Revised: 15 March 2023 / Accepted: 17 March 2023 / Published: 17 March 2023
(This article belongs to the Section Precision and Digital Agriculture)

Abstract

:
Leaf area index (LAI) is an important parameter indicating crop growth. At present, spectral technology has developed into a popular means for LAI monitoring, which can provide accurate estimation results by constructing a model with crop spectral information and a ground LAI value. Spectral range and data type may affect the performance of the model, but few studies have compared the estimation accuracy of crop LAI using different spectral sensors, especially in ramie. In this study, we compared the potential to estimate the ramie LAI of a hyperspectral sensor with a multispectral sensor. A handheld hyperspectral sensor and an airborne multispectral sensor were used to collect spectral data from multiple growth stages, and then four machine learning algorithms were used to construct the LAI estimation model. The results showed that the R2 of the hyperspectral model was 0.702, while the R2 of the multispectral model was 0.816. The cropped hyperspectral data was less sensitive to LAI than the multispectral data with the same spectral band, due to the result of radiation area and data type. The accuracy of the ramie LAI estimation model constructed with all stage data was improved (R2 = 0.828). In conclusion, the airborne multi-spectrometer is more suitable for monitoring ramie LAI in the field.

1. Introduction

Ramie is an important fiber crop in China and around the world, with special cultural, medical, ecological, and economic values [1]. Currently, the survival of ramie and the diversity of its genetic resources are facing an unprecedented crisis as a result of perennial traits, artificial breeding, production selection, and other factors [2]. The study of the high-throughput phenotype of ramie can provide support for ramie production management and quality cultivar selection, which are necessary measures to protect the important ramie germplasm resources [3,4]. Leaf area index (LAI) is an important phenotypic indicator that indicates the nutritional health and growth of crops [5,6]. It can be used to estimate ramie yield [7], as well as to evaluate its adaptability to the environment [8]. Thus, a rapid, accurate, and non-destructive method for monitoring ramie LAI in the field is urgently needed.
Traditional LAI measurement requires people to take random samples in the field. This method is very damaging to the test materials [9], labor-intensive, slow, and ineffective, which cannot meet the needs of modern agriculture for accurate and real-time monitoring [10]. In recent years, the development of spectral technology has provided a new means for monitoring the physicochemical properties of crops (such as LAI [11], nitrogen [12], chlorophyll [13], phenolic substances [14], etc.), which has gradually been implemented and verified by more and more scholars, and made a remarkable impact on various crops.
Crops have unique spectral absorption and radiation characteristics that have been proved to be related to the vibration of chemical bonds (C–H, O–H, and N–H) in the molecular structure of plant leaf components [15]. For example, the red-edge (680–760 nm) is crucial for the determination of chlorophyll [16], and the strong absorption band of water is located near 1450 nm and 1940 nm [17]. The band centered on 1610 nm is the information wavelength for protein determination [18]. Therefore, by associating the characteristic bands with the chemical components to be monitored, the physiological changes and damages to crops can be reflected non-destructively and with a high accuracy [19].
Visible band (350–700 nm), near-infrared band (700–1300 nm), and short-wave infrared (1400–3000 nm) can be collected by an RGB camera, multispectral camera, hyperspectral camera, and other devices. The hyperspectral camera can obtain thousands of narrow band information, its spectral information is large, and the band continuity is strong. Wu et al. [20] estimated winter wheat LAI based on hyperspectral vegetation indexes (VIs), and the R2 and RMSE of the estimation model were 0.89 and 0.31, respectively. In [21,22], the hyperspectral camera proved to be able to estimate LAI with high accuracy, but its high price and complex operation limited its application in practical production. The multispectral camera is also a commonly used instrument for crop LAI monitoring and has a high cost performance. Liu et al. [23] obtained wheat canopy images by using an unmanned aerial vehicle (UAV) equipped with a multispectral camera, and used the partial least squares regression (PLSR) to invert wheat LAI. In their study, the R2 of the wheat LAI estimation model reached 0.73. Yao et al. [24] found that when the spatial resolution of the multispectral image was 0.5 m, the R2 of the LAI estimation model of Masson pine forest constructed by the random forest algorithm (RF) was 0.77. The above studies indicate that both hyperspectral and multispectral cameras have the ability to estimate the LAI of crops. However, in order to promote the application of spectral technology in agricultural practice, spectral sensors with lower cost, more convenient operation, and greater accuracy or at least meeting the ideal requirements must be found.
Previous studies have tended to estimate LAI by using a single sensor or to estimate crop LAI based on data fusion of multi-source sensors. However, studies comparing the accuracy of estimating ramie LAI by different sensors have not been reported, and studies on the effects of spectral range and data type on LAI estimation accuracy are even rarer. This study aims to fill this gap by comparing the performance of two sensors for estimating ramie LAI. A handheld hyperspectral sensor and a low-cost airborne multispectral sensor were used to collect remote sensing data. Subsequently, a variety of machine learning (ML) algorithms were used to construct the best ramie LAI estimation models. The problems to be solved in this study include: (1) whether the accuracy of multispectral data can exceed the estimation accuracy of a subset of hyperspectral data matching the spectral range of the multispectral sensor; (2) in addition to the spectral range, whether different data types (band reflection data or imaging data) affect the estimation accuracy; (3) to establish the optimal LAI estimation model for ramie.

2. Materials and Methods

2.1. Experimental Design

This study was carried out from September to November 2022 at Hunan Agricultural University in Changsha, Hunan Province, China (28°11′01″ N, 113°04′10″ E). Located in the middle and lower reaches of the Yangtze River plain, this region has a subtropical monsoon humid climate with abundant precipitation and good light and heat conditions. The experimental material was Zhongzhu 2. To increase the variations of LAI, four nitrogen application levels were set in this experiment: no nitrogen fertilizer (CK), 390 kg/hm2 nitrogen fertilizer (N1), 332 kg/hm2 nitrogen fertilizer (N2), and 273 kg/hm2 nitrogen fertilizer (N3). At the same time, two periods of topdressing were set, namely, the closure stage (a) and the prosperous stage (b). Therefore, a total of seven treatments (CK, N1-a, N1-b, N2-a, N2-b, N3-a, N3-b) were included in the study. Except for CK with four replicates, the other treatments were repeated twelve times, and there were a total of seventy-six plots. The area of each plot was 4.84 m2, and the inter-plot row spacing was 50 cm.

2.2. Data Collection and Processing

Data collection was conducted in four key growth stages of ramie in 2022, namely seedling stage (27 September), closure stage (18 October), prosperous stage (10 November), and mature stage (25 November). Spectral data and ground LAI were collected on the same day.

2.2.1. Hyperspectral Data Collection and Processing

The ASD FieldSpec 3 (Analytical Spectral Devices, Inc., Boulder, Colorado, USA) was used to collect the hyperspectral data. The ASD FieldSpec 3 has a spectral range of 325–1075 nm, a spectral resolution of 3 nm@700 nm, a spectral sampling interval of 1.5 nm, and a field angle of 25°. Two sampling points were evenly selected from each plot, and each sampling point was repeated for three times. The average spectral reflectance of each plot was recorded. It is important to warm-up the machine for 15 min when using it for the first time. The white panel was a standard diffuse reference for reflectance measurements and must be calibrated before plot measurements. During the measurement, the optical fiber probe of the instrument should be 70 cm above the ramie canopy. View Spec Pro 6.2 (Analytical Spectral Devices, Inc., Boulder, Colorado, USA) was used to process the hyperspectral data and then output the full-band spectrum.

2.2.2. Multispectral Data Collection and Processing

A DJI Phantom 4 pro UAV (DJI Innovation Technology Co., Ltd., Shenzhen, Guangzhou, China) was used to obtain multispectral images of the ramie canopy. The system simultaneously integrates a visible light camera and five multispectral cameras (red, blue, green, near infra-red, and red edge). The corresponding central wavelength and half width of the five bands are shown in Table 1. All the cameras had two megapixel resolutions and could take pictures with a maximum resolution of 1600 × 1300. To ensure stability and sufficient solar radiation, each flight operation was conducted between 12:00 and 14:00 local time.
DJI GS Pro (DJI Innovation Technology Co., Ltd., Shenzhen, Guangzhou, China) was used to automatically generate routes in designated areas, with the main course on an overlapping rate of 80%, and the main route between image overlap at a rate of 70%. The UAV was flying at a speed of about 1.1 m/s and at a height of 20 m. The camera moved above the crop vertically to maximize the crop canopy information. The exposure mode of the camera was automatically selected. Pix4dmapper (Pix4D, Prilly, Switzerland) was used to assemble the complete multispectral images, and geometric correction and radiometric correction were carried out for the images. PhenoAI air (AgriBrain Co., Ltd., Nanjing, Jiangsu, China) was used to extract the multispectral data of each plot, as it can automate noise removal and background segmentation of remote sensing images. Then, forty-eight spectral eigenvalues and nine texture eigenvalues of the ramie were calculated. The spectral eigenvalues were composed of vegetation indexes (VIs), such as the normalized difference vegetation index (NDVI), green normalized difference vegetative index (GNDVI), and optimized soil-adjusted vegetation index (OSAVI). Texture eigenvalues were composed of gray level co-occurrence matrices (GLCM).

2.2.3. Ground LAI Collection

Ground LAI was measured by an LAI-2200 canopy analyzer (LI-COR, Lincoln, NE, USA). A five-point sampling method was adopted, and then the instrument automatically calculated and recorded the LAI value according to Lambert–Beer’s law. At each plot, LAI was measured three times. The average value was taken as the average LAI for each plot. To avoid the influence of light, LAI was measured from 8:00 to 11:00 and after sunset in the afternoon.

2.3. Correlation Analysis

The Pearson correlation coefficient was used to measure the correlation between ground LAI and the spectral data. The Pearson correlation coefficient lies between 1 and −1, where 1 indicates that the variables are completely positively correlated, 0 indicates no linear correlation, and −1 indicates a completely negative correlation. Correlation analysis was performed using IBM SPSS Statistics 22 (International Business Machines Corporation, Armonk, New York, USA).

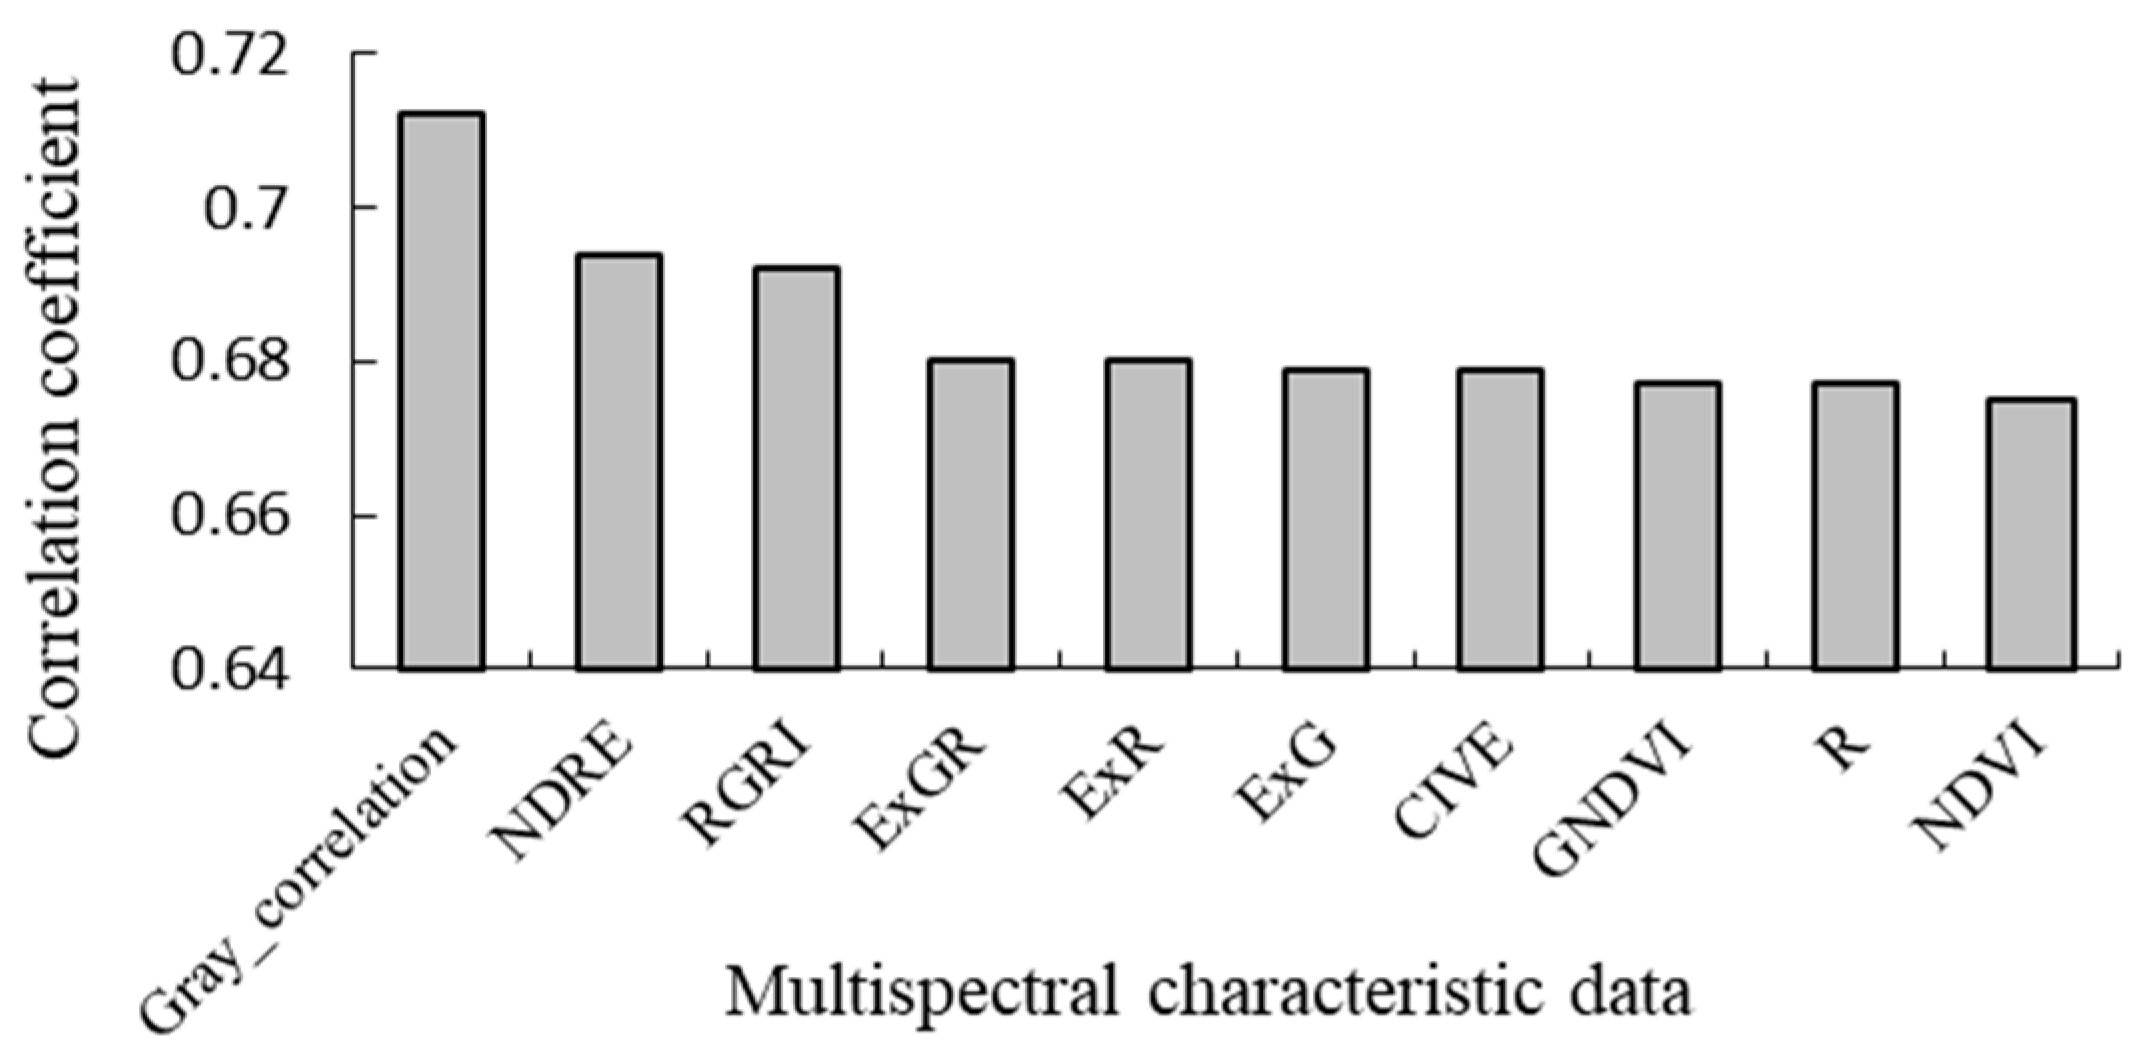
2.4. Spectral Subset Data Construction

To compare the difference of spectral reflectance between the two sensors, the spectral range of the multispectral sensor was taken as the standard (Table 1), and the hyperspectral subset data with the standard spectral range was separated from the full-band hyperspectral data. The multispectral dataset was designated as PT4, and the cropped hyperspectral data set was designated as FS3.

2.5. Model Construction and Evaluation

At each growth stage, 76 LAI values were obtained and randomly divided into a training set and validation set in a ratio of 7:3. Four widely used machine learning algorithms were adopted to construct the estimation models. Among them, linear regression is a simple model that combines the concept of naive machine learning modeling and serves as the basis for highly complex linear models. Random forest (RF) is a combinatorial classification algorithm of ensemble learning. Support vector regression (SVR) is an algorithm based on the principle of maximum interval. Its advantage is that it has a strong anti-noise capability and is suitable for small sample learning. Partial least squares regression (PLSR) is an extension of multiple linear regression, and it inherits the idea of principal component analysis and canonical correlation analysis. It has many advantages, such as less variable constraint and less noise interference.
Ground LAI and remote sensing data were used as response variables. The recursive feature elimination (RFE) method was used to filter the sensitive feature. The RFE used a base model to conduct several rounds of training. After each round of training, features with small weight coefficients were removed, and then the next round of training was conducted based on the new feature set. All the estimation models were implemented in Python.
The predictive ability of the model was evaluated by the R2 value and root mean square error (RMSE). The higher the R2, the lower the RMSE, indicating the higher model fitting accuracy. The workflow diagram of overall test is shown in Figure 1.

3. Results

3.1. Distribution of Ground LAI

Table 2 shows the statistical analysis of ground LAI. The minimum and maximum values of ramie LAI during the whole-growth stage were 0.91 and 5.19, respectively, the coefficient of variation (CV) was 26.85%, and the CV in different growth stages ranged from 10.85% to 32.21%, indicating that the variation range of LAI was large and the data met the difference requirements for modelling.

3.2. Ramie LAI Estimation Model Based on Hyperspectral Data

3.2.1. Correlation between Full-Band Hyperspectral Data and LAI

Figure 2 shows the results of the correlation analysis between ramie LAI collected at different growth stages and the full-band hyperspectral data. There are differences in the correlation coefficients between the LAI and hyperspectral data at different growth stages. From high to low, the average correlation coefficient was seedling stage (0.539), closure stage (0.427), mature stage (0.417), and prosperous stage (0.222). Except for the prosperous stage, the LAI at the other three growth stages showed significant correlations with multiple spectral bands (p < 0.01).

3.2.2. LAI Estimation Using Hyperspectral Data from a Single Growth Stage

Figure 3 compares the accuracy of the ramie LAI estimation model constructed at different growth stages. There were significant differences in the accuracy of LAI estimation models at different growth stages, as shown by seedling stage > closure stage > mature stage > prosperous stage, which is consistent with the results of the correlation analysis. The seedling stage had the highest estimation accuracy. The R2 and RMSE of the optimal model were 0.511 and 0.526 in the training set, respectively, and 0.639 and 0.473 in the validation set, respectively. The estimation accuracy of the optimal model for closure stage was 0.496. The R2 of the optimal model in the training set and in the validation set were relatively close, indicating that the LAI estimation model constructed based on a single growth stage was stable.
Among the four ML algorithms, the PLSR model was better than the other three ML algorithms in the estimation accuracy of the validation set at the seedling, sealing, and flowering stages. Therefore, PLSR may be more appropriate for estimating ramie LAI based on hyperspectral data. In the mature stage, the SVR model obtained a higher R2 in both the training set and the validation set, indicating that SVR has a better application effect in the estimation of ramie LAI in the mature stage.

3.2.3. Universal Estimation Model Constructed by Hyperspectral Data

To construct a universal model that can be applied to estimate ramie LAI at all growth stages, the hyperspectral data and ground LAI from all growth stages were integrated for modeling, and the results are shown in Table 3. The accuracy of the universal estimation model was significantly higher than that of the single-stage estimation model. The R2 of the training set ranged from 0.614 to 0.944 and the RMSE ranged from 0.248 to 0.649. The R2 of the validation set ranged from 0.608 to 0.702 and the RMSE ranged from 0.548 to 0.629. All the four ML algorithms performed well, with the RF model having the highest accuracy.

3.3. Ramie LAI Estimation Model Based on Multispectral Data

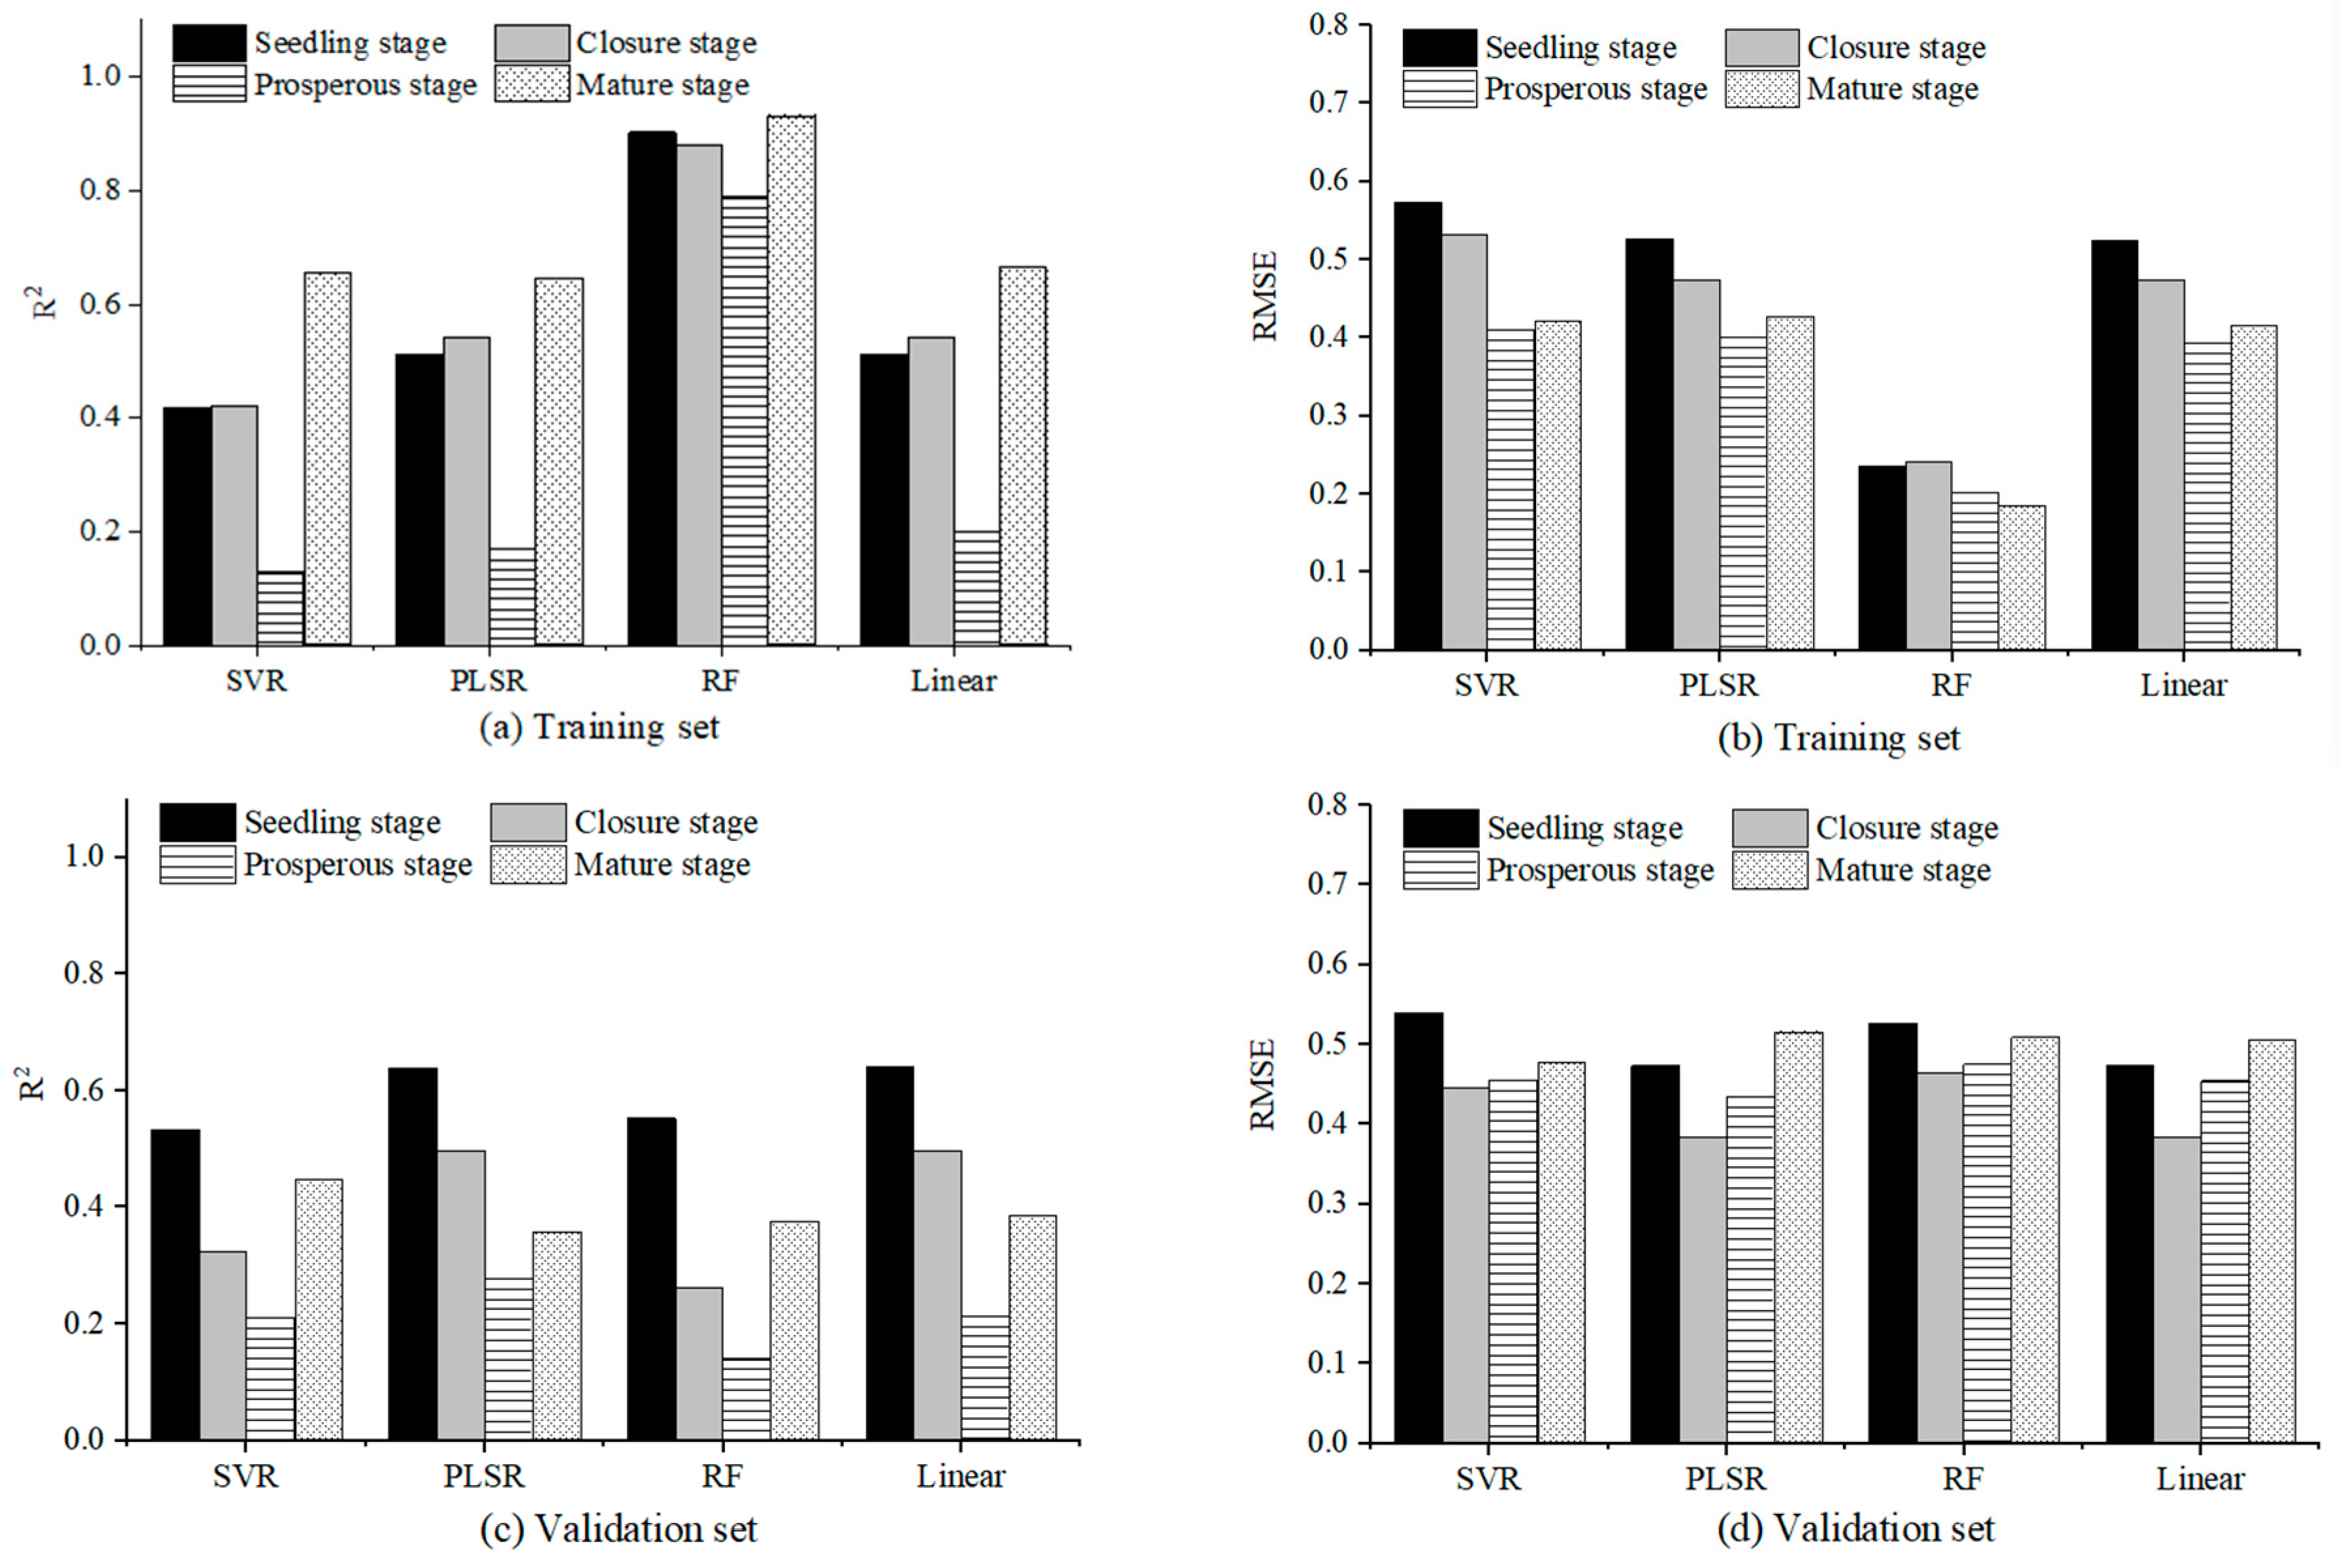
3.3.1. LAI Estimation Using Multispectral Data from a Single Growth Stage

Remote sensing data extracted from multispectral images were used to construct ramie LAI estimation models at different growth stages (Figure 4). The single-stage estimation models were ranked from high to low in the following order: mature stage, seedling stage, closure stage, and prosperous stage. The accuracy of the LAI estimation model for the mature stage was the highest, with the R2 of 0.839 and RMSE of 0.326 in the validation set. The estimation accuracies of LAI at the seedling stage and closure stage were also better, with R2 values of 0.738 and 0.563, respectively. Similar to the results estimated using hyperspectral data, the R2 of the estimation model for the prosperous stage was very low.
Among the four machine learning algorithms, PLSR and SVR have the same performance, with higher accuracy than the linear algorithm. The R2 of RF was high in the training set, but low in the validation set, indicating that the stability of the RF model was not strong.

3.3.2. Universal Estimation Model Constructed by Multispectral Data

Multispectral data acquired from all growth stages were integrated for modeling (Table 4). The universal estimation model had significantly higher accuracy than the single-stage model. In the training set, the R2 ranged from 0.794 to 0.964, and the RMSE ranged from 0.182 to 0.437. In the validation set, the R2 ranged from 0.555 to 0.816, and the RMSE ranged from 0.414 to 0.645.
Compared with the universal estimation model based on hyperspectral data (Table 2), the universal estimation model based on UAV multispectral data had a higher accuracy. The R2 of the training set increased by 0.020~0.281, whilst the RMSE decreased by 0.066~0.371. The R2 of the validation set increased by −0.102~0.186, and the RMSE decreased by 0.308~0.528. The multispectral images of the ramie canopy obtained by the UAV platform contain additional texture features, and the imaging system can help eliminate the influence of soil, weeds, and other interferences on the reflection spectrum of ramie.

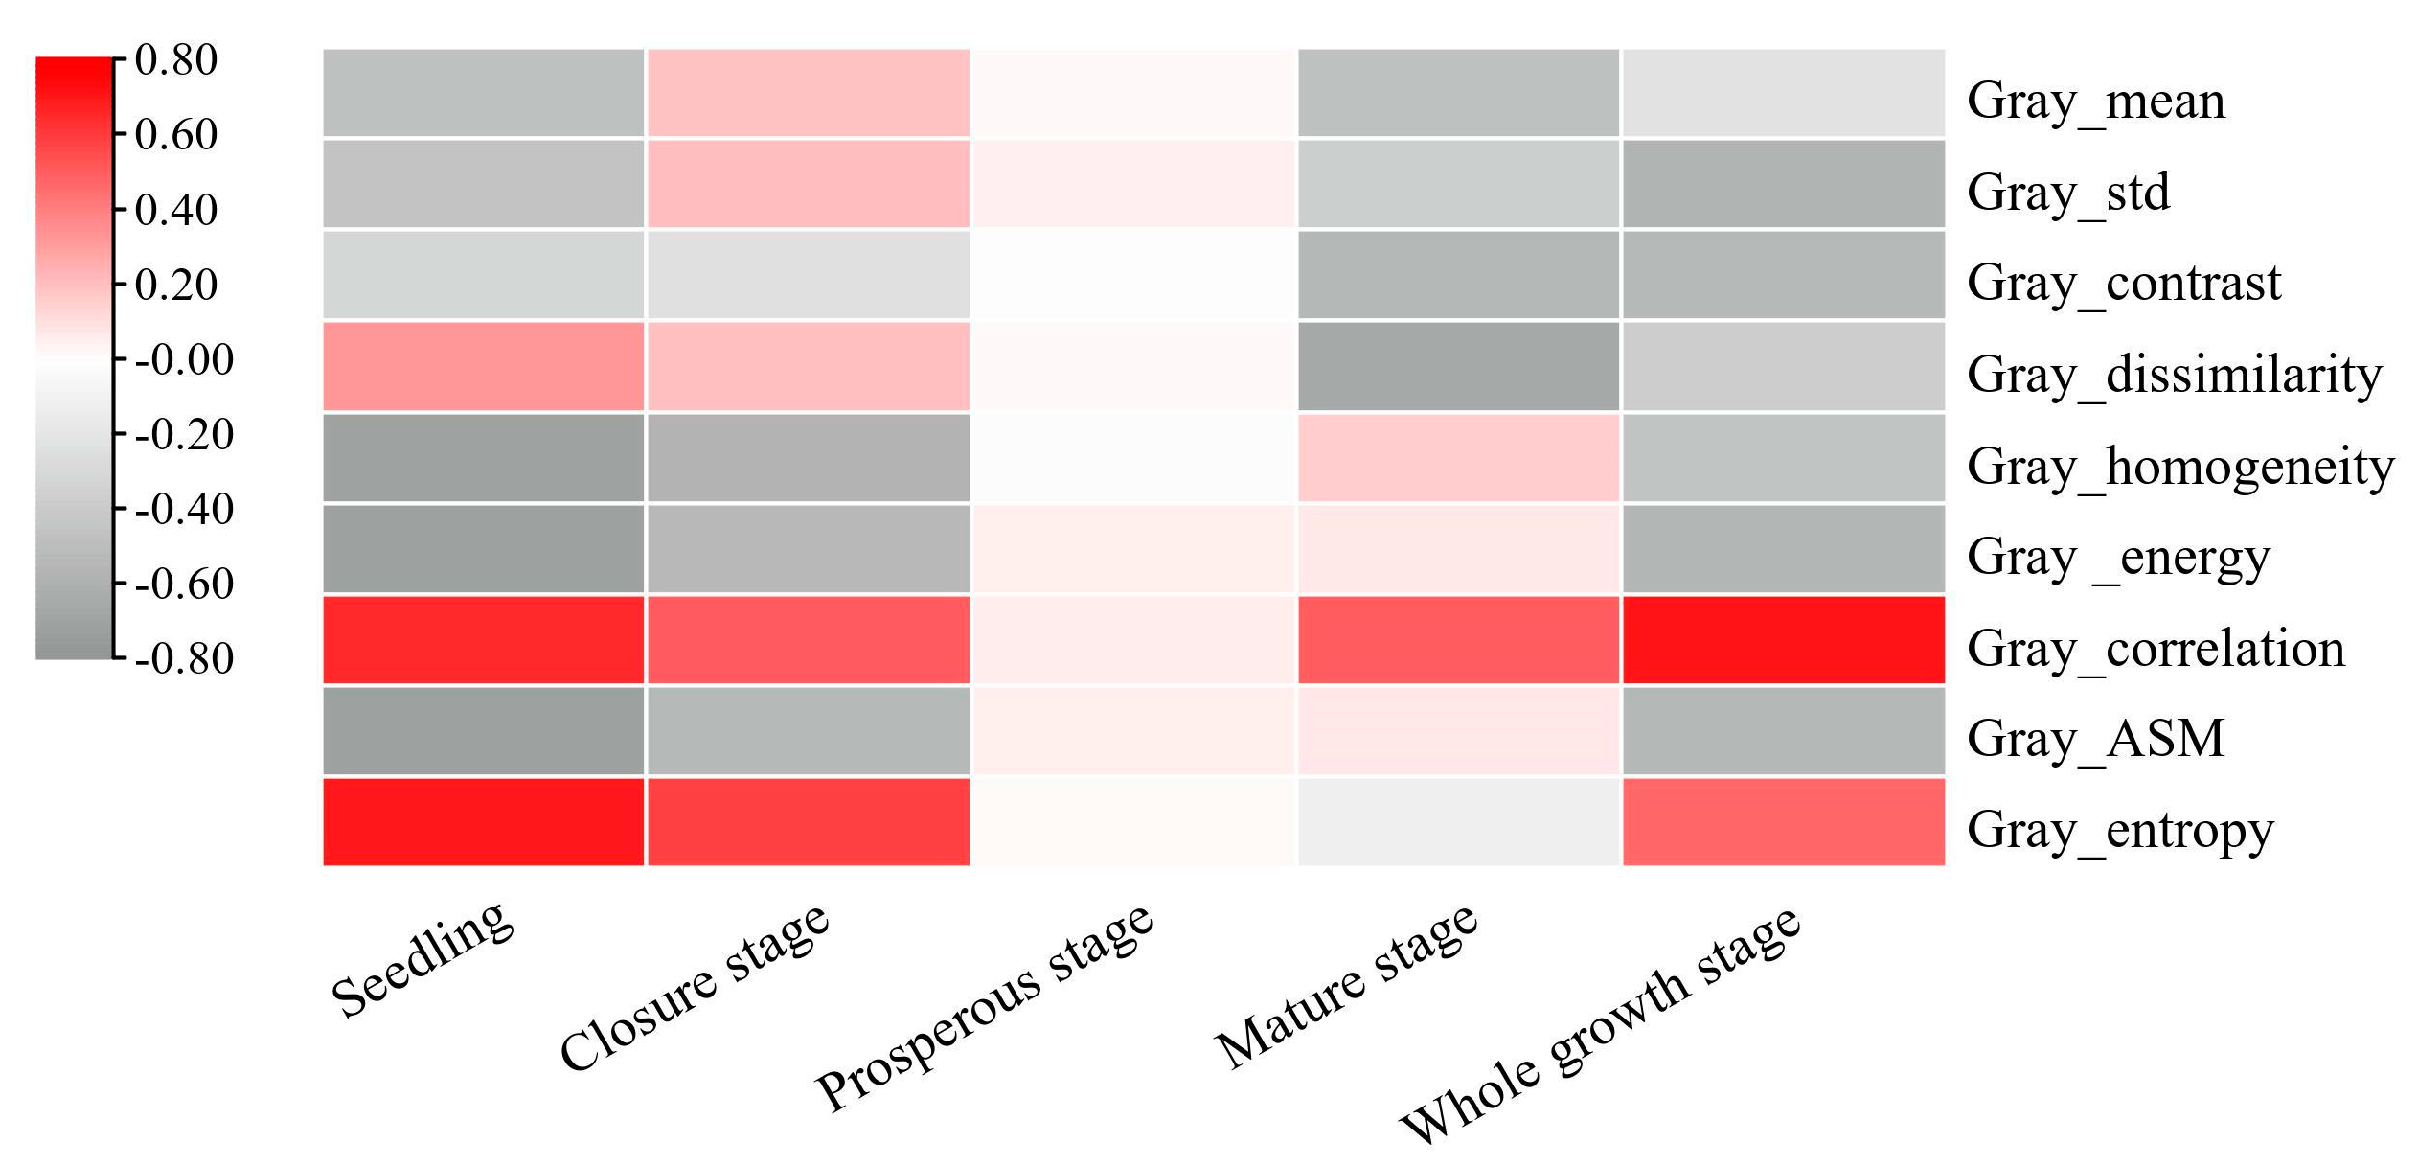
3.3.3. Influence of Texture Features on LAI Estimation Model

Although the hyperspectral sensor can provide more spectral information and have satisfactory accuracy in estimating ramie LAI, the airborne multispectral sensor with higher cost performance and stronger estimation ability is preferred in practical ramie production applications.
According to the estimation performance of the two sensors, data type may be an important factor affecting the estimation accuracy of ramie LAI. Figure 5 shows the top ten multispectral data that have a high correlation with ramie LAI, among which Gray_correlation has the strongest correlation with LAI throughout the growth stage, with a correlation coefficient of 0.712. In addition, nine texture features also showed significant correlations with LAI at different growth stages (Figure 6).

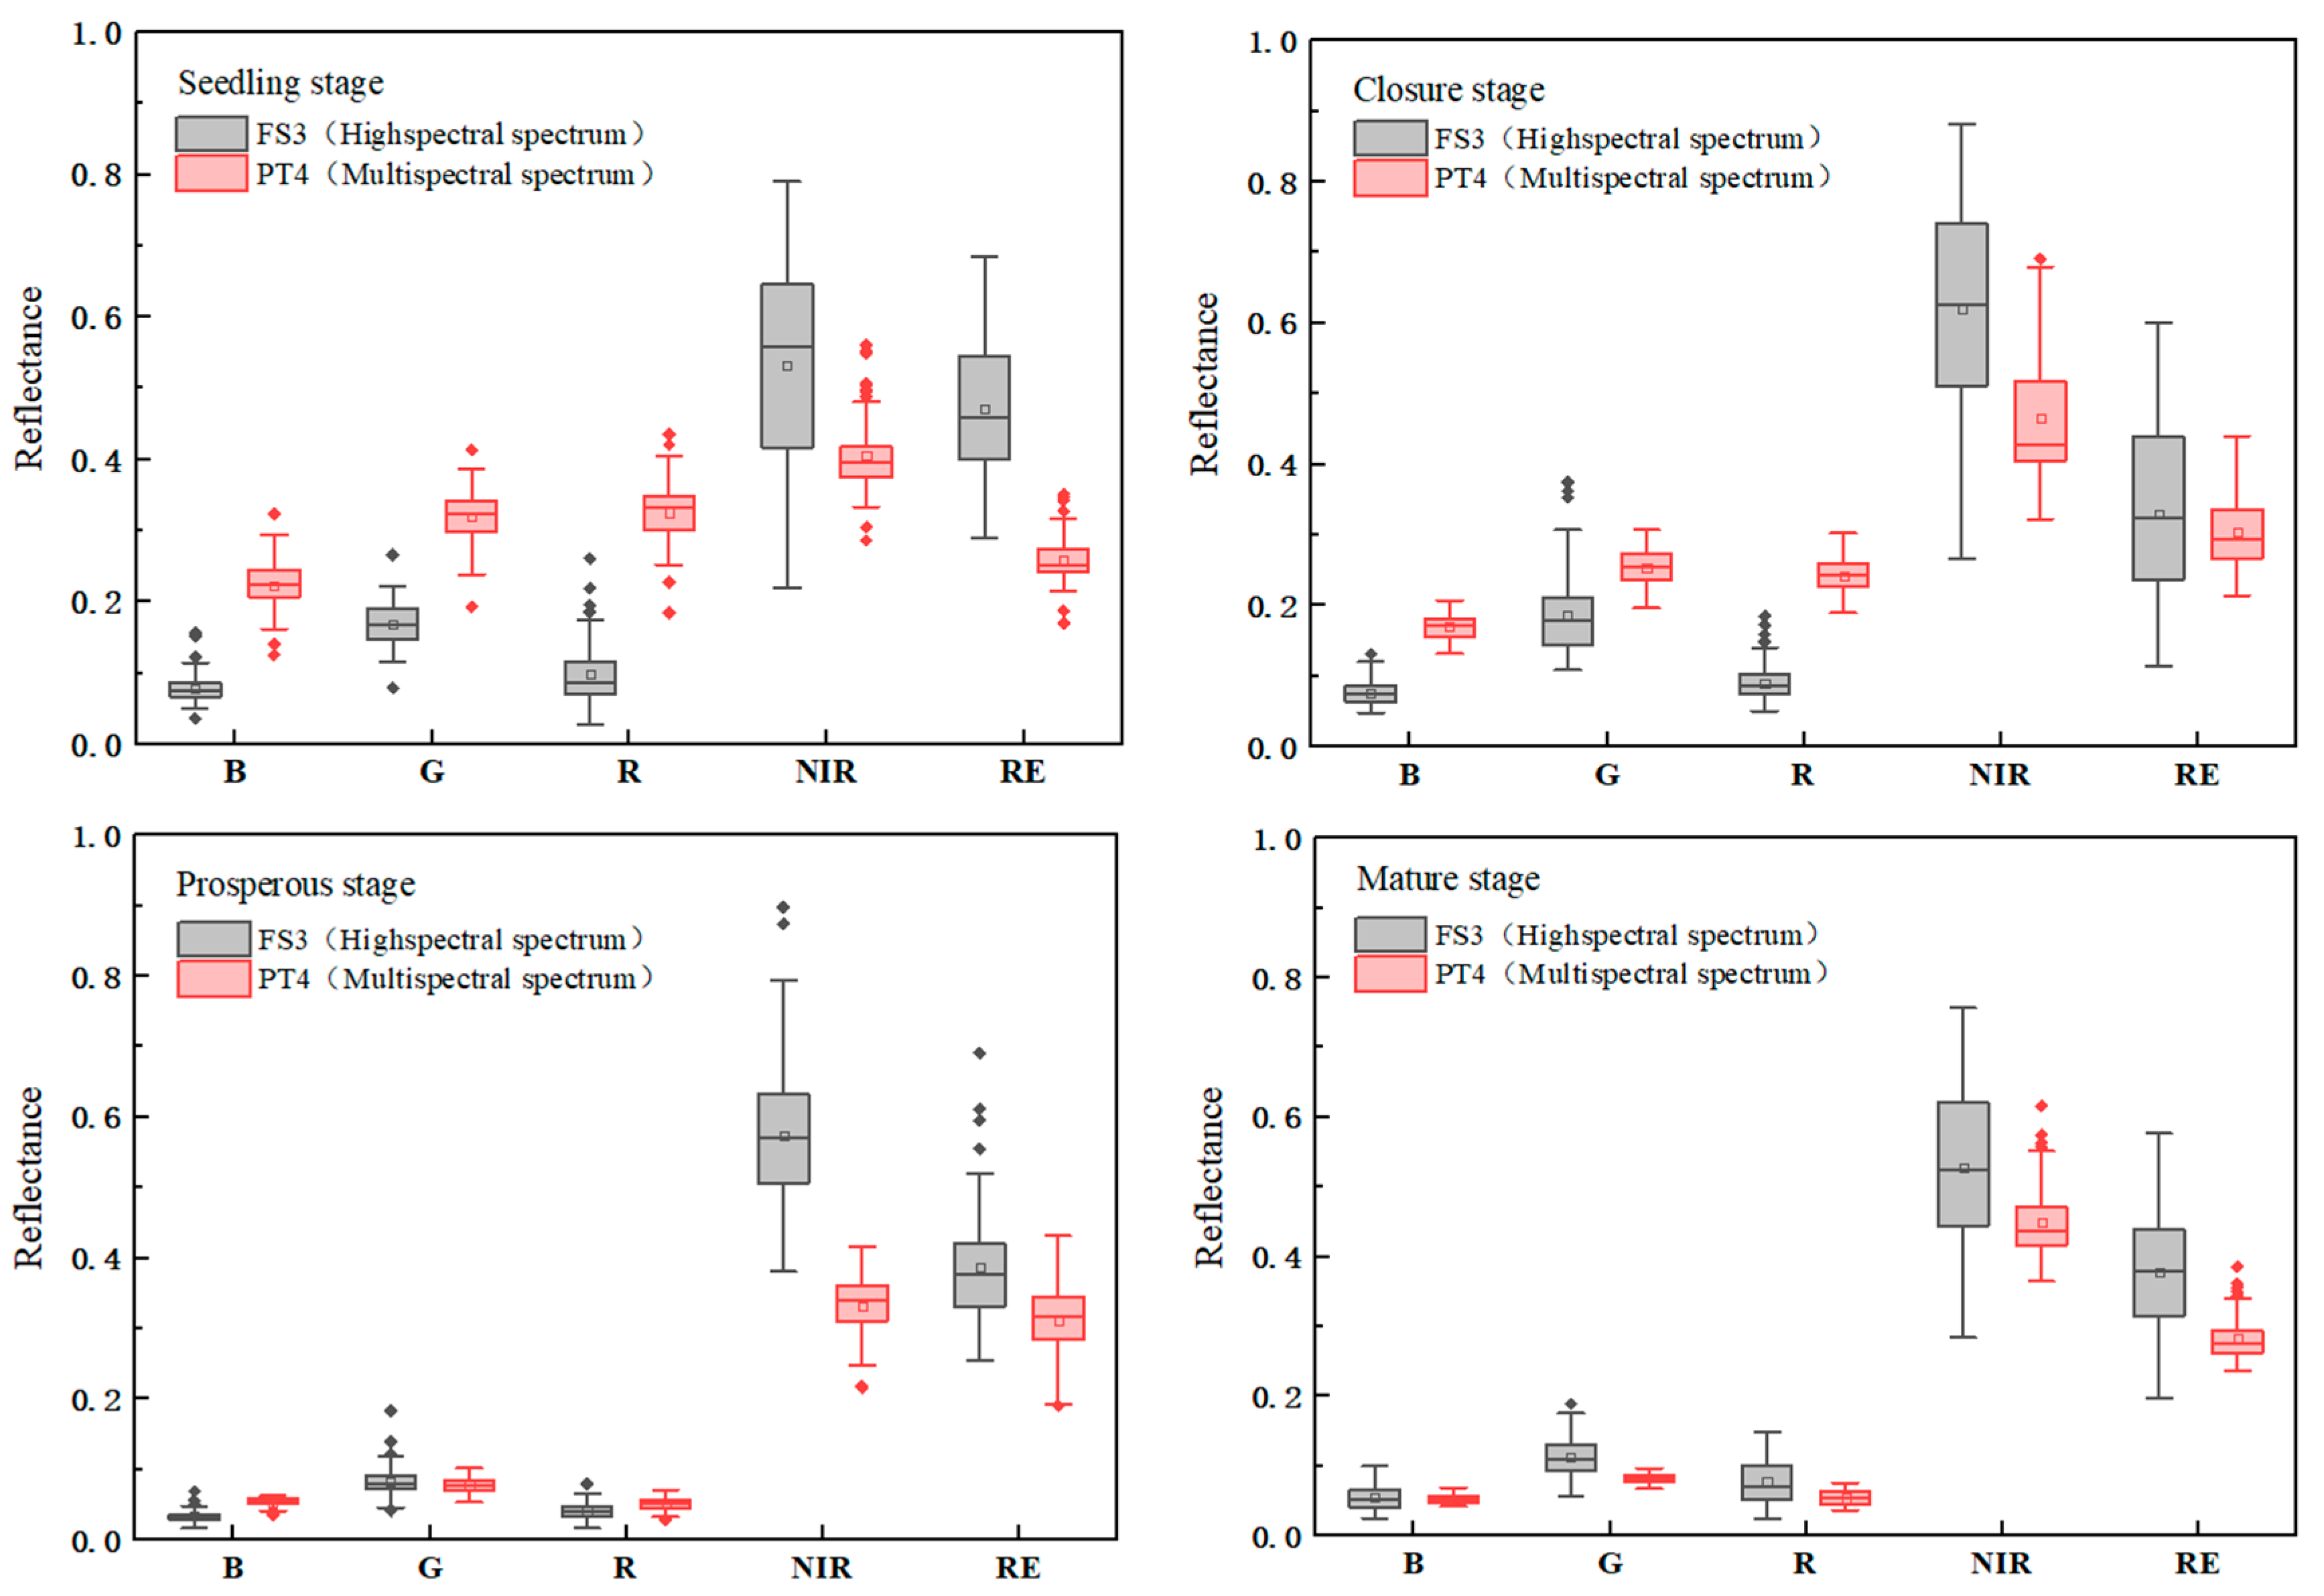
3.4. Difference Comparison of Spectral Datasets from Two Sensors

To further compare the difference of spectral reflectance between the two sensors, the spectral range of the multispectral data (PT4) was taken as a standard (Table 1), and the matching spectral subset (FS3) was separated from the all-band hyperspectral data, including five key spectral bands, namely red, blue, green, near-infrared (NIR), and red-edge (RE). Figure 7 shows the difference between the reflectance spectra of two sensors under the same band. In general, the spectral reflectance distribution of the PT4 was closer than that of the FS3. There were significant differences between the red, green, and blue bands of the PT4 and the FS3 at the seedling stage and closure stage. Furthermore, the reflectance values of the three bands from PT4 were generally higher. In addition, PT4 had a lower reflectance than FS3 in both NIR and RE.

3.5. Influence of Spectral Range and Data Type on LAI Estimation Accuracy

To further investigate the performance of the two sensors in estimating ramie LAI, the LAI estimation models were constructed by using the PT4 datasets and the FS3 datasets, respectively. Firstly, the correlation between the spectral subset data of the two sensors and ramie LAI at different growth stages was assessed (Figure 8). The two datasets with matching spectral ranges had significantly different reflectance values and derived VIs. The VIs constructed by FS3 had a higher correlation with LAI at the seedling stage and prosperous stage, while the VIs constructed by PT4 had a higher correlation with LAI at the closure stage and mature stage. Multispectral data and LAI had correlation coefficients between 0.103 and 0.765, and the correlation coefficients between the hyperspectral data and LAI ranged from 0.113 to 0.803.
Table 5 compares the performance of the LAI estimation models constructed by the spectral subsets of two sensors for different growth stages. Similar to the results of correlation analysis, the FS3 produced better estimation models in the seedling stage and prosperous stage, while the PT4 had better estimation performance in the closure stage and mature stage. Furthermore, the accuracy from the two sensors was significantly different. In the closure stage and mature stage, the best LAI estimation models constructed based on the PT4 dataset had the R2 values of 0.645 and 0.677, respectively, while the optimal models constructed based on the FS3 dataset had the R2 values of 0.321 and 0.243, respectively. It is worth noting that the estimation model for the prosperous stage constructed using the FS3 dataset had the highest accuracy (R2 = 0.472, RMSE = 0.372), which may be because the VIs derived from the subset could more effectively eliminate the influence of the external environment and provide enhanced details of the ramie plants.
Both sensors were able to estimate ramie LAI by using whole-growth data, but the FS3 did not produce a better estimation model in the same spectral range as the multispectral sensor. The universal LAI estimation model constructed based on the FS3 dataset had the R2 of 0.723 and the RMSE of 0.508. The universal LAI estimation model constructed based on the PT4 dataset had the R2 of 0.741 and the RMSE of 0.492.

3.6. LAI Estimation Models by Integrating Two Types of Remote Sensing Data

The multi-source data obtained from two sensors were integrated to construct the universal estimation model of ramie LAI. As shown in Table 6, the model accuracy was significantly improved after the fusion of the multi-source data. The optimal model had the R2 values of 0.966 and 0.828 in the training set and validation set, respectively. In conclusion, the fusion of the multi-source data was helpful for the LAI estimation of ramie, but the accuracy improvement was limited. Compared with the universal estimation model constructed by multispectral data, the accuracy improvement was only 0.012, and the descending range of RMSE was 0.014.

4. Discussion

4.1. Performance Comparison of Two Kinds of Sensor Data in LAI Estimation

With the development of spectral technology, hyperspectral and multispectral remote sensing data are widely used in crop LAI monitoring [25]. Different from the multispectral sensor, the hyperspectral sensor can provide more abundant band information, but its data processing is very complicated and the price is higher. Therefore, there has been a controversy about the selection of the best sensor in the field of remote sensing LAI estimation. Zhang et al. [26] compared the accuracy of hyperspectral, multispectral, and Lidar sensors in monitoring soybean LAI, and found that the hyperspectral data and Lidar data did not significantly improve the prediction accuracy of LAI, which was consistent with the conclusion of [27]. In this study, the ability of hyperspectral data and multispectral data to estimate ramie LAI was compared. The R2 and RMSE values of the optimal model constructed with hyperspectral data were 0.702 and 0.548, respectively, and the R2 and RMSE values of the optimal model constructed based on multispectral data were 0.816 and 0.414, respectively. In the study of ramie LAI, the airborne multi-spectrometer performed better estimation results.
This study further compared the effect of hyperspectral and multispectral data on LAI estimation when the same spectral band was used, and found that the reflectance values of the corresponding band range obtained from the two sensors were different, and the LAI estimation model constructed with multispectral data had a better estimation effect (Table 5). This may be because the hyperspectral data reflects discontinuous point LAI distributions, while the multispectral data reflects continuous planar LAI distributions, which can better reflect the overall average situation of LAI. In summary, it is suggested to use airborne multispectral data instead of hyperspectral data for crop LAI monitoring.

4.2. Influence of Remote Sensing Data Types on LAI Estimation Accuracy

The airborne multispectral sensor can not only extract the spectral information from the crop canopy, but also excavate the structural and textural features from the remote sensing images, which is helpful to improve the accuracy of crop phenotype estimation [28]. In previous studies, a single type of remote sensing data was mostly used to construct LAI estimation models, but no scholars have used multimodal remote sensing data to build ramie LAI estimation models, and the contribution of different data types to the accuracy of LAI estimation is still worth exploring. Zhang et al. [29] constructed a winter wheat LAI estimation model by combining texture features obtained by visible light sensors and hyperspectral data, and found that texture features had extremely significant correlations with wheat LAI, and the LAI estimation model constructed by combining texture features had optimal estimation performance. In our study, texture features played a key role in ramie LAI estimation (Figure 5 and Figure 6). The reason behind why the accuracy of the model constructed with multispectral data was significantly higher than that of the hyperspectral model may be due to the introduction of texture features. When the spectral features are saturated, the performance of the estimation model can be improved by integrating different types of remote sensing data.
Multi-source data fusion is also a hot topic in crop phenotype estimation. Different sensors can obtain different remote sensing data. Luo et al. [30] adopted a hyperspectral sensor and Lidar to collect data collaboratively, and improved the accuracy of maize LAI estimation through the fusion of multi-source data. In our study, hyperspectral and multispectral data were combined, but the performance of the estimation model was not significantly improved (Table 6).

4.3. Accuracy Comparison of LAI Estimation Models at Different Growth Stages

As the crop grows, LAI changes from time to time, leading to differences in the estimation models constructed at different growth stages. The universal LAI estimation model constructed by integrating multiple time series data had a more stable performance than that of a single period, because the differences found in some growth stages can be compensated in other growth periods [31]. This conclusion is consistent with the results of [32]. Dhillon et al. [33] also believed that using multi-time series remote sensing images to predict the above-ground biomass of winter wheat is more reliable and accurate than using a single period remote sensing “snapshot”.

5. Conclusions

In this study, two types of sensors and four ML algorithms were used to construct ramie LAI estimation models at different growth stages. To determine the optimal ramie LAI estimation scheme, the performance of estimating ramie LAI by two remote sensing sensors was emphatically compared, and the effects of spectral range and data type on the accuracy of LAI estimation model were explored. The main conclusions are as follows:
(1) Both sensors had the potential to accurately estimate ramie LAI. The R2 and RMSE values of the optimal estimation model based on hyperspectral data were 0.702 and 0.548, respectively, while the R2 and RMSE values of the optimal estimation model based on multispectral data were 0.816 and 0.414, respectively. The airborne multispectral sensor was more suited for field ramie LAI estimation due to its superior estimate performance, lower cost, and easier operation.
(2) The accuracy of the LAI estimation model was influenced by spectral range and data type. The estimation accuracy of UAV multispectral data exceeds that of the hyperspectral data subset matching its spectral range, because the airborne multispectral sensor obtains more uniform ramie canopy layer information. Moreover, additional texture features from multispectral images also play a positive role in LAI estimation.
(3) The accuracy of the ramie LAI estimation model by integrating multi-source remote sensing data was improved, but the improvement was limited. The R2 and RMSE values of the best model were 0.966 and 0.179 in the training set, respectively, and 0.828 and 0.400 in the validation set, respectively.

Author Contributions

H.F. conceived, designed the experiments, analyzed the data, and wrote the manuscript. H.F. and J.L. performed the experiments. Y.Y., M.X., J.C. and X.J. analyzed the data, G.C. and W.S. made critical comments and revisions. All authors have read and agreed to the published version of the manuscript.

Funding

This work was funded by National Key Research and Development Program Project (2018YFD0201106); Ministry of Finance and Ministry of Agriculture and Rural Affairs: National Modern Agricultural Industry Technology System (CARS-16-E11); National Natural Science Foundation of China (31471543); Natural Science Foundation of Hunan Province (2021JJ60011).

Data Availability Statement

Not applicable.

Acknowledgments

The authors thank Hunan Agricultural University (Hunan, China) for technical support and the materials used for the experiment.

Conflicts of Interest

The authors declare no conflict of interest.

References

  1. Li, Z.D. Theory and Technique of Anaesthesia; Shanghai Science and Technology Press: Shanghai, China, 1980. [Google Scholar]
  2. Cui, D.; Cui, G.; Yang, R.; She, W.; Liu, Y.; Wang, H.; Su, X.; Wang, J.; Liu, W.; Wang, X.; et al. Phenotypic characteristics of ramie (Boehmeria nivea L) germplasm resources based on UAV remote sensing. Genet. Resour. Crop Evol. 2021, 68, 551–566. [Google Scholar] [CrossRef]
  3. Fu, H.; Wang, C.; Cui, G.; She, W.; Zhao, L. Ramie Yield Estimation Based on UAV RGB Images. Sensors 2021, 21, 669. [Google Scholar] [CrossRef]
  4. Fu, H.Y.; Wang, W.; Liao, A.; Yue, Y.K.; Xu, M.Z.; Wang, Z.W.; Chen, J.F.; She, W.; Cui, G.X. High Quality Ramie Resource Screening Based on UAV Remote Sensing. Smart Agric. 2022, 4, 74–83. [Google Scholar]
  5. Xue, X.X.; Lu, J.W.; Li, X.K.; Ren, T.; Cong, R.H.; Ming, R. Nutritional and physiological characters of rice leaves exposure to potassium deficiency under different nitrogen rates. J. Plant Nutr. Fertil. 2016, 22, 1494. [Google Scholar]
  6. Liu, K.; Zhou, Q.; Wu, W.; Chen, Z.; Tang, H. Comparison between multispectral and hyperspectral remote sensing for LAI estimation. Trans. CSAE 2016, 32, 155–162. [Google Scholar]
  7. Zhang, H.M.; Liu, W.; Han, W.T.; Liu, Q.Z.; Song, R.J.; Hou, G.H. Inversion of summer maize leaf area index based on gradient boosting decision tree algorithm. Trans. Chin. Soc. Agric. Mach. 2019, 50, 258–266. [Google Scholar]
  8. Alexandridis, T.K.; Ovakoglou, G.; Clevers, J.G. Relationship between MODIS EVI and LAI across time and space. Geocarto Int. 2020, 35, 1385–1399. [Google Scholar] [CrossRef]
  9. Qi, B.; Zhang, N.; Zhao, T.-J.; Xing, G.-N.; Zhao, J.-M.; Gai, J.-Y. Prediction of Leaf Area Index Using Hyperspectral Remote Sensing in Breeding Programs of Soybean. Acta Agron. Sin. 2015, 41, 1073–1085. [Google Scholar] [CrossRef]
  10. Ma, Y.; Lv, X.; Xiang, Y. Monitoring of cotton leaf area index using machine learning. Trans. Chin. Soc. Agric. Eng. 2021, 37, 152–162. [Google Scholar]
  11. Li, J.; Jiang, H.; Luo, W.B.; Ma, X.; Zhang, Y. Potato LAI estimation by fusing UAV multi-spectral and texture features. J. South China Agric. Univ. 2023, 44, 93–101. [Google Scholar]
  12. Zha, H.; Miao, Y.; Wang, T.; Li, Y.; Zhang, J.; Sun, W.; Feng, Z.; Kusnierek, K. Improving Unmanned Aerial Vehicle Remote Sensing-Based Rice Nitrogen Nutrition Index Prediction with Machine Learning. Remote Sens. 2020, 12, 215. [Google Scholar] [CrossRef] [Green Version]
  13. Wei, Q.; Zhang, B.Z.; Wei, Z.; Han, X.; Duan, C.F. Estimation of canopy chlorophyll content in winter wheat by UAV multispectral remote sensing. J. Triticeae Crops 2020, 40, 365–372. [Google Scholar]
  14. Zhang, K.; Wen, Q.; Li, T.; Liu, Q.; Wang, Y.; Huang, J. Comparison of interaction mechanism between chlorogenic acid/luteolin and glutenin/gliadin by multi-spectroscopic and thermodynamic methods. J. Mol. Struct. 2021, 1246, 131219. [Google Scholar] [CrossRef]
  15. Reddy, H.; Dinakaran, S.; Srisudharson, P.N.; Ghosh, S.; Banji, D. Near infra-red spectroscopy-An overview. Int. J. ChemTech Res. 2011, 3, 825–836. [Google Scholar]
  16. Niu, Q.L.; Feng, H.K.; Zhou, X.G.; Zhu, J.Q.; Yong, B.B.; Li, H.Z. Combining UAV Visible Light and Multispectral Vegetation Indices for Estimating SPAD Value of Winter Wheat. Trans. Chin. Soc. Agric. Mach. 2021, 52, 183–194. [Google Scholar]
  17. Qin, Z.F. Study on Rice Condition Monitoring with Remote Sensing in Northwest Region. Master’s Thesis, Northwest A & F University, Xi’an, China, 2016. [Google Scholar]
  18. Punalekar, S.M.; Thomson, A.; Verhoef, A.; Humphries, D.J.; Reynolds, C.K. Assessing suitability of Sentinel-2 bands for monitoring of nutrient concentration of pastures with a range of species compositions. Agronomy 2021, 11, 1661. [Google Scholar] [CrossRef]
  19. Sukhova, E. Application of Reflectance Indices for Remote Sensing of Plants and Revealing Actions of Stressors. Photonics 2021, 8, 582. [Google Scholar]
  20. Hasan, U.; Kasim, N.; Chen, C.; Sawut, M. Estimation of Winter Wheat LAI Based on Multi-dimensional Hyperspectral Vegetation Indices. Trans. Chin. Soc. Agric. Mach. 2022, 53, 181–190. [Google Scholar]
  21. Yue, J.; Feng, H.; Jin, X.; Yuan, H.; Li, Z.; Zhou, C.; Yang, G.; Tian, Q. A comparison of crop parameters estimation using images from UAV-mounted snapshot hyperspectral sensor and high-definition digital camera. Remote Sens. 2018, 10, 1138. [Google Scholar] [CrossRef] [Green Version]
  22. Mariana, V.C.; Kyle, A.P.; Race, H.H.; Asheesh, K.S.; Fernando, E.M. Comparative prediction accuracy of hyperspectral bands for different soybean crop variables: From leaf area to seed composition. Field Crops Res. 2021, 271, 108260. [Google Scholar]
  23. Liu, T.; Zhang, H.; Wang, Z.Y.; He, C.; Zhang, Q.G.; Jiao, Y.Z. Estimation of the leaf area index and chlorophyll content of wheat using UAV multi-spectrum images. Trans. Chin. Soc. Agric. Eng. (Trans. CSAE) 2021, 37, 65–72. [Google Scholar]
  24. Yao, X.; Yu, K.Y.; Liu, J. Leaf Area Index Estimation of Masson Pine (Pinus massoniana) Forests Based on Multispectral Remote Sensing of UAV. Trans. Chin. Soc. Agric. Mach. 2021, 52, 213–221. [Google Scholar]
  25. Zheng, G.; Moskal, L.M. Retrieving leaf area index (LAI) using remote sensing: Theories, methods and sensors. Sensors 2009, 9, 2719–2745. [Google Scholar] [CrossRef] [PubMed] [Green Version]
  26. Zhang, Y.; Yang, Y.; Zhang, Q.; Duan, R.; Liu, J.; Qin, Y.; Wang, X. Toward Multi-Stage Phenotyping of Soybean with Multimodal UAV Sensor Data: A Comparison of Machine Learning Approaches for Leaf Area Index Estimation. Remote Sens. 2023, 15, 7. [Google Scholar] [CrossRef]
  27. Mananze, S.; Pôças, I.; Cunha, M. Retrieval of maize leaf area index using hyperspectral and multispectral data. Remote Sens. 2018, 10, 1942. [Google Scholar] [CrossRef] [Green Version]
  28. Zhang, S.H.; Duan, J.Z.; He, L.; Jing, Y.H.; Guo, T.C.; Wang, Y.H.; Feng, W. Wheat yield estimation from UAV platform based on multi-modal remote sensing data fusion. Acta Agron. Sin. 2022, 48, 1746–1760. [Google Scholar]
  29. Zhang, D.Y.; Han, X.X.; Lin, F.F.; Du, S.Z.; Zhang, G.; Hong, Q. Estimation of winter wheat leaf area index using multi-source UAV image feature fusion. Trans. Chin. Soc. Agric. Eng. (Trans. CSAE) 2022, 38, 171–179. [Google Scholar]
  30. Luo, S.; Wang, C.; Xi, X.; Nie, S.; Fan, X.; Chen, H.; Yang, X.; Peng, D.; Lin, Y.; Zhou, G. Combining hyperspectral imagery and LiDAR pseudo-waveform for predicting crop LAI, canopy height and above-ground biomass. Ecol. Indic. 2019, 102, 801–812. [Google Scholar] [CrossRef]
  31. Campos, I.; González-Gómez, L.; Villodre, J.; Calera, M.; Campoy, J.; Jiménez, N.; Plaza, C.; Sánchez-Prieto, S.; Calera, A. Mapping Within-Field Variability in Wheat Yield and Biomass Using Remote Sensing Vegetation Indices. Precis. Agric. 2019, 20, 214–236. [Google Scholar] [CrossRef]
  32. Hunter, F.D.L.; Mitchard, E.T.A.; Tyrrell, P.; Russell, S. Inter-Seasonal Time Series Imagery Enhances Classification Accuracy of Grazing Resource and Land Degradation Maps in a Savanna Ecosystem. Remote Sens. 2020, 12, 198. [Google Scholar] [CrossRef] [Green Version]
  33. Dhillon, M.S.; Dahms, T.; Kuebert-Flock, C.; Borg, E.; Conrad, C.; Ullmann, T. Modelling crop biomass from synthetic remote sensing time series: Example for the DEMMIN test site, Germany. Remote Sens. 2020, 12, 1819. [Google Scholar] [CrossRef]
Figure 1. Workflow diagram of the overall test.
Agronomy 13 00899 g001
Figure 2. Pearson correlation coefficient between LAI and all-band hyperspectral reflectance at different growth stages.
Agronomy 13 00899 g002
Figure 3. Ramie LAI estimation models based on hyperspectral data at different growth stages.
Agronomy 13 00899 g003
Figure 4. LAI estimation models based on multispectral data of ramie at different growth stages.
Agronomy 13 00899 g004
Figure 5. Ranking of correlation results between multispectral characteristic data and ramie LAI.
Agronomy 13 00899 g005
Figure 6. Correlation coefficient between texture features and LAI of ramie.
Agronomy 13 00899 g006
Figure 7. Difference of reflection spectra of two sensors in the same band.
Agronomy 13 00899 g007
Figure 8. Correlation analysis between LAI of ramie at different growth stages and spectral characteristic values of two sensors. (a) Correlation coefficient between PT4 and LAI. (b) Correlation coefficient between FS3 and LAI.
Agronomy 13 00899 g008
Table 1. Parameters of UAV multispectral camera.
NumberBand NameCenter Wavelength (nm)Half Width (nm)
1Blue band45016
2Green band56016
3Red band65016
4Near infra-red band84026
5Red-edge band73016
Table 2. Statistical analysis of ground LAI during different growth stages.
StageNumberMin (cm)Max (cm)Mean (cm)CV (%)
Seedling stage760.914.212.3932.21
Closure stage761.174.312.8323.29
Prosperous stage762.575.194.2910.85
Mature stage761.64.672.9723.75
Whole-growth stage3040.915.193.3626.85
Table 3. LAI estimation of ramie based on hyperspectral data throughout the growth period.
ModelTraining SetValidation Set
R2RMSER2RMSE
SVR0.6140.6490.6080.629
PLSR0.6160.6480.6200.620
RF0.9440.2480.7020.548
Linear0.6560.6130.6570.589
Table 4. LAI estimation of ramie based on multispectral data throughout the growth period.
ModelTraining SetValidation Set
R2RMSER2RMSE
SVR0.7940.4370.7940.439
PLSR0.7860.4460.7840.449
RF0.9640.1820.8160.414
Linear0.9370.2420.5550.645
Table 5. LAI estimation models of different growth periods constructed using spectral subsets of two sensors.
StageSensorTraining SetValidation Set
R2RMSER2RMSE
Seedling stageFS30.6060.4720.7540.391
PT40.5660.4550.7080.467
Closure stageFS3FS30.5050.3210.446
PT4PT40.3760.6450.396
Prosperous stageFS30.3400.3570.4720.372
PT40.2980.3680.0720.493
Mature stageFS30.5780.4690.2430.562
PT40.4980.4530.6770.461
Whole-growth stageFS30.9440.2280.7230.508
PT40.6940.5330.7410.492
Table 6. Universal estimation model of ramie LAI by integrating two types of remote sensing data.
ModelTraining SetValidation Set
R2RMSER2RMSE
SVR0.8260.4020.7870.446
PLSR0.8190.8190.8080.423
RF0.9660.1790.8280.400
Linear0.9580.1990.4330.728
Disclaimer/Publisher’s Note: The statements, opinions and data contained in all publications are solely those of the individual author(s) and contributor(s) and not of MDPI and/or the editor(s). MDPI and/or the editor(s) disclaim responsibility for any injury to people or property resulting from any ideas, methods, instructions or products referred to in the content.

