Article

Accurate Detection Algorithm of Citrus Psyllid Using the YOLOv5s-BC Model

1
Guangdong Laboratory for Lingnan Modern Agriculture, College of Electronic Engineering, College of Artificial Intelligence, South China Agricultural University, Guangzhou 510642, China
2
Pazhou Lab, Guangzhou 510330, China
3
Division of Citrus Machinery, China Agriculture Research System of MOF and MARA, Guangzhou 510642, China
*
Author to whom correspondence should be addressed.
Agronomy 2023, 13(3), 896; https://doi.org/10.3390/agronomy13030896
Submission received: 31 January 2023 / Revised: 19 February 2023 / Accepted: 13 March 2023 / Published: 17 March 2023
(This article belongs to the Special Issue Precision Operation Technology and Intelligent Equipment in Farmland)

Abstract

:
Citrus psyllid is the main vector of Huanglongbing, and as such, it is responsible for huge economic losses across the citrus industry. The small size of this pest, difficulties in data acquisition, and the lack of target detection algorithms suitable for complex occlusion environments inhibit detection of the pest. The present paper describes the construction of a standard sample database of citrus psyllid in multi-focal lengths and out-of-focus states in the natural environment. By integrating the attention mechanism and optimizing the key module of BottleneckCSP, YOLOv5s-BC, we have created an accurate detection algorithm for small targets. Based on YOLOv5s, our algorithm incorporates an SE-Net channel attention module into the Backbone network and improves the detection of small targets by guiding the algorithm to the channel characteristics of small-target information. At the same time, the BottleneckCSP module in the neck network is improved, and extraction of multiple features of recognition targets is improved by the addition of a normalization layer and SiLU activation function. Experimental results based on a standard sample database show the recognition accuracy (intersection over union (IoU) = 0.5) of the YOLOv5s-BC algorithm for citrus psyllid to be 93.43%, 2.41% higher than that of traditional YOLOv5s. The accuracy and recall rates are also increased by 1.31% and 4.22%, respectively. These results confirm that the YOLOv5s-BC algorithm has good generalization ability in the natural context of citrus orchards, and it offers a new approach for the control of citrus psyllid.

1. Introduction

Citrus Huanglongbing (HLB) is a devastating disease which affects citrus plants and is caused by infestation of the phloem by Gram-negative bacteria. Symptoms of HLB in citrus fruit trees include yellowing and mottling of the leaves, reduced leaf size, and stunted growth. Fruits from infected trees have a bitter taste and may have a yellow-green or greenish-brown color. Other symptoms of HLB include a decrease in fruit production, premature fruit drop, and twig dieback. The disease can cause huge economic losses to the global citrus industry [1]. Detection of HLB typically includes field diagnosis and laboratory biochemical analysis, with field diagnosis relying on manual diagnosis and identification. While this is a simple and easy method which does not require equipment, the environment of a citrus orchard is complex. Thus, it is difficult to achieve sufficient accuracy from the subjective judgment of inspectors [2,3]. Biochemical analyses are complex and time consuming [4]. Furthermore, current methods require significant professional knowledge and skill as well as technology that is difficult to apply to citrus orchards [1]. Citrus psyllid is recognized as the main vector of HLB [5]; thus, development of accurate detection technology for this pathogen will contribute to controlling and preventing the transmission of HLB.
Recent rapid developments in deep-learning theory have produced deep-learning methods that can automatically extract features of targets from training data sets, learn more advanced data–feature representation, and solve problems such as target detection. A deep-learning target detection algorithm based on a convolutional neural network (CNN) is widely used in agricultural scenes [6,7,8]. Compared with traditional target detection algorithms, the parameter weights of deep-learning target detection algorithms are obtained by inputting a large amount of data and performing repeated training and iterative learning. Therefore, detection results are more accurate with high adaptability and robustness [9]. One typical type of deep-learning target detection algorithm is based on region proposal; representative algorithms of this type include R-CNN [10], Fast R-CNN [11], Faster R-CNN [12], and SPP-NET [13]. Other target detection algorithms are based on regression; using the idea of end-to-end, images are scaled to unified sizes and normalized, then entered directly into the CNN to predict the target category and location information by regression. Representative algorithms include the YOLO (You Only Look Once) series [14] and SSD (Single Shot multiBox Detector) series [15].
A variety of solutions based on CNN have been proposed to accurately identify orchard diseases and pests in the natural environment. You et al. [16] reported a classification method for citrus diseases and pests based on compressed CNN and suitable for mobile terminals, which was trained and tested using a data set of 16,528 images, including 14 citrus diseases and pests. The classification accuracy reached 93.2%. Xing et al. [17,18] carried out a series of studies on the classification of citrus pests: First, they constructed a data set of 12,561 images, including 24 categories of citrus pests and diseases and 359 images of citrus psyllid. Second, they proposed classification models of citrus diseases and pests, namely, WeaklyDenseNet and BridgeNet-19. The classification accuracies were reported as 93.42% and 95.47%, respectively, and the model sizes were 30.5 MB and 69.8 MB, respectively. Ku et al. [19] proposed a two-stage pest detection and identification method based on improved CNN, which uses the Xception model to re-identify CNN output results. However, pest detection only remained successful during model construction and was not realized in specific applications. Wang et al. [20] combined an embedded image processing technology to create a real-time citrus pest detection system based on deep CNN. MobileNet was selected as the pest-image-feature extraction network. The regional candidate network generated the preliminary position candidate box of pests, and classification and positioning of the candidate box were determined through Faster R-CNN. The recognition accuracies were 91.0% and 89.0%, respectively, and the average processing speed of a single frame image was reportedly as low as 286 ms. Li et al. [21] proposed a rape-pest-detection method based on deep CNN, which enables the rapid and accurate detection of five rape pests: aphids, cabbage caterpillar larvae, vegetable bugs, jumping beetles, and ape leaf beetles, with an average accuracy of 94.12%. Yang et al. [22] proposed a method to improve YOLOv5s, which detects apple-flower growth state, by improving the cross-stage local network module, adjusting the number of modules, and designing a Backbone network combined with the collaborative attention module to improve detection performance and reduce parameters. Combined with the new detection scale and the convolution operation based on splitting, the feature-fusion network aimed to improve the feature-fusion ability of the network. Finally, CIoU was selected as the loss function of border regression to achieve high-precision positioning; its mAP reaches 92.2%, 5.4% higher than that of YOLOv5s.
Considering that the existing target detection algorithm is not ideal for detecting small targets with a length of 1 mm to 10 mm, the present study incorporated the advantages of the YOLOv5s algorithm in terms of target detection and combined it with an SE-Net attention module, with the aim of detecting the small-sized citrus psyllid. To this end, the SE-Net attention module is introduced in the 8th and 10th layers of the Backbone structure, and the convolution layer in the BottleneckCSP module of YOLOv5s algorithm is replaced by a convolution module with a normalization layer and SiLU activation function to form the BottleneckCSP_C module. This paper presents our proposed algorithm and compares it with the other seven target detection algorithms in different scenarios. This study provides a reference for researchers and industry interested in the accurate detection of citrus psyllid.

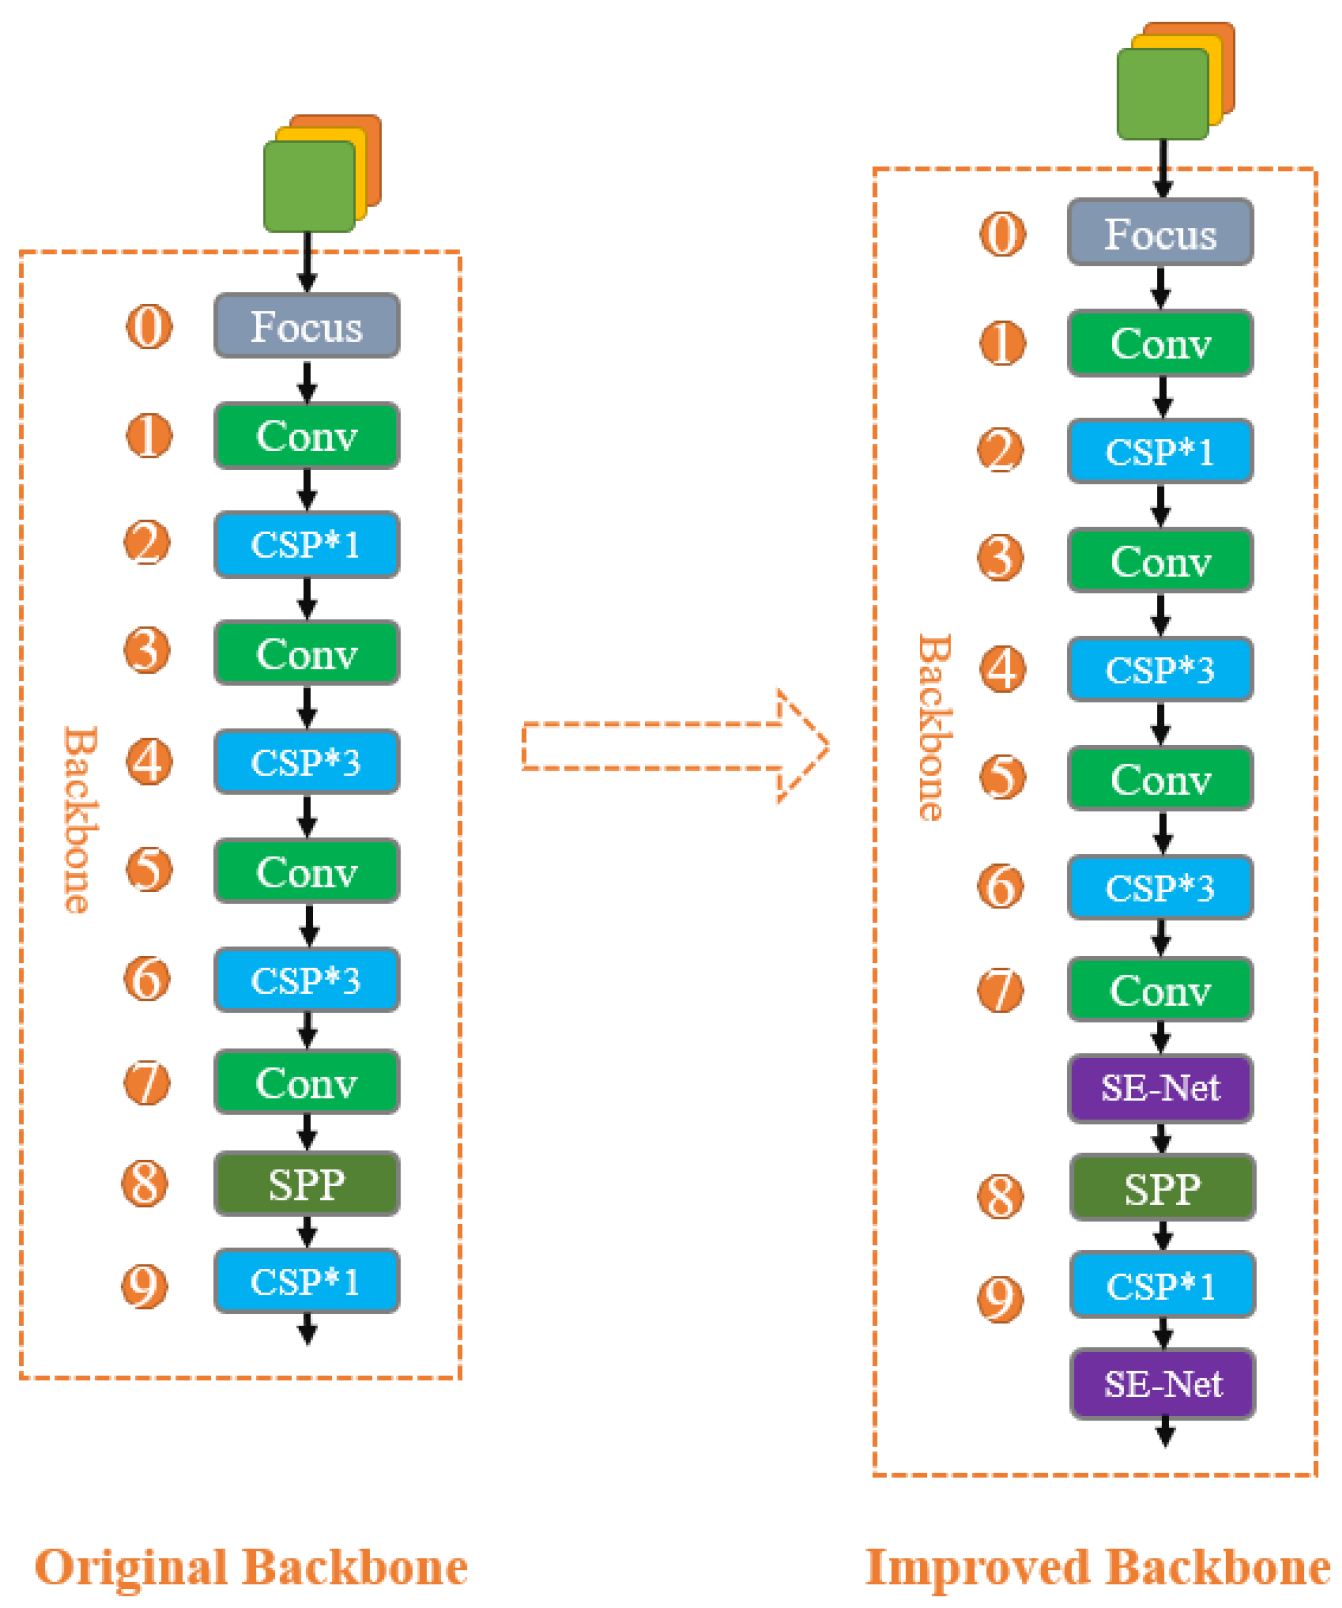
2. Analysis and Design of YOLOv5s-BC Algorithm

2.1. YOLOv5s Algorithm

YOLOv5s is a single-stage target detection algorithm released by Uitralytics LLC. Compared with YOLOv5m, it has fewer parameters and faster detection speed. Compared with YOLOv5n, it has higher accuracy when the detection speed and model parameter quantity meet the deployment conditions of mobile hardware devices. Compared with YOLOv4, YOLOv5s has smaller mean weight files, less training times, and shorter reasoning speed, with less reduction in average detection accuracy. The structure of YOLOv5s is divided into four parts: Input, Backbone, Neck, and Prediction.
The input terminal mainly includes three parts: the mosaic data enhancement, image-size processing, and adaptive anchor-box calculation modules [23]. The mosaic data enhancement module combines four pictures to enrich the picture background; the image-size processing module adaptively adds the least-black edges to original images with different lengths and widths and uniformly scales them to standard sizes; based on the initial anchor box, the adaptive anchor-box calculation module compares the output prediction and real boxes, calculates the gap, then reversely updates and constantly and iteratively updates parameters to obtain the optimal anchor box value.
The Backbone network mainly includes the focus, BottleneckCSP, convolution module (Conv) and spatial pyramid-pooling module (SPP). The neck is a feature-fusion network which combines the feature pyramid network (FPN) and path aggression network and the conventional FPN layer with the bottom-up feature pyramid; it also fuses the extracted semantic features with location features, as well as the features of the trunk and detection layers, so that the model can better fuse multi-scale features and obtain richer feature information [24].
The prediction module outputs a vector that has the category probability of the target object, the score of the object, and the position of the boundary box of the object. The detection network is composed of three detection layers, with characteristic graphs of different sizes used to detect target objects of different sizes. Each detection layer outputs the corresponding vector, and it finally generates and marks the prediction bounding box and category of the target in the original image.
The YOLOv5s network uses residuals to avoid gradient disappearance/explosion, integrates multi-layer feature maps, and performs channel splicing through up-sampling and shallow features so that the shallow features also have deep-feature information. This can detect targets of different scales and predict multiple categories with high accuracy. The structure of the YOLOv5s algorithm is shown in Figure 1.

2.2. SE-Net Attention Module

An attention mechanism mimics the way the human brain processes visual information. By quickly observing the global information of an image, the brain identifies the candidate area to be focused on; that is, the location of focus, and will focus on this area to extract more detailed information about the target. Because this is a powerful and effective form of expression, it is widely used in deep learning, especially in deep-seated high-performance networks.
For the feature map with the number of channels C, each channel contains different feature information. During feature extraction, the convolution layer mainly calculates feature information of the adjacent positions of each feature map, without considering correlation mapping information between channels. Because the citrus psyllid is a small target, image resolution is low, and the pixel values and channel characteristic information are limited; therefore, the training of relevant channel characteristic information must be strengthened in the training process. By making use of SE-Nets, Hu et al. [25] ranked first in the ILSVRC 2017 classification competition. Their best model ensemble achieves a 2.251% top-5 error on the test set. It has been clearly demonstrated that the attention module of the SE-Net channel can optimize learning of specific categories of characteristic information in the deep network. The present study, therefore, added the SE-Net channel attention module to the Backbone structure of the YOLOv5s algorithm. By establishing a feature-mapping relationship between channels, the network can exploit global information and acquire more subtle features in the deep network of the Backbone structure so as to better fit the relevant feature information between small-target channels, while suppressing useless information.
The overall structure of an SE-Net is shown in Figure 2. Fsq refers to squeeze operation, Fex refers to excitation operation, and Fscale refers to scale operation. First, the Squeeze operation is performed using global pooling to compress the feature vectors (256, 512, 1024) of the three channel dimensions output by the original YOLOv5s network detection layer, obtain global information between the features of each channel, and change the feature graph U (H × W × C) into a scalar of 1 × 1 × C. Second, the two full connection layers establish a correlation model between channels, carry out nonlinear transformation between channel features, and output weight information of channel C. The ReLu activation function is then added between the two fully connected layers to increase nonlinearity between channels. Third, the Sigmoid function is applied to normalize the weight. Finally, features between channels are weighted by scaling, and the weights between channels are multiplied by the features of the original feature map to obtain new channel weights [25,26,27]. Thus, SE-Net improves the weight proportion between small-target channels and guides the algorithm to the relevant feature information of small targets, strengthens the training of these features, and improves the detection performance of the algorithm for long-distance small targets.
The detection performance of YOLOv5s is not ideal for small-target groups and missed detection is a serious limitation. In the neural network, the semantic information representation ability of the receptive field in the high-level network layer is strong, and the spatial detail information representation ability of the receptive field in the low-level network layer is strong. Spatial Pyramid Pooling (SPP) can increase the multi-scale pooling of high-level features by the YOLOv5s algorithm to increase the receptive field. We insert SE-Net before and after it to make the YOLOv5s algorithm focus on and retain more spatial details of citrus psylla, thus reducing the missed detection of citrus psylla. The attention module of the SE Net channel is introduced into the 8th and 10th layers of the Backbone network (Figure 3 and Table 1).

2.3. BottleneckCSP_C Module

BottleneckCSP is an important component module of feature extraction in the YOLOv5s algorithm. It is composed of multiple convolution modules (Conv), a bottleneck layer (Bottleneck), a convolution layer (Conv2d), and BatchNorm2d and SiLU activation functions. The convolution module is composed of a conv2d convolution layer, a batch normalization (BN) layer, and a SiLU activation function. The bottleneck layer is a 1 × 1 convolution followed by a 3 × 3 convolution, in which the 1 × 1 convolution halves the number of channels, and the 3 × 3 convolution doubles the number of channels before adding input to reduce the number of parameters. It is divided into three steps: first, Pointwise Convolution (PW) reduces the dimension of the data, then it convolutes the conventional convolution kernel, and finally, it increases the dimension of the data (Figure 4).
BottleneckCSP enhances the learning ability of the network and reduces the computing bottleneck and memory cost. It adopts the structure of a lightweight network, leading to reduced detection of small-target groups. The present study adds a BN layer to BottleneckCSP after the leftmost convolution layer to accelerate the target-extraction ability of the algorithm and improve stability. It introduces nonlinear factors with a SiLU activation function to form a convolution module (Conv), which is then used to form a BottleneckCSP_C module (Figure 5b). This strengthens the network’s ability to extract deep feature information of small-target groups. The improvement data of BottleneckCSP_C on algorithm performance is shown in Table 1.

2.4. Mosaic Data Enhancement

Due to the small size of citrus psyllid, it is very easy to it to be hidden in the actual orchard environment, which will have a great impact on the accuracy of target recognition. To solve the above problems, Mosaic data enhancement is introduced in this paper to improve the model’s ability to recognize occluded objects. Before each epoch, the algorithm will read images from the training set, generate new images through Mosaic data enhancement, then combine the newly generated images and the read images into training samples and input them to the model for training. Mosaic data enhancement randomly selects 4 images from the citrus psyllid training set. First, randomly prune the 4 selected images, then splice the cropped images onto a new image clockwise, and finally scale them to the set input size and transfer them into the model as new data. This enriches the background of the target, increases the number of small targets, and achieves the balance between targets of different scales. At the same time, in the process of random clipping, part of the training set image target box may be cut off, so as to simulate the effect of citrus psyllid being blocked by objects such as branches and leaves (Figure 6).

3. Experimental Design and Analysis

3.1. Experimental Data Collection and Data Set Construction

The experimental data set was collected in the citrus orchard of South China Agricultural University (Guangzhou, Guangdong, China) between July 2022 and September 2022. The peak periods of citrus psyllid activity are 9:00, 12:00 and 21:00. We chose 8:30–9:30 and 11:30–12:30 for data collection. In order to obtain samples of citrus psyllid under different natural light intensities, 16:00–17:00 was taken as the third supplementary collection time point, and the collection measures were taken every other day. The total collection time was about 45 days. We photographed adult citrus psyllid in new shoots, young leaves, and other parts of the fruit trees at a distance of 50–100 cm using a micro single digital camera (SONY Alpha 6400 APS-C frame) and hand-held photographic equipment (Xiaomi 9; Xiaomi, Beijing, China). We added 97 images of citrus psyllid taken by Chinese citrus experts or fruit farmers, and a total of 2660 images of citrus psyllid in orchards under a natural environment were obtained. We cut out the regions containing citrus psyllid with sizes of 900 × 900 or 600 × 600 pixels. Data could be divided into three groups according to quality: out-of-focus, close-range, or prospective data, with the number of data images being 1215, 1106, and 339 respectively. Out-of-focus and prospective data were relatively difficult to detect because of the severe lack of target features (Figure 7).
Before Mosaic data enhancement, we used general methods to further increase the amount of training data by enhancing the image, including randomly adjusting contrast, randomly adjusting brightness, adding Gaussian noise, adding gamma noise, Contrast Limited Adaptive Histogram Equalization, and using median blur, horizontal flip, vertical flip and transpose functions. Each original image randomly uses its two data enhancement methods to generate two new images. Including original images, the final data set contained 7980 images, which were divided into the training set (6384), verification set (798), and test set (798) based on a ratio of 8:1:1. The training set, verification set, and test set all contained self-collected images, images taken by citrus experts or fruit farmers, and XML files, which are files generated after annotation.

3.2. Experimental Parameters and Indicators

Windows 10 was used as the operating system with Intel (R) core (TM) i9-10900k CPU @3.70 GHz 3.70 GHz as the processing model. The memory was 32G, the GPU was GeForce RTX 3080, and the deep-learning framework used was Pytoch, Python3.6.5.
Two images were transmitted into the algorithm each time; the number of training epoch was 100, and the resolution of training and test images was set to 896 × 896 pixels. The adaptive momentum estimation method was used to update parameters, and the weight attenuation was set to 5 × 10⁻⁴, the momentum factor to 0.937, and a combination of preheating training and cosine annealing was used for learning rate attenuation. The updated formula is presented in Formula (1):
η t = η max ω   ·   η max   ·   T cur ÷ T warm 2 + ω   ·   η max ,       T cur T warm   η min + η max η min   ·   1 + cos π   ·   T cur ÷ T t ÷ 2 ,       T cur > T warm   η min   ,     T cur   T cos
where Tt is the total number of training epochs, taking Tt = 100; Twarm is the total number of warm-up training epochs, taking Twarm = 3; Tcos is the total number of training epochs using the cosine annealing method, taking Tcos = 85; Tcur is the current number of training epochs, with each training cycle increasing by 1; ηt is the learning rate of the current number of training epochs; ηmax is the maximum learning rate, taken as ηmax = 2.5 × 10⁻⁴; ηmin is the minimum learning rate, which is taken as ηmin = 2.5 × 10⁻⁶; and ω is the decay rate of warm-up training, taken as ω = 0.1.
The accuracy rate (P), recall rate (R), and average accuracy rate (mAP) are indicators of algorithm performance. P and R are used to evaluate the accuracy of algorithm detection, i.e., the precision rate and the comprehensiveness of algorithm detection (P) and the recall rate (R) [28], respectively. Single-category accuracy (AP) uses the integral method to calculate the accuracy, recall curve, and the area surrounded by the coordinate axis. The mAP value is the average of the AP values. Generally, the mAP value is calculated when IoU = 0.5; i.e., [email protected], where IoU is the intersection and union ratio, which is an important function for calculating mAP [29]. The specific formulas are as follows:
IOU = A B A B
P = TP TP + FP × 100 %
R = TP TP + FN × 100 %
AP = 0 1 P r dr × 100 %
mAP = i = 1 k AP i k × 100 %
In Formula (2), A and B are the prediction frame and real frame, respectively; the denominator is the intersection of two frames, and the numerator is the union of two frames. In Formulas (3) and (4), TP is true positive: the positive target is predicted to be positive; FP is false positive: false prediction of negative target as positive; FN is false negative: the positive target is incorrectly predicted to be negative. In Formula (5), P(r) is the smoothed accuracy rate and recall rate curve, and the integration operation is used to calculate the area occupied by the smoothed curve. In Formula (6), k is the number of categories, and APi represents the accuracy of the ith category, where i is the serial number. The number of categories in the present study was 1.

3.3. Ablation Contrast Experiment

Ablation experiments were conducted to analyze the impact of our proposed improvements to the original YOLOv5s algorithm and to verify the superiority of mixed-use modules. Experimental data are shown in Table 1. The above divided data were trained accordingly and the average of the obtained indicators taken as the final measurement standard. The original YOLOv5s without any improvement was considered the benchmark. In the table, +represents the mixed improvement of the module.
The P, R, and mAP of the original YOLOv5s were 88.20%, 83.31%, and 91.02%, respectively. Almost every index was improved by our changes, and the BottleneckCSP structure in Backbone and Neck was also improved. The mAP reached 92.40%, 91.49%, and 92.67%, representing increases of 1.38%, 0.47%, and 1.65%, respectively, relative to the benchmark. When the SE-Net attention module was introduced into the 8th and 10th layers of the Backbone structure simultaneously and the BottleneckCSP structure improved, the mAP reached 93.43%. Although P decreased compared with the introduction of the SE-Net attention module and BottleneckCSP structure in the Backbone, the mAP, P, and R increased by 2.41%, 1.31%, and 4.22%, respectively. In terms of [email protected], our improvement is limited, and YOLOv5s is good enough for practical application. However, the original YOLOv5s algorithm has a relatively low R value, which can cause more missed detections in practice. Our algorithm increased the R value from 83.31% to 87.53%, which could result in a significant improvement. This further verifies the feasibility of improving the scheme and the BottleneckCSP structure by inserting SE-Net attention modules into the 8th and 10th layers simultaneously. Table 2 shows the improved YOLOv5s-BC structure of this study.

3.4. Analysis of Different Attention Modules

In order to evaluate the impact of the SE-Net channel attention module on the YOLOv5s algorithm, this paper conducted experiments on the 7980 image datasets constructed and selected the CBAM channel attention module for comparison. CBAM is a simple yet efficient attention module for feed-forward convolutional neural networks. Given an intermediate feature map, our module sequentially inferred attention maps along two separate dimensions, channel and spatial, then the attention maps were multiplied to the input feature map for adaptive feature refinement. The results are recorded in Table 3, and the training process is shown in Figure 8. We observed that the algorithm with SE-Net is improved at different depths compared with the traditional YOLOv5s algorithm, and the increase in computational complexity is very small. Compared to CBAM, SE-Net’s R, [email protected] and [email protected]:.95 increased by 0.75%, 1.39% and 0.56% respectively. While it should be noted that the SE-Net itself adds depth, it does so in an extremely computationally efficient manner and yields good returns, even at the point at which extending the depth of the base architecture achieves diminishing returns.

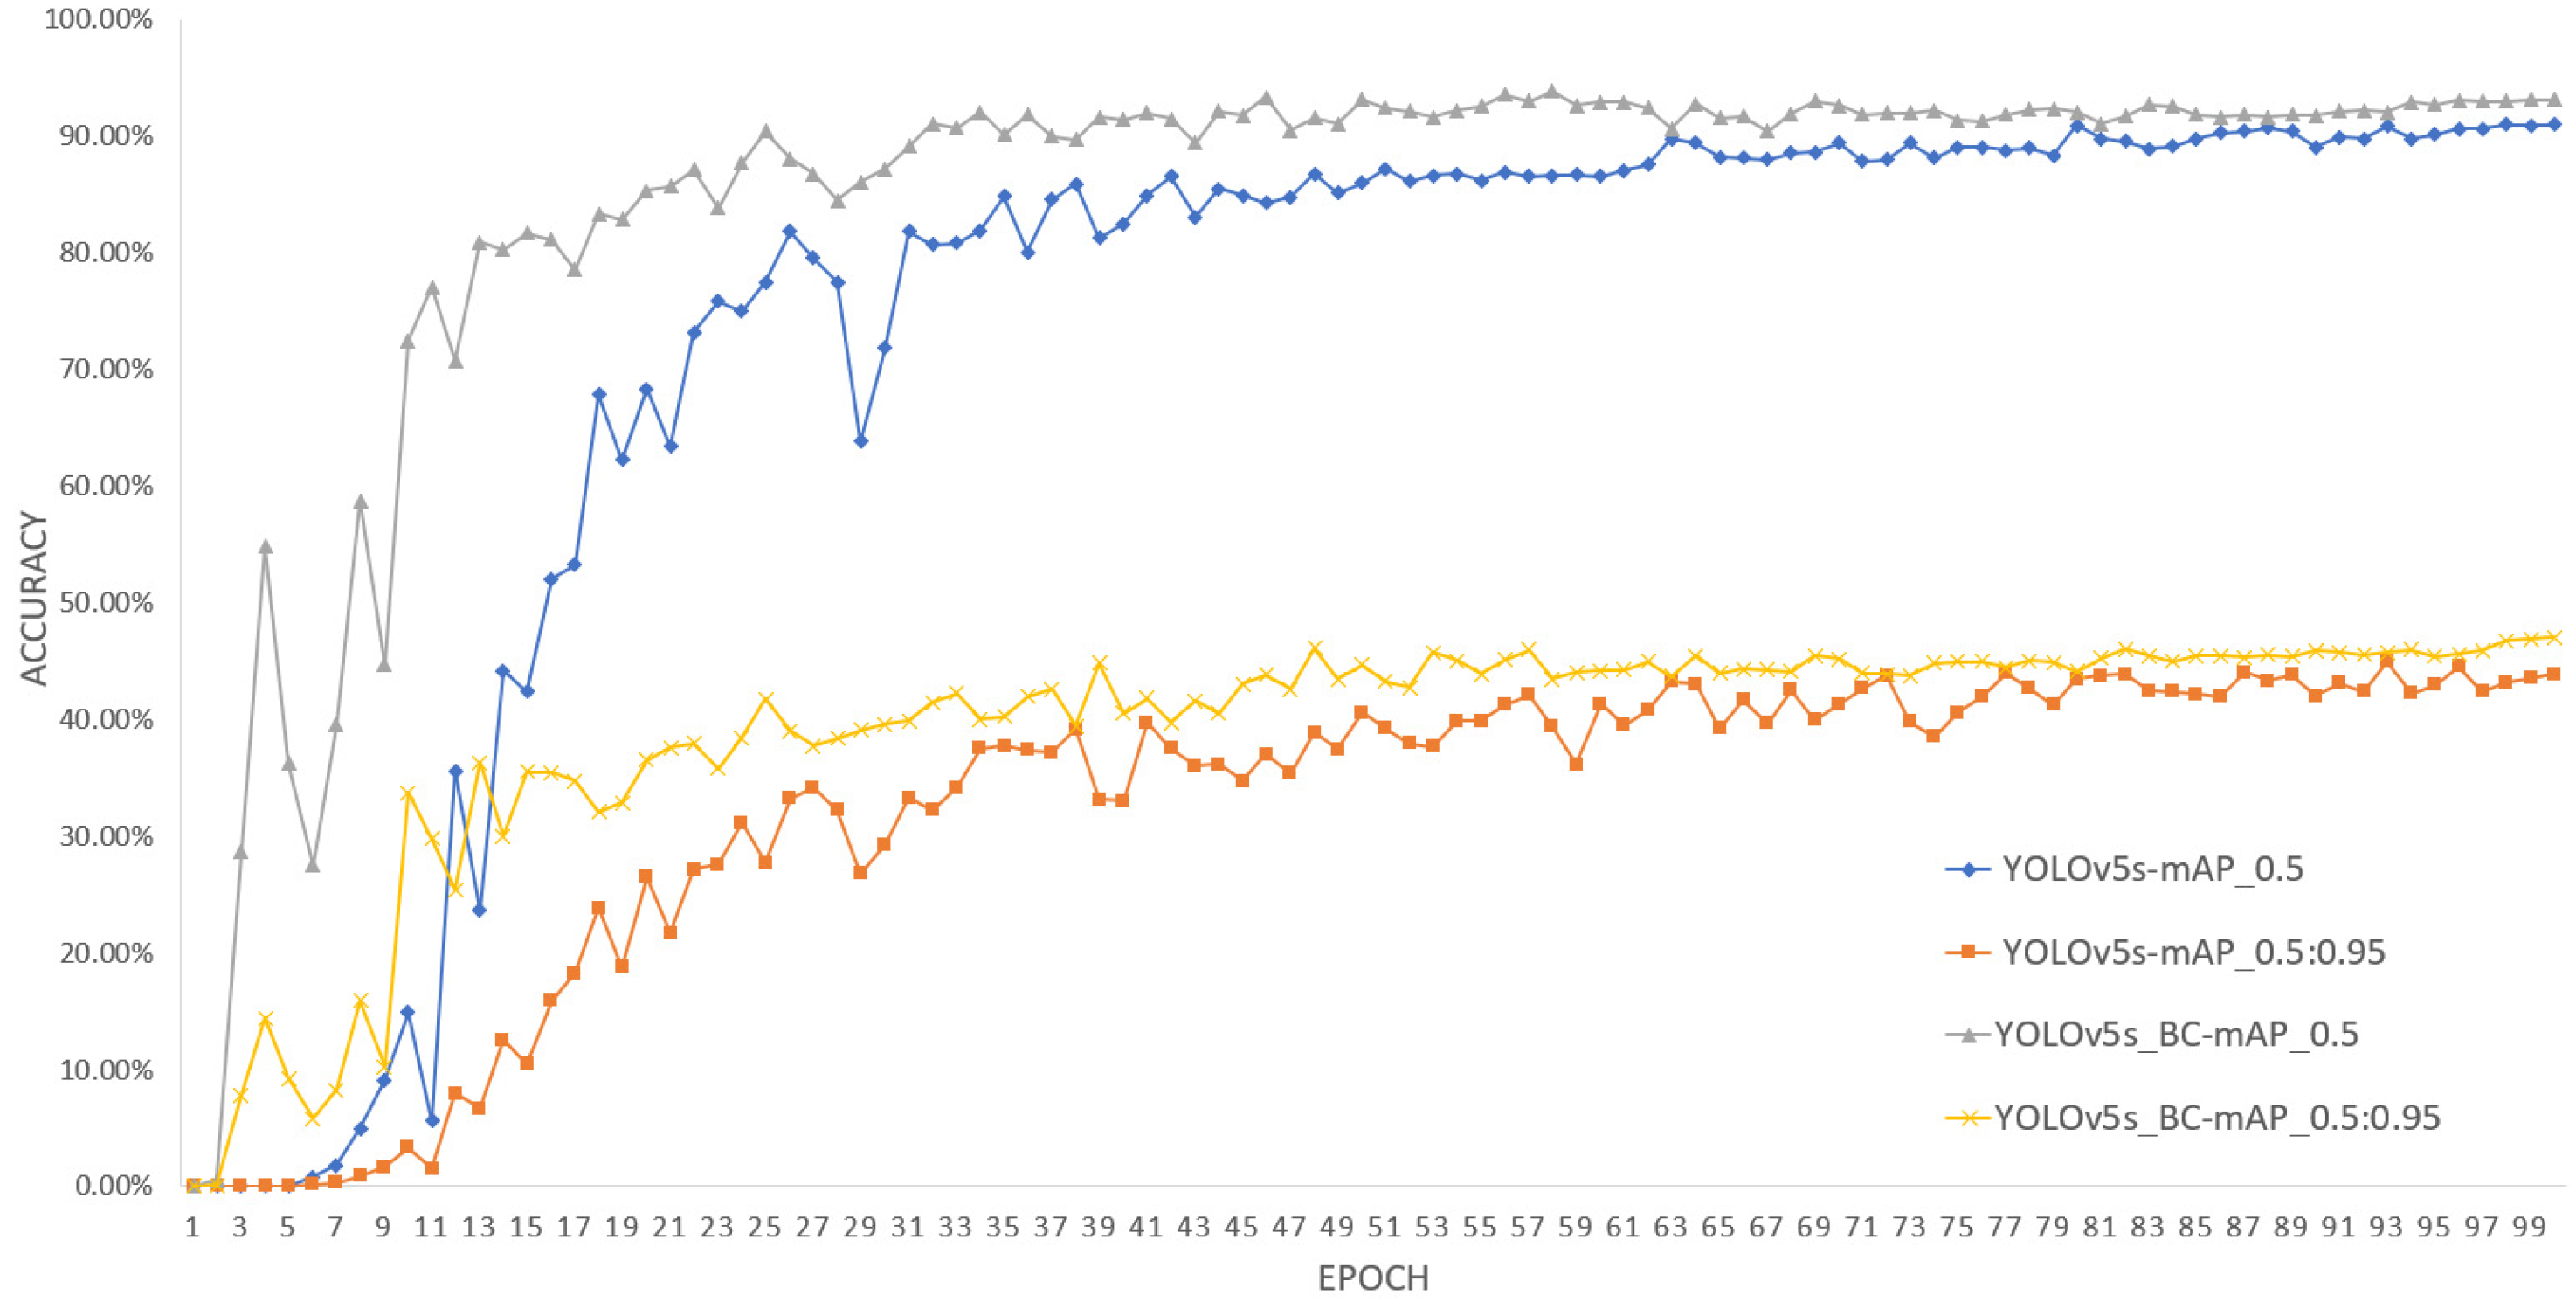
3.5. Training Results

The average accuracy comparison curve (Figure 9) illustrates the difference between the improved and original YOLOv5s algorithms after 100 rounds of training under the same configuration. The abscissa is the number of training rounds, and the ordinate is a numerical value; both are arbitrary units. The two algorithms converge rapidly in the first 40 rounds, then gradually stabilize. The training effect of the two algorithms is good until the end of training, and there are no fitting or under-fitting phenomena. The improved algorithm exhibits significant improvement in the average accuracy, which verifies the feasibility of our improved strategy.

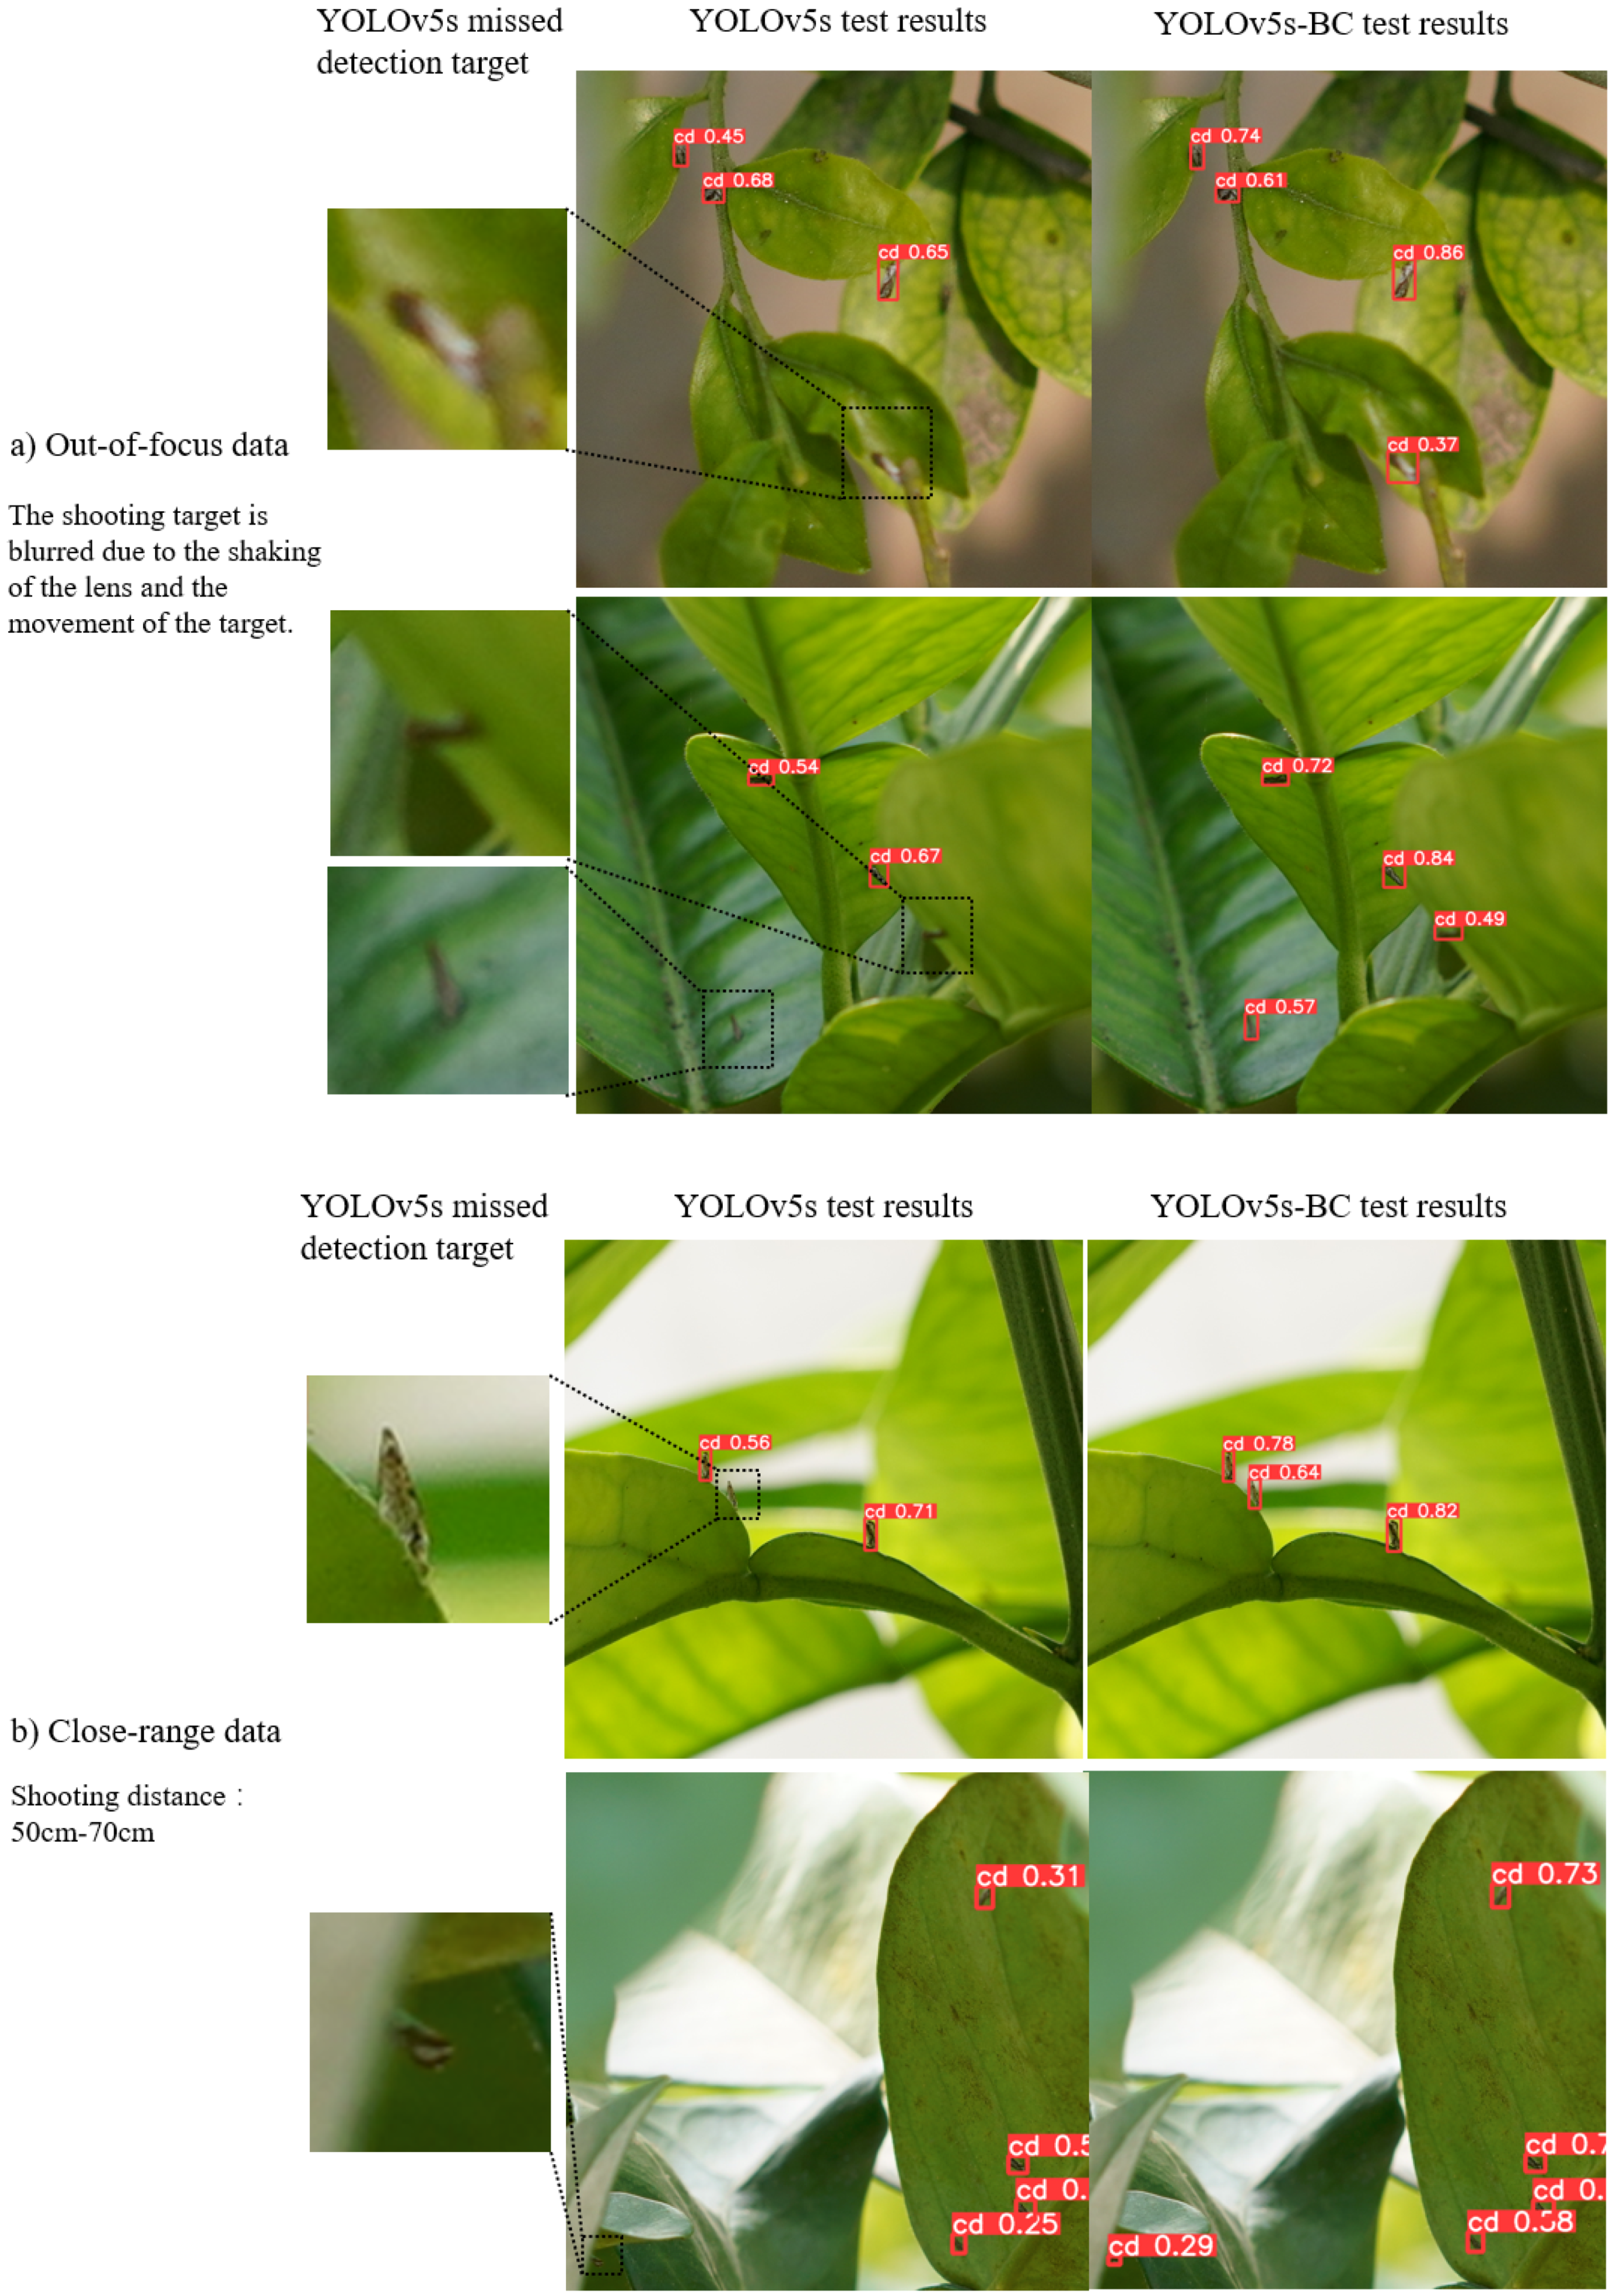
3.6. Comparison of Test Results

The improvement of YOLOv5s-BC compared with YOLOv5s is mainly seen in the detection of out-of-focus data targets (Table 4). The [email protected] and [email protected]:.95 increased by 2.55% and 0.36%, respectively. For close-range data targets, [email protected] and [email protected]:.95 increased by 0.32% and 3.79%, respectively. For prospective data targets, [email protected] and [email protected]:.95 increased by 0.15% and 0.21%, respectively. Comparison of test results from the YOLOv5s-BC and YOLOv5s algorithms for the three kinds of data (detection results for citrus psyllid from out-of-focus, close-range, and prospective data) are shown in Figure 10. The left side is the original YOLOv5s detection effect picture, and the right side is the YOLOv5s-BC algorithm detection effect picture. Adding the SE-Net attention module to the Backbone and using the BottleneckCSP_C module to replace the original BottleneckCSP module resulted in significant improvement in the detection of out-of-focus and close-range data targets for small targets, as well as good performance for small-target detection.

3.7. Comparison with Existing Target Detection Algorithms

Our improved algorithm was trained for 100 rounds with the existing target detection algorithms (YOLOv5s, YOLOv5m, YOLOv5x, YOLOv5l, YOLOv3, YOLOv3-tiny, and Faster R-CNN), using the same experimental parameters to compare its performance in detecting citrus psyllid from the data set that we collected using the consistent data division strategy (Table 5). The recall rate has been greatly improved by our changes, and the adaptability to small targets has increased. Compared with the region-based recommended target detection algorithm, Faster R-CNN R decreased by 0.85%, but P, [email protected], and [email protected]:.95 increased by 2.40%, 3.49%, and 2.39%, respectively. Compared with the regression-based target detection algorithm YOLOv3, P, R, [email protected], and [email protected]:.95 increased by 4.18%, 6.52%, 8.22%, and 4.37% respectively. Compared with the regression-based target detection algorithm YOLOv3-tiny, R decreased by 0.49%, but P, [email protected], and [email protected]:.95 increased by 3.30%, 3.91%, and 3.79%, respectively. Compared with the YOLOv5s algorithm before improvement, P, R, [email protected], and [email protected]:.95 increased by 1.31%, 4.22%, 2.41% and 3.19%, respectively.

3.8. Discussion

The YOLOv5 network contains three feature maps of different sizes to detect targets of different sizes. The original input image is sampled 8, 16, and 32 times down to obtain three feature maps of different sizes, which are then input into the feature-fusion network. Although there is rich semantic information after deep convolution, some positional information of the target will be lost in the process, which is not conducive to the detection of small targets [30]. Images with different resolutions will have an effect on the information obtained by the algorithm in this process. Therefore, we tried to input images of different resolutions into the model based on the YOLOv5-BC algorithm to explore the impact of images of different resolutions on the performance of the algorithm. The resolution of the experimental training set was 640 × 640 pixels and 1024 × 1024 pixels, and the image resolution of the test set was 640 × 640 pixels, 768 × 768 pixels, 896 × 896 pixels, and 1024 × 1024 pixels, respectively. According to the experimental results in Table 6, we determined that an increase in the image resolution greatly affects the detection accuracy of the algorithm, and the detection speed decreases with the increase in the image resolution. The 896 × 896 pixels resolution adopted by our training set and test set had the highest [email protected] value. In the subsequent experiment process, we will further explore how the input image resolution affects the algorithm’s [email protected] value to obtain better results and to deploy to hardware devices.

4. Conclusions

Citrus HLB causes huge economic losses to the global citrus industry, and citrus psyllid is the main vector responsible. Existing detection algorithms are limited for detecting citrus psyllid due to insufficient out-of-focus target and prospective data detection capabilities. We aimed to reduce the economic losses caused by HLB by developing an improved YOLOv5s-BC algorithm. The BottleneckCSP_C module replaces the BottleneckCSP module of the original YOLOv5s to expand the perception field. Furthermore, SE-Net attention modules are added to the 8th and 10th layers before and after SPP in the Backbone to further induce the model’s ability to acquire the shallow characteristics of citrus psyllid. We investigated the effectiveness of the improved YOLOv5s-BC algorithm through an ablation experiment, which revealed that the modified scheme can effectively improve the extraction ability of the algorithm with respect to shallow features such as color, size, and texture, and improve the comprehensive detection performance of the algorithm.
Compared with the original YOLOv5s algorithm, our modified YOLOv5s BC algorithm demonstrates improved accuracy and reduced missed detection of citrus psyllid, providing more possibilities for subsequent porting to hardware in real-world scenarios and verifying its effectiveness in improving performance. This algorithm will also be valuable for studying different small targets. However, due to the current lack of feature information for citrus psyllid in the prospective data, and the difficulties in extraction, the detection performance of the YOLOv5s-BC algorithm for citrus psyllid still requires improvement, which is presently ongoing.

Author Contributions

Conceptualization, S.L. and Z.L.; methodology, S.L. and Z.K.; software, Z.K.; validation, Z.K., Y.L. and Z.L.; formal analysis, S.L. and Z.K.; data curation, Z.K., J.X. and X.Z.; writing—original draft preparation, S.L. and Z.K.; writing—review and editing, Z.L.; visualization, Z.K.; supervision, S.L. and Z.L.; funding acquisition, S.L. and Z.L. All authors have read and agreed to the published version of the manuscript.

Funding

This research was funded by the National Natural Science Foundation of China (32271997, 31971797); General program of the Guangdong Natural Science Foundation (2021A1515010923); Special projects for key fields of colleges and universities in Guangdong Province (2020ZDZX3061); Lingnan Modern Agriculture Project (NT2021009); China Agriculture Research System of MOF and MARA (CARS-26); and the Basic and Applied Basic Research Project of Guangzhou Basic Research Plan in 2022 (202201010077).

Data Availability Statement

https://github.com/kzbkzb/YOLOv5s-BC accessed on 12 March 2023.

Acknowledgments

The authors would like to thank the anonymous reviewers for their criticisms and suggestions. We would also like to thank Xiaoling Deng and Jianqiang Lu for research data support.

Conflicts of Interest

The authors declare that the research was conducted in the absence of any commercial or financial relationships that could be construed as a potential conflict of interest.

References

  1. Lan, Y.; Zhu, Z.; Deng, X.; Lian, B.; Huang, J.; Huang, Z.; Hu, J. Monitoring and classification of citrus uanglongbing based on UAV hyperspectral remote sensing. Trans. Chin. Soc. Agric. Eng. 2019, 35, 92–100. (In Chinese) [Google Scholar]
  2. Zou, M.; Song, Z.; Tang, K.; Dong, P.; Zou, C. Comparing of micro extraction methods of DNA from citrus huanglongbing pathogen. Plant Quar. 2005, 271–274. (In Chinese) [Google Scholar]
  3. Luo, Z.; Ye, Z.; Xu, J.; Hu, G. Field diagnostic methods of Citrus Yellow Dragon disease. Guangdong Agric. Sci. 2009, 91–93. (In Chinese) [Google Scholar] [CrossRef]
  4. Planet, P.; Jagoueix, S.; Bové, J. Detection and characterization of the African citrus greening Liberobacter by amplification, cloning, and sequencing of the rpl KAJL-rpo BC operon. Curr. Microbiol. 1995, 30, 137–141. [Google Scholar] [CrossRef] [PubMed]
  5. Zhou, C. The status of citrus Huanglongbing in China. Trop. Plant Pathol. 2020, 45, 279–284. [Google Scholar] [CrossRef]
  6. Liu, H.; Zhang, L.; Shen, Y.; Zhang, J.; Wu, B. Real-time Pedestrian Detection in Orchard Based on Improved SSD. Trans. Chin. Soc. Agric. Mach. 2019, 29–35+101. (In Chinese) [Google Scholar]
  7. Li, L.; Zhang, S.; Wang, B. Plant disease detection and classification by deep learning—A review. IEEE Access 2021, 9, 56683–56698. [Google Scholar] [CrossRef]
  8. LeCun, Y.; Bengio, Y.; Hinton, G. Deep learning. Nature 2015, 521, 436–444. [Google Scholar] [CrossRef]
  9. Jing, L.; Wang, R.; Liu, H.; Shen, Y. Orchard Pedestrian Detection and Location Based on Binocular Camera and Improved YOLOv3 Algorithm. Trans. Chin. Soc. Agric. Mach. 2020, 51, 34–39+25. (In Chinese) [Google Scholar]
  10. Girshick, R.; Donahue, J.; Darrell, T. Rich feature hierarchies for accurate object detection and semantic segmentation. In Proceedings of the IEEE Conference on Computer Vision and Pattern Recognition, Columbus, OH, USA, 23–28 June 2014; pp. 580–587. [Google Scholar]
  11. Girshick, R. Fast R-CNN. In Proceedings of the IEEE International Conference on Computer Vision, Santiago, Chile, 7–13 December 2015; pp. 1440–1448. [Google Scholar]
  12. Ren, S.; He, K.; Girshick, R. Faster R-CNN: Towards real-time object detection with region proposal networks. IEEE Trans. Pattern Anal. Mach. Intell. 2017, 39, 1137–1149. [Google Scholar] [CrossRef] [Green Version]
  13. He, K.; Zhang, X.; Ren, S. Spatial pyramid pooling in deep convolutional networks for visual recognition. IEEE Trans. Pattern Anal. Mach. Intell. 2014, 37, 1904. [Google Scholar] [CrossRef] [Green Version]
  14. Redmon, J.; Divvala, S.; Girshick, R. You only look once: Unified, real-time object detection. In Proceedings of the IEEE Conference on Computer Vision and Pattern Recognition, Las Vegas, NV, USA, 26 June–1 July 2016. [Google Scholar]
  15. Liu, W.; Anguelov, D.; Erhan, D. SSD: Single shot multiBox detector. In Computer Vision–ECCV 2016: 14th European Conference, Amsterdam, The Netherlands, October 11–14, 2016, Proceedings, Part I; Springer: Berlin/Heidelberg, Germany, 2016. [Google Scholar]
  16. You, J.; Lee, J. Offline mobile diagnosis system for citrus pests and diseases using deep compression neural network. IET Comput. Vis. 2020, 14, 370–377. [Google Scholar] [CrossRef]
  17. Xing, S.; Lee, M.; Lee, K.-K. Citrus pests and diseases recognition model using weakly dense connected convolution network. Sensors 2019, 19, 3195. [Google Scholar] [CrossRef] [PubMed] [Green Version]
  18. Xing, S.; Lee, M. Classification accuracy improvement for small-size citrus pests and diseases using bridge connections in deep neural networks. Sensors 2020, 20, 4992. [Google Scholar] [CrossRef]
  19. Kuzuhara, H.; Takimoto, H.; Sato, Y. Insect pest detection and identification method based on deep learning for realizing a pest control system. In Proceedings of the 2020 59th Annual Conference of the Society of Instrument and Control Engineers of Japan (SICE), Chiang Mai, Thailand, 23–26 September 2020. [Google Scholar]
  20. Wang, L.; Lan, Y.; Liu, Z. Development and experiment of the portable real-time detection system for citrus pests. Trans. Chin. Soc. Agric. Mach. 2021, 37, 282–288. (In Chinese) [Google Scholar]
  21. Li, H.; Long, C.; Zeng Meng Shen, J. A detecting method for the rape pests based on deep convolutional neural network. J. Hunan Agric. Univ. (Nat. Sci.) 2019, 560–564. (In Chinese) [Google Scholar] [CrossRef]
  22. Yang, Q.; Li, W.; Yang, X.; Yue, L.; Li, H. Improved YOLOv5 Method for Detecting Growth Status of Apple Flowers. Comput. Eng. Appl. 2022, 237–246. (In Chinese) [Google Scholar]
  23. Masd, S.; Codire, L.; Morier, G. Evaluating the Single-Shot Multi Box Detector and YOLO Deep Learning Models for the Detectionof Tomatoes in a Green house. Sensors 2021, 21, 3569. [Google Scholar]
  24. Lin, T.; Dollar, P.; Girshick, R.B.; He, K.; Hariharan, B.; Belongie, S.J. Feature pyramid networks for object detection. In Proceedings of the 2017 IEEE Conference on Computer Vision and Pattern Recognition, CVPR, Honolulu, HI, USA, 21–26 July 2017; pp. 936–944. [Google Scholar]
  25. Hu, J.; Shen, L.; Sun, G. Squeeze-and-Excitation Networks. In Proceedings of the IEEE Conference on Computer Vision and Pattern Recognition (CVPR), Salt Lake City, UT, USA, 18–22 June 2018; IEEE Press: New York, NY, USA, 2018; pp. 7132–7141. [Google Scholar]
  26. Lin, X.; Liu, J.; Tian, S. Image description generation method based on multi-space mixed attention. J. Comput. Appl. 2020, 40, 985–989. (In Chinese) [Google Scholar]
  27. Cheng, M.; Gai, Y.; Da, F. A Stereo-Matching Neural Network Based on Attentio n Mechanism. Acta Opt. Sin. 2020, 40, 1415001. (In Chinese) [Google Scholar] [CrossRef]
  28. Hsu, W.; Lin, W. Adaptive Fusion of Multi-Scale YOLO for Pedestrian Detection. IEEE Access 2021, 110063–110073. [Google Scholar] [CrossRef]
  29. Liu, Y.; Liu, H.; Peng, J. Research on the Use of YOLOv5 Object Detection Algorithm in Mask Wearing Recognition. World Sci. Res. J. 2020, 6, 230–238. [Google Scholar]
  30. Lei, G.; Qiulong, W.; Wei, X.; Ji, G. A Small Object Detection Algorithm Based on Improved YOLOv5. J. Univ. Electron. Sci. Technol. China 2022, 2022, 251–258. [Google Scholar]
Figure 1. YOLOv5s structure.
Agronomy 13 00896 g001
Figure 2. SE-Net structure.
Agronomy 13 00896 g002
Figure 3. Comparison of Backbones before and after improvement.
Agronomy 13 00896 g003
Figure 4. Structure of BottleneckCSP.
Agronomy 13 00896 g004
Figure 5. BottleneckCSP and BottleneckCSP_C structure comparison. (ac) are the structural dia-grams of BottleneckCSP, BottleneckCSP_C, and Conv modules, respectively.
Agronomy 13 00896 g005
Figure 6. Mosaic data enhancement process.
Agronomy 13 00896 g006
Figure 7. Citrus psyllid data.
Agronomy 13 00896 g007
Figure 8. Comparison between SE-Net and CBAM.
Agronomy 13 00896 g008
Figure 9. Algorithm model training.
Agronomy 13 00896 g009
Figure 10. Comparison of test results.
Agronomy 13 00896 g010aAgronomy 13 00896 g010b
Table 1. Comparison table of ablation experiments.
ModelP/%R/%[email protected]/%
YOLOv5s88.2083.3191.02
YOLOv5s + SE-Net (10th layers)98.5186.0291.49
YOLOv5s + SE-Net (8th layers)90.2185.5392.40
YOLOv5s + SE-Net (8th and 10th layers)89.8188.0193.12
YOLOv5s + BottleneckCSP_C91.5286.0192.67
YOLOv5s + SE-Net (8th layers) + BottleneckCSP_C91.6387.0493.25
YOLOv5s + SE-Net (10th layers) + BottleneckCSP_C90.6387.0491.82
YOLOv5s + SE-Net (8th and 10th layers) + BottleneckCSP_C89.5187.5393.43
Table 2. YOLOv5s-BC network structure.
Serial NumberFromParamsModuleArguments
0−13530Focus(3, 32, 3)
1
2
3
4
5
6
7
8
9
10
11
12
13
14
15
16
17
18
19
20
21
22
23
24
25
26
−1
−1
−1
−1
−1
−1
−1
−1
−1
−1
−1
−1
−1
(−1, 6)
−1
−1
−1
(−1, 4)
−1
−1
(−1, 16)
−1
−1
(−1, 12)
−1
(19, 22, 25)
18,560
19,968
73,984
161,280
295,424
6,442,048
1,180,672
131,072
656,896
1,249,280
131,072
131,584
0
0
378,880
33,024
0
0
95,232
147,712
0
313,344
590,336
0
1,249,280
16,182
Conv
BottleneckCSP_C
Conv
BottleneckCSP_C
Conv
BottleneckCSP_C
Conv
SELayer
SPP
BottleneckCSP_C
SELayer
Conv
Upsample
Concat
BottleneckCSP_C
Conv
Upsample
Concat
BottleneckCSP_C
Conv
Concat
BottleneckCSP_C
Conv
Concat
BottleneckCSP_C
Detect
(32, 64, 3, 2)
(64, 64, 1)
(64, 128, 3, 2)
(128, 128, 3)
(128, 256, 3, 2)
(256, 256, 3)
(256, 512, 3, 2)
(512, 4)
(512, 512, (5, 9, 13))
(512, 512, 1, False)
(512, 4)
(512, 256, 1, 1)
(None, 2, ‘nearest’)
(1)
(512, 256, 1, False)
(256, 128, 1, 1)
(None, 2, ‘nearest’)
(1)
(256, 128, 1, False)
(128, 128, 3, 2)
(1)
(256, 256, 1, False)
(256, 256, 3, 2)
(1)
(512, 512, 1, False)
(1, ((10, 13, 16, 30, 33, 23), (30, 61, 62, 45, 59, 119), (116, 90, 156, 198, 373, 326)), (128, 256, 512))
Table 3. Comparison between SE-Net and CBAM insertion.
ModelP/%R/%[email protected]/%[email protected]:.95/%Parameters
YOLOv5s88.2083.3191.0243.837,255,094
YOLOv5s + SE-Net (10th layers)98.5186.0291.4942.617,386,166
YOLOv5s + SE-Net (8th layers)90.2185.5392.4044.367,386,166
YOLOv5s + SE-Net (8th and 10th layers)89.8188.0193.1247.027,517,238
YOLOv5s + CBAM (10th layers)89.9986.5491.3143.047,288,505
YOLOv5s + CBAM (8th layers)85.9888.1591.5544.627,288,505
YOLOv5s + CBAM (8th and 10th layers)89.8987.2691.7346.467,321,916
Table 4. Performance comparison table.
ModelDataP/%R/%[email protected]/%[email protected]:.95/%
YOLOv5sOut-of-focus data88.9184.2291.8447.15
Close-range data95.5595.6197.1252.47
Prospective data50.0154.5245.1212.35
YOLOv5s-BCOut-of-focus data96.8481.6794.3947.51
Close-range data95.7497.8397.4456.26
Prospective data54.4354.5545.2712.56
Table 5. Performance comparison with existing object detection algorithms.
ModelP/%R/%[email protected]/%[email protected]:.95/%Parameters
YOLOv5s88.2083.3191.0243.837,255,094
YOLOv5m91.3184.0289.0346.5721,485,814
YOLOv5x92.3184.0291.9347.1588,433,654
YOLOv5l96.5483.0292.2146.6747,393,334
YOLOv385.33 81.0185.2142.6561,523,734
YOLOv3-tiny86.21 88.0289.5243.238,669,876
Faster-RCNN87.1188.3889.9444.63-
YOLOv5s-BC89.5187.5393.4347.027,519,350
Note: [email protected] is the mAP when IOU is 0.5, [email protected]:.95 is the average number of mAP in steps of 0.05 when IOU is 0.5 to 0.95.
Table 6. Influence of image resolution on YOLOv5-BC algorithm performance.
Training Set img-SizeTest Set img-Size[email protected]/%[email protected]:.95/%Pre-Process/msInference/msNMS/msSpeed/ms
64064090.0647.031.06.22.49.6
76893.1545.931.28.21.911.3
89684.3187.261.87.41.912.1
102484.6641.682.48.71.712.8
89664089.6446.851.05.92.08.9
76891.9846.591.36.02.49.7
89693.4347.021.88.71.411.9
102491.4047.512.49.12.514.0
Disclaimer/Publisher’s Note: The statements, opinions and data contained in all publications are solely those of the individual author(s) and contributor(s) and not of MDPI and/or the editor(s). MDPI and/or the editor(s) disclaim responsibility for any injury to people or property resulting from any ideas, methods, instructions or products referred to in the content.

