Abstract
Due to frequent human disturbance and the influence of crop growth and development, the migration of soil organic carbon (SOC) in sloping farmland is considerably different to those in other ecosystems. The impacts of maize over its entire growth period on the SOC loss in sloping farmland on purple soils under different erosion stages were investigated, in 2016. This was undertaken using rainfall simulation tests on 15° slopes with a rainfall intensity of 1.5 mm·min−1, in Sichuan Province, China. In this study, erosion development, fluctuating increasing trends in the surface runoff yield, interflow runoff yield, sediment yield, and dissolved organic carbon (DOC) migration flux were observed. Opposite trends were observed in the DOC mass concentration, total soil organic carbon (TOC) content of the sediment, the SOC content of sediment particle state, the DOC content of the sediment, and the SOC enrichment ratio. The DOC migration flux in the surface runoff and in interflow of the rill erosion stage was 1.39–2.84, 3.22–7.78 times significantly higher than that of the sheet erosion stage at each maize growth stage, respectively (p < 0.05). The average DOC mass concentration in the surface runoff, the total DOC content of the sediment, and the SOC enrichment ratio in the sheet erosion stage increased by 100.58–146.44%, 44.44–126.15%, 141.32–191.26%, respectively, compared with the rill erosion stage. Under the experimental conditions, we found that DOC loss mainly occurred at the seedling and mature stages for maize. We also found that maize growth could promote the production of soil interflow, leading to intense soil loss occurring at the subsurface. Compared with DOC mass concentrations in the surface runoff, there was an increase of 4.90–28.29% in the soil interflow, indicating that soil interflow plays a more important role in DOC loss. The growth of maize could impact formation of surface runoff and interflow, reducing the loss of SOC caused by soil erosion. This study helps to understand the carbon loss process in agricultural production in purple soil areas.
1. Introduction
The soil is the largest terrestrial carbon pool [1], storing approximately four times more soil carbon than the aboveground vegetation and three times more than the atmosphere [2]. Soil organic carbon (SOC) has been shown to play an important role in responding to global climate changes and maintaining the carbon balance. It is also an important indicator of cultivated land productivity [3]. Therefore, SOC migration and its loss caused by soil erosion and especially water erosion have received and sustained universal attention worldwide. However, water erosion is one of the main driving factors in the redistribution of C in the terrestrial landscape and its output to aquatic systems [4]. Soil erosion results in runoff and sediment loss, which is accompanied by carbon loss. The migration of dissolved organic carbon (DOC) caused by soil erosion is a key factor in soil C loss, but also leads to water pollution and areas of unvegetated land. Some researchers have highlighted that long-term DOC increases may have wide-ranging impacts on freshwater biota, drinking water quality, coastal marine ecosystems, and upland carbon balances [3].
The role of soil erosion in terrestrial C sequestration and release remains an uncertainty in the potential of soil in mediating climate change [1]. The soil carbon pool is regulated by water erosion at the slope watershed scale, with SOC content and migration being strongly affected by rainfall. Rainfall is the main factor causing soil erosion and soil water movement and is one of the main driving forces affecting soil organic carbon migration. During rainfall events, larger particles are carried away by saltation and bed rolling processes while smaller particles are transported in suspension, resulting in soil coarsening and declining soil fertility [5]. The migration of soluble organic carbon with runoff at the soil–water interface may be one of the main mechanisms for soil organic carbon loss. Its migration and loss have substantial effects on the source and sink functions of the soil organic carbon pool [6].
The SOC is strongly disturbed by human farming activities. Due to frequent human disturbance and the influence of crop growth and development, the migration of SOC in agricultural ecosystems and especially in sloping farmland is considerably different to those in other ecosystems [7,8]. Some researchers have highlighted the fact that agricultural soil is a dynamic system that can change rapidly. Changes in topsoil SOC content caused by erosion are significant on a global scale, with erosion potentially causing extensive carbon loss [9]. DOC is an important component of soil carbon, and is also one of the most active and mobile carbon pools. It plays a key role in the cycling and distribution of nutrients and carbon both within and between ecosystems [10]. Previous studies have confirmed that the DOC concentration is significantly different with changing land use. Van Gaelen et al. [11] demonstrated that agricultural land use can lead to changes in DOC dynamics within the soil and leads to significant surface runoff. This enables a new pathway for DOC transfer from terrestrial to aquatic systems. The content and distribution of soil carbon in agricultural ecosystems are more complex. At present, there is considerable research being undertaken on soil carbon migration. However, this research has predominantly focused on water, forests, and swamp wetland ecosystems, with few studies having been undertaken on sloping farmland [12,13].
Carbon loss in agricultural ecosystems is important for global food security and deserves increased attention. In sloping farmland, the influence of crop growth on SOC cannot be ignored, such as that of maize. Maize is one of the main agricultural products in the southwest purple soil area, and is both human food and animal feed. On the one hand, the interception of rainfall by the aboveground part of maize reduces the loss of SOC due to soil erosion. Aboveground parts can also increase SOC input and content [14]. On the other hand, maize roots and root exudates can destroy or promote the formation of aggregates, leading to changes in soil structure and key soil properties, affecting soil corrosion resistance and organic carbon accumulation [15]. In addition, our previous study showed that the vegetation coverage of maize decreased the rill flow velocity and increased the flow resistance, and the maize mainly contributed to soil conservation by reducing the sediment carrying capacity of runoff [16]. Maize’s growth period is divided into seedling, jointing, tasseling, and maturity stages. The development of aboveground and underground parts of maize varies greatly at different growth stages, and the influences on key soil properties such as soil structure and water content are also different, and have different effects on soil erosion and organic carbon loss. However, the effects of different maize growth stages on soil erosion and SOC remain unclear and need further research.
As an important agricultural soil due to its natural fertility and high productivity, purple soil prevails in Southwest China and especially in Sichuan. Purple soils developed on Mesozoic Era (Triassic, Jurassic, and Cretaceous) and Tertiary sedimentary rocks have been classified as Pup–Orthic Entisols in the Chinese Soil Taxonomy, Eutric Regosol in the FAO (Food and Agriculture Organization of the United Nations) soil classification, or Entisols in the USDA Soil Taxonomy [17,18]. These soils have a low or medium soil shear-resisting capacity, a coarse texture, and are easily weathered [19]. Purple soil has high mineral nutrient content and is one of the main soil types in China, playing a key role in the national economy. However, the soil water storage capacity and infiltration capacity of purple soil are relatively low. This leads to a high runoff coefficient, representing one of the main causes of soil erosion and nutrient loss [20]. The erosive topographic conditions and abundant rainfall exacerbate this phenomenon in the purple soil region [16,19]. Accelerated soil erosion and the associated C losses are one of the main causes of declining agronomic productivity in these regions [21,22]. Therefore, research on the responses of soil carbon to crop growth during agricultural soil erosion in purple soil regions plays an active role. The findings of these studies can help us to understand the mechanisms of soil carbon loss and ensure the sustainable use of land resources.
This paper reported the results of a study conducted on a series of field observation experiments using artificial rainfall simulation equipment in the purple soil area of Ziyang, the upper Yangtze River Basin, Southwestern China. The specific objectives are as follows: (a) To determine the effects of different maize growth stages on soil erosion in sloping farmland under simulated rainfall conditions; (b) To examine the effects of the maize growth period on DOC migration in runoff under different erosion conditions; (c) To explore the effects of the maize growth period on SOC migration in sediment under different erosion conditions.
2. Materials and Methods
2.1. Experimental Site
The experimental site was located in Songtao, Yanjiang District, Zi-Yang City (104°34′12″–104°35′19″ E, 30°05′12″–30°06′44″ N), in Sichuan Province. The study site has a subtropical humid monsoon climate and moderate weather, with an average annual temperature of 16.8 °C. Eighty percent of the precipitation falls between May and September, with an annual average value of 965.8 mm. The area is dominated by purple soil formed on purple sandy shale geology, which is classified as Entisol according to USDA soil taxonomy (Soil Survey Staff 2014). It is usually 50–80 cm in depth, with a relatively light texture and poor soil fertility. Before the experiment, the topsoil (0–20 cm) contained 49% sand, 29% silt, 22% clay, 11.62 g organic carbon (C) kg−1, 0.73 g total nitrogen (TN) kg−1, 0.40 g alkaline hydrolysis nitrogen kg−1, 0.14 g available phosphorus (AP) kg−1, and 0.87 g rapidly available potassium kg−1. The soil pH was 7.5 and the bulk density was 1.21 g cm−3.
2.2. Experimental Design
In 2016, a 15°farmland slope was selected as the experimental site for rainfall simulation tests and was divided into 12 runoff plots. The runoff plots had similar dimensions, with a slope length of 2 m and a width of 1 m. To prevent water leakage, the underlying surface of each runoff plot was covered with concrete and then filled with 10 cm quartz sand. To simulate local farming practices, the experimental soil was artificially filled to no less than 60 cm in each plot, and then contour ridges were stacked on the soil surface. The contour ridges were 30 cm high and 50 cm wide, and the spacing between the two contour ridges was 60 cm. There were 4 groups of experiments with 3 replicates per group. At the end of each plot, “V” shaped cement was used as the water collection tank, and PVC pipes were used to connect the water collection tank with the runoff collection bucket. A soil interflow collection device was installed in each plot 20 cm underground.
To explore soil carbon loss during the entire maize growth period at different erosion stages, while maintaining the farming methods of local farmers, we selected maize as a common local economic crop (a commercial cultivar named “Zhenghong No. 6”). We planted the maize by direct seeding onto the soil ridges. Each plant was planted at 25 cm intervals, and each row was planted at 90 cm intervals. During April to August 2016, a series of rainfall simulation experiments were performed while there was no precipitation over a three-day period at different stages of maize growth including the seedling stage, jointing stage, tasseling stage, and at maturity. The slope of all the runoff plots was set to 15°, and the rainfall intensity was set to 1.5 mm·min−1. The rainfall test lasted 40 min and the count commenced when runoff occurred. The experimental equipment used was an SR-type field mobile artificial simulated rainfall device produced by the Institute of Soil and Water Conservation, Chinese Academy of Sciences. The nozzle system of the device was American V-80100, the rainfall height was 6 m, the effective rainfall area was 35 m2, and the rainfall uniformity coefficient was above 85%.
2.3. Runoff and Sediment Concentration
The volumetric measurement method was used for measuring the runoff. The soil sediment concentration was determined from mixed samples comprising runoff and soil sediment. The samples were collected at the outlet of the experimental plots using a 500 mL plastic bottle. During the simulated rainfall experiments, the samples were collected at intervals of 3 min. The mixed samples were retained, and the supernatant was poured out after the occurrence of precipitation prior to being dried at 65 °C. The concentration of the soil sediment was then calculated. The runoff supernatant was collected in 250 mL plastic bottles, adjusted to pH ≤ 2 with concentrated sulfuric acid, and then stored in a refrigerator (2–4 °C) for freezing.
2.4. Determination of the Soil Organic Carbon
The soluble organic carbon was determined using a TOC analyzer. The total organic carbon in the sediment and the soil particulate organic carbon were detected using the potassium dichromate volumetric method–external heating method.
The DOC mass concentration and the migration flux measured from the runoff samples were the average values for the three plots. For the DOC migration flux, the equation is as follows:
where Q is the migration flux of the surface runoff or interflow (mg m−2); C is the DOC mass concentration (mg L−1), and q is the runoff per unit area (L m−2).
2.5. Statistical Analyses
One-way ANOVA and LSD multiple comparison were carried out using SPSS software (version 20.0) and Origin software (version 8.0).
3. Results
3.1. Changes in the Runoff Yield and Sediment Yield from Soil Erosion
3.1.1. Changes in the Runoff Yield
For all the experiments, an increasing trend in runoff yield was observed over time. In different maize growth stages, the total surface runoff yield in the seedling stage, the jointing stage, the tasseling stage, and the maturity stage was 95.21, 79.57, 74.41, 92.12 L m−2, and 37.18, 94.79, 129.45, 65.34 L m−2 in soil interflow, respectively. The total runoff yield for surface was the largest at seedling stage, and the total runoff yield for soil interflow was the largest at tasseling stage. These results indicate that in the late growth period for maize, the root system deepened underground and covered a larger area. This increases the water movement path and improves the soil infiltration capacity, resulting in a decrease in the surface runoff and an increase in the soil interflow (Figure 1).
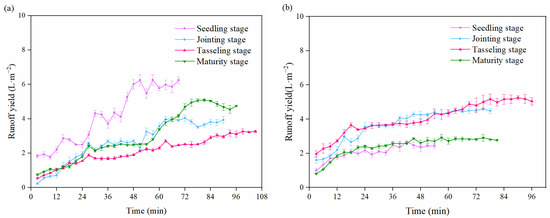
Figure 1.
The runoff yield of maize at different growth stages: (a) surface runoff; (b) interflow.
As the experiment progressed, the surface runoff yields gradually increased with continuous development of erosion. The total surface runoff yield in the rill erosion stages was 4.75 to 12.75 times higher that of the sheet erosion stages. The surface runoff yield increased from 1.83 to 6.24 L m−2, 0.23 to 3.93 L m−2, 1.17 to 3.27 L m−2, 0.75 to 4.75 L m−2 in the seedling stage, the jointing stage, the tasseling stage, and at the maturity stage, respectively. From the sheet erosion to the rill erosion, two sudden increases in the surface runoff yield occurred during the experiment. This shows that the development of gully erosion often leads to a substantial increase in surface runoff. The higher the degree of erosion, the more surface runoff occurs. However, the growth and development of maize can effectively inhibit surface runoff (Figure 2).
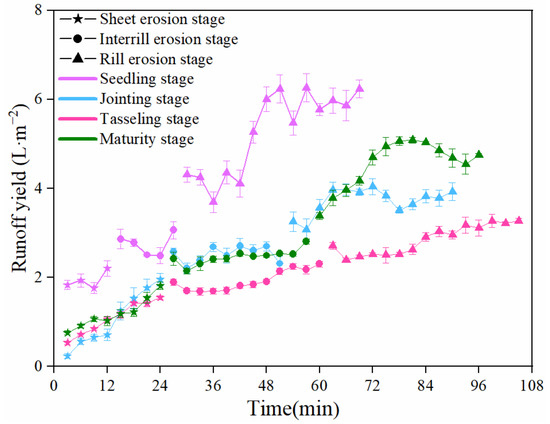
Figure 2.
Variation characteristics of surface runoff under different stages of erosion during the growth period of maize.
The runoff yield of the soil interflow gradually increased with continuous development of erosion. This shows that with the development of rills, more surface runoff is transformed into soil interflow. However, during the maize seedling stage, we observed that soil interflow did not occur in the sheet erosion stage (Figure 3).
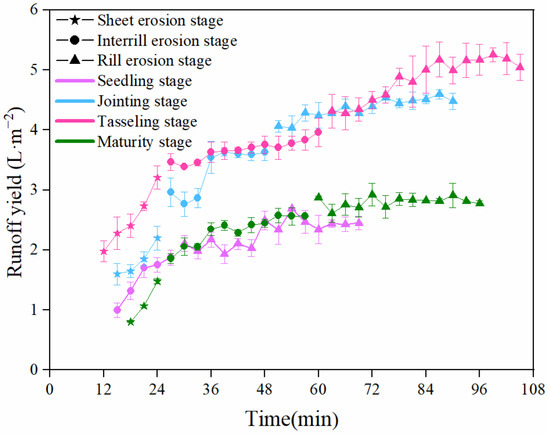
Figure 3.
Variation characteristics of interflow under different stages of erosion during the growth period of maize.
3.1.2. Changes in the Sediment Yield
Figure 4 and Figure 5 show the sediment yield in overland flow in the plots over time. As the experiment progressed, an increasing trend in the sediment yield was observed for maize at different growth stages. The total sediment yield for maize in each growth stage was ranked as seedling stage > maturity stage > jointing stage > tasseling stage. The total sediment yield for the seedling and mature stages was 48.54 to 134.39 g kg−1, which is more than that of the jointing and tasseling stages (Figure 4 and Figure 5).
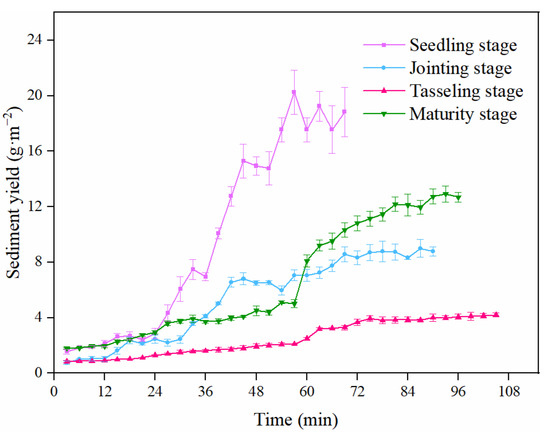
Figure 4.
The sediment yield of maize at different growth stages.
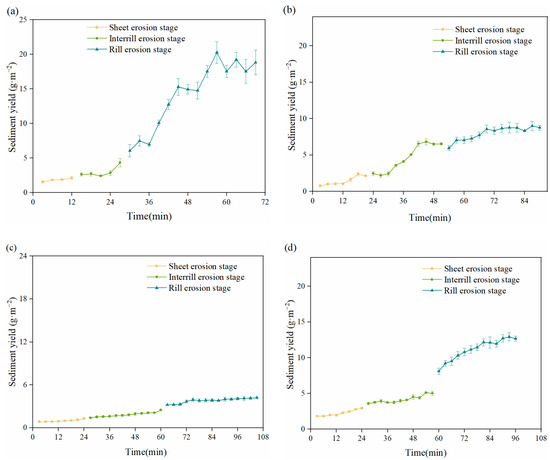
Figure 5.
Variation characteristics of sediment yield under different stages of erosion during the growth period of maize: (a) seedling stage; (b) jointing stage; (c) tasseling stage; (d) maturity stage.
During different erosion stages, the sediment yield slowly increased during the sheet erosion stage, increased rapidly during the interrill erosion stage and the rill erosion stage before gradually stabilizing. The total sediment yield at the sheet erosion stage and the interrill erosion stage was 6.53–25.78 times, 1.40–12.33 times lower, respectively, than that of the rill erosion stage. These results indicate that the maize jointing and tasseling stages have the best effect on reducing the sediment yield at different erosion stages (Figure 5).
3.2. Changes in the DOC Mass Concentration
3.2.1. Changes in the DOC Mass Concentration in Surface Runoff
Figure 6 and Figure 7 show the variation in DOC mass concentration in different maize growth stages and different erosion stages. In different maize growth stages, the DOC mass concentration increased and then decreased with fluctuation during the initial stages which was then followed by a steady state. The average DOC concentration in the surface runoff for maize at different growth stages ranged from 11.82 to 14.06 mg L−1. The average DOC mass concentration in the surface runoff during the tasseling stage was lower than that of the other growth stages but was not significantly different from that of the others (Figure 6 and Figure 7).
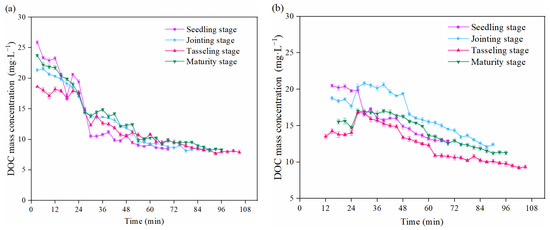
Figure 6.
The DOC mass concentration of maize at different growth stages: (a) surface runoff; (b) interflow.
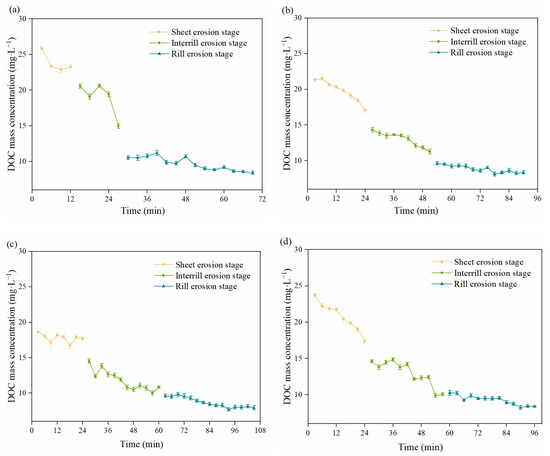
Figure 7.
Variation characteristics of DOC mass concentration in surface runoff under different stages of erosion during the growth period of maize: (a) seedling stage; (b) jointing stage; (c) tasseling stage; (d) maturity stage.
During different erosion stages, the average DOC mass concentration gradually decreased with the continuous development of erosion and showed the phenomenon of sheet erosion > interrill erosion > rill erosion. The average DOC mass concentration at the sheet erosion stage was 28.66–63.14%, which is 100.58–146.44% higher than that of the interrill erosion stage and was 100.58–146.44% higher than that of the rill erosion stage. These results indicate that soil erosion had a more pronounced effect on the DOC mass concentration, especially at the sheet erosion stage compared with the maize growth stages (Figure 7).
3.2.2. Changes in the DOC Mass Concentration in Soil Interflow
As shown in Figure 6b, in the different maize growth stages, the DOC mass concentration in the soil interflow increased and then decreased with fluctuation followed by a steady state. The average DOC concentration in the interflow of maize at different growth stages was from 12.40 to 16.70 mg L−1. The average DOC mass concentration in the seedling stage and the jointing stage was 1.89 to 4.30 mg L−1, which is more than that of the tasseling and mature stages. This result has shown that the DOC loss was more likely to occur during the early growth stage for maize (Figure 6b).
Under different erosion stages, the DOC mass concentration decreased with fluctuation in the rill stage and was followed by a steady state. Meanwhile, the DOC mass concentration fluctuated considerably during the interrill erosion stage, but still showed an overall downward trend. Compared with the interrill erosion stage, there was a decrease of 4.99–7.18% at the sheet erosion stage, and a decrease of 32.97–42.79% during the rill erosion stage. These results indicate that interrill erosion has a greater effect on DOC loss. We also found that the DOC mass concentration in the soil interflow was 4.90–28.29% higher than that of the surface runoff, indicating that soil interflow plays a more important role in DOC loss (Figure 6, Figure 7 and Figure 8).
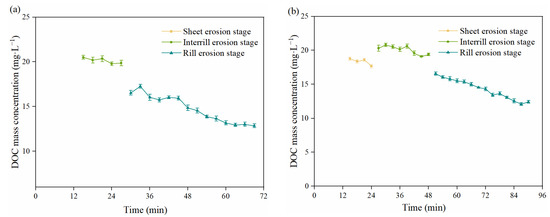
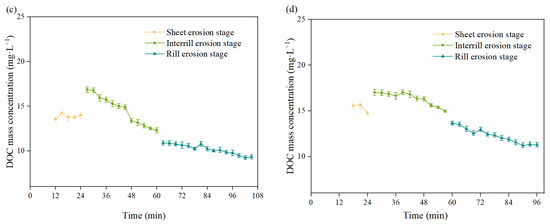
Figure 8.
Variation characteristics of DOC mass concentration in interflow under different stages of erosion during the growth period of maize: (a) seedling stage; (b) jointing stage; (c) tasseling stage; (d) maturity stage.
3.3. Changes in the DOC Migration Flux
3.3.1. Changes in the DOC Migration Flux in the Surface Runoff
Figure 9a shows the DOC migration flux in the surface runoff from the plots over time. In the entire experiment, the total DOC migration flux in the seedling stage, jointing stage, tasseling stage, and the maturity stage was 1141.35, 886.01, 790.33, 1084.44 mg m−2, respectively. The total DOC migration flux in the seedling and maturity stages was 22.40–44.41% more than that of the others. The results show that the maize jointing and tasseling stages had a strong inhibitory effect on the migration of DOC in surface runoff (Figure 9a).
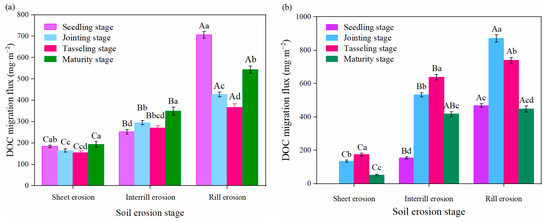
Figure 9.
The DOC migration flux of maize at different growth stages: (a) surface runoff; (b) interflow. One-way ANOVA to test for DOC migration flux differences in maize growth stages. In the figure, uppercase letters indicate the influence of erosion stage on surface runoff DOC migration flux, lowercase letters indicate the influence of maize growth period on surface runoff DOC migration flux. The same letter shows no significant difference, and different letters show significant difference (p < 0.05).
As the experiment progressed, the DOC migration flux increased in the surface runoff. The DOC migration flux in the surface runoff during the maize growth period was in the order of rill erosion > interrill erosion > sheet erosion. The DOC migration flux in the rill erosion stage was 1.39–2.84 times higher than that of the sheet erosion stage. The DOC migration flux in each erosion stage was significantly different, and the DOC migration flux in the rill erosion stage was significantly higher than that of other erosion stages (p < 0.05). The results show that the loss of DOC was closely related to the degree of soil erosion (Figure 9a).
3.3.2. Changes in the DOC Migration Flux in Soil Interflow
During the sheet erosion stage and the interrill erosion stage, the DOC migration flux at the tasseling period stage was 2.43–3.15 times higher than that of the other growth stages. It was significantly different from that of the other stages (p < 0.05). During the rill erosion stage, the DOC migration flux at the jointing stage was 17.85–94.50% higher than that of the other growth stages. There were significant differences in the DOC migration fluxes at different maize growth stages (p < 0.05), except the seedling and maturity stages. (Figure 9b).
With development of the rill erosion, the DOC migration flux in the soil interflow gradually increased. Except for the seedling stage, the DOC migration flux in the soil interflow for the rill erosion stage was 3.22–7.78 times higher than that of sheet erosion stage at each maize growth stage. The DOC migration flux in the soil interflow at each erosion stage was significantly different, and the DOC migration flux in the interflow at the rill erosion stage was significantly higher than that of other erosion stages (p < 0.05). We also found that the DOC migration flux in the soil interflow was higher than that of surface runoff, except the seedling stage of the sheet erosion stage. The results show that soil interflow has had a significant impact on soil DOC loss (Figure 9b).
3.4. Changes in SOC in Sediment
3.4.1. Changes in TOC Content in Sediment
Figure 10 and Figure 11 show the variation in TOC content in the sediment. We observed that the total TOC content decreased with fluctuation in different maize growth stages followed by a steady state. The TOC content of maize during each growth stage was ranked as tasseling stage > maturity stage > jointing stage > seedling stage. The TOC content at the tasseling stage was 8.54 to 46.68% more than that of the other stages. In the same growth stage for maize, the TOC content at each erosion stage showed considerable differences. During the seedling and jointing stage, the TOC content in the interrill erosion stage was 27.37–52.60% and 2.01–32.17% lower than that of the other stages, respectively. During the maturity stage, the TOC content at the rill erosion stage was 54.43–78.97% lower than that of the other stages. However, at the tasseling stage, there were no significant differences in the TOC content observed among the sheet erosion stage, interrill erosion stage, and the rill erosion stage. These results indicate that, compared with the degree of soil erosion, the SOC content in the sediment was more strongly affected by the period of maize growth (Figure 10 and Figure 11).
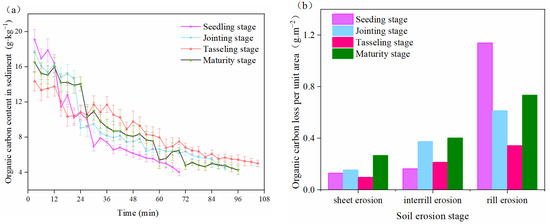
Figure 10.
Loss of organic carbon from sediment of maize at different growth stages: (a) the organic carbon content in sediment; (b) organic carbon loss per unit area.
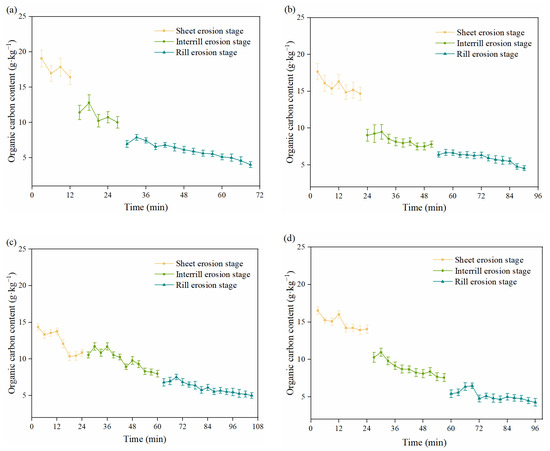
Figure 11.
Variation characteristics of organic carbon content of sediment under different stages of erosion during the growth period of maize: (a) seedling stage; (b) jointing stage; (c) tasseling stage; (d) maturity stage.
3.4.2. Changes in the SOC Content in the Sediment Particle State
Table 1 and Table 2 show the mass fraction and the SOC content in the sediment particle state under different erosion stages and different maize growth periods. In each maize growth period, the mass fraction and the SOC content in the sediment particle state were ranked as seedling stage > maturity stage > jointing stage > tasseling stage. In different stages of erosion, the mass fraction in the sediment particle state from high to low were the rill erosion, interrill erosion, and sheet erosion stages, respectively. However, the SOC content in the sediment particle state showed the opposite trend. The SOC content of the sediment particle state during the rill erosion stage was 49.45–68.79%, which is 12.32–17.03% higher than that of the sheet erosion stage and interrill erosion, respectively. The SOC content of the sediment particle state in each erosion stage was not significantly different (Table 1 and Table 2).

Table 1.
Mass fraction of sediment particle state in different stages of erosion during the growth period of maize. One-way ANOVA to test for mass fraction of sediment particle state differences in maize growth stages and erosion stages. Uppercase letters represent the influence of erosion stage on mass fraction of sediment particles, same letters show no significant difference, different letters mean significant (p < 0.05).
Table 2.
SOC content of sediment particle state under different stages of erosion during the growth period of maize. Different lowercase letters indicate significant differences in the SOC content of sediment particle state at different maize growth stages at p < 0.05.
Table 1 shows that there were significant differences in the mass fraction of the sediment particle state at different erosion stages during the seedling stage (p < 0.05). At the jointing and maturity stages, the mass fraction of the sediment particle state at the sheet erosion stage was significantly lower than that of the other erosion stages (p < 0.05). Table 2 shows that the SOC content of the sediment particle state at the seedling stage was significantly higher than that of the jointing stage and tasseling stage at the sheet erosion stage (p < 0.05). At the interrill erosion, the SOC content of the sediment particle state at the seedling stage was significantly higher than that of the tasseling stage (p < 0.05) (Table 1 and Table 2).
3.4.3. Changes in DOC Content in the Sediment
Table 3 shows the DOC content of sediment under different erosion stages and different maize growth periods. With the development of erosion, the DOC content of the sediment showed a decreasing trend. The DOC content of sediment in the sheet erosion stages was 9.21–81.48%, 44.44–126.15% higher that of the interrill erosion and the rill erosion stages, respectively. We observed that the DOC content of sediment at the maturity stage was lower than that of the other maize growth stages (Table 3).
Table 3.
Sediment DOC content under different stages of erosion during the growth period of maize. Different Uppercase letters indicated that the DOC content at different erosion stage was significantly different (p < 0.05).
3.4.4. SOC Enrichment in Sediment
As shown in Table 4, the SOC enrichment ratio in sediment displayed a similar pattern. The SOC enrichment in the sediment is relatively pronounced, and the more severe the erosion, the lower the SOC enrichment ratio. During the entire maize growth period, the SOC enrichment ratio in the sheet erosion stages was 48.98–74.70%, and 141.32–191.26% higher that of the interrill erosion and rill erosion stages, respectively. No obvious regularity was observed in the SOC enrichment ratio for maize at different growth stages at the same erosion stage (Table 4).
Table 4.
Enrichment ratio of organic carbon under different stages of erosion during the growth period of maize.
4. Discussion
4.1. Impacts of Different Erosion Stages on Runoff Yield, Sediment Yield and Carbon Loss
Soil erosion is a complex phenomenon involving dispersion, diversion and deposition of soil materials caused by raindrops and overland flow, which can remove particles and nutrients from their original locations [5]. Rainfall can also be comprehensively regulated by affecting key processes such as horizontal migration, mineralization release and infiltration leaching of SOC. In the context of soil erosion, the rainfall intensity provides considerable kinetic energy to destroy soil particles and enhances the detachment and transport capacity of runoff for surface sediment [23]. As the experiment continued, fluctuating increasing trends in the surface runoff yield and the interflow runoff yield were recorded. This observation strongly corresponded with the findings of previous studies [23,24]. Because there was no rain for three consecutive days before the experiment, in the initial stages, most of the rain was absorbed by the dry soil, and a small proportion of the rain that had not infiltrated gathered on the slope leading to surface runoff. Continuous rainfall caused the pores inside the soil to be filled with rain, and the soil gradually became saturated. Excess rain was discharged in the form of surface runoff and soil interflow, leading to an increase for both. The unique rock–soil binary structure interface in the purple soil region also provides favorable conditions for the formation of soil interflow [21]. However, the increase in runoff aggravated the development of the channel.
Migration of DOC with runoff at the soil–water interface is one of the main mechanisms of SOC loss, and its migration loss has an important effect on the source–sink function of the SOC pool [3]. The surface runoff yield sharply increased twice during the experiment. The first sudden increase in surface runoff was due to the splash effect from raindrops causing a dense and thin temporary crust on the soil surface. This reduced soil infiltration and formed a thin sheet flow on the slope. The occurrence of the second sudden increase was mainly related to slope erosion processes. The development from sheet erosion to rill erosion was often accompanied by many scattered and small runoff branches that connected and merged. This resulted in the confluence of stratified flow into streams, causing the sudden increase in surface runoff [25,26].
In the surface runoff and soil interflow, the DOC mass concentration at the rill stage was considerably lower than that of the sheet erosion stage, indicating that DOC loss occurs mainly in the early stages of soil erosion. Because soil organic carbon was mainly concentrated on the surface of the soil layer, the loss of organic carbon in the early stage of erosion was serious. However, as the intensity of the erosion increased, the low-carbon soil in the deep was exposed, resulting in a decrease in organic carbon loss due to erosion. The study also found that interflow and surface runoff are the main migration pathways for DOC, but the occurrence of rill erosion may affect the redistribution pattern of DOC by changing the hydrological pathways [7]. Affected by the form and properties of DOC, at the sheet erosion stage, the DOC attached to the surface soil was carried away by runoff, and the DOC in the large soil particles was preserved. At the rill erosion stage, a considerable amount of runoff diluted the DOC concentration. Therefore, the DOC content at the rill erosion stage was lower than that of the sheet erosion stage. Based upon past experiences, soil erosion disturbs the topsoil and preferentially removes SOC from upslope sites, resulting in the mineralization, redistribution, and burial of SOC in depositional environments [27,28]. The DOC in the sediment will be affected by the slope erosion and is enriched at the slope toe or on concave slopes [29].
With the expansion of erosion, the sediment yield increased with fluctuation. This was because this study focused on the process from sheet erosion to rill erosion. During the experiment, the rill was relatively new and unstable and the sediment yield was in a state of continuous increase. In contrast, we observed that the TOC content of sediment, the SOC content of the sediment particle state, the DOC content of the sediment and the SOC enrichment ratio at the rill erosion stage was significantly lower than that of the sheet erosion stage. In the sheet erosion stage, the selective migration of SOC was very obvious. The proportion of coarse particulate SOC in sediment was lower than that of fine particulate organic carbon. The size of the soil particles determines the enrichment of nutrient elements [30]. With the decrease in the soil specific surface area, the DOC content adsorbed on the surface of the soil particles was also reduced. At the sheet erosion stage, many soils with small particle sizes and high carbon content were carried by runoff through screening. Therefore, the organic carbon enrichment ratio in the erosion stage was higher than that of other stages. Compared with the sheet erosion stage, coarse particles and macroaggregates in the soil are more easily stripped and transported at the rill erosion stage, resulting in a decrease in the TOC content and the enrichment ratio in the sediment.
4.2. Impacts of Different Maize Growth Stages on Runoff Yield, Sediment Yield, and Carbon Loss
In agricultural ecosystems, the actual effect of rainfall intensity on soil erosion is closely related to soil properties and field management [4,5,31]. In the present study, we found that the occurrence of surface runoff and interflow was closely related to the period of maize growth, with maize growth potentially leading to strong soil erosion of the subsoil. With different maize growth stages, the surface runoff yield gradually decreased, but the soil interflow gradually increased during the maize jointing and tasseling stages. A large amount of surface runoff was transformed into soil interflow during the maize jointing and tasseling stages. This led to intense soil loss occurring at the subsurface, which may be due to the highly developed preferential flow. Through its organs, including the stem and roots, and its impact on the soil, increases in the surface roughness and changes in the path of the overland flow, result in changes in the hydraulic properties of the overland flow [32]. Interflow is generally composed of matrix flow and macropore flow in soil, and matrix flow occupies the main position. During the maize growth, the root system continues to extend downward, and the area of cover increased. This not only changed the soil pore structure and the water flow path, but also formed a new fracture network in the soil, which is conducive to water migration [23,33]. Rain was partially intercepted by the maize overground, which prolonged the residence time of flow on the slope, resulting in an increase in soil infiltration. This is conducive to the development of soil interflow. However, at the maturity stage for maize, the elongated leaves withered and fell on the ground, reducing the contact area between the water flow and the surface soil, resulting in the surface runoff being higher than the interflow.
The DOC mass concentration of the surface runoff and subsurface flow at the seedling and jointing stages was higher than that of the others. The DOC migration flux in the surface runoff at the seedling stage was greater than that of the other growth stages. This may be related to temperature [34]. In the study area, the tasseling stage and maturity stage occurred during the summer. Cao et al. [35] highlighted that plants reduce soil erosion through the physical and chemical effects of aboveground biomass and roots. The warm climate was conducive to the adsorption of dissolved organic acids in DOC by soil, reducing the leaching of DOC from runoff. At the later stage for maize growth, the roots and root exudates promoted the formation of soil aggregates, which was beneficial for the accumulation of SOC in the grains. These are the reasons for the increase in DOC content. The DOC mass concentration and DOC migration flux in the interflow were higher than in the surface runoff. Although there is a limited effect of environmental conditions and land management practices on DOC concentrations in vertical transport, crops can still affect the transport and distribution of DOC [36]. This is because the change in content of SOC in the soil system is the result of its accumulation in soil and soil water movement. Any factor that can affect these two key links can affect the change of SOC [37]. In this experiment, the growth of maize roots changed the soil structure, the formation of soil pores and aggregates, thus affecting the flow route of runoff in the soil. The roots of maize at seedling stage and jointing stage rapidly extended downward, increasing the channels for water infiltration and the dissolution interaction between the soil middle flow and DOC was strengthened [38]. The maize roots at tasseling stage had more obvious ability to fix soil, thus significantly reducing soil erosion and DOC loss. However, horizontal ridge tillage resulted in the accumulation of runoff in ridges and promoted the development of soil flow. With the increase in interflow, more energy carried by interflow was invested into the destruction of soil particles, resulting in the release of more DOC from the damaged soil particles. Therefore, interflow is the main pathway for of DOC leaching loss in purple soil slope farmland.
Under the experimental conditions, we found that SOC loss mainly occurred at the seedling and mature stages for maize. The sediment yield and the SOC content in the sediment particle state at the maize jointing and tasseling stages was lower than that of the seedling and mature stages. However, the TOC content for the sediment was the highest during the tasseling stage and the lowest during the seedling stage. This is related to the tillage soil when maize is planted. Tillage leads to the exchange or mixing of deep low-carbon soil and surface soil, which makes the surface soil loose and low carbon content, so the sediment yield is large but the organic carbon content is low. The extensive cover of the maize jointing and tasseling stages on the topsoil could increase the surface roughness which would increase the water resistance, retard flow velocity, and dissipate the energy of surface flow. This weakened the detachment and transport of soil and SOC by surface flow [39]. Overall, the effects of crops on soil loss and SOC migration are complex and periodic, and the jointing and tasseling stages have a positive effect on reducing organic carbon loss. SOC is complex and poorly understood, and more research on the migration of SOC should be conducted in the future.
5. Conclusions
In this study, with the development of soil erosion, runoff and sediment yield increased gradually, which caused the loss of organic carbon, but also diluted the concentration of organic carbon in runoff and sediment, resulting in the increase of the sediment particle state and the DOC migration, and the decrease of the DOC mass concentration, the TOC content, SOC content of the sediment particle state, DOC content, and the SOC enrichment ratio. We also observed that a large amount of surface runoff was converted into soil interflow during the maize jointing and tasseling stages, resulting in higher runoff yield and DOC migration flux of the soil interflow than of surface runoff. It showed that the maize jointing stage and tasseling stage could effectively inhibit the production of surface runoff and the migration of DOC in surface runoff, but promote the production of interflow and the loss of DOC in interflow. Therefore, the effects of the whole growth stage of maize on soil erosion and organic carbon loss are different, but planting maize can reduce soil erosion and organic carbon loss to a certain extent.
Author Contributions
Z.H. and H.X.: conceptualization, methodology, writing—original draft. S.H. and Z.Z.: resources, funding acquisition, writing—review and editing, supervision. Z.L. and X.L.: data curation and investigation. Y.W., Y.Z. and B.T. review and editing. All authors have read and agreed to the published version of the manuscript.
Funding
This research was financially supported by the National key research and development program (2022YFD1901401), the National Natural Science Foundation (No.41271307) and the Sichuan Key Research and Development Program (2019YFS0463).
Institutional Review Board Statement
Not applicable.
Informed Consent Statement
Not applicable.
Data Availability Statement
Data from this work are available upon request.
Acknowledgments
The authors express their gratitude to the editor and the reviewers for their constructive comments.
Conflicts of Interest
The authors declare no conflict of interest.
References
- Doetterl, S.; Berhe, A.A.; Nadeu, E.; Wang, Z.; Sommer, M.; Fiener, P. Erosion, deposition and soil carbon: A review of process-level controls, experimental tools and models to address C cycling in dynamic landscapes. Earth-Sci. Rev. 2016, 154, 102–122. [Google Scholar] [CrossRef]
- Houghton, R.A. Balancing the global carbon budget. Annu. Rev. Earth Planet. Sci. 2007, 35, 313–347. [Google Scholar] [CrossRef]
- Evans, C.D.; Monteith, D.T.; Cooper, D.M. Long-term increases in surface water dissolved organic carbon: Observations, possible causes and environmental impacts. Environ. Pollut. 2005, 137, 55–71. [Google Scholar] [CrossRef] [PubMed]
- Chappell, A.; Baldock, J.; Sanderman, J. The global significance of omitting soil erosion from soil organic carbon cycling schemes. Nat. Clim. Chang. 2016, 6, 187–191. [Google Scholar] [CrossRef]
- Deng, L.; Sun, T.; Fei, K.; Zhang, L.; Fan, X.; Wu, Y.; Ni, L. Effects of erosion degree, rainfall intensity and slope gradient on runoff and sediment yield for the bare soils from the weathered granite slopes of SE China. Geomorphology 2020, 352, 106997. [Google Scholar] [CrossRef]
- Fujii, K.; Uemura, M.; Hayakawa, C.; Funakawa, S.; Sukartiningsih, S.; Kosaki, T.; Ohta, S. Fluxes of dissolved organic carbon in two tropical forest ecosystems of East Kalimantan, Indonesia. Geoderma 2009, 152, 127–136. [Google Scholar] [CrossRef]
- Van Gaelen, N.; Verschoren, V.; Clymans, W.; Poesen, J.; Govers, G.; Vanderborght, J.; Diels, J. Controls on dissolved organic carbon export through surface runoff from loamy agricultural soils. Geoderma 2014, 226, 387–396. [Google Scholar] [CrossRef]
- Yang, Y.; Goldsmith, A.; Herold, I.; Lecha, S.; Toor, G.S. Assessing Soil Organic Carbon in Soils to Enhance and Track Future Carbon Stocks. Agronomy 2020, 10, 1139. [Google Scholar] [CrossRef]
- Doetterl, S.; van Oost, K.; Six, J. Towards constraining the magnitude of global agricultural sediment and soil organic carbon fluxes. Earth Surf. Process. Landf. 2012, 37, 642–655. [Google Scholar] [CrossRef]
- Pugach, S.P.; Pipko, I.I.; Semiletov, I.P.; Sergienko, V.I. Optical characteristics of the colored dissolved organic matter on the East Siberian shelf. Dokl. Earth Sci. 2015, 465, 1293–1296. [Google Scholar] [CrossRef]
- Van Gaelen, H.; Vanuytrecht, E.; Willems, P.; Diels, J.; Raes, D. Bridging rigorous assessment of water availability from field to catchment scale with a parsimonious agro-hydrological model. Environ. Model. Softw. 2017, 94, 140–156. [Google Scholar] [CrossRef]
- Oliveira, N.D.S.; Schiavo, J.A.; Pereira, M.G.; Coelho, R.D.S.; Ozorio, J.M.B.; de Moraes, E.M.V. Pedogenesis of soils with accumulation of organic carbon in the subsurface horizons in a saline lake in the Pantanal wetland of Nhecola circumflex accent ndia, Brazil. J. South Am. Earth Sci. 2022, 117, 103816. [Google Scholar] [CrossRef]
- Paula, R.R.; Calmon, M.; Lopes-Assad, M.L.; Mendonca, E.D.S. Soil organic carbon storage in forest restoration models and environmental conditions. J. For. Res. 2022, 33, 1123–1134. [Google Scholar] [CrossRef]
- Hoffmann, M.; Pohl, M.; Jurisch, N.; Prescher, A.K.; Campa, E.M.; Hagemann, U.; Remus, R.; Verch, G.; Sommer, M.; Augustin, J. Maize carbon dynamics are driven by soil erosion state and plant phenology rather than nitrogen fertilization form. Soil Tillage Res. 2018, 175, 255–266. [Google Scholar] [CrossRef]
- Ma, W.M.; Tang, S.H.; Dengzeng, Z.M.; Zhang, D.; Zhang, T.; Ma, X.L. Root exudates contribute to belowground ecosystem hotspots: A review. Front. Microbiol. 2022, 13, 937940. [Google Scholar] [CrossRef]
- Luo, J.; Zheng, Z.; Li, T.; He, S.; Wang, Y.; Zhang, X.; Huang, H.; Yu, H.; Liu, T. Characterization of runoff and sediment associated with rill erosion in sloping farmland during the maize-growing season based on rescaled range and wavelet analyses. Soil Tillage Res. 2019, 195, 104359. [Google Scholar] [CrossRef]
- Yang, C.; Su, Z.; Fan, J.; Fang, H.; Shi, L.; Zhang, J.; He, Z.; Zhou, T.; Wang, X. Simulation of the landform change process on a purple soil slope due to tillage erosion and water erosion using UAV technology. J. Mt. Sci. 2020, 17, 1333–1344. [Google Scholar] [CrossRef]
- Zheng, J.; He, X.; Walling, D.; Zhang, X.; Flanagan, D.; Qi, Y. Assessing soil erosion rates on manually-tilled hillslopes in the Sichuan Hilly Basin using Cs-137 and Pb-210(ex) measurements. Pedosphere 2007, 17, 273–283. [Google Scholar] [CrossRef]
- Zhao, L.; Jin, J.; Du, S.; Liu, G. A Quantification of the Effects of Erosion on the Productivity of Purple Soils. J. Mt. Sci. 2012, 9, 96–104. [Google Scholar] [CrossRef]
- Zhong, S.; Han, Z.; Duo, J.; Ci, E.; Ni, J.; Xie, D.; Wei, C. Relationships between the lithology of purple rocks and the pedogenesis of purple soils in the Sichuan Basin, China. Sci. Rep. 2019, 9, 13272. [Google Scholar] [CrossRef]
- Dai, J.; Zhang, J.; Zhang, Z.; Jia, L.; Xu, H.; Wang, Y. Effects of water discharge rate and slope gradient on runoff and sediment yield related to tillage erosion. Arch. Agron. Soil Sci. 2021, 67, 849–861. [Google Scholar] [CrossRef]
- Su, Z.; Zhang, J.; Xiong, D.; Liu, G. Assessment of Soil Erosion by Compensatory Hoeing Tillage in a Purple Soil. J. Mt. Sci. 2012, 9, 59–66. [Google Scholar] [CrossRef]
- Dai, J.; Zhang, J.; Xue, K.; Yang, F.; Huang, F.; Zhao, H.; Ma, X.; Dai, C.; Xu, Y.; Li, M.; et al. Effects of spatial variations in rock fragments related to tillage on hydrological processes and sediment transport. Catena 2022, 211, 105963. [Google Scholar] [CrossRef]
- Zhao, Q.; Li, D.; Zhuo, M.; Guo, T.; Liao, Y.; Xie, Z. Effects of rainfall intensity and slope gradient on erosion characteristics of the red soil slope. Stoch. Environ. Res. Risk Assess. 2015, 29, 609–621. [Google Scholar] [CrossRef]
- Jiang, F.; Zhan, Z.; Chen, J.; Lin, J.; Wang, M.K.; Ge, H.; Huang, Y. Rill erosion processes on a steep colluvial deposit slope under heavy rainfall in flume experiments with artificial rain. Catena 2018, 169, 46–58. [Google Scholar] [CrossRef]
- Jiang, Y.; Shi, H.; Wen, Z.; Guo, M.; Zhao, J.; Cao, X.; Fan, Y.; Zheng, C. The dynamic process of slope rill erosion analyzed with a digital close range photogrammetry observation system under laboratory conditions. Geomorphology 2020, 350, 106893. [Google Scholar] [CrossRef]
- Hua, K.; Zhu, B.; Wang, X.; Tian, L. Forms and Fluxes of Soil Organic Carbon Transport via Overland Flow, Interflow, and Soil Erosion. Soil Sci. Soc. Am. J. 2016, 80, 1011–1019. [Google Scholar] [CrossRef]
- Lal, R. Soil erosion and the global carbon budget. Environ. Int. 2003, 29, 437–450. [Google Scholar] [CrossRef]
- Xu, H.; Zhang, J.; Wei, Y.; Dai, J.; Wang, Y. Bedrock erosion due to hoeing as tillage technique in a hilly agricultural landscape, southwest China. Earth Surf. Process. Landf. 2020, 45, 1418–1429. [Google Scholar] [CrossRef]
- Lovelock, C.E.; Feller, I.C.; Ellis, J.; Schwarz, A.M.; Hancock, N.; Nichols, P.; Sorrell, B. Mangrove growth in New Zealand estuaries: The role of nutrient enrichment at sites with contrasting rates of sedimentation. Oecologia 2007, 153, 633–641. [Google Scholar] [CrossRef]
- Carr, T.W.; Balkovic, J.; Dodds, P.E.; Folberth, C.; Fulajtar, E.; Skalsky, R. Uncertainties, sensitivities and robustness of simulated water erosion in an EPIC-based global gridded crop model. Biogeosciences 2020, 17, 5263–5283. [Google Scholar] [CrossRef]
- Zhou, T.; Su, Z.; He, Z.; Zhang, X.; Wang, X.; Wang, J.; Liu, Y.; Wu, Z.; Wang, L. Simulation of the impacts of native vegetation and polyacrylamide on hydraulic properties and heavy metal concentrations at mine dumps. Land Degrad. Dev. 2021, 32, 2749–2761. [Google Scholar] [CrossRef]
- Wang, Y.; Zhang, J.H.; Zhang, Z.H. Influences of intensive tillage on water-stable aggregate distribution on a steep hillslope. Soil Tillage Res. 2015, 151, 82–92. [Google Scholar] [CrossRef]
- Dusek, J.; Dohnal, M.; Vogel, T.; Marx, A.; Barth, J.A.C. Modelling multiseasonal preferential transport of dissolved organic carbon in a shallow forest soil: Equilibrium versus kinetic sorption. Hydrol. Process. 2019, 33, 2898–2917. [Google Scholar] [CrossRef]
- Cao, L.; Zhang, Y.; Lu, H.; Yuan, J.; Zhu, Y.; Liang, Y. Grass hedge effects on controlling soil loss from concentrated flow: A case study in the red soil region of China. Soil Tillage Res. 2015, 148, 97–105. [Google Scholar] [CrossRef]
- Li, M.; Wang, J.; Guo, D.; Yang, R.; Fu, H. Effect of land management practices on the concentration of dissolved organic matter in soil: A meta-analysis. Geoderma 2019, 344, 74–81. [Google Scholar] [CrossRef]
- Hua, K.; Zhu, B.; Wang, X. Dissolved organic carbon loss fluxes through runoff and sediment on sloping upland of purple soil in the Sichuan Basin. Nutr. Cycl. Agroecosyst. 2014, 98, 125–135. [Google Scholar] [CrossRef]
- Jost, G.; Schume, H.; Hager, H.; Markart, G.; Kohl, B. A hillslope scale comparison of tree species influence on soil moisture dynamics and runoff processes during intense rainfall. J. Hydrol. 2012, 420, 112–124. [Google Scholar] [CrossRef]
- Xia, L.; Song, X.; Fu, N.; Cui, S.; Li, L.; Li, H.; Li, Y. Effects of rock fragment cover on hydrological processes under rainfall simulation in a semi-arid region of China. Hydrol. Process. 2018, 32, 792–804. [Google Scholar] [CrossRef]


Disclaimer/Publisher’s Note: The statements, opinions and data contained in all publications are solely those of the individual author(s) and contributor(s) and not of MDPI and/or the editor(s). MDPI and/or the editor(s) disclaim responsibility for any injury to people or property resulting from any ideas, methods, instructions or products referred to in the content. |
© 2023 by the authors. Licensee MDPI, Basel, Switzerland. This article is an open access article distributed under the terms and conditions of the Creative Commons Attribution (CC BY) license (https://creativecommons.org/licenses/by/4.0/).