Abstract
This study examined the effect of B fertilizers applied by soil and foliar routes on the yield and total B uptake under glasshouse and field conditions. A high-yield rice variety, Sanpatong 1, was used in the experiments. In a pot experiment, soil B application produced a grain yield of 23.4 g pot−1, similar to the control treatment, but foliar B decreased grain yield by 14.9%. The total uptake of B was the highest at 2.5 mg pot−1 when soil B was applied, 66.7% higher than the in the control and foliar B application treatments, but there was no significant effect on the numbers of filled or unfilled grains. Similar responses of grain yield and total B uptake were observed in both conditions. Soil B application produced a grain yield of 4.7 t ha−1, similar to the control, but foliar B application decreased grain yield by 10.9%. The total uptake of B in the field was the highest at 4.7 mg m−2 when soil B was applied, being 42.4% higher than in the foliar B application and control treatments. This study indicates that the total uptake of B in rice plants can be successfully improved by applying soil B fertilizer, even though no effect was observed on productivity. The efficacy of B uptake in rice plants by soil B application is an interesting subject that should be further studied in greater detail to determine its utility in yield production, e.g., by splitting application times.
1. Introduction
Rice is one of the staple food crops that is consumed by more than half of the world’s people, and the demand is steadily increasing due to the rapidly growing world population [1,2]. Therefore, rice production will need to be increased to satisfy consumer demand, while farmers are currently experiencing challenges in increasing production due to factors such as climate change, the spread of severe plant diseases and pests, and decreasing rice-growing areas [3]. A recent study has suggested a way to increase regional production of rice crops by narrowing existing yield gaps, especially in Southeast Asia where there has been remarkable progress in rice production over the past 50 years [2,4]. Agronomical management by applying fertilizers has been suggested as an effective solution for closing the yield gap and increasing productivity, especially among the modern high-yielding varieties that respond positively to fertilization. Applying fertilizer by soil and foliar routes in rice crops is a common practice among farmers, and it has been suggested as a successful management strategy for increasing productivity and grain nutritional quality in rice crops, but the efficacy depends on many environmental factors [5,6]. The soil fertility profile is one of the factors determining the efficiency of fertilizer management; it not only determines crop productivity but also has implications for human health, such as on food and feed [7]. Applying only a macronutrient (N, P, and K) fertilizer to the soil for improving plant growth, productivity, and grain quality may not be adequate for intensive rice cultivation, as micronutrients are also highly necessary when dealing with intensive rice cultivation.
Boron (B) is one of the essential elements for plant growth and development. Although B is a micronutrient that plants need in low amounts compared to others, B has a primary role in cell wall biosynthesis and plasma membrane structure and integrity, and in addition, is involved in enhancing total chlorophyll content and plant height. Boron- deficient plants have been reported to possess reduced pollen viability, especially in rice plants [2,8]. A previous study on rice crops [9] reported that a negative effect of boron deficiency on grain filling has been found to be closely related to pollen viability when rice was grown in a sand culture. In addition, rice plants grown without B application had lower numbers of tillers and kernels and a higher rate of panicle sterility compared with the boron-sufficient plants [10,11]. Although B uptake in rice is not well understood, applying B can reduce the negative effects of high temperature at vegetative and reproductive stages by increasing cell membrane stability, sugar mobilization, pollen viability, and spikelet fertility [11]. The critical deficiency concentrations in graminaceous species are reported to be within the range of 5–10 mg B kg−1 dry weight (DW), compared with 4–14 times as much B required for maximum growth and yield in dicotyledonous species [12]. In rice, the B requirement in vegetative growth was found at 8–10 mg B kg−1 in the youngest emerged blade at the panicle initiation stage [13] and >3 mg B kg−1 in the flag leaf at anthesis, while a greater B requirement was found at the reproductive stage >20 mg B kg−1 in the anthers at anthesis [9]. In Thailand, B deficiency is widely reported in field crops [14] as well as in many agricultural soils, especially when crops are cultivated in calcareous soils [15,16]. Rice is commonly grown under flooded soil conditions, which affects plant nutrient availability compared with non-flooded soil conditions in other crops. Soil B availability has been confirmed to affect the productivity of rice crops [17], but limited information is available on how B application influences B uptake and productivity, especially in practical field conditions.
Since the deficiency of B affects the productivity of rice crop cultivation, the proper management of B fertilizer would be a promising strategy to solve the problem by improving yield in many rice growing regions. This study evaluated the effect of boron fertilizer management by soil and foliar application on the uptake of B and productivity in rice crops in parallel with glasshouse and field conditions. The information will be useful for increasing the productivity in rice crops to achieve the demand for rice production by B fertilizer management.
2. Materials and Methods
2.1. Pot Experiment
A pot experiment was conducted at the research station, Chiang Mai University, during the rainy season (July to November) in 2021. Before the application of boron treatments, the soil used in the experiment was Sansai series soil derived from a rice field that had the following properties: sandy loam-textured soil, pH 5.91, 2.56% organic matter, 60.16 mg kg−1 available phosphorus (Bray II), 119.63 mg kg−1 exchangeable potassium (NH4OAC pH7/AES), 0.13 mg kg−1 total nitrogen (Kjeldahl), and 1.20 mg kg−1 extractable boron (CaCl2-manital). The experiment was arranged in a completely randomized design (CRD) with three replications. The boron fertilizer treatment was assigned to (1) control, where no boron fertilizer was applied; (2) soil boron, where B fertilizer (Borax pentahydrate power, 15.1% B concentration) was incorporated into the soil one day before transplanting at the rate of 0.12 g pot−1 (19.9 kg B ha−1); and (3) foliar boron, where boron fertilizer (Borax pentahydrate power) was prepared at a 10 times lower concentration than the soil used before being applied by spraying during the flowering and early milking stages at the rate of 3.0 mL pot−1 (500 L ha−1). The rice used in the experiment was Sanpatong 1 (SPT1), a popular high-yield rice variety in Northern Thailand. The pots were prepared by adding 14 kg soil into 28 cm diameter and 30 cm height pots. Seedlings were prepared by germinating rice seeds for 14 days before being transplanted into the prepared pots, with five seedlings per pot. The N-P fertilizers were applied in three splits, while the K fertilizer was applied only in the first split. In the first split, N-P-K was applied at the rate of 60-30-30 kg ha−1, respectively, at the tillering stage. In the second and third splits, N and P fertilizers were applied equally at the rate of 30-30-0 kg ha−1, respectively, at the booting and flowering stages. Each pot was flooded with water to a depth of 10 cm from the soil surface for the entire period and drained three days before harvesting.
2.2. Sample Preparation and Chemical Analysis
At maturity, rice plants were collected and determined for grain yield, straw dry weight, and yield components (number of tillers hill−1, number of panicles plant−1, percentage of filled grains, and thousand-grain weight). Grain yield was measured at 14% moisture content, and straw dry weight was determined after oven drying at 70 °C for 72 h. The harvest index was calculated by dividing grain yield with total biological yield. The unfilled grains were separated between fertilized and unfertilized grains according to a previous study [18]. For the stem, leaf, and flag leaf analyses, the samples were ground after incineration at 535 °C for 8 h.
An analysis of boron concentrations was carried out using the Azomethine-H method [18,19], and the sample solution absorbance was read by a spectrophotometer (U-1900, Hitachi, Japan). Peach (SRM 1547) and soybean leaves were included in each batch as reference materials to validate the method. The content of B in each plant part was calculated by multiplying between plant part dry weight and the concentration of B. The total shoot uptake of B was the summation of B content in all plant parts.
2.3. Field Experiment
The experiment was conducted at the research station field, Chiang Mai University, during the dry season (January to May) in 2020. Before the application of boron treatments, the soils used in the experiment had the following properties: sandy loam-textured soil, pH 6.06, 1.14% organic matter, 184.24 mg kg−1 available phosphorus (Bray II), 109.28 mg kg−1 exchangeable potassium (NH4OAC pH7/AES), 2.53 mg kg−1 available Zn (DTPA/AAs), and 0.19 mg kg−1 extractable B (CaCl2-manital). The experiment was arranged in a randomized complete block design (RCBD) with four replications. The three boron fertilizer treatments of non-boron, soil boron, and foliar boron applications were applied similarly as in the pot experiment, and the same rice variety, Sanpatong 1 (SPT1), was used in this experiment. Seedlings were prepared by germinating rice seeds for 25–30 days. The seedlings were manually transplanted to a single plant per hill, with spacing between hills of 25 × 25 cm, in 3 × 3.5 m2 plots per treatment replication. No B fertilizer was applied for the control treatment. For the soil B application, B fertilizer (Disodium Octaborate Tetrahydrate; Etidot-67, 21% B concentration) was incorporated into the soil one day before transplanting at the same rate as in the pot experiment, i.e., 19.9 kg B ha−1, and foliar boron fertilizer with a 10 times lower concentration than the soil application at the flowering and early milking stages at the rate of 500 L ha−1 was employed. The N-P-K fertilizers with a 15-15-15 formulation were applied at 125 kg ha−1 one day before transplanting. The N fertilizer of 46-0-0 was applied at 125 kg ha−1 at the tillering stage and 62 kg ha−1 at the heading stage. Each plot was flooded with water to a depth of 10 cm throughout crop growth and drained 14 days before harvesting.
2.4. Sample Preparation and Chemical Analysis
At maturity, a 1 × 1 m2 area from the center of each plot was harvested to determine yield, straw dry weight, and yield components (number of tillers hill−1, number of panicles plant−1, percentage of filled grains, and thousand-grain weight). The grain yield was measured at 14% moisture content, and the straw dry weight was determined after oven drying at 70 °C for 72 h. The harvest index was calculated similar to the above experiment. Approximately 100 paddy grains were sampled for nutrient analysis. For the stem, leaf, and flag leaf samples, the samples were ground for boron analysis after incineration at 535 °C for 8 h. The concentration of B was analyzed as explained in the above experiment. The content of B in different plant parts and the total shoot B uptake were calculated as mentioned in the above experiment.
2.5. Statistical Analysis
All data were analyzed by analysis of variance (ANOVA) using statistical analysis software (Statistic 9, analytical software SX). Significant differences between treatment means were identified as p < 0.05 by the least significant difference (LSD) test. The relationship of each pair of variables was determined by a coefficient of correlation analysis.
3. Results
3.1. Pot Experiment
The grain yield differed among the B application treatments (p < 0.05) (Figure 1). The control with no B and soil B application had grain yields of 23.4 g pot−1, while foliar B application decreased the grain yield by 14.9% compared with the control. No differences between the B applications were found in the straw dry weight (p < 0.05).
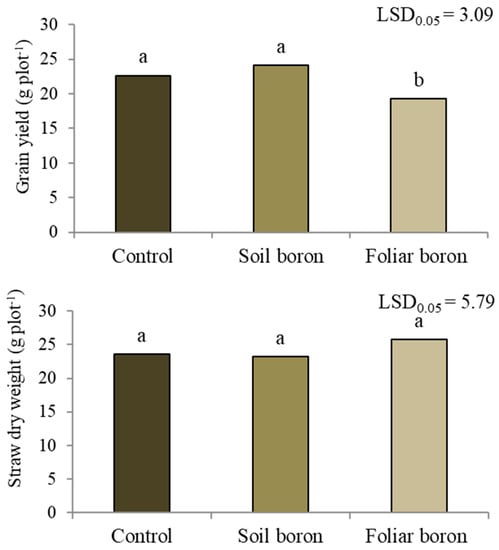
Figure 1.
Grain yield and straw dry weight of Sanpatong 1 rice variety grown under different boron fertilizer application methods (no B fertilizer was added = control; B fertilizer was added to the soil at 19.9 kg B ha−1 = soil boron, and B fertilizer was foliar sprayed at 500 L ha−1 = foliar boron) in the glasshouse experiment. Different letters above each bar (means) indicate a significant difference by the least significant difference (LSD) test at p < 0.05.
Applying B fertilizers affected the number of panicles per plant and harvest index, but not the number of tillers per plant, percentage of filled grains, or thousand-grain weight (p > 0.05) (Table 1). Applying soil B resulted in 3.7 panicles per plant, which was not significantly different from the 4.0 panicles per plant in the control, while foliar application of B resulted in a 25% decrease compared to the control. The foliar B application resulted in a slightly declining harvest index compared with the control and soil B application. The unfilled grains were separated into fertilized and unfertilized grains. The B application did not affect the percentages of fertilized or unfertilized grains (p < 0.05) (Figure 2).

Table 1.
Yield components and harvest index of Sanpatong 1 rice variety grown under different boron fertilizer application methods in the glasshouse experiment.
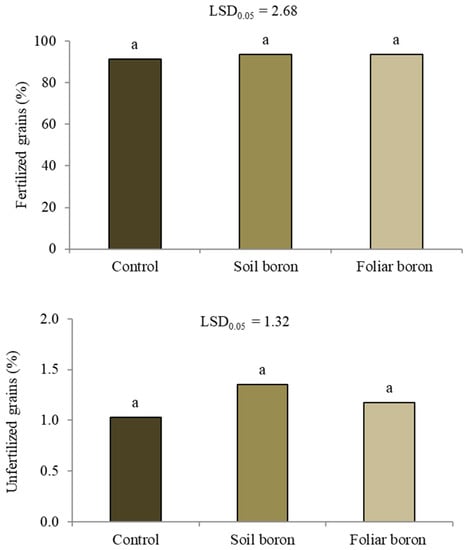
Figure 2.
The percentages of fertilized and unfertilized grains among the unfilled grains of Sanpatong 1 rice variety grown under different boron fertilizer application treatments (no B fertilizer was added (control); B fertilizer was added in the soil at 19.9 kg ha−1 (soil boron) in the glasshouse experiment and B fertilizer was foliar sprayed at 500 L ha−1 (foliar boron)). Same letters above each bar (means) indicate no significant difference by the least significant difference (LSD) test at p < 0.05.
The B concentration in different plant parts of the stem, leaves, and flag leaf varied among the B applications, but there was no significant difference in grain B concentration (p > 0.05) (Table 2). The stem B concentration was 2.9 mg kg−1 in the control treatment; the foliar application of B increased this by 1.6 times the stem B concentration, while the soil B application reduced stem B concentration by 1.9 times compared to the control. The results were opposite to the pattern for the leaves and flag leaf B concentrations. The leaf B concentration was 14.6 mg kg−1 in the control; applying soil B increased the leaf B concentration by 2.7 times, but the same concentration was decreased 4.4 times by the foliar B application. Flag leaf B concentration was averaged at 20.2 mg kg−1 in the control and foliar application treatments; applying soil B increased the flag leaf B concentration by 3.6 times. The concentration of grain B averaged 14.4 mg kg−1, and this was not significantly different among the B application treatments. Applying B fertilizers significantly affected the total B uptake (p < 0.05) (Table 2). The total uptake of B was the highest at 2.5 mg pot−2 applied via the soil, 66.7% higher than the total uptake in the control treatment and under the foliar B application.
Table 2.
Boron concentration in different plant parts and total B uptake of Sanpatong 1 rice variety grown under different treatments of boron fertilizer applications in the glasshouse experiment.
3.2. Field Experiment
The grain yield differed among the B application treatments (p < 0.05) (Figure 3). The control with no B application and soil B application resulted in a grain yield of 4.7 t ha−1, while the applied foliar B decreased the grain yield by 10.9% compared with the control. The control and foliar B application treatments each had a straw dry weight of 4.3 t ha−1, while the soil B application increased the straw dry weight by 15% compared with the control.
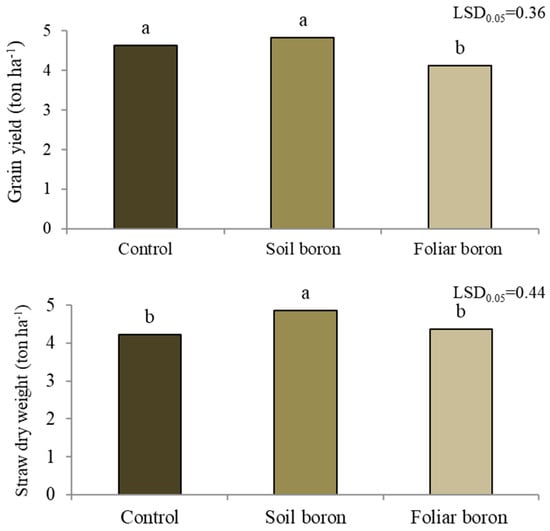
Figure 3.
Grain yield and straw dry weight of Sanpatong 1 rice variety under different treatments of boron fertilizers in the field experiment (no B fertilizer was added (control); B fertilizer was added in the soil at 19.9 kg ha−1 (soil boron) in the field experiment and B fertilizer was foliar sprayed at 500 L ha−1 (foliar boron)). Different letters above each bar (means) indicate a significant difference by the least significant difference (LSD) test at p < 0.05.
Applying B fertilizers resulted in differences in the numbers of panicles and tillers, the percentage of filled grains, and harvest index but not in thousand grain weight (p < 0.05) (Table 3). Applying soil B produced an average of 13.8 tillers per plant, which was not different from 13.6 tillers per plant in the control, while foliar spraying of B fertilizer increased the tiller number by 15.4% compared to the control. Applying soil B resulted in 14.3 panicles per plant, equal to the 14.3 panicles per plant in the control, while foliar application of B increased the panicle number by 13.3% compared to the control. Applying soil B and foliar B application increased the percentages of filled grains by 5.4% and 5.1%, respectively, compared with the control. The harvest index was slightly decreased when foliar B was applied compared with the control and soil B application.
Table 3.
Yield components and harvest index of Sanpatong 1 rice variety grown under different treatments of boron fertilizer applications in the field experiment.
The B concentration in different plant parts of the stem, leaves, and flag leaf varied among the B treatments (p < 0.05) (Table 4). The stem B concentration was 3.3 mg kg−1 under the foliar B application, while soil B application increased the stem B concentration by 1.3 times compared with the control. For leaf B concentration, the control and foliar B applications had leaf B concentrations of 7.8 mg kg−1, while the soil B application increased the leaf B concentration by 1.9 times compared with the control. The flag leaf B concentration was 8.9 mg kg−1 in the control; applying soil B and foliar B increased the concentration by 1.7 times and 1.1 times, respectively. Applying B fertilizers significantly affected the total B uptake (p < 0.05) (Table 4). The total uptake of B was the highest at 4.7 mg m−2 when soil B was applied, 42.4% higher than the total uptake in the foliar B application. There was a slight correlation between grain yield and B concentration in the leaves (r = 0.48, p < 0.05), but no such correlation was found in the stem or flag leaf.
Table 4.
Boron concentration in different plant parts and total B uptake of Sanpatong 1 rice variety grown under different methods of boron fertilizer applications in the field experiment.
4. Discussion
Agronomic management by fertilizer application has been suggested as a promising strategy to improve productivity and grain quality in rice crops, but the management efficiency depends upon many factors, including rice variety, soil fertility, and methodology of fertilizer application [5,6]. This study has shown that applying B fertilizer to the soil increased the total uptake of B in rice plants in the glasshouse and field experiments, although no effect was observed in the grain yield. In contrast, the foliar B application should be carefully considered, as it could improve B concentration in plant tissues but may reduce grain yield. Therefore, the increase of total B uptake in rice plants by soil B application should be examined in more detail in rice crops, e.g., the timing of application at the different growth stages, as it can be a potential method for improving rice crop productivity from the increase in total B uptake.
Boron is one of the essential elements for plant growth and development, being involved in many functions of plant tissues, especially the cross-linking of pectin in the cell wall; B deficiency results in stunting and distortion of the growing tip that can cause tip death and sterility [12]. A foliar B application at the booting stage during normal irrigation improved the grain yield in wheat by increasing plant height, spike length, the number of spikelets, and thousand grain weight [20,21]. In rice, applying B fertilizer by seed priming and soil or foliar application increased productivity by enhancing water relations, chlorophyll content, and panicle sterility [10]. However, this study did not find an increase in grain yield by soil B application compared to the control, while the foliar B application decreased the grain yield by 10.9–14.9% in both glasshouse and field conditions. The increasing number of tillers and panicles per plant in both experiments were not affected by the foliar B application as it was applied two times at the flowering and milky stages. The higher percentage of filled grain in the field experiment could be the effect from the foliar B application, but it did not influence the grain yield. Thus, it is necessary to vary B application times for the effect on productivity. It has been reported that B concentration in the soil ranges from 2–200 mg kg−1, but less than 5–10% of total B is available to plants [22]. It is possible that the very low availability of B in the soil is absorbed by the plants, as the concentration in plant parts averaged 3.5, 9.9, and 12.3 mg kg−1 in the stem, leaves, and flag leaf, respectively, lower than the 20 mg kg−1 reported for rice pollen viability and grain set [9]. The present study did not find an effect of B application in the number of filled grains or the percentage of fertilized and unfertilized grains among the determined unfilled grains. Thus, this could be the reason for no response in grain yield under the application of B fertilizer. The concentration of B in the soil in this study was 0.19 mg kg−1, which is in the lower range, but no response of grain yield was found when soil B was added to the rice crops. However, the concentration of B in a soil solution could fluctuate due to frequent changes in soil water during the growth period of rice, as rice plants have a unique root anatomy that has different regulation mechanisms for B uptake to cope with B fluctuations in the soil [23]. Boron deficiency has been reported to reduce productivity in many crops, while high B levels are toxic to plants, causing symptoms such as chlorosis, brownish leaf tips, and dark brown spots on the leaves [24,25]. Previous studies reported that leaves with B toxicity impacting shoot growth may be a better parameter to rank the tolerance of B toxicity among the varieties compared with tissue B concentration [26,27] due to the better correlation related to B redistribution by efflux transporters from the sensitive symplastic compartments into the leaf apoplasm [28]. Therefore, it is interesting to investigate the degree of B toxicity among rice varieties to observe the efficacy of soil and foliar B fertilizer on B uptake and productivity. B is an immobile element, particularly in graminaceous species that require 5–10 mg kg−1 dry weight, in contrast to 20–70 mg kg−1 dry weight for most dicots [12,29]. This study found that accumulated B in the leaves may enhance grain yield, as indicated by a slight correlation between grain yields and B leaves concentration (data not shown), while a foliar B application may result in the reduced production found in this study, which would further explain the mechanisms behind this phenomenon. A previous study documented that B toxicity is commonly found in arid and semi-arid regions where plants are grown in soils formed from parent materials of marine origin, or it also relates to the use of high B in irrigation water [30], but it was not the case that the yield declined after foliar B was applied in this study. Additionally, the observation of lower stem B concentration in soil B treatment compared with the control in the glasshouse experiment was not found in the field experiment.
From the molecular aspect, several studies have reported that the B uptake by rice roots is mediated by OsLsi1/OsNIP2;1 and OsBOR1 [31,32]. OsLsi1 was originally identified as a channel-type transporter for silicic acid [31], but it is also permeable to H3BO3 [33,34]. OsLsi1 is localized at the distal side of the exodermis and endodermis of rice roots [31]. Physiological analysis with mutants showed that OsLsi1 rather than OsNIP3;1, a putative ortholog of AtNIP5;1, is a major transporter for B uptake in rice [33]. Knockout of OsLsi1 resulted in a significant decrease in B uptake, and plants showed typical B-deficiency symptoms under low B conditions [35]. On the other hand, OsBOR1 is a close homolog of AtBOR1 and functions as a B efflux transporter [36]. Even though several genes have been identified as being involved in B regulating transporters in rice plants, the uptake and retranslation mechanisms are not well understood. A recent study established that the total uptake of B both in the field and glasshouse was the highest at 4.7 mg m−2 when soil B was applied; this was 42.4% higher than foliar B application and the control. Thus, applying soil B enhances B accumulation in plant tissues, but it may not be enough to accelerate the reproductive organs, as it did not affect grain yield or the number of filled grains or the fertilized grains among the unfilled grains in the present study. In contrast, previous studies indicated that plant reproductive growth was considered more sensitive to B deficiency than vegetative growth [37,38]. In addition, a previous study showed that pollen grains appeared empty, shriveled, misshapen, or normal but lacked starch reserves under B deficiency [39]. Pollen germination and pollen tube growth were impaired under B deficient conditions in rice [9,39], and it was found in rice crops that B deficiency reduces the panicle number and induces poor grain fertility [16,37]. An in-depth study is needed to investigate the parallel regulation of the uptake and relocation transporters in rice plants.
It is interesting to observe that in this study, the soil B application increased the total uptake of B in rice plants in the experiments carried out under both glasshouse and field conditions. The accumulated B in the plant parts was enhanced but did not affect the number of fertilized grains or the number of filled grains during development as well as the productivity. Thus, applying B fertilizer during reproductive growth could be one of the key factors to improving the productivity of rice crops, but the appropriate application period should be intensively investigated in the future together with a management scheme for enhancement of grain filling.
5. Conclusions
This study has shown that applying B fertilizer to the soil could increase the total uptake in rice plants, but the improvement of B utilization for crop production needs further investigation. A successful method would help to decrease the yield gap of rice crops in all regions, e.g., splitting the application times of B fertilizer during plant growth and development may help to encourage vegetative plant growth and continuing remobilization of B from the vegetative to reproductive plant parts. For confirmation of the results, future study is required with the similar pot and field experiments, but an increasing number of rice varieties and splitting B application times.
Author Contributions
Conceptualization, C.P.-u.-t. and S.J. (Sansanee Jamjod); methodology, J.S.; software, S.L.; validation, S.L., J.V. and S.Y.; formal analysis, S.Y.; investigation, J.S.; resources, J.S.; data curation, S.J. (Suchada Jumrus); writing—original draft preparation, J.S.; writing—review and editing, C.P.-u.-t.; visualization, S.J. (Sansanee Jamjod); supervision, C.P.-u.-t.; project administration, S.Y.; funding acquisition, J.S. All authors have read and agreed to the published version of the manuscript.
Funding
This research was funded by the National Research Council of Thailand and Chiang Mai University, Thailand.
Data Availability Statement
Not applicable.
Acknowledgments
We would like to thank Eti Maden for providing boron products and Dale Taneyhill for English editing throughout the manuscript.
Conflicts of Interest
The authors declare no conflict of interest.
References
- Mughal, M.; Fontan Sers, C. Cereal production, undernourishment, and food insecurity in South Asia. Rev. Dev. Econ. 2020, 24, 524–545. [Google Scholar] [CrossRef]
- Yuan, S.; Stuart, A.M.; Laborte , A.G.; Edreira, J.I.R.; Dobermann, A.; Kien, L.V.N.; Thúy, L.T.; Paothong, K.; Traesang, P.; Tint, K.M.; et al. Southeast Asia must narrow down the yield gap to continue to be a major rice bowl. Nat. Food 2022, 3, 217–226. [Google Scholar] [CrossRef]
- Chaiwong, N.; Prom-u-thai, C. Significant roles of silicon for improving crop productivity and factors affecting silicon uptake and accumulation in rice: A Review. J. Soil Sci. Plant Nutr. 2022, 22, 1970–1982. [Google Scholar] [CrossRef]
- Zhichkin, K.A.; Nosov, V.Y.; Zhichkina, L.N.; Ramazanov, I.A.; Kotyazhov, A.V.; Abdulragimov, I.A. The food security concept as the state support basis for agriculture. Agron. Res. 2021, 19, 629–637. [Google Scholar]
- Prom-U-Thai, C.; Rashid, A.; Ram, H.; Zou, C.; Guilherme, L.R.G.; Corguinha, A.P.B.; Guo, S.; Kaur, C.; Naeem, A.; Yamuangmorn, S.; et al. Simultaneous Biofortification of Rice with Zinc, Iodine, Iron and Selenium Through Foliar Treatment of a Micronutrient Cocktail in Five Countries. Front. Plant Sci. 2020, 11, 589835. [Google Scholar] [CrossRef] [PubMed]
- Khampuang, K.; Lordkaew, S.; Dell, B.; Prom-u-thai, C. Foliar zinc application improved grain zinc accumulation and bioavailable zinc in unpolished and polished rice. Plant Prod. Sci. 2021, 24, 94–102. [Google Scholar] [CrossRef]
- Bouis, H.E.; Saltzman, A. Improving nutrition through biofortification: A review of evidence from HarvestPlus, 2003 through 2016. Glob. Food Secur. 2017, 12, 49–58. [Google Scholar] [CrossRef]
- Yang, X.D.; Sun, S.Q.; Li, Y.Q. Boron deficiency causes changes in the distribution of major polysaccharides of the pollen tube wall. Acta Bot. Sin. 1999, 41, 1169–1176. [Google Scholar]
- Lordkaew, S.; Konsaeng, S.; Jongjaidee, J.; Dell, B.; Rerkasem, B.; Jamjod, S. Variation in responses to boron in rice. Plant Soil 2013, 36, 287–295. [Google Scholar] [CrossRef]
- Rehman, A.; Farooq, M.; Nawaz, A.; Ahmad, R. Influence of boron nutrition on rice productivity, kernel quality and biofortification in different production systems. Field Crops Res. 2014, 169, 123–131. [Google Scholar] [CrossRef]
- Shahid, M.; Nayak, A.K.; Tripathi, R.; Katara, J.L.; Bihari, P.; Lal, B.; Gautam, P. Boron application improves yield of rice cultivars under high temperature stress during vegetative and reproductive stages. Int. J. Biometeorol. 2018, 62, 1375–1387. [Google Scholar] [CrossRef] [PubMed]
- Marschner, P. Mineral Nutrition of Higher Plants, 3rd ed.; Academic Press: London, UK, 2012. [Google Scholar]
- Shah, J.A.; Memon, M.Y.; Aslam, M.; Depar, N.; Sial, N.A.; Khan, P. Response of two rice varieties viz., Khushboo-95 and Mehak to different levels of boron. Pak. J. Bot. 2011, 43, 1021–1031. [Google Scholar]
- Rerkasem, B.; Netsangtip, R.; Lordkaew, S.; Cheng, C. Grain set failure in boron deficient wheat. Plant Soil 1993, 155–156, 309–312. [Google Scholar] [CrossRef]
- Shorrocks, V.M. The occurrence and correction of boron deficiency. Plant Soil 1997, 193, 121–148. [Google Scholar] [CrossRef]
- Rashid, A.; Yasin, M.; Ali, M.A.; Ahmad, Z.; Ullah, R. An alarming boron deficiency in calcareous rice soils of Pakistan: Boron use improves yield and cooking quality. In Advances in Plant and Animal Boron Nutrition, Proceedings of the 3rd International Symposium on All Aspects of Plant and Animal Boron Nutrition, Wuhan, China, 9–13 September 2005; Xu, F., Ed.; Springer: Dordrecht, The Netherlands, 2007; pp. 103–116. [Google Scholar]
- Rashid, A.; Muhammad, S.; Rafique, E. Genotypic variation in boron uptake and utilization by rice and wheat. In Boron in Plant and Animal Nutrition; Goldbach, H.E., Rerkasem, B., Wimmer, M.A., Brown, P.H., Thellier, M., Bell, R.W., Eds.; Kluwer Academic: New York, NY, USA, 2002; pp. 305–310. [Google Scholar]
- Chaiwong, N.; Lordkaew, S.; Yimyam, N.; Rerkasem, B.; Prom-u-thai, C. Silicon nutrition and distribution in plants of different Thai rice varieties. Int. J. Agric. Biol. 2018, 20, 669–675. [Google Scholar] [CrossRef]
- Lohse, G. Microanalytical azomethine-H method for boron determination in plant tissue. Commun. Soil Sci. Plant Anal. 1982, 13, 127–134. [Google Scholar] [CrossRef]
- Abdel-Motagally, F.M.F.; El-Zohri, M. Improvement of wheat yield grown under drought stress by boron foliar application at different growth stages. J. Saudi Soc. Agric. Sci. 2016, 17, 178–185. [Google Scholar] [CrossRef]
- Wang, S.; Yoshinari, A.; Shimada, T.; Hara-Nishimura, I.; Mitani-Ueno, N.; Ma, J.F.; Naito, S.; Takano, J. Polar localization of the NIP5; 1 boric acid channel is maintained by endocytosis and facilitates boron transport in Arabidopsis roots. Plant Cell 2017, 29, 824–842. [Google Scholar] [CrossRef]
- Diana, G. Boron in the soil, from deficit to toxicity. Inf. Agrar. 2006, 62, 54–58. [Google Scholar]
- Yamaji, N.; Ma, J.F. Metalloid transporters and their regulation in plants. Plant Physiol. 2021, 187, 1929–1939. [Google Scholar] [CrossRef]
- Rehman, A.; Farooq, M.; Rashid, A.; Nadeem, F.; Stuerz, S.; Asch, F.; Bell, R.W.; Siddique, K.H.M. Boron nutrition of rice in different production systems. A review. Agron. Sustain. Dev. 2018, 38, 25. [Google Scholar] [CrossRef]
- Wu, X.W.; Lu, X.P.; Riaz, M.; Yan, L.; Jiang, C.C. Boron toxicity induced different changes of the cell ultrastructure and architecture of components in different leaf segments of trifoliate orange. J. Environ. Manag. 2019, 246, 426–433. [Google Scholar] [CrossRef] [PubMed]
- Torun, B.; Kalayci, M.; Ozturk, L.; Ayfer, A.T. Differences in Shoot Boron Concentrations, Leaf Symptoms, and Yield of Turkish Barley Cultivars Grown on Boron-Toxic Soil in Field. J. Plant Nutr. 2007, 26, 1735–1747. [Google Scholar] [CrossRef]
- Choi, E.Y.; McNeill, A.M.; Coventry, D.; Stangoulis, J.C.R. Whole plant response of crop and weed species to high subsoil boron. Aust. J. Agric. Res. 2006, 57, 761–770. [Google Scholar] [CrossRef]
- Reid, R.J.; Fitzpatrick, K.L. Redistribution of boron in leaves reduces boron toxicity. Plant Signal. Behav. 2009, 4, 1091–1093. [Google Scholar] [CrossRef]
- Onuh, A.F.; Miwa, K. Regulation, diversity and evolution of boron transporters in plants. Plant Cell Physiol. 2021, 62, 590–599. [Google Scholar] [CrossRef]
- Nable, R.O.; Banuelos, G.S.; Paull, J.G. Boron toxicity. Plant Soil 1997, 193, 181–198. [Google Scholar] [CrossRef]
- Ma, J.F.; Tamai, K.; Yamaji, N.; Mitani, N.; Konishi, S.; Katsuhara, M.; Ishiguro, M.; Murata, Y.; Yano, M. A silicon transporter in rice. Nature 2006, 440, 688–691. [Google Scholar] [CrossRef]
- Mitani, N.; Yamaji, N.; Ma, J.F. Characterization of substrate specificity of a rice silicon transporter, Lsi1. Pflügers Arch.-Eur. J. Physiol. 2008, 456, 679–686. [Google Scholar] [CrossRef]
- Schnurbusch, T.; Hayes, J.; Hrmova, M.; Baumann, U.; Ramesh, S.A.; Tyerman, S.D.; Langridge, P.; Sutton, T. Boron toxicity tolerance in barley through reduced expression of the multifunctional aquaporin HvNIP2;1. Plant Physiol. 2010, 153, 1706–1715. [Google Scholar] [CrossRef]
- Shao, J.F.; Yamaji, N.; Liu, X.W.; Yokosho, K.; Shen, R.F.; Ma, J.F. Preferential distribution of boron to developing tissues is mediated by the intrinsic protein OsNIP3. Plant Physiol. 2018, 176, 1739–1750. [Google Scholar] [CrossRef] [PubMed]
- Nakagawa, Y.; Hanaoka, H.; Kobayashi, M.; Miyoshi, K.; Miwa, K.; Fujiwara, T. Cell-type specificity of the expression of OsBOR1, a rice efflux boron transporter gene, is regulated in response to boron availability for efficient boron uptake and xylem loading. Plant Cell 2007, 19, 2624–2635. [Google Scholar] [CrossRef] [PubMed]
- Uraguchi, S.; Fujiwara, T. Significant contribution of boron stored in seeds to initial growth of rice seedlings. Plant Soil 2011, 340, 435–442. [Google Scholar] [CrossRef]
- Rerkasem, B.; Jamjod, S. Boron deficiency in wheat: A review. Field Crops Res. 2004, 89, 173–186. [Google Scholar] [CrossRef]
- Dell, B.; Huang, L. Physiological response of plants to low boron. Plant Soil 1997, 193, 103–120. [Google Scholar] [CrossRef]
- Wang, Q.; Lu, L.; Wu, X.; Li, Y.; Lin, J. Boron influences pollen germination and pollen tube growth in Picea meyeri. Tree Physiol. 2003, 23, 345–351. [Google Scholar] [CrossRef]


Disclaimer/Publisher’s Note: The statements, opinions and data contained in all publications are solely those of the individual author(s) and contributor(s) and not of MDPI and/or the editor(s). MDPI and/or the editor(s) disclaim responsibility for any injury to people or property resulting from any ideas, methods, instructions or products referred to in the content. |
© 2023 by the authors. Licensee MDPI, Basel, Switzerland. This article is an open access article distributed under the terms and conditions of the Creative Commons Attribution (CC BY) license (https://creativecommons.org/licenses/by/4.0/).