Abstract
The water needs for tomato crops are very high and could limit the viability of cultivation in semiarid environments. There is no agreement among works on irrigation regarding the sensibility of the flowering period. In addition, there is a lack of studies about the effects of water stress on fruit and cluster development under severe water stress. The aim of this work was to evaluate the effect of water stress and rehydration during cluster development. The experiment was conducted in a greenhouse (Seville, Spain) in two different growth cycles (autumn 2021 and spring 2022) using three different cultivars. Two irrigation treatments were applied: a control, with full irrigated conditions, and severe stress, without irrigation during the development of the fifth cluster (43 days (autumn) and 21 days (spring) after transplantation) followed by rehydration. Plant height was significantly decreased, by approximately 10%, in the irrigation treatment during the autumn cycle, however, not in spring. A delayed cluster emergence occurred, however, the final number per plant at the end of the experiment was the same when rehydration was applied (73 and 56 days after transplanting). In the autumn cycle, only the fruit size was considerably affected, with more than a 50% reduction on some dates, though not in the first cluster. However, the extremely severe water stress during the spring cycle, with strong defoliation, reduced the number (around 50%) and size (around 40%) of the fruit. Total soluble solids increased only on isolated dates of the harvest in the stress plants. The response of cherry cultivars to water stress was similar in terms of quality parameters. Fruit size was the most sensitive yield component, and no recovery was detected at harvest after rehydration. The effect of severe water stress was different depending on the evaporative demand and, more importantly, on fruit size.
1. Introduction
Tomato (Solanum lycopersicum L.) is one of the most important vegetable crops around the world. The tomato is cultivated in greenhouses or outdoors for different uses, such as processing or fresh consumption. Cultivation systems are closely related to the growth patterns, and so greenhouse cultivars typically show an indeterminate growth, whereas outdoor cultivars could be either determinate, usually for processing uses, or indeterminate. Recent works suggested that climatic changes will reduce tomato yield due to the increase in temperature [1], however, this would probably just move the production zones. Water scarcity would be the most limiting factor for this crop in the context of climatic change. Water needs for tomato cultivation are high, between 400–600 mm depending on the climate, plant type, soil irrigation, and crop management [2].
Water scarcity limits tomato cultivation in some traditional areas, such as Mediterranean countries, and deficit irrigation management could help reduce part of this considerable economic impact. Sustained deficit irrigation tended to reduce yield ([3,4], among others), although such reductions were not always significant [5,6]. A meta-analysis of different articles suggested that soil texture is one of the most important variables to consider when evaluating the yield response [7]. This suggests that, actually, the water stress level would be the limiting factor. Regulated deficit irrigation (RDI) works have identified the most drought-sensitive phenological stages. Some works concluded that the information about the response to water stress was more limited than that about the moment of application, which was in theory, well established [8]. Flowering, like in other species, was reported as the most sensitive period in terms of yield [9,10], although some works indicated that there was no yield reduction under moderate water stress conditions in this period [6,11,12,13]. The duration and level of the water stress were typically identified as the reasons for the different responses to irrigation strategies [14]. The responses to sustained irrigation strategies were examples of this, and some works reported a significant yield decrease in cases of irrigation strategies that withhold the amount of water after fruit set, though the maximum yield was achieved when the water applied was reduced by 50% during the same period [9].
Managing water stress in RDI scheduling is difficult since it requires evaluating the plant’s capacity to recover from such conditions and knowing the yield response to different levels and durations of water stress. Some works studied the response of cultivated and wild tomato plants in pots and concluded that the stomata closure determined the drought resistance [15]. In this latter work, plant rehydration showed that leaf conductance delayed recovery by six days in comparison to leaf water potential [15]. The gas exchange has been reported as one of the most important factors associated with the improvement of new tomato cultivars and the enhancement of yield in the production process [16]. Another important issue is the growth pattern of each cultivar, and there is great variability depending on this factor, as shown by the leaf parameters, yield, and fruit quality in recent studies [17]. In some cases, these differences are only observed at biochemical and molecular levels [18]. On the other hand, indeterminate cultivars experience vegetative growth, fruit set, fruit ripening and, even, cluster development simultaneously and this hindered the identification of the optimum period for RDI scheduling. In fact, irrigation works that attempted to accurately manage water stress using the leaf water potential, while ignoring the phenological stage, experienced a sharp [3] or moderate decrease in the yield in the spring cycles [19].
Previous works reported different yield responses to irrigation strategies likely related to the level of water stress. However, the effect of water stress and recovery on plant and cluster development during a season has not been commonly studied. These results could be very important to understand the response of size and fruit quality to different irrigation strategies. Moreover, severe water stress conditions were not typically reported in previous field works and neither was the recovery response on yield quality parameters. The aim of this work was to describe the effect of drought cycles on vegetative growth, fruit, and cluster development under pot conditions in two different growth cycles (autumn and spring). Pot experiments would allow applying very severe water stress conditions and fast recovery to study the main effects on fruit and plant development. The hypothesis of this experiment was that a complete recovery from water stress could reduce the impact on clusters and fruit quality.
2. Materials and Methods
2.1. Site and Experiment Description
The experiments were carried out in a greenhouse of Escuela Técnica Superior de Ingeniería Agronómica (E.T.S.I.A.) of the University of Seville, Spain (37° 21′ N, 5° 56′ W, 33 m. a.s.l.) from October to December 2021 (autumn cycle) and March to June 2022 (spring cycle). Radiation transmissibility in the greenhouse was 75%. Passive ventilation was used with lateral and zenithal windows. The autumn cycle was conducted with one indeterminate growth cherry tomato cultivar (cv “Grandbrix”). The spring cycle included this cultivar also, in addition to two other indeterminate cultivars, another cherry cultivar (cv “Lazarino”) and a pear cultivar (cv “Bielsa”), all of them provided by the Fitó Company (Barcelona, Spain). They were sowed in a nursery seedling and transplanted after 30 days to sixteen (autumn cycle) and eighteen (six per cultivar) 20 L pots with one plant each, filled with a mixture of peat, blond, and black (1:1), corrected with calcium dolomite, with a pH 6.2, and an EC of 1.7 mS·cm−1. It was fertilized with Osmocote PRO for 6 months (4 g·L−1). Pots were watered with 1 dropper of 4 L h−1. An irrigation controller (Galcon 11000EZ) scheduled the daily irrigation time.
The autumn experiment ran from DOY (day of the year) 277 to DOY 350, and its design was a completely randomized–blocked design with four blocks of three pots each. The spring experiment was conducted from DOY 89 to DOY 152 with a split-plot design (main factor: cultivar, and second factor: irrigation) of three pots per cultivar and irrigation combination. Irrigation treatments were full irrigated conditions, 125% crop evapotranspiration (Control), and Stress. In the autumn cycle, drought cycles in the stress treatment were applied based on fruit development and water stress level:
- -
- First drought cycle (DOY 280–298) started when the first cluster was developing, and the water stress was controlled with several irrigation events to reduce the water potential and reach the threshold of −0.8 MPa.
- -
- Second drought cycle (DOY 302–323) was applied when the fifth cluster was developing and no irrigation was provided during the entire period.
During the spring cycle, only a single water stress period was programmed at the fifth cluster of development from DOY 110. The objective of this treatment was to obtain a water stress level of around −2 MPa. However, due to the extreme temperature conditions and although the pot weight was similar to the autumn cycle, all plants presented wilting symptoms and a strong defoliation at DOY 126 (Scheme 1). This meant that water status measurements were not taken from this date onwards. For both drought cycles, rehydration was achieved with initial over irrigations until reaching the pot weight of the control plants.
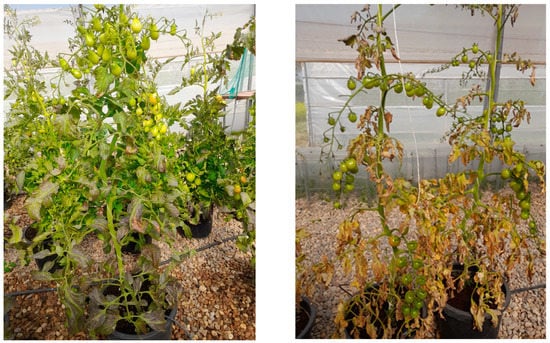
Scheme 1.
Control (left) and stress (right) plants before rehydration, when minimum pot weight was measured (cv Grandbrix). All cultivars in the water stress treatment presented a similar aspect.
Climatic conditions were described using the reference evapotranspiration (ETo) and maximum and minimum temperatures (Figure 1).
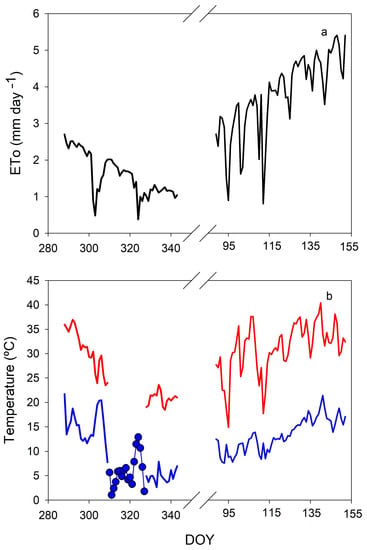
Figure 1.
Pattern of reference evapotranspiration (ETo) (a) and maximum and minimum temperature (b) in the greenhouse during the experiments. Points in (b) are data on the minimum daily outdoor temperature.
ETo inside the greenhouse was estimated by means of a greenhouse model [20] based on the external radiation data from an Andalusian network of agroclimatic stations (La Rinconada [21] (Figure 1a). During the autumn cycle, ETo decreased progressively throughout the experiment from 2.5 to 1.0 mm day−1, and values were extremely low on some dates. Conversely, ETo increased progressively from 3.0 to 5.0 mm day−1 in the spring cycle. The temperature inside the greenhouse was also measured with a temperature and humidity sensor attached to a CR1000 datalogger (Campbell Sci, UK). As for ETo data, the temperature decreased throughout the experiment during the autumn cycle (Figure 1b). Minimum temperatures were higher than 15 °C until DOY 308, with daily maximum values higher than 35 °C. Then, there was a partial data loss, however, according to external temperature data sources, the minimum temperatures were below 5 °C and reached values even close to 0 °C. At the end of this cycle, the values were steady at around 20/5 °C. In the spring cycle, temperatures were steadier and higher than in the autumn cycle. On most dates, maximum temperatures oscillated between 30–35 °C, with some data near 40 °C by the end of the cycle. Minimum temperatures increased from 10 °C at the beginning of the cycle to approximately 15 °C.
2.2. Measurement Description
Water relations were described using the midday leaf water potential, net photosynthesis, and pot weight measurements in 4 pots per treatment (autumn cycle) and 3 pots per combination of factors (spring cycle). Water potential was measured every week on one leaflet of healthy, completely expanded, well-illuminated leaves at midday in a pressure chamber (PMS1000, PMS, Albany, OR, USA). Net photosynthesis was measured simultaneously with the water potential, though only on some dates in both growth cycles, on one leaflet per repetition, using an infrared gas analyzer (CI-340, CID BioScience, Camas, WA, USA). Average conditions of net photosynthesis were measured under the following conditions: 503 μmol m−2 s−1 of radiation, 354 ppm CO2, and 26.3 °C in autumn and 956 μmol m−2 s−1 of radiation, 350 ppm CO2, and 29.2 °C in the spring cycle. Water potential and net photosynthesis were not measured in the spring cycle from DOY 126 due to the low number and small size of the leaves in the stress plants. The soil–water content pattern was estimated using the weekly pot weight of plants in each growth cycle.
Plant development was characterized by means of the weekly measurement of plant height and the number of clusters in 4 pots per treatment (autumn cycle) and 3 pots per combination of factors (spring cycle). In addition, the number of fruits and flowers in the first and fifth cluster of the same pots were also counted every week. Fruits were harvested individually from all pots when they reached commercial ripening (around 80–100% red stage), then they were classified, weighed, and counted per pot. Noncommercial fruits were identified and weighed. Noncommercial features were blossom end rot (BER) damage, yellow shoulder, and split fruit (Scheme 2).
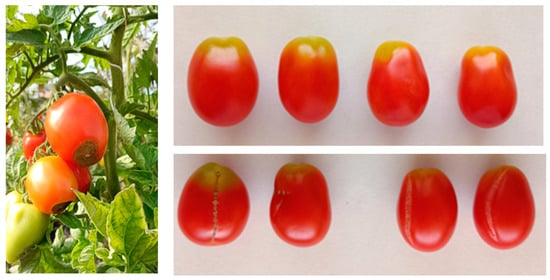
Scheme 2.
Physiological problems observed in the second experiment. Blossom end rot (BER) in Bielsa fruits (left). Yellow shoulder (right up) and split fruit (right down) in GrandBrix fruits.
Fruit weight was estimated for each pot as the ratio between the total weight and the number of commercial fruits. Three fruits per pot were randomly selected to measure soluble solids (TSS) using a hand refractometer RHC-200ATC (Huake, China). The average of these measurements per pot was used for comparison.
Data analyses were performed using ANOVA, and significant differences were considered when the p-level was <0.05. Data normality was verified with the Shapiro–Wilks test and homoscedasticity with the Bartlett test. Data independence was assumed by experimental design and data collection.
3. Results
3.1. Water Relations
The pattern of pot weight showed the soil–water content and plant development throughout both experiments (Figure 2).
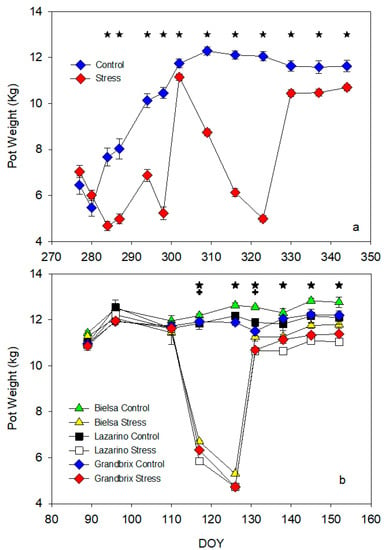
Figure 2.
Pattern of pot weight along the autumn (a) and spring (b) cycles. Each symbol is the average of 4 (autumn cycle) or 3 (spring cycle) data. Vertical bars represent the standard error. Asterisks (irrigation treatments) and crosses (cultivars) indicate the date when significant differences were found (p < 0.05).
In the first experiment (autumn, Figure 2a), pot weight in the control plants increased until DOY 310, then it remained almost constant until the end of the experiment. Part of this increase was associated with plant growth. The control pots were considerably heavier than the stress pots on most dates. The stress pattern showed the two drought cycles: first, from DOY 280 to DOY 300, then, from DOY 300 to DOY 320. The decrease in weight was sharper in the second drought cycle than in the first. The recovery of the stress plants was fast in both cycles, however, the values were always markedly lower than the control. The pattern in the second experiment (spring, Figure 2b) was similar to the previous cycle. There were no significant differences at the beginning of the experiment, though irrigation treatment greatly reduced pot weight from one week after it started (DOY 117). This decrease in weight was faster than the one reported in the autumn cycle. The same reduction was reached after two weeks vs. just one (Figure 2a,b). The rehydration increased pot weight but, as in the previous experiment, with important differences (up to 1 kg) between irrigation treatments (Figure 2b). The cultivars also had an important impact on two dates (DOY 117 and DOY 131) and cv Bielsa pots were heavier than those with the other two cultivars. Although the minimum pot weight was similar in both experiments, the effect on plants was very different. In the second experiment, Stress plants lost most of their leaves and no measurements of water potential or net photosynthesis were possible from this date onwards (Scheme 1).
Water relations were affected only when the decrease in pot weight was high (Figure 3 and Table 1). In the first experiment, important differences in leaf water potential were found only on DOY 287 and DOY 323, while the rest of the data were almost equal (Figure 3). The greatest differences in leaf water potential were reported at the end of the second drought cycle, after more than 21 days without irrigation, with previous data being almost equal.
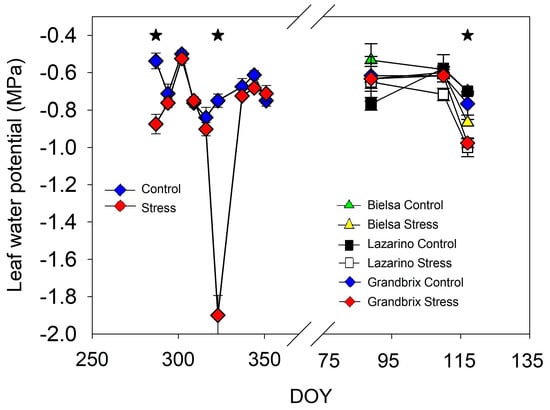
Figure 3.
Pattern of midday leaf water potential during both experiments. Each symbol is the average of 4 (autumn cycle) or 3 (spring cycle) data. Vertical bars represent the standard error. Asterisks (irrigation treatments) indicate the date when significant differences were found (p < 0.05).

Table 1.
Midday net photosynthesis (Pn) measurements in the two experiments (average and standard error). The ratio between stress and control measurements is shown in brackets. Lowercase letters show statistical differences in relation to irrigation treatment, while capital letters indicate cultivars differences (only second experiment) (p < 0.05).
In the second experiment, marked differences in water potential due to irrigation were measured for all cultivars on DOY 117. Net photosynthesis was also reduced when pot weight was very low (Table 1). In the first experiment, important differences were found only on the last date of the period without irrigation, when the gas exchange was reduced to 40% of that for control plants. The values on the previous date, two weeks into the drought cycle, were alike. Similarly, the recovery of net photosynthesis was completed after two weeks of rehydration. In the second experiment, only two dates of measurements were obtained (Table 1). Before the beginning of the irrigation treatment, cv Lazarino was much lower in net photosynthesis than cv Bielsa and Grandbrix. However, the increase in evaporative demand reduced net photosynthesis in all plants on DOY 117 and no major differences within cultivars were found. On this date, the stress plants reduced gas exchange considerably in all cultivars, by around 50% in comparison to the control (Table 1).
3.2. Plant and Fruit Development
The response of plant height was different during the two experiments (Figure 4). In the autumn cycle, the maximum growth rate was measured up to DOY 315, and height was constant from DOY 330 onwards due to the pinching of the main bud (Figure 4a). Stress plants tended to show lower height values from the initial date, however, such differences were not important until the third date of measurement, by the end of the first drought cycle. The growth rate of the stress plants was almost constant until DOY 315, though the slope was not as steep as in the control. Stress height stopped at the end of the drought cycle and recovered after rehydration, resulting in different values from the control.
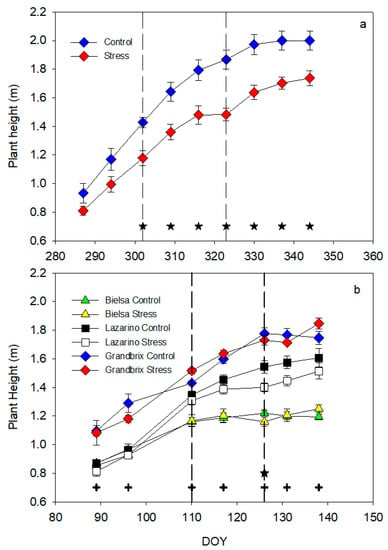
Figure 4.
Pattern of plant height during the autumn (a) and spring (b) experiments. Each symbol is the average of 4 (autumn cycle) or 3 (spring cycle) data. Vertical bars represent the standard error. Vertical lines show the period of water stress. Asterisks (irrigation treatments) and crosses (cultivars) indicate the date when significant differences were found (p < 0.05).
However, in the second experiment (Figure 4b), the most important differences occurred between cultivars. The pattern of growth was similar in all cultivars, though the height was clearly different. The greatest height was measured always in Grandbrix, while cv Lazarino was smaller, yet higher than Bielsa from DOY 110. Stress plants were similar in height to control in all cultivars and even the growth pattern was almost the same. Only on DOY 126, the date of minimum pot weight did irrigation treatments cause relevant differences, although they were not very important when compared to Control.
Cluster development varied in parallel to plant height in both experiments (Figure 5). In the autumn cycle (Figure 5a), major differences between irrigation treatments were found only on DOY 302 and DOY 330.
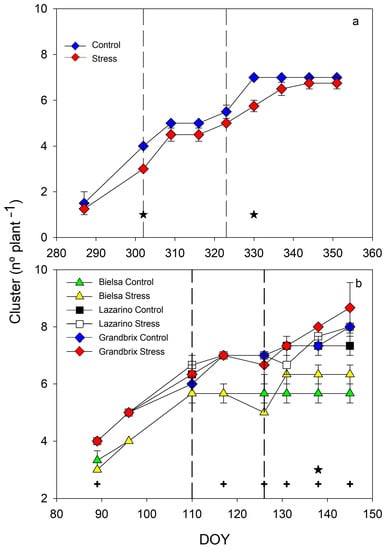
Figure 5.
Pattern of cluster appearance along the autumn (a) and spring (b) experiments. Each symbol is the average of 4 (autumn cycle) or 3 (spring cycle) data. Vertical bars represent the standard error. Vertical lines show the period of water stress. Asterisks (irrigation treatments) and crosses (cultivars) indicate the date when significant differences were found (p < 0.05).
These differences disappeared after one week, though stress plants tended to have lower values than the control. There was a wide period, between DOY 309 and DOY 323 when the number of clusters in both treatments stopped. This was probably related to the great decrease in minimum temperatures, which reached values below 5 °C and close to 0 °C (Figure 1). The maximum number of clusters in each treatment was seven due to the pinching of the main bud when these clusters first appeared. Water stress cycles were coincident with the development of the first and the fifth cluster, respectively. During the second experiment (Figure 5b), the pattern of cluster development was similar to the previous one. The main relevant differences occurred between cultivars, and so cv Bielsa had fewer clusters than Grandbrix and Lazarino, which were almost equal. In this experiment, plants were not pinched though the cluster emergence stopped in all cultivars and treatments from DOY 110 due to a great increase in maximum temperature (Figure 1). Clusters increased from DOY 140 only in cv Grandbrix and Lazarino. Important differences related to irrigation treatments were found only on DOY 138 when the stress plants showed a slightly higher number of clusters than the control for all cultivars. Previously, on DOY 126 and DOY 131, Stress plants decreased the number of clusters, although such a reduction was not important. In this experiment, the water stress cycle started with the development of the fifth cluster.
Water stress conditions affected the phenological development of plants when the first and fifth clusters were compared in the first experiment (Figure 6). To provide further clarity, the autumn cycle is presented in Figure 6 with the full set of data, while only the number of fruits in the spring cycle is presented in Figure 7. The number of flowers and fruits in the first cluster was almost constant from DOY 309 in both treatments; with a clear trend for the stress plants to reach lower values than the control (Figure 6a). The slight decrease in control was related to the fruit harvest. Conversely, the number of flowers and fruits in the fifth cluster increased from DOY 309 until it reached constant values at around DOY 330, for both treatments. Relevant differences in the count of flowers and fruits in the fifth cluster between treatments appeared only on DOY 316, with a greater amount in the control than in the stress (Figure 6a).
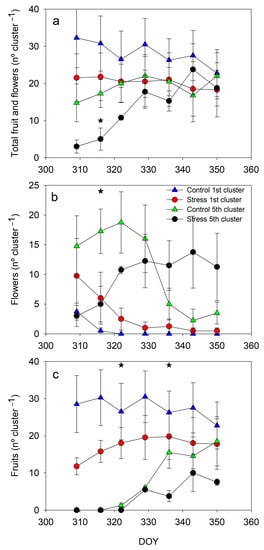
Figure 6.
Pattern of fruit and flowers per cluster in the first and fifth cluster during the autumn experiment (a) Total fruit positions (flowers and fruits); (b) Total flowers (c) Total fruits. Each symbol is the average of 4 values. Vertical bars represent the standard error. Asterisks indicate significant differences on that date only in the fifth cluster. No significant differences were found in the first cluster (p < 0.05).
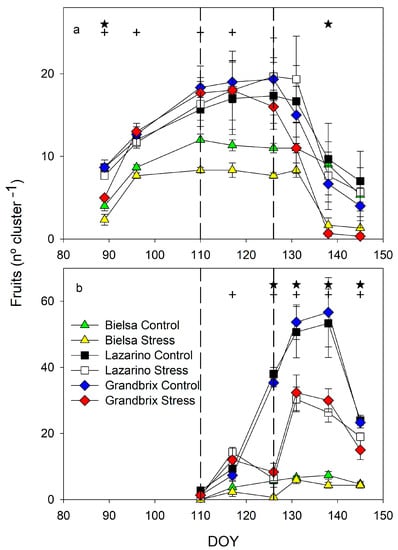
Figure 7.
Pattern of fruit per cluster in the (a) first and (b) fifth cluster during the spring experiment. Each symbol is the average of 3 data. Vertical bars represent the standard error. Vertical lines limit the water stress period. Asterisks (irrigation treatments) and crosses (cultivars) indicate the date when significant differences were found (p < 0.05).
Although the number of fruits and flowers in the control plants was clearly higher at the beginning, it almost evened out from that date onwards. When the number of flowers (Figure 6b) and fruits (Figure 6c) were considered separately, they revealed phenological differences for both clusters. In the first cluster, there were no important differences in the measurement dates. But in the control, almost all cluster positions were fruits (zero flowers) from DOY 309, while this situation was delayed in the stress plants by approximately 20 days (Figure 6b). The development of the fifth cluster was monitored from earlier stages than the first one. The maximum number of flowers was measured on DOY 323 in control and around DOY 330 in stress plants. The number of flowers differed markedly on DOY 316, but control was clearly greater from DOY 309 until DOY 323 (Figure 6b). The decrease in the number of flowers and the increase in fruits occurred faster in the control than in the stress treatment, with great variability in the number of fruits on DOY 323 and 337 (Figure 6c). The number of fruits in the fifth cluster by the end of the experiment tended to lower values in the stress than in the control.
The development of the first and fifth clusters in the second experiment was also different. Only the fruit number is shown in order to further clarify (Figure 7). In the first cluster (Figure 7a), only the cultivar effect was significant from the beginning of the experiment (until DOY 117). The number of fruits per cluster was much lower in cv Bielsa than in Grandbrix or Lazarino, which were almost equal. The decrease in the number of fruits was due to the harvest of this cluster. The effect of irrigation treatment in this first cluster was relevant only on DOY 138, when stress plants produced a lower number of fruits, in Bielsa and Grandbrix, almost zero. The maximum number of fruits in this first cluster was similar for the different irrigation treatments. The differences between cultivars were also important in the fifth cluster, with a lower number of fruits in cv Bielsa than in the other two cultivars (Figure 7b). Differences between irrigation treatments were considerable from DOY 126 until the end of the experiment. The maximum number of fruits was clearly reduced in the irrigation treatments. Stress plants lost fruits on DOY 126 in all cultivars, however, they increased one week after rehydration. Such an increase allowed the number of fruits in cv Bielsa to reach similar values, although they were still lower than the control in cv Grandbrix and Lazarino.
3.3. Yield Response in Terms of Quantity and Quality
Fruit production was strongly and significantly affected in the stress plants compared to the control ones (Figure 8).
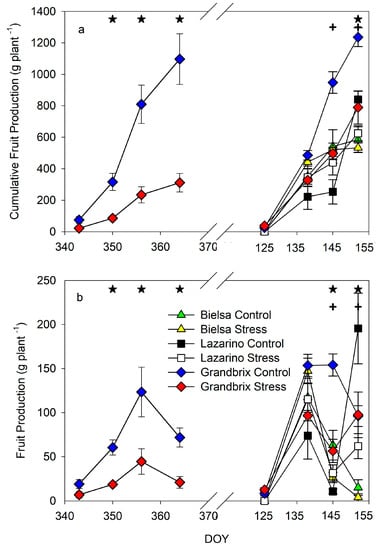
Figure 8.
Pattern of cumulative fruit production (a) and weekly fruit production (b) during both experiments. Each symbol is the average of 4 (autumn cycle) or 3 (spring cycle) data. Vertical bars represent the standard error. Asterisks (irrigation treatments) and crosses (cultivars) indicate the date when significant differences were found (p < 0.05).
During the first experiment, cumulative fruit production increased in both treatments, though such an increase was faster in the control than in the stress (Figure 8a). Important differences were found from DOY 350 and, by the end of the experiment, control values were around sixfold greater than stress ones (Figure 8a). Weekly fruit production showed those differences on all harvest dates, and they were not a cumulative effect (Figure 8b). Fruit per plant presented a similar pattern in both treatments, though absolute values were three-fold greater in the control than in the stress. The second experiment confirmed the results obtained in the first one. Major differences in terms of cumulative production were found between cultivars, and Grandbrix generated greater values than the other two (Figure 8a). In this experiment, the irrigation treatment had an impact on cumulative production only on the last date (Figure 8a). However, such differences were related to the variability between cultivars. Weekly production got markedly reduced in Stress plants from DOY 145 (Figure 8b). The response of cumulative production for different cultivars by the end of the experiment was slightly different, and Grandbrix (36%) showed the greatest reduction, with hardly any decrease in Bielsa (9%).
The fruit quality was also affected by water stress conditions (Figure 9). In both experiments, fruit weight was not affected on the first date of harvest, however, it was on the rest of the sampling dates (Figure 9a). The pattern of fruit weight was different between experiments. In the autumn cycle, fruit weight was almost constant in the control treatment at approximately 14 g per fruit. It progressively decreased throughout the harvest period in the stress plants (Figure 9a). Control presented significantly bigger fruits than stress, around threefold larger by the end of the experiment. In the second experiment, only Grandbrix and Lazarino were measured since almost all fruits of Bielsa suffered blossom end rot (BER). Control plants presented a variable fruit weight, though on all dates, except the first, the stress plants were clearly and significantly lower. On the other hand, total soluble sugars (TSS) were different only during a narrow period in both experiments (Figure 9b). In the first one, the TSS values were constant in the control fruits, with values around 8° Brix (Figure 9b).
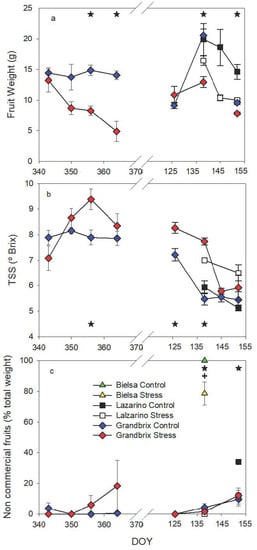
Figure 9.
Pattern of fruit weight (a), total soluble sugars (TSS) (b) and noncommercial fruits (c) during the experiments. Each symbol is the average of 4 (autumn cycle) or 3 (spring cycle) data. Vertical bars represent the standard error. Asterisks (irrigation treatments) and crosses (cultivars) indicate the date when significant differences were found (p < 0.05).
In stress plants, TSS values were similar at the beginning, though they increased on the following three harvest dates, reaching greater values than the control on DOY 356 (Figure 9b). In the second experiment, important differences were found on the first and second harvest dates (DOY 126 and DOY 138), however, not in the rest. The pattern of TSS in this experiment was similar for both cultivars, with minimal differences, and it reflected a decrease during the harvest period. Finally, noncommercial fruits were not seriously affected during the first experiment. In the second experiment, almost the entire production of cv Bielsa developed BER symptoms (Scheme 2), although stress plants did it in a lower percentage than the control. In cv Lazarino, the number of noncommercial fruits increased sharply in the control by the end of the experiment, although it was due to “yellow shoulder” and “split fruits” (Scheme 2). On the other hand, the control and the stress plants of cv Grandbrix were similar, and the negative features were the same as the stress plants of cv Lazarino.
4. Discussion
The response to water stress varied according to the intensity and the process considered. Vegetative growth was the earliest process affected by the drought cycles (Figure 4) which caused a delay in the cluster and fruit set development (Figure 5 and Figure 6). However, this was less clear in the spring cycle than in the autumn cycle. Growth only stopped when extremely severe water stress conditions were imposed. A moderate water stress level at the beginning of the experiment only reduced the vegetative growth. Expansive growth was the most sensitive process to drought conditions [14]. The lack of response during the spring cycle was probably related to the high maximum temperatures (greater than 30 °C) and the great thermal periodicity (difference between night and day) (Figure 1) which limited the growth of all plants. Some works suggested a threshold of 25 °C and a thermal periodicity of 5–7 °C beyond which tomato yield was affected [21]; these values were exceeded in the spring cycle (Figure 1). These conditions affected all cultivars used in the spring experiment and it suggests a common temperature threshold as reported in [22]. Water relations were less sensitive than vegetative growth and were influenced by the evaporative demand. A low evaporative demand (autumn cycle) delayed differences in water potential and gas exchange until severe water stress conditions were achieved, however, this was not the case in spring (Figure 2 and Figure 3). Recovery of water relations and growth were fast in both cycles considering the level of water stress (Figure 3 and Table 1). Several works reported a fast recovery of the water potential [9,15], though a delay of several days occurred in the leaf gas exchange, which changed in different works [9,15,23]. The recovery of gas exchange could be important for the yield response since it improves photosynthesis and has been considered one of the main changes in tomato-producing programmes intended to increase yield [16,18]. Having said that, the most important factor is the growth recovery, even after strong defoliation periods such as the spring cycle, as it would probably ensure a minimum income. This suggests that severe water stress during short periods could be researched in further works.
The most important yield component is the number of clusters and fruits. Cluster, flower, and fruit development were delayed in the stress plants compared to the control (Figure 5, Figure 6 and Figure 7). Such delay was unrelated to the development stage of the cluster and it appeared to be common to all cultivars. The number of flowers and fruits in each cluster was not clearly affected in the autumn cycle (Figure 6), however, they were in the spring cycle (Figure 7). Flowering and fruit sets are typically considered very sensitive to water stress and they can be associated with a reduction in yield [2,3,9,24]. However, the yield component that caused this reduction has not been well described. Current data shows that the number of fruits per cluster could be more drought resistant than previous works suggested, particularly in clusters in where the fruit set has been completed. On the other hand, fruit size was the most sensitive to water stress in both cycles (Figure 9). The number of fruits was not significantly affected in some irrigation works [19,24,25,26], though it was in others [13].
Fruit weight and TSS are features very important in tomato quality. The current work suggested that the decrease in fruit size occurred in all clusters where fruits were still growing. Only fruits harvested on the first date from the first cluster did not suffer a reduction in size (Figure 9 first dates) since they were in the ripening phase, which was accelerated (Figure 6 and Figure 7). Moreover, fruits harvested during the rehydration period, when water relations differences were not reported, presented significant a reduction in weight (Figure 9). Some works reported an important decrease in the number and weight of fruits when water stress was applied from the fruit set [9]. In this latter work, the diameter of the fruits was affected in all periods, even in early cluster development, although a complete rehydration was reported [9]. Conversely, results reported in [13] suggested a decrease in the number of fruits occurred before a reduction of weight under deficit irrigation conditions. The increase in TSS was small and only detected in fruits harvested early after the drought stress (Figure 9). Then, the accumulation of sugar promoted by water stress occurred only in some phenological stages of fruit development. Some works reported that the greatest accumulation of sugar related to water stress occurred when fruits were in the pink stage [27]. Therefore, further works could look into an accurate management of water stress to improve yield (quality or quantity) in sensitive periods, such as flowering, or even more resistant, such as ripening.
Therefore, water stress management becomes very difficult since, although the plant recovers, the impact on fruit would be permanent. Water stress levels and duration in the current work were probably very severe, even under low evaporative demand conditions. However, even under the extreme conditions of the spring cycle, yield differences were smaller (Figure 8) than expected according to the plant appearance (Scheme 1). Shorter periods or more moderate levels than those considered in the current work could reduce the differences in fruit size. Autumn cycles did not usually present any differences in yield [5,19], as did not outdoor conditions with a greater amount of rain [11]. Autumn cycles could be a very interesting strategy to reduce water needs, due to the reduction of the evaporative demand [28]. Different works suggested flowering periods as more adequate for irrigation restrictions [12], however, others reported them as being sensitive [8]. All these results suggest that controlling the water stress could decrease the impact on fruit weight or minimize the effect on yield, for instance [13]. Water potential could be a useful tool to manage water stress, though the effect of evaporative demand should be considered in further works as suggested [29]. In the current work, differences in water potential were found only under very severe conditions (Figure 3, Table 1) following several days after the soil started to dry (Figure 2) or under conditions of great evaporative demand (Figure 1). Such a response could limit its use in spring cycles. Several works suggest that water potential could be an indicator of deficit irrigation in tomato crops [3,19] with good results in autumn and low evaporative demand conditions [19]. A greater water capacity of the soil could partially compensate for the lack of response under low evaporative demand conditions. Soil moisture has also been suggested as a possible water stress indicator for deficit irrigation in tomato production [6]. The matric water potential was considered more adequate than the volumetric water content [30].
Tomato is a widely cultivated vegetable species and the number of cultivars is high. The response of these cultivars to water stress and, therefore, regulated deficit irrigation, could be very different. The current data suggest that water status and yield response were similar in the two cherry cultivars, with a very important effect on fruit size. For all cultivars, these effects of water stress depended on the high temperatures reached in the spring cycle, which reduced mainly the cv Bielsa commercial yield. This increase of BER in cv Bielsa, in control and stress plants, did not allow evaluating the fruit size and could reduce the differences between both irrigation treatments, in which yield was almost equal (Figure 8). Some works suggested that tomato yield could be reduced by 12.6% with each 1.2 °C increase in temperature above 25 °C [22]. However, this effect could be different depending on each cultivar. Differences between [13] and the current work could be explained by variations between processing [13] and fresh cultivars (current work). The interaction of these high temperatures in the response of each cultivar to water stress could be useful when defining a regulated deficit irrigation strategy in further works.
5. Conclusions
Tomato plants were very resistant to water stress conditions with a similar response from different cultivars. Drought conditions delayed the plant development, however, it did not affect their potential production capacity, even though flower and fruit development was affected at very different stages. Only under extremely severe stress, and in the fruit set stage, the number of fruits decreased in the clusters, affecting production quality. The physiological recovery was fast but the impact of water stress on yield was permanent. The recovery did not guarantee a reduction of the impact on fruit size, even when no water stress effects were detected after almost one month under low evaporative demand. Conversely, the effect on total soluble solids was probably related to the fruit phenological stage when drought conditions were applied. The water stress level used in the current work was extremely severe and uncommon in deficit irrigation scheduling. Results suggest that the reduction in yield due to irrigation restrictions during flowering could be lower than expected if the water stress was controlled.
Author Contributions
Conceptualization, M.J.M.-P. and A.M.; methodology: M.C. and M.A.-M.; formal analysis, M.A.-M., L.A. and P.C.-V.; investigation, L.A., A.M., P.C.-V. and M.A.-M.; writing—original draft preparation, A.M. and M.A.-M. writing—review and editing, P.C.-V., M.J.M.-P. and M.C. All authors have read and agreed to the published version of the manuscript.
Funding
This research received no external funding.
Data Availability Statement
Not applicable.
Conflicts of Interest
The authors declare no conflict of interest.
References
- Cammarano, D.; Ronga, D.; Di Mola, I.; Mori, M.; Parisi, M. Impact of climate change on water and nitrogen use efficiencies of processing tomato cultivated in Italy. Agric. Water Manag. 2020, 241, 106336. [Google Scholar] [CrossRef]
- Battilani, A.; Prieto, M.H.; Argerich, C.; Campillo, C.; Cantore, V. Tomato. In Crop yield response to water; Steduto, P., Hsiao, T.C., Fereres, E., Raes, D., Eds.; FAO Irrigation and Drainage Paper nº 66; FAO: Rome, Italy, 2012; pp. 192–201. [Google Scholar]
- Pulupol, L.U.; Behboudian, M.H.; Fisher, K.J. Growth, Yield, and Postharvest Attributes of Glasshouse Tomatoes Produced under Deficit Irrigation. Hortscience 1996, 31, 926–929. [Google Scholar] [CrossRef]
- Topcu, S.; Kirda, C.; Dasgan, Y.; Kaman, H.; Cetin, M.; Yazici, A.; Bacon, M. Yield response and N-fertiliser recovery of tomato grown under deficit irrigation. Eur. J. Agron. 2007, 26, 64–70. [Google Scholar] [CrossRef]
- Kirda, C.; Cetin, M.; Dasgan, Y.; Topcu, S.; Kaman, H.; Ekici, B.; Derici, M.; Ozguven, A. Yield response of greenhouse grown tomato to partial root drying and conventional deficit irrigation. Agric. Water Manag. 2004, 69, 191–201. [Google Scholar] [CrossRef]
- Patanè, C.; Cosentino, S. Effects of soil water deficit on yield and quality of processing tomato under a Mediterranean climate. Agric. Water Manag. 2010, 97, 131–138. [Google Scholar] [CrossRef]
- Lu, J.; Shao, G.; Cui, J.; Wang, X.; Keabetswe, L. Yield, fruit quality and water use efficiency of tomato for processing under regulated deficit irrigation: A meta-analysis. Agric. Water Manag. 2019, 222, 301–312. [Google Scholar] [CrossRef]
- Khapte, P.; Kumar, P.; Burman, U.; Kumar, P. Deficit irrigation in tomato: Agronomical and physio-biochemical implications. Sci. Hortic. 2019, 248, 256–264. [Google Scholar] [CrossRef]
- Zegbe, J.A.; Behboudian, M.H.; Clothier, B.E. Responses of ‘Petopride’ processing tomato to partial rootzone drying at different phenological stages. Irrig. Sci. 2005, 24, 203–210. [Google Scholar] [CrossRef]
- Chen, J.; Kang, S.; Du, T.; Guo, P.; Qiu, R.; Chen, R.; Gu, F. Modeling relations of tomato yield and fruit quality with water deficit at different growth stages under greenhouse condition. Agric. Water Manag. 2014, 146, 131–148. [Google Scholar] [CrossRef]
- Ngouajio, M.; Wang, G.; Goldy, R. Withholding of drip irrigation between transplanting and flowering increases the yield of field-grown tomato under plastic mulch. Agric. Water Manag. 2007, 87, 285–291. [Google Scholar] [CrossRef]
- Wang, F.; Kang, S.; Du, T.; Li, F.; Qiu, R. Determination of comprehensive quality index for tomato and its response to different irrigation treatments. Agric. Water Manag. 2011, 98, 1228–1238. [Google Scholar] [CrossRef]
- Giuliani, M.M.; Gatta, G.; Nardella, E.; Tarantino, E. Water saving strategies assessment on processing tomato cultivated in Mediterranen region. Ital. J. Agron. 2016, 11, 69–76. [Google Scholar] [CrossRef]
- Hsiao, T.C. Measurements of plant water status. In Irrigation of Agricultural Crops; Steward, B.A., Nielsen, D.R., Eds.; American Society of Agronomy: Madison, WI, USA, 1990; pp. 243–280. [Google Scholar]
- Torrecillas, A.; Guillaume, C.; Alarcón, J.J.; Ruiz-Sánchez, M.C. Water relations of two tomato species under water stress and recovery. Plant Sci. 1995, 105, 169–176. [Google Scholar] [CrossRef]
- Higashide, T.; Heuvelink, E. Physiological and Morphological Changes Over the Past 50 Years in Yield Components in Tomato. J. Am. Soc. Hortic. Sci. 2009, 134, 460–465. [Google Scholar] [CrossRef]
- Fullana-Pericàs, M.; Conesa, M.; Douthe, C.; El Aou-Ouad, H.; Ribas-Carbó, M.; Galmés, J. Tomato landraces as a source to minimize yield losses and improve fruit quality under water deficit conditions. Agric. Water Manag. 2019, 223, 105722. [Google Scholar] [CrossRef]
- Giorio, P.; Guida, G.; Mistretta, C.; Sellami, M.H.; Oliva, M.; Punzo, P.; Iovieno, P.; Arena, C.; De Maio, A.; Grillo, S.; et al. Physiological, biochemical and molecular responses to water stress and rehydration in Mediterranean adapted tomato landraces. Plant Biol. 2018, 20, 995–1004. [Google Scholar] [CrossRef]
- Coyago-Cruz, E.; Meléndez-Martínez, A.J.; Moriana, A.; Girón, I.F.; Martín-Palomo, M.J.; Galindo, A.; Pérez-López, D.; Torrecillas, A.; Beltrán-Sinchiguano, E.; Corell, M. Yield response to regulated deficit irrigation of greenhouse cherry tomatoes. Agric. Water Manag. 2018, 213, 212–221. [Google Scholar] [CrossRef]
- Fernández, M.D.; Orgaz, F.; Fereres, E.; López, J.C.; Céspedes, A.; Pérez, J.; Bonachela, S.; Gallardo, M. Programación del Riego de Cultivos Hortícolas bajo Invernadero en el Sudeste Español; Cajamar: Almeria, Spain, 2001. [Google Scholar]
- SIAR. Climatic Station Data in Spain. Available online: http://eportal.mapa.gob.es/websiar/SeleccionParametrosMap.aspx?dst=1 (accessed on 6 September 2022).
- Shamshiri, R.R.; Jones, J.W.; Thorp, K.R.; Ahmad, D.; Man, H.C.; Taheri, S. Review of optimum temperature, humidity, and vapour pressure deficit for microclimate evaluation and control in greenhouse cultivation of tomato: A review. Int. Agrophysics 2018, 32, 287–302. [Google Scholar] [CrossRef]
- Hao, S.; Cao, H.; Wang, H.; Pan, X. The physiological responses of tomato to water stress and re-water in different growth periods. Sci. Hortic. 2019, 249, 143–154. [Google Scholar] [CrossRef]
- Chen, J.; Kang, S.; Du, T.; Qiu, R.; Guo, P.; Chen, R. Quantitative response of greenhouse tomato yield and quality to water deficit at different growth stages. Agric. Water Manag. 2013, 129, 152–162. [Google Scholar] [CrossRef]
- Savic, S.; Stikic, R.; Zaric, V.; Vucelic-Radovic, B.; Jovanovic, Z.; Marjanovic, M.; Djordjevic, S.; Petkovic, D. Deficit irrigation technique for reducing water use of tomato under polytunnel conditions. J. Central Eur. Agric. 2011, 12, 590–600. [Google Scholar] [CrossRef]
- Wang, C.; Gu, F.; Chen, J.; Yang, H.; Jiang, J.; Du, T.; Zhang, J. Assessing the response of yield and comprehensive fruit quality of tomato grown in greenhouse to deficit irrigation and nitrogen application strategies. Agric. Water Manag. 2015, 161, 9–19. [Google Scholar] [CrossRef]
- Johnstone, P.; Hartz, T.; LeStrange, M.; Nunez, J.; Miyao, E. Managing Fruit Soluble Solids with Late-season Deficit Irrigation in Drip-irrigated Processing Tomato Production. Hortscience 2005, 40, 1857–1861. [Google Scholar] [CrossRef]
- Zhang, D.; Du, Q.; Zhang, Z.; Jiao, X.; Song, X.; Li, J. Vapour pressure deficit control in relation to water transport and water productivity in greenhouse tomato production during summer. Sci. Rep. 2017, 7, 43461. [Google Scholar] [CrossRef]
- Parkash, V.; Singh, S. A Review on Potential Plant-Based Water Stress Indicators for Vegetable Crops. Sustainability 2020, 12, 3945. [Google Scholar] [CrossRef]
- Thompson, R.B.; Gallardo, M.; Valdez, L.C.; Fernández, M.D. Using plant water status to define threshold values for irrigation management of vegetable crops using soil moisture sensors. Agric. Water Manag. 2007, 88, 147–158. [Google Scholar] [CrossRef]
Disclaimer/Publisher’s Note: The statements, opinions and data contained in all publications are solely those of the individual author(s) and contributor(s) and not of MDPI and/or the editor(s). MDPI and/or the editor(s) disclaim responsibility for any injury to people or property resulting from any ideas, methods, instructions or products referred to in the content. |
© 2023 by the authors. Licensee MDPI, Basel, Switzerland. This article is an open access article distributed under the terms and conditions of the Creative Commons Attribution (CC BY) license (https://creativecommons.org/licenses/by/4.0/).