Abstract
Soybean is an excellent source of plant protein. To provide a higher quality meal product, soybean producers desire to improve soybean nutritional profiles. Quantitative trait loci (QTL) mapping can identify markers associated with variation in seed protein and seed oil concentration, and confirmation of QTL is crucial to improving the efficacy of marker-assisted selection (MAS). The objectives of this study were to identify QTL for seed protein and seed oil concentration in a relevant genetic pedigree of the cross ‘Essex × Williams 82’ recombinant inbred line (RIL) population. A total of 302 RIL and 12,730 SNP markers were used to identify QTL-controlling seed quality traits. Novel QTL were identified, and validation tests for loci detected in the earlier generation RIL were performed. Seed protein and seed oil concentration had high heritability across multiple environments but were negatively correlated (r = −0.69, p < 0.05). Genotype and genotype × environment interaction was significant (p < 0.05) for seed protein and seed oil concentration. The study references data from a previous year in one location and focuses on a one-year study of the population in three locations. A total of 27 QTL for protein and oil were detected. The QTL explained 3.1–9.8% of the variation in seed protein concentration and 3.2–14.1% of the variation in seed oil concentration. Several QTL were confirmed, and a protein QTL for consideration as a technically confirmed QTL was located on Gm 7 in the genome.
1. Introduction
Soybean [Glycine max (L.) Merr.] is a highly valued livestock feed containing amino acids and calories essential for livestock growth and development [1]. Soybean is also used for human consumption as a protein and meat substitute and provides approximately 56% of the vegetable oil consumed in the US [2]. US soybean seed typically contains about 400 g kg−1 protein and 200 g kg−1 oil on a dry matter basis (DM) [2]. Yield is the top priority in soybean breeding programs; however, improvement in seed protein and seed oil concentrations are important breeding objectives. Soybean seed protein concentration and yield can be negatively correlated [3]. This inverse relationship has made it difficult to simultaneously increase seed protein concentration and yield in soybean. Likewise, seed protein concentration has an inverse relationship with seed oil concentration. Yet, even marginal improvements in seed protein concentration would improve soymeal nutritional profiles and potentially increase soymeal profitability.
Seed protein and seed oil concentration quantitative trait loci (QTL) have been identified on each of the 20 chromosomes in soybeans [4,5,6,7,8,9]. Major QTL for seed protein and seed oil concentration have been consistently mapped to (Gm) 15 and 20 [4]. In an Essex × Forrest recombinant inbred lines (RIL) population, four QTL for seed protein concentration were identified on Gm 2, 6, 12 and 20 [10]. Essex was the high protein parent and contained the higher protein at four out of five loci. Two seed oil concentration QTL were also identified in the Essex × Forrest population at Gm 18 and Gm 20, with the high seed oil concentration allele coming from the Forrest allele. The RIL population N87-984-16 × TN93-99 located a seed protein concentration QTL on Gm 20 and seed oil concentration QTL on Gm, 1, 10 and 12 [11]. Testing 216 RIL derived from Magellan × PI 438489B and 156 RIL from Magellan × PI 567516C, seven seed protein concentration QTL and six seed oil concentration QTL were identified across various environments; two QTL common for seed protein and seed oil concentration were detected on Gm 5 and 6. These QTL were previously identified in the Magellan × PI 438489B and Magellan × PI 567516C populations [10,12]. In a study of 131 RIL of Essex × Williams, four seed protein concentration QTL from were identified within the population [13]. Three alleles increasing seed protein concentration were conferred by Essex and located on Gm 7, 9 and 13 at 41.9 cM, 114.0 cM, and 15.8 cM, respectively. An allele-increasing seed protein concentration on Gm 6 was conferred by Williams and was located at 119.8 cM. The allele on Gm 6 contributed to high seed protein concentration but was also linked to an early maturity allele [13]. In the same study, six seed oil concentration QTL were identified on Gm 1, 6, 7, 17 and 19. Additional seed protein concentration QTL were identified by screening 176 F2:4 RIL of PI97100 × Coker 237 R [14]. In assessing the information from these studies, several regions of the genome have been identified as regions of genomic control in seed protein and seed oil accumulation. The identification of confirmed QTL help to isolate these regions. QTL observed in independent studies provide additional assurances of QTL stability and suitability for marker-assisted selection. In the soybean database SoyBase, a confirmed QTL is technically defined as one which must be: (a) a separate meiotic event and environment than when the QTL was originally mapped, (b) at least one parent in common with the original mapped study and the confirmed study and (c) an experiment-wise error rate of 0.01 or lower [5]. Expanding the number of confirmed QTL for protein and oil QTL can help identify candidate genes involved in seed protein and seed oil concentration modifications [12] and are ideal loci for crop improvement using marker-assisted selection (MAS).
A significant understanding of the genomic complexities in soybean has been gained through association analysis. Using comparative analysis based on 631 whole genome sequences, Zhang et al. [15] mapped protein and oil QTL located on Gm 15 to a sugar transport gene. Alterations in the gene (GmSWEET39) have been associated with high seed and low oil accumulation, indicating a pleiotropic effect. Although numerous years of research have been invested in identifying seed protein and seed oil concentration QTL, identification and confirmation of QTL are still critically needed to expand our ability to understand and improve seed protein and seed oil through molecular breeding. Therefore, the objectives of this study were to: (1) identify and confirm QTL for seed protein and seed oil in the ‘Essex × Williams 82’, 50,000 SNP RIL population (ExW82-50K); (2) Confirm specific QTL based on the Soybase criteria.
2. Materials and Methods
2.1. Plant Material, Experimental Site and Procedure
Seeds of Essex [16] and Williams 82 [17] were obtained from the National Plant Germplasm System. Three generations of within-line selection were performed prior to making the cross in order to ensure a very high degree of homozygosity for each of the two parents. In 2005, the seeds for preliminary experiments were planted in the crossing block, and a genetic cross of the reselected lines designated Essex 86-15-1 (E) and Williams 82 11-43-1 (W82) was made at the University of Tennessee, East Tennessee Research and Education Center (ETREC). The cross produced our Essex × Williams 82 population, which we denote as the ExW82-50K population. The F1 seed from the ExW82-50K cross was harvested and grown at the Tropical Agricultural Research Station (TARS) in Isabela, PR. The F2 population was advanced to the F5 generation through single-seed descent [18]. The F2 and F3 generations were grown at ETREC in 2006 and 2007, respectively. The F4 plants were grown at the TARS during the spring of 2008. In the summer of 2009, F4:5 seeds were planted and became F5 plants in Beltsville, MD, at a USDA greenhouse. Each plant was tagged for identification, and leaf tissue was collected for genotyping. Seeds were harvested from 1021 individual plants. F5:6 seeds were planted in Homestead, FL, in the fall of 2009 for a seed increase. The seeds were harvested and planted in spring 2010 at ETREC as F5:7 rows. F5:8 seeds were harvested and sent to Homestead, FL, for a seed increase in fall 2010. F5:9 seeds were planted for a yield experiment in 2011 and produced F5:10 seeds. F5:10 remnant seeds were sent to Homestead, FL, for a seed increase. The F5:11 seeds were planted in the spring of 2013 for a three-location, one-year research study.
Phenotypic data was gathered from the 2010 planting, and the one-location study served as preliminary data in this research study. In 2013, the initial ExW82-50K mapping population (1021 plants) was subdivided into three categories based on maturity: Maturity Group (MG) III, MG IV, and MG V. The MG V population included 302 lines which were selected to conduct this research study. Additionally, three yield checks were utilized [19], 5002T [20] and Ellis [21], based on maturity. Soybean entries for the current study were planted in 6 m length two-row plots with 76 cm spacing in a randomized complete block design (RCBD). Research plots were established at three locations with three replications. ETREC is located in Knoxville, TN (35.53° N 83.57° W). The soil is classified as Etowah loam, and the annual average rainfall is 1193.8 mm. Highland Rim Research and Education Center (HRREC) is located in Springfield, TN (36.28° N 86.51° W). The soil type at HRREC is classified as either Dickson silt loam or Sango silt loam, and the annual average rainfall is 1244.6 mm. The Research and Education Center at Milan (RECM) is located in Milan, TN (35.54° N 88.44° W). The soil is classified as Loring B2 series fine silt, and the annual average rainfall is 1371.6 mm.
2.2. Seed Quality Trait Detection
Phenotypic data for seed protein and seed oil concentration were collected for each research plot. A 25 g whole bean subsample was ground using a water-cooled Knifetec 1095 Sample Mill (FOSS Tecator, S-26321, Hogana, Sweden). The samples were ground for 20 s and placed into Whirl Pak bags (Nasco, Fort Atkinson, WI, USA). Samples were barcode labeled using the ZM 1000 Barcode Printer System (Zebra Technologies, Lincolnshire, IL, USA). The ground samples were analyzed at the Soybean Analysis Lab at the University of Minnesota, St. Paul, MN. A subsample weighing 12.5 g was placed into a small sample cup to conduct the ground bean analysis. The sample was leveled using a spatula and placed into the Perten near-infrared (NIR) analyzer (Hagersten, Sweden). The Perten software conducted an initial scan of auto diagnostics for instrument response, wavelength accuracy and NIR repeatability. The scan reported the soybean composition percentages, which were converted to g kg−1 units. Several samples were selected for wet chemistry verification to ensure the accuracy of NIR readings.
2.3. SNP Genotyping
F5 plants were sampled, and DNA was extracted at the Soybean Genomics Laboratory at the USDA Beltsville Agricultural Research Center (USDA-ARS) in Beltsville, MD. DNA was assayed using high throughput molecular techniques as described in [22,23]. The SoySNP50K Infinium assay was specifically used for this study, as initially described by Song et al. [24]. This population was polymorphic at 17,232 of 50,000 markers on the SoySNP50K [24].
2.4. Statistical Analyses and QTL Detection
Analyses of variance (ANOVA) were performed using the MIXED procedure of SAS (SAS ver. 9.4, Cary, NC, USA) to detect significant differences among RIL for seed protein concentration and seed oil concentration. Fisher’s LSD (least significant difference) was performed for mean separation using the MIXED procedure in SAS (SAS ver. 9.4, Cary, NC, USA). The least squares means were calculated and compiled to use for QTL analysis.
Pearson’s correlation analysis was performed to determine phenotypic correlations between seed protein and seed oil concentrations (CORR procedure, SAS ver. 9.4, Cary, NC, USA). To determine the portion of phenotypic variation among RIL that resulted from genetic differences and estimate heritability, restricted maximum likelihood estimation of variance components was used. A broad sense estimate of the heritability of seed protein, seed oil and yield in the population was calculated on a mean entry basis [25] as follows:
where h2 estimates heritability, is genotypic variance, is genotype × environment variance, σ2 is error variance, r is the number of replications, and e is the number of environments.
A genetic linkage map was constructed from the genetic data of 302 RIL using R/qtl [26]. The estimated map length was 2032 cM and utilized 17,232 markers. Markers with no recombination were eliminated, and the linkage map was constructed using 12,730 markers (Figure 1). Chromosomal locations of QTL were determined by composite interval mapping (CIM) [26,27]. An interval size of 2 cM with the default parameter of three markers per trait was used to conduct CIM [26]. The LOD threshold of 3.0 was consistently applied to identify both seed protein and seed oil on each of the twenty soybean chromosomes.
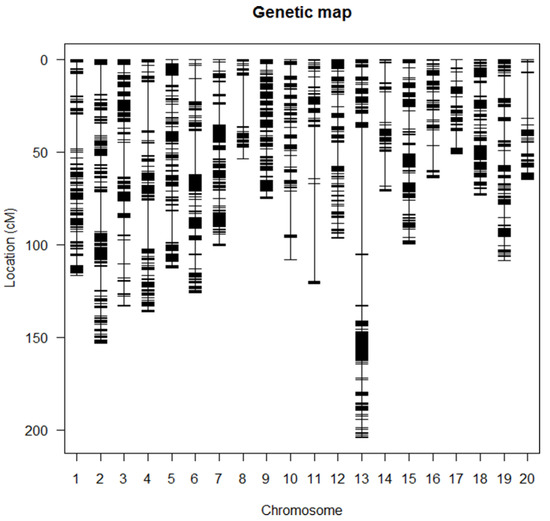
Figure 1.
Molecular map of the Essex × Williams 82 F5:11 population of 302 recombinant inbred lines mapped with 12,732 linked SNPs.
3. Results
3.1. Seed Protein and Seed Oil Phenotypes
Significant genotypic effects for seed protein concentration and seed oil concentration (p < 0.001) were detected among RIL. The parental varieties have similar median protein and oil content (Table 1). However, several RIL outperformed the parents in seed protein and seed oil concentration (Table 2). The environments alone did not discernably affect seed protein (p = 0.1594) and seed oil (p = 0.1592) as the main effects. However, the interactions of genotype × environment were significant for seed protein and seed oil concentration (p < 0.001), indicating that depending on the genomic profile of a line, there could be an effect. A negative correlation was also (r = −0.69, p < 0.05) observed between seed protein and seed oil concentration among RIL of Essex × Williams 82 (Table 3). The yield was tested for correlation with seed quality traits and is worth mentioning because it must be monitored by breeders in efforts to improve soybean due to the inverse relationship with protein. There was a very weak correlation between yield and seed quality traits, with seed protein concentration being negatively correlated (−0.15) and seed oil concentration positively correlated (0.15) with yield (Table 3). The results confirm previous reports of the inverse relationship between seed protein concentration and seed oil concentration in many soybean populations [4]. In this study, seed protein concentration for the RIL population ranged from 331.6 g kg−1 to 461.2 g kg−1 crude (Table 2). The seed oil concentration among RIL ranged from 193.1 g kg−1 to 248.5 g kg−1 oil (Table 2). Several transgressive segregants produced higher seed protein concentration than the high protein parent (Essex), and the checks (Ellis, 5002T and Osage) were noted by the maximum of 461.2 g kg−1. They also outperformed the high oil parent Williams with a maximum of 248.5 g kg−1. The lines that were notable performers warrant further investigation to determine the genetic basis of their performance. (Table 2). Heritability estimates were high for seed protein and seed oil concentration, with h2 values of 87.4% and 84.2%, respectively (Table 2), indicating the likelihood that this population may be a rich source of QTL.

Table 1.
Means of protein, oil and yield of soybean seed for parents and checks grown in Knoxville, TN; Springfield, TN; and Milan, TN.
Table 2.
Descriptive statistics of protein and oil (g kg−1 seed) and yield (kg ha−1) of soybean seed from 302 F5:11-derived recombinant inbred lines of Essex 86-15-1 × Williams 82-11-43-1 grown in 2013 in Knoxville, TN; Springfield, TN; and Milan, TN.
Table 3.
Pearson’s correlation coefficient between protein, oil and yield in 302 F5:11-derived recombinant inbred lines of Essex 86-15-1 × Williams 82-11-43-1 grown in Knoxville, TN; Springfield, TN; and Milan, TN.
3.2. Seed Protein and Seed Oil QTL
QTL mapping was carried out using phenotypic data from a previous year of study. Genetic markers segregating in Essex × Williams 82 were analyzed using R/qtl. Based on a LOD threshold of 3.0, four seed protein QTL were identified on Gm 6, 7, 13, and 14. LOD scores of the seed protein QTL ranged from 3.1 to 4.5, and the individual QTL explained between 7.2–9.0% of the variation in seed protein. Two seed oil QTL were also found on Gm 6 and Gm 14. LOD scores of seed oil QTL ranged from 4.4 to 4.8, and the individual QTL explained 7.1–8.6% of the variation in seed oil (Table 4). Given the impact of some of the QTL and the high heritability of seed protein and seed oil, these QTL are of sufficient effect sizes to incorporate into lines bred for seed protein and seed oil.
Table 4.
Quantitative trait loci identified using R/qtl for composite interval mapping located on various chromosomes associated with protein and oil concentration in. 302 F5:8 derived recombinant inbred lines of Essex 86-15-1 × Williams 82-11-43-1 grown in 2010 in Knoxville, TN.
The current study detected 13 QTL for seed protein on Gm 2, 6, 7, 9 and 13 for genotypes grown across three locations in TN. Four out of five seed protein QTL (Gm 6, 7, 9 and 13) were present in every environment. However, there was a QTL on Gm 2 that appeared in the Springfield location only. The LOD scores for seed protein QTL ranged from 3.1 to 9.8, and the QTL explained 4.4–11.8% of the variation in seed protein (Table 5). A total of 8 seed oil QTL were identified on Gm 6, 9, 10, 11, 13, 18 and 19. The seed oil QTL had LOD scores that ranged from 3.6 to 14.1, and the QTL explained 4.1–8.3% of the variation in seed oil (Table 5). The practical implications of protein improvement demonstrate the potential that lies within the RIL population to exploit increased seed protein and seed oil concentration improvement. The maximums within the RIL population were 2561.18 kg/ha for seed protein concentration and 1380.00 kg/ha for seed oil concentration, demonstrating more than a 1 × increase in both quality traits above the parents.
Table 5.
Quantitative trait loci identified using R/qtl for composite interval mapping located on various chromosomes associated with protein and oil content in 302 F5:11-derived recombinant inbred lines of Essex 86-15-1 × Williams 82-11-43-1 grown in 2013 in Knoxville, TN; Springfield, TN; and Milan, TN.
4. Discussion
4.1. Seed Protein and Seed Oil Phenotypes
Protein and oil are economically important seed quality traits in soybean. Soy protein is an important food for both human and animal consumption, and soy oil is the primary oil used for cooking in the US. There has been a long-term goal to improve soybean seed protein concentration for the production of higher quality amino acids to support meat muscle development for soybean meal while maintaining adequate levels of seed oil production. Therefore, the improvement of these quality traits should be considered an important breeding objective. Often, high and low protein lines are crossed to form RIL for genetic analysis. The Essex and Williams 82 parents are important parts of soybean lineage in the US. Although they have smaller differences in seed protein and seed oil than lines typically tested in QTL experiments, they can provide valuable information for genetic improvement. The strategy was to evaluate 302 RIL in three locations to evaluate phenotypic traits and use for QTL discovery and confirm previously identified QTL. Such QTL are more stable for marker-assisted selection.
There were significant differences among RIL for seed protein and seed oil (p < 0.0001). The differences were detected by NIR, and ranges were wide enough to detect individuals that could show promise of an incremental increase in seed protein concentration through traditional breeding methods. The elucidation of genetic components associated with trait improvements may expedite the process and allow certain components to be altered in favor of the objectives. It is one of the reasons why we continue to pursue the understanding of seed protein and seed oil profiles, although complete understanding and the ability to gather the qualitative components of the traits remain elusive. Differences among RIL were predominantly due to genetic variation, as evidenced by significant genetic variation with no detectable environmental main effects between locations. The heritability of the traits in this population was high, which again supported the premise that traditional breeding practices could produce more protein and oil-rich varieties. In addition, heritability was similar to populations from crosses between more phenotypically divergent parents [28].
Minor parental differences such as those observed among the Essex × Williams 82 RIL could be due to few allelic differences or nearly equal partitioning of negative and positive effect alleles into each line. High heritability strongly suggests that there should be multiple alleles, with negative and positive alleles distributed between the two parents. This arrangement should produce transgressive segregation in the RIL. Indeed, lines containing more seed protein and seed oil than the parents and checks were identified. The mean seed protein concentration was 382.2 g kg−1 and the mean seed oil concentration was 224.8 g kg−1 (Table 1). Essex was the high parent for seed protein (393.8 g kg−1) and was higher than the mean seed protein for the RIL (Table 2). Likewise, Williams 82 was the high parent for seed oil (226.3 g kg−1) and was higher than the RIL mean for seed oil concentration (Table 2). This prediction was also confirmed in the occurrence of trait-increasing QTL alleles contributed by both parents to both traits. The results identified in this study confirm similar findings [12,13] and indicate that phenotypic selections would be effective for achieving genetic gain for seed protein and seed oil concentration.
4.2. Seed Protein and Seed Oil QTL
The objectives of this study were to (1) identify new QTL and confirm QTL for seed protein and seed oil in the ‘Essex × Williams 82’, 50,000 SNP RIL population (ExW82-50K); (2) Confirm specific QTL based on the Soybase criteria.
Numerous years of research have been invested in identifying seed protein and seed oil QTL, with nearly 300 seed protein QTL and 250 seed oil QTL identified to date (SoyBase, 2022) [5]. Yet, only 16 seed protein QTL and 16 seed oil QTL have been confirmed. Unconfirmed QTL can reduce the certainty that these types of public data can be effectively utilized for crop improvement. A cqQTL designation demonstrates genomic consistency, and cqQTL would likely be utilized for MAS with higher efficacy.
In the previous year study, seed protein QTL was identified on Gm 6, 7, and 13 in one location. Data was not available across all locations. However, the QTL on Gm 6, 7, and 13 were also present across all environments in the current study. The presence of the QTL across all environments at these loci indicates robust genetic control of the trait. In order to conduct additional comparisons, information was gathered from the integrated genetic linkage map for the soybean genome and the updated integrated genetic linkage map of the soybean [29,30]. The information was used to form associations with previous genetic markers that have been identified near the QTL identified in this study. The QTL located on Gm 6 is near microsatellite marker BARC_20_1301, which is associated with seed yield. The QTL located on Gm 7 (43.3–43.7 cM) was also identified by Hyten et al. [14] at Gm 7 at 41.9 cM, and both were conferred by the Essex allele, the high parent for seed protein. Thus, Gm 7 seed protein QTL meets the criteria for a technically confirmed seed protein QTL according to SoyBase. We, therefore, propose the QTL symbol cq17-Seed protein for the QTL on Gm 7. The QTL is located near the region of BARC 12_0796 and the region of BARC_070263, which has also been identified as a seed protein QTL.
Evidence suggests that identification and confirmation of QTL are crucial to our understanding and the improvement of seed protein and seed oil using molecular breeding strategies.
There were additional seed protein QTL identified, but these only appeared in one environment. There was a seed protein/seed oil QTL located on Gm 14 in the Knoxville, TN location during the previous study and another seed protein QTL on Gm 2 during the second study at the Springfield, TN location. Clearly, phenotypic characteristics such as seed protein are, indeed, influenced by genotypes and their interaction with the environment [31]. The presence of the Essex allele at the Gm 2 locus increased seed protein by 2.4 g kg−1. The absence of these particular QTL in a multi-year test could provide additional information regarding the effect of the environment on the expression of alleles associated with seed protein production and may denote epigenetic effects.
Several other QTL were identified for seed protein concentration. Two seed protein QTL were located on Gm 7 at 43.7 and 50.0 cM and Gm 9 at 63.0 cM. QTL at similar positions were previously identified by Eskandri et al. [32]. A seed protein QTL was also found on Gm 14 at 45.5 cM, which was identified previously by Kabelka et al. [33].
Two seed oil QTL were identified in the previous study of the Essex × Williams 82 population. A total of eight seed oil QTL were identified in the three location study; of those, one was a confirmed QTL on Gm 6 at 54.0 cM. There were four other confirmed QTL identified for seed oil concentration. One was located on Gm 9 at 6.1 cM, first identified by Qi et al. [34]. Two QTL on Gm 10 at 3.0 cM and Gm 11 at 21.2 cM were identified by Brummer et al. [7]. An additional QTL was identified on Gm 13 at 0.8 cM, which also corresponded to the QTL identified by Qi et al. [34].
Although some QTL show some genetic consistency because they were found in various populations, other QTL findings suggest a significant environmental effect on seed oil concentration. For example, seed oil concentration can be greatly affected by rainfall and temperature [35]. Several seed oil QTL were found in a similar region as QTL affecting seed protein, suggesting that negative pleiotropic effects may occur among loci affecting seed protein and seed oil concentration. The linked pairs of seed protein and seed oil QTL on Gm 6 and Gm 14 were less than 3 cM apart in each case. This indicated that pleiotropy was the most likely explanation, although fortuitous linkage cannot be ruled out by our experiment. Comparison to the prior year data revealed a seed protein QTL on Gm 7 which was present in all environments and two prior studies.
5. Conclusions
Compiling genetic resources will add to our knowledge and pursuit of quality trait improvements in soybean, which have been evasive targets for breeders. We successfully identified RIL that show incremental increases with protein and oil in this research study, moving the trajectory in a positive direction. Collectively, we detected 27 QTL within two prominent soybean lines. There were 17 QTL identified for seed protein, and 10 QTL were identified for seed oil and while several exhibited pleiotropy. We identified a QTL on Gm 7 at 50.0 cM and proposed the name cq017-Seed protein to the Soybean Genetics Committee because this particular QTL meets the criteria.
New seed protein and seed oil QTL were also detected., providing an excellent genetic resource for further study. The QTL located on Gm 6, Gm 13 and Gm 20 have been of great interest for protein because they have been identified in multiple cultivars and environments [12,36]. This study contributes additional findings on several chromosomes, further building the case for genetic regulation of seed protein and seed oil within certain regions of the genome. QTL discovery is helpful to plant breeding schemes only if the QTL are applied in breeding programs [37]. The application of our molecular marker information associating traits to alleles, may be used to advance the understanding of seed quality traits and to achieve trait improvement in soybean.
Author Contributions
J.F. and V.R.P. conceptualized the research project and wrote a grant to provide research funding support. J.F., V.R.P. and A.M.S. provided the statistical methodology. J.F. curated the data and ran the statistical analysis in consultation with A.M.S., D.L.H. and P.B.C. provided molecular analysis and data. J.F. prepared the original draft. D.L.H. provided consultation on evaluation of molecular, phenotypic data and revisions. V.R.P. and I.C. provided editorial support for the draft and data presentation. C.A.B. and D.A.K. provided technical insight and editorial support. All authors have read and agreed to the published version of the manuscript.
Funding
Research funding was provided by the generous support of the United Soybean Board and the Tennessee Soybean Promotion Board.
Data Availability Statement
All data supporting the finding of this study are included in the article.
Acknowledgments
HHREC: ETREC and MILAN research team, Jim Orf and Art Killam of the University of Minnesota for NIR analysis and calibration. Brian Dilkes and Morris Levy of Purdue University for critical feedback.
Conflicts of Interest
The authors declare no conflict of interest.
References
- Milczarek, A.; Osek, M. Effectiveness evaluation of use of various protein feeds for broiler chicken feeding. Ann. Anim. Sci. 2019, 19, 1063–1081. [Google Scholar] [CrossRef]
- Soystats. 2022. Available online: http://soystats.com/soybean-oil-u-s-vegetable-oils-consumption/ (accessed on 21 September 2022).
- Specht, J.E.; Chase, K.; Macrander, M.; Graef, G.L.; Chung, J.; Markwell, J.P.; Germann, M.; Orf, J.H.; Lark, K.G. Soybean response to water: A QTL analysis of drought tolerance. Crop Sci. 2001, 41, 493–509. [Google Scholar] [CrossRef]
- Diers, B.W.; Keim, P.; Fehr, W.R.; Shoemaker, R.C. RFLP analysis of soybean seed protein and oil content. Theor. Appl. Genet. 1992, 83, 608–612. [Google Scholar] [CrossRef] [PubMed]
- Grant, D.; Nelson, R.T.; Cannon, S.B.; Shoemaker, R.C. SoyBase, the USDA-ARS Soybean Genetics and Genomics Database. 2010. Available online: http://www.soybase.org/ (accessed on 14 January 2022).
- Wang, J.; Mao, L.; Zeng, Z.; Yu, X.; Lian, J.; Feng, J.; Yang, W.; An, J.; Wu, H.; Zhang, M.; et al. Genetic mapping high protein content QTL from soybean ‘Nanxiadou 25′and candidate gene analysis. BMC Plant Biol. 2021, 21, 388. [Google Scholar] [CrossRef]
- Brummer, E.C.; Graef, G.L.; Orf, J.; Wilcox, J.R.; Shoemaker, R.C. Mapping QTL for seed protein and oil content in eight soybean populations. Crop Sci. 1997, 37, 370–378. [Google Scholar] [CrossRef]
- Orf, J.H.; Chase, K.; Jarvik, T.; Mansur, L.M.; Cregan, P.B.; Adler, F.R.; Lark, K.G. Genetics of soybean agronomic traits: I. Comparison of three related recombinant inbred populations. Crop Sci. 1999, 39, 1642–1651. [Google Scholar] [CrossRef]
- Wang, D.; Graef, G.L.; Procopiuk, A.M.; Diers, B.W. Identification of putative QTL that underlie yield in interspecific soybean backcross populations. Theor. Appl. Genet. 2004, 108, 458–467. [Google Scholar] [CrossRef]
- Yesudas, C.R.; Bashir, R.; Geisler, M.B.; Lightfoot, D.A. Identification of germplasm with stacked QTL underlying seed traits in an inbred soybean population from cultivars Essex and Forrest. Mol. Breed. 2013, 31, 693–703. [Google Scholar] [CrossRef]
- Panthee, D.R.; Pantalone, V.R.; West, D.R.; Saxton, A.M.; Sams, C.E. Quantitative trait loci for seed protein and oil concentration, and seed size in soybean. Crop Sci. 2005, 45, 2015–2022. [Google Scholar] [CrossRef]
- Pathan, S.M.; Vuong, T.; Clark, K.; Lee, J.D.; Shannon, J.G.; Roberts, C.A.; Ellersieck, M.R.; Burton, J.W.; Cregan, P.B.; Hyten, D.L.; et al. Genetic mapping and confirmation of quantitative trait loci for seed protein and oil contents and seed weight in soybean. Crop Sci. 2013, 53, 765–774. [Google Scholar] [CrossRef]
- Hyten, D.L.; Pantalone, V.R.; Sams, C.E.; Saxton, A.M.; Landau-Ellis, D.; Stefaniak, T.R.; Schmidt, M.E. Seed quality QTL in a prominent soybean population. Theor. Appl. Genet. 2004, 109, 552–561. [Google Scholar] [CrossRef] [PubMed]
- Fasoula, V.A.; Harris, D.K.; Boerma, H.R. Validation and designation of quantitative trait loci for seed protein, seed oil, and seed weight from two soybean populations. Crop Sci. 2004, 44, 1218–1225. [Google Scholar] [CrossRef]
- Zhang, H.; Goettel, W.; Song, Q.; Jiang, H.; Hu, Z.; Wang, M.L.; An, Y.-Q.C. Selection of GmSWEET39 for oil and protein improvement in soybean. PLoS Genet. 2020, 16, e1009114. [Google Scholar] [CrossRef]
- Smith, T.J.; Camper, H.M. Registration of Essex soybean (reg. no. 97). Crop Sci. 1973, 13, 495. [Google Scholar] [CrossRef]
- Bernard, R.L.; Cremeens, C.R. Registration of Williams 82 soybean. Crop Sci. 1988, 28, 1027–1028. [Google Scholar] [CrossRef]
- Brim, C.A. A modified pedigree method of selection in soybeans 1. Crop Sci. 1966, 6, 220. [Google Scholar] [CrossRef]
- Chen, P.; Sneller, C.H.; Mozzoni, L.A.; Rupe, J.C. Registration of ‘Osage’soybean. J. Plant Regist. 2007, 1, 89–92. [Google Scholar] [CrossRef]
- Pantalone, V.R.; Allen, F.L.; Landau-Ellis, D. Registration of ‘5002T’soybean. Crop Sci. 2004, 44, 1483–1485. [Google Scholar] [CrossRef]
- Pantalone, V.; Smallwood, C.; Fallen, B. Development of ‘Ellis’ soybean with high soymeal protein, resistance to stem canker, southern root knot nematode, and frogeye leaf spot. J. Plant Regist. 2017, 11, 250–255. [Google Scholar] [CrossRef]
- Hyten, D.L.; Song, Q.; Choi, I.Y.; Yoon, M.S.; Specht, J.E.; Matukumalli, L.K.; Nelson, R.L.; Shoemaker, R.C.; Young, N.D.; Cregan, P.B. High-throughput genotyping with the GoldenGate assay in the complex genome of soybean. Theor. Appl. Genet. 2008, 116, 945–952. [Google Scholar] [CrossRef]
- Song, Q.; Jenkins, J.; Jia, G.; Hyten, D.L.; Pantalone, V.; Jackson, S.; Schmutz, J.; Cregan, P.B. Construction of high resolution genetic linkage maps to improve the soybean genome sequence assembly Glyma1.01. BMC Genom. 2016, 17, 33. [Google Scholar] [CrossRef]
- Song, Q.; Hyten, D.L.; Jia, G.; Quigley, C.V.; Fickus, E.W.; Nelson, R.L.; Cregan, P.B. Development and evaluation of SoySNP50K, a high-density genotyping array for soybean. PLoS ONE 2013, 8, e54985. [Google Scholar] [CrossRef]
- Nyquist, W.E.; Baker, R.J. Estimation of heritability and prediction of selection response in plant populations. Crit. Rev. Plant Sci. 1991, 10, 235–322. [Google Scholar] [CrossRef]
- Broman, K.W.; Sen, S. A Guide to QTL Mapping with R/qtl; Springer: New York, NY, USA, 2009. [Google Scholar]
- Broman, K.W. Review of statistical methods for QTL mapping in experimental crosses. Lab Anim. 2001, 30, 44–52. [Google Scholar]
- Chung, J.; Babka, H.L.; Graef, G.L.; Staswick, P.E.; Lee, D.J.; Cregan, P.B.; Shoemaker, R.C.; Specht, J.E. The seed protein, oil, and yield QTL on soybean linkage group I. Crop Sci. 2003, 43, 1053–1067. [Google Scholar] [CrossRef]
- Cregan, P.B.; Jarvik, T.Y.; Bush, A.L.; Shoemaker, R.C.; Lark, K.G.; Kahler, A.L.; Kaya, N.; VanToai, T.T.; Lohnes, D.G.; Chung, J.; et al. An integrated genetic linkage map of the soybean genome. Crop Sci. 1999, 39, 1464–1490. [Google Scholar] [CrossRef]
- Song, Q.J.; Marek, L.F.; Shoemaker, R.C.; Lark, K.G.; Concibido, V.C.; Delannay, X.; Specht, J.E.; Cregan, P.B. A new integrated genetic linkage map of the soybean. Theor. Appl. Genet. 2004, 109, 122–128. [Google Scholar] [CrossRef]
- Ralston, A.; Shaw, K. Environment controls gene expression: Sex determination and the onset of genetic disorders. Nat. Educ. 2008, 1, 203. [Google Scholar]
- Eskandari, M.; Cober, E.R.; Rajcan, I. Genetic control of soybean seed oil: II. QTL and genes that increase oil concentration without decreasing protein or with increased seed yield. Theor. Appl. Genet. 2013, 126, 1677–1687. [Google Scholar] [CrossRef]
- Kabelka, E.A.; Diers, B.W.; Fehr, W.R.; LeRoy, A.R.; Baianu, I.C.; You, T.; Neece, D.J.; Nelson, R.L. Putative alleles for increased yield from soybean plant introductions. Crop Sci. 2004, 44, 784–791. [Google Scholar] [CrossRef]
- Qi, Z.M.; Wu, Q.; Han, X.; Sun, Y.N.; Du, X.Y.; Liu, C.Y.; Jiang, H.W.; Hu, G.H.; Chen, Q.S. Soybean oil content QTL mapping and integrating with Meta-analysis method for mining genes. Euphytica 2011, 179, 499–514. [Google Scholar] [CrossRef]
- Carrera, C.; Martínez, M.J.; Dardanelli, J.; Balzarini, M. Environmental variation and correlation of seed components in nontransgenic soybeans: Protein, oil, unsaturated fatty acids, tocopherols, and isoflavones. Crop Sci. 2011, 51, 800–809. [Google Scholar] [CrossRef]
- Bolon, Y.T.; Joseph, B.; Cannon, S.B.; Graham, M.A.; Diers, B.W.; Farmer, A.D.; May, G.D.; Muehlbauer, G.J.; Specht, J.E.; Tu, Z.J.; et al. Complementary genetic and genomic approaches help characterize the linkage group I seed protein QTL in soybean. BMC Plant Biol. 2010, 10, 41. [Google Scholar] [CrossRef] [PubMed]
- Bernardo, R. Molecular markers and selection for complex traits in plants: Learning from the last 20 years. Crop Sci. 2008, 48, 1649–1664. [Google Scholar] [CrossRef]

Disclaimer/Publisher’s Note: The statements, opinions and data contained in all publications are solely those of the individual author(s) and contributor(s) and not of MDPI and/or the editor(s). MDPI and/or the editor(s) disclaim responsibility for any injury to people or property resulting from any ideas, methods, instructions or products referred to in the content. |
© 2023 by the authors. Licensee MDPI, Basel, Switzerland. This article is an open access article distributed under the terms and conditions of the Creative Commons Attribution (CC BY) license (https://creativecommons.org/licenses/by/4.0/).