Abstract
High grain yields of rice (Oryza sativa) under dry cultivation are primarily obtained through high levels of nitrogen (N) input. However, excessive inputs of N increase the risk of lodging. This study aimed to clarify the effect of N application rates on crop morphology, mechanical mechanisms of the stem, and chemical components in the basal stems of rice and their underlying mechanism in association with lodging resistance under dry cultivation. In this study, field experiments on rice were conducted under dry cultivation in early May to early October 2019 and 2020. Six rates of N applied at 0, 70, 140, 210, 280 and 350 kg ha−1 were set at a sowing rate of 150 kg ha−1 with Suijing 18 as the test material. The increased risk of lodging represented by lodging index (LI) and lodging rate with increasing N application was observed under both growing seasons. The plant height, basal internode length, particularly the second internode, and center of gravity height, which positively correlated with the LI, increased significantly with the increase in N application rates. In contrast, internode fullness and carbohydrate content of the basal second (S2) internode, which negatively correlated with LI, decreased significantly with increasing N application rates. A quadratic regression model between N application rates and grain yield showed that better grain yield could be achieved under an N application rate ranging from 210 to 228 kg ha−1. Therefore, the N application rate of (i.e., 210–228 kg N ha−1) could be recommended for the Suijing18 variety under dry cultivation in central Jilin Province for achieving high grain yield and great lodging resistance.
1. Introduction
Rising temperatures and water scarcity owing to climate change have become urgent global challenges. The impact of drought on agricultural production has been exacerbated by population growth, increased demand for agricultural water, and decreased freshwater resources. Therefore, research on sustainable agricultural production models has become crucial [1]. Rice (Oryza sativa) is a core food crop, and the exploration of its requirements for light and simplified cultivation technologies has received widespread attention from Chinese and international researchers [2,3]. However, the sustainable development of rice is limited by its heavy dependence on irrigation water. Rice under dry cultivation is a rice crop mode that differs from transplanted rice, water direct seeding, wet direct seeding, and dry direct seeding water pipe methods. Rice under dry cultivation is a planting mode that does not include seedling and transplanting, but rather rice is directly sown under dry land preparation conditions. This mode primarily relies on natural precipitation during the whole reproductive period, and water is only appropriately replenished during critical periods of high water demand or in times of drought [4]. The dry cultivation of rice has been rapidly developing in different rice-cultivating regions in China and internationally. This method eliminates the need for breeding seedings and transplanting, saves water resources, improves labor efficiency, and optimizes both land use efficiency and the adaptation to mechanization [5]. However, previous studies have found that the grain yield of rice under dry cultivation is lower than that under conventional flooded cultivation. As a result, a massive increase in the application of N fertilizer in pursuit of high yields has led to the severe lodging of rice under dry cultivation [4].
As one of the major nutrients in crop growth and development, N is also a limiting factor for crop yield [6]. The proper application of N fertilizer can improve the growth and yield of crops, while the excessive application of N fertilizer often reduces the utilization of N and can even have a negative effect on the crop’s lodging resistance and yield [7,8]. Chen et al. (2020) found that the moderate application of N fertilizer could improve the resistance of rice to lodging to some extent [9]. Xiao et al. (2017) found that the application of excessive levels of N led to an increase in the height of rice plants with an upward shift in the center of gravity, growth in the basal internodes, a decrease in stem wall thickness and diameter, a decrease in stem fullness and mechanical strength, a decrease in flexural force and modulus of elasticity, an increase in stem LI, and a decrease in lodging resistance [10]. Zhang et al. (2017) showed that the excessive application of N led to the downregulation of genes related to lignin synthesis, which results in lignin deficiency in the secondary cell wall, and poor mechanical tissue structure; in turn, this reduces the degree of lodging resistance [11]. Therefore, it is important to study the effect of N application on the ability of rice stems to resist lodging as well as its mechanism under dry cultivation and to take effective measures to prevent the occurrence of lodging for high and stable yields of rice under dry cultivation.
Most of the previous studies on the effect of N application on the resistance of rice to lodging have focused on transplanted rice [12], while fewer studies have been conducted on the resistance of rice to lodging under dry cultivation. Therefore, the objectives of this study were to (i) clarify the effect of N application for plant morphology, mechanical mechanisms of stem, and basal stem chemical components of rice under dry cultivation; and (ii) to determine the relationship between the LI and plant morphology, mechanical mechanisms of the stem, and the basal stem chemical components of rice under dry cultivation. This study provides a theoretical basis for lodging resistance and the cultivation of rice to produce high grain yields under dry cultivation.
2. Materials and Methods
2.1. Experimental Site and Experimental Materials
A field experiment was conducted from early May to early October 2019 and 2020 at the National Crop Variety Validation Characterization Station on the campus of Jilin Agricultural University, Changchun, Jilin Province, China (44°46′ N, 125°39′ E). The region has a continental monsoon climate. The cumulative temperature and rainfall for the entire reproductive period were 2851.9 °C and 664.4 mm in 2019 and 2920.2 °C and 593.1 mm in 2020, respectively. The soil type of the trial plot is meadow soil. The organic matter content of the soil was 18.7 g kg−1; the alkaline dissolved N was 117.02 mg kg−1; the available phosphorus was 41.11 mg kg−1; the available potassium was 245.16 mg kg−1, and the pH was 6.2. The rice variety tested was Suijing 18, which has a growth period of 134–135 days. It is one of the primary varieties of rice used for dry cultivation in central Jilin province.
2.2. Experimental Design
The experiment included six rates of application of pure N (0, 70, 140, 210, 280 and 350 kg ha−1) that were labeled as N0, N1, N2, N3, N4 and N5, respectively. A randomized block design was used with three replicates for each treatment, and the plot area was 4 × 5 = 20 m2. The seeding rate was 150 kg ha−1, and the spacing of sowing rows was 25 cm. Hand simulated mechanical strip sowing and the application of basal fertilizer took place on 6 May 2019 and 7 May 2020, respectively. Tiller fertilizer was applied on 18 June 2019 and 20 June 2020, respectively. Panicle fertilizer was applied on 17 July 2019 and 20 July 2020, respectively. Harvest was on 25 September 2019 and 30 September 2020, respectively. A total of 75 kg ha−1 each of P2O5 and K2O were applied at once as the base fertilizer for each treatment. N fertilizer (urea) was applied three times in the form of basal fertilizer: tiller fertilizer: panicle fertilizer (5:3:2). Ridges were erected around each treatment plot to prevent water and fertilizer loss. The entire growth period primarily depends on natural rainfall. Spray devices were only used to uniformly supplement water during the critical period of drought and water demand. When the 10–15 cm soil water potential was lower than −35 kPa (3S-10, Institute of Soil Science, Chinese Academy of Sciences, Nanjing), a constant spray 360° atomized rotary spray irrigation was used with a spraying radius of 8 m and a water yield of 0.7 m3/h. The spray irrigation was conducted for approximately 2 h in combination with the field growth of the plant, and the soil water potential after the water supplement was −10 kPa. Closed weeding was performed after sowing, and other field management measures were conducted based on the general high-yield field model to ensure the consistent management of each experimental plot.
2.3. Sampling and Measurement
2.3.1. Morphological Characteristics and Field Lodging Assessment
Nine representative plants were taken from each plot 30 days after heading to determine the plant height, panicle length, length of each internode, panicle weight, center of gravity height, dry weight of the upper three leaves and related traits (length, dry weight of the leaf sheath, dry weight of the culm, culm diameter and culm wall thickness) of the basal second internode [13,14]. The plant height and the length of internodes were measured by a ruler. The panicle weight and the dry weight of the upper three leaves were measured using an electronic balance. The center of gravity height was measured as the distance from the base of the stem to the balance of the stem fulcrum, including the panicle, leaf, and sheath [15]. There were five elongated internodes on the main stems of the plants selected, which were referred to as the first (S1), second (S2), third (S3), fourth (S4), and fifth (S5) internodes from the stem base [16]. The culm diameter (outer diameter and inner diameter) and culm wall thickness were measured at the mid-region of S2 with a digital caliper that was accurate to 0.01 mm [17].
The dry weight per unit culm and dry weight per unit leaf sheath were determined as described by Huang et al. (2021) using the following formula [18]: dry weight per unit culm (mg cm−1) = the dry weight of the culm (mg)/the length of the culm (cm), dry weight per unit leaf sheath (mg cm−1) = the dry weight of the leaf sheath (mg)/the length of the leaf sheath (cm). As described by Chen et al. (2011) [19], the lodging area per plot was measured and the lodging percentage was determined as the lodging rate (%) = (the lodging area in plot/the plot area) × 100.
2.3.2. Determination of the Mechanical Properties of Stem and Stem Lodging Resistance
The mechanical properties of stems were determined 30 days after heading. Nine representative main stems were sampled in each plot. The S2 internode at the base of each main stem, including the sheath, was cut off and immediately placed on a Plant Stem Strength Testing Machine (YYD-1; Zhejiang Top Instrument Co., Ltd., Hangzhou, China) so that the midpoint of the internode corresponded to the midpoint of the tester (5 cm between pivot points). The stem was crushed downwards, and the reading that was displayed on the instrument was considered to be the fracture resistance [20]. The parameters of stem physical properties were calculated as follows [13,21]: (1) Bending moment of the whole plant (WP, g cm) = SL (cm) × FW (g). SL is the length from the broken point to the panicle top, and FW is the fresh weight from the broken point to the panicle top; (2) Breaking strength (M, g cm) = 1/4 × BL (kg) × L (cm). BL is the force applied to break the stem segment, and L is the distance between the two points. (3) LI (%) = WP/M × 100; (4) Cross-section modulus (SM, mm3) = π/32 × (a13b1 − a23b2)/a1, a1 and a2 are the outer and inner diameter of the minor axis in an oval cross-section, respectively, while b1 and b2 are the outer and inner diameter of the major axis in an oval cross-section, respectively; and (5) Bending stress (BS, g mm−2) = M/SM.
2.3.3. Determination of Carbohydrate Content
The carbohydrate content of the stem was determined 30 days after heading. Samples of the S2 basal internode were oven-dried, separated into the culm and sheath, heated at 105 °C for 45 min, and dried to a constant weight at 80 °C. The stems were then crushed using a Model 100 high-speed universal grinder (Zhejiang Yongkang Dongli Electric Machine Co., Ltd., Jinhua, China). The stem was passed through a 60-mesh sieve to determine the chemical composition of the internodes. The content of nonstructural carbohydrates (NCS) was measured as described by Yoshida et al. (1971) [22]. Briefly, 50 mg of samples were extracted in 80% ethanol (v/v), which was then used to determine the soluble sugars after the anthrone reagent had been added. The absorbance of the solution was measured at 620 nm in a spectrophotometer. The remaining residue was dried and extracted with perchloric acid. The extracts were utilized to quantify starch as a glucose equivalent using the anthrone method as described above to quantify the soluble sugar.
The cellulose content was measured as described by Zhang et al. (2014) [6]. First, 5 mL of acetic acid/nitric acid reagent was added to 100 mg of powdered samples and boiled for 30 min. The supernatants were decanted after centrifugation, and the pellets were rinsed three times with 5 mL of distilled water. Next, 2.5 mL of 72% sulfuric acid was added and incubated at room temperature for 12 h, and 5 mL of distilled water was added to each tube. After the tubes were rinsed three times, all of the washes and hydrolyzed cellulose contents were combined into a 20 mL volumetric flask. Finally, the hydrolyzed cellulose was assayed as a glucose equivalent using the anthrone method described above.
The lignin content was determined as described by Ishimaru et al. (2008) [23]. Briefly, the samples were dried after extraction with ethanol ether (v/v = 1:1). Afterwards, 10 mL of 72% sulfuric acid was added to 500 mg of dried samples and incubated for 8 h at room temperature. The mixture was then poured into 280 mL of water and boiled for 4 h, filtered with a glass P16 filter, and washed free of acid with hot water. Subsequently, the filter and lignin were dried at 105 °C for 2 h until a constant weight was attained. The lignin content was calculated as follows: Cw (mg g−1) = 1000 × W/S, where W is the pellet weight (g), and S is the dried sample weight (g).
2.3.4. Grain Yield and Associated Yield Components
At maturity, 10 representative plants were selected from three locations in the middle of each plot to determine the spikelets per panicle, the filled grain rate and the weight of 1000 grains. At the location of the sampling point, 1 m2 of each point was selected to determine the number of effective panicles per 1 m2 and repeated three times. The average was calculated, and all of the rice panicles in 1 m2 were measured to determine the actual yield. The samples were weighed after they had been dried and threshed, and impurities were removed. Their moisture content was measured, and the standard grain yield of each treatment was determined based on a 13.5% moisture content and repeated three times, and the average was calculated.
2.4. Statistical Analysis
An analysis of variance (ANOVA) and a Pearson correlation analysis were performed using SPSS 22 (IBM, Inc., Armonk, NY, USA). The differences among means of the experimental treatments were separated using the least significant difference (LSD) test at a 0.05 probability level. Origin 2021 (OriginLab, Northampton, MA, USA) was used to generate figures. Microsoft Excel 2019 (Redmond, WA, USA) was used to organize the data and generate tables.
The relationships of the lodging percent, LI, and grain yield with the rate of N application were fitted using a logistic regression and monomial and polynomial models of nonlinear curve fit, respectively. The logistic regression model was used to fit the lodging percent with the increased N application rate as follows:
where A1 and A2 are the initial and the final values of the fit line; x0 is the center value, and p is the power value.
y = A2 + ((A1 − A2)/(1 + (x/x0)p))
Changes in the LI with the increased N application rate were both fitted by the monomial model as follows:
where a is the coefficient, and b is the intercept values.
y = ax + b
The changes in grain yield with an increase in the N application rate were both fitted by the polynomial model as follows:
where a and b are the coefficients, and c is the intercept value.
y = ax2 + bx + c
3. Results
3.1. Effect of N Application on the Mechanical Properties of Stem at the Basal Internodes of Rice under Dry Cultivation
The LI is determined by M and WP. The LI increased significantly with the increase in N application with consistent trends in both years (Figure 1). The application of N increased the WP to a significant level, primarily owing to the increase in SL (Table 1). In contrast, M tended to decrease significantly with increasing rates of N application, which resulted in an increase in the LI. ANOVA showed that N application had significant effects on M, WP and LI (Table 1).
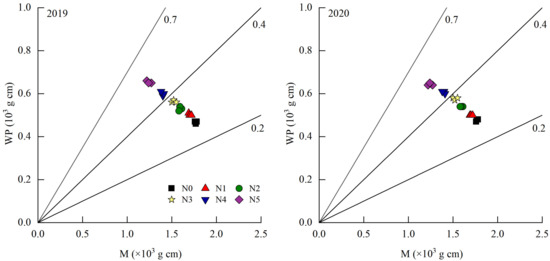
Figure 1.
Relationship between M, WP and LI by whole plant of rice under dry cultivation under different N application rates in 2019 and 2020. Dotted lines indicate the LI. N0, N1, N2, N3, N4 and N5 refer to the N application rate being 0, 70, 140, 210, 280 and 350 kg ha−1, respectively. M: Breaking strength. WP: Bending moment of the whole plant. LI: lodging index.

Table 1.
Analysis of variance of LI and its related physical parameters in 2019 and 2020.
M can be further broken down into two components, including BS and SM. SM tended to increase with increasing N application and reached significant levels overall; in contrast, BS tended to decrease significantly (Figure 2).
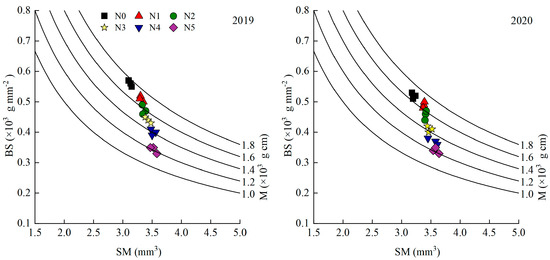
Figure 2.
Relationship between SM, BS and M of rice under dry cultivation under different N application rate in 2019 and 2020. N0, N1, N2, N3, N4 and N5 refer to the N application rate being 0, 70, 140, 210, 280 and 350 kg ha−1, respectively. M: Breaking strength. SM: Section modulus. BS: Bending stress.
WP can be further broken down into two components, including SL and FW. Year and N application had a significant effect on SL and WP (Table 1). SL and WP increased significantly with increasing N application (Figure 3), and both reached significant levels (Table 1) with consistent trends between the results of both years of the study.
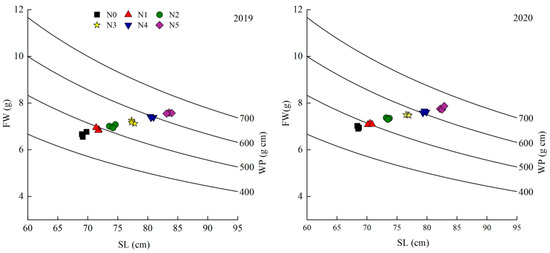
Figure 3.
Relationship between SL, FW and WP of rice under dry cultivation under different N application rate in 2019 and 2020. N0, N1, N2, N3, N4 and N5 refer to the N application rate being 0, 70, 140, 210, 280 and 350 kg ha−1, respectively. WP: Bending moment of the whole plant. SL: The distance from the broken point to the panicle top. FW: The fresh weight from the broken point to the panicle top.
3.2. Effect of N Application on Morphological Traits of Main Stems of Rice under Dry Cultivation
The internode lengths under different treatments of N application are shown in Figure 4. The basal internode length (S1+S2), upper internode length (S3+S4+S5), and spike length of rice under dry cultivation tended to increase in both years as the amount of fertilizer applied increased. Compared with the N0 treatment, the basal internode length, upper internode length and spike length of rice under dry cultivation increased by 17.72–55.82%, 7.34–34.21% and 1.60–5.01%, respectively, under the N1–N5 treatments. The increase in plant height was primarily reflected in the significant elongation of the basal internodes (Table 2).
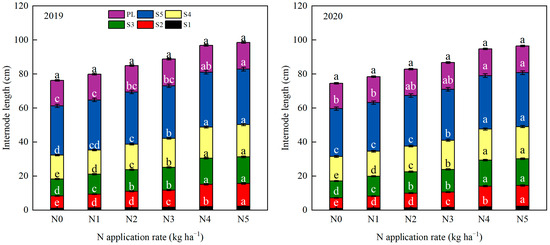
Figure 4.
Internode length under different N application rates in 2019 and 2020. N0, N1, N2, N3, N4 and N5 refer to the N application rate being 0, 70, 140, 210, 280 and 350 kg ha−1, respectively. S1, S2, S3, S4, and S5 denote the first internode to the fifth internode base from the stem base, respectively. Panicle length (PL). The same letter means they do not have significantly different at the 0.05, the different letter means they have significantly different at the 0.05.
Table 2.
Analysis of variance of internode length and panicle length.
The plant height, center of gravity height and dry weight of the upper three leaves gradually increased. The panicle weight first increased and then decreased slightly as the amount of N applied increased (Table 3). Compared with the N0 treatment, the center of gravity height, panicle weight, and upper panicle dry weight of rice under dry cultivation increased by 4.22–29.25%, 3.92–36.05%, 2.68–32.21% and 11.54–38.46% on average under the N1–N5 treatments, respectively. An ANOVA showed that N application had significant effects on the morphology of the main stem of rice under dry cultivation (Table 4).
Table 3.
Effect of N application rate on main stem characteristics of rice under dry cultivation in 2019 and 2020.
Table 4.
Analysis of variance of main stem characteristics.
3.3. Effect of N Application on Basal Internode Fullness of Rice under Dry Cultivation
As shown in Table 5, the dry weight of unit leaf sheath, dry weight per unit culm, culm diameter and culm wall thickness of the basal internodes tended to decrease as the amount of N applied increased. Compared with the N0 treatment, the dry weight of unit leaf sheath, dry weight per unit culm and culm diameter and culm wall thickness of the S2 basal internode of rice under dry cultivation under the N1–N5 treatments decreased by 4.9–38.11%, 2.08–9.56%, 0.82–6.52% and 2.22–8.89% on average, respectively. The N application rate had no significant effect on the minor axis diameter and major axis diameter of each treatment. An ANOVA showed that N application had significant effects on the dry weight of unit leaf sheath, dry weight per unit culm, culm diameter and culm wall thickness of the basal internodes of rice under dry cultivation (Table 6).
Table 5.
Effects of N application rate on morphological characteristics of the S2 basal internode of rice under dry cultivation in 2019 and 2020.
Table 6.
Analysis of variance of morphological characteristics of the S2 basal internode.
3.4. Effect of N Application on the Chemical Composition of the Basal Culm and Sheath of Rice under Dry Cultivation
The contents of lignin, cellulose and NSC in the leaf sheaths and culm tended to decrease as the amount of N applied increased (Table 7). There was a greater decrease in the content of NSC. Compared with the N0 treatment, the basal internode NSC content was reduced by an average of 10.16–51.37% in the culm and 15.79–55.64% in the leaf sheaths under the N1–N5 treatment. The reduction in cellulose content of structural carbohydrates was greater compared with that of lignin with an average reduction of 7.99–36.77% and 12.54–34.15% in the basal internode cellulose and lignin content in the culm under the N1-N5 treatments compared with the N0 treatments, respectively. The average reduction in the leaf sheaths was 5.70–41.35% and 14.15–39.31%, respectively. An ANOVA showed that N application had significant effects on the contents of cellulose, lignin, and NSC of the basal internodes of the culm and leaf sheaths of rice under dry cultivation (Table 8).
Table 7.
Effect of N application rate on carbohydrates contents of the S2 basal internode of the culm and sheath of rice under dry cultivation in 2019 and 2020.
Table 8.
Analysis of variance of carbohydrates contents of the S2 basal internode of the culm and sheath.
3.5. Relationship between Stem Traits and Lodging Resistance
As shown in Table 9 and Table 10, the basal internode M of the stem significantly or very significantly positively correlated with the BS, dry weight per unit culm, dry weight of unit leaf sheath, culm diameter, lignin, cellulose and NSC, while it significantly or very significantly negatively correlated with SL, FW, the length of S2 internodes, plant height, center of gravity height, panicle weight and dry weight of the upper three leaves. The LI significantly or highly significantly negatively correlated with M, BS, dry weight per unit culm, dry weight of unit leaf sheath, culm diameter, culm wall thickness, lignin, cellulose, and NSC, and highly significantly positively correlated with the SL, FW, length of S2 internodes, plant height, center of gravity height, panicle weight and dry weight of the upper three leaves.
Table 9.
LI and its related parameters of the S2 basal internode in 2019 and 2020 (n = 18).
Table 10.
Correlation coefficients between LI and the S2 basal internode of chemical composition in 2019 and 2020 (n = 18).
3.6. Effect of N Application on Grain Yield and Its Composition
The grain yield tended to increase and then decrease as the amount of N applied increased and reached a maximum at the N3 level of N application with an average increase of 100.65–128.42% in grain yield under the N1–N5 treatments compared with the N0 treatment (Table 11). The amount of N applied had no significant effect on the 1000-grain weight, but it had a significant effect on the effective panicles, spikelets per panicle, and filled grain rate. There was no significant difference in the 1000-grain weight between the N treatments, and a decreasing trend in the filled grain rate with an increase in the application of N. The effective panicles, spikelets per panicle and grain yield showed the same trend. They increased and then decreased, and reached their highest levels in the N3 treatment. Compared with the N0 treatment, the effective panicles and spikelets per panicle of the rice population under the N1-N5 treatment increased by 47.22–55.17% and 46.06–53.62% on average, respectively. An ANOVA showed that N application had a significant effect on the grain yield of rice under dry cultivation (Table 12).
Table 11.
Effect of N application rate on grain yield and yield composition of rice under dry cultivation in 2019 and 2020.
Table 12.
Analysis of variance of grain yield and yield composition.
3.7. Relationship between N Application and Grain Yield, Lodging Rate and LI
The relationships between the grain yield, lodging rate, LI and N application were fitted with different curves and all reached a highly significant level (Figure 5). The polynomial regression equations for grain yield versus N application in 2019 and 2020 were y = −0.083x2 + 38.153x + 3468.761, (R2 = 0.990**) and y = −0.088x2 + 40.049x + 2925.881, (R2 = 0.995**) respectively, which were calculated to provide a maximum N fertilizer application of 229.84 kg ha−1 and 227.55 kg ha−1, respectively. The highest grain yields of 7853.25 kg ha−1 and 7482.49 kg ha−1 were achieved at 229.84 kg ha−1 and 227.55 kg ha−1, respectively.
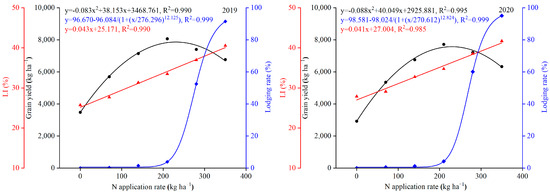
Figure 5.
Relationships between grain yield, lodging percent and LI and N application rate in 2019 and 2020. LI: lodging index.
Logistic regression equations for lodging rate versus N application in 2019 and 2020 were y = 96.670 − 96.084/[1 + (x/276.296)12.125], (R2 = 0.999**) and y = 98.581 − 98.024/[1 + (x/270.612)12.824], (R2 = 0.999**), respectively, and a 3.90–10.27% lodging rate when N was applied at 210–227.55 kg ha−1.
The linear regression equations for the LI and N application in 2019 and 2020 were y = 0.043x + 25.171, (R2 = 0.990**) and y = 0.041x + 27.004, (R2 = 0.985**), respectively, with an LI of 34.20–36.33% when the amount of N applied was 210–227.55 kg ha−1.
3.8. Stepwise Regression Analysis
A stepwise regression analysis was conducted with LI as the dependent variable, plant morphological traits, chemical properties, mechanical traits and grain yield components as independent variables, and p = 0.05 as a condition for variable entry and exclusion with the results shown in Table 13. It is apparent that the primary morphological traits that affect the index of fall are the center of gravity height and dry weight per unit culm, and the primary chemical traits are the cellulose of culm and the NSC of leaf sheath. The main mechanical traits are M and WP. Among the grain yield component factors, the effective panicles had the greatest influence on LI.
Table 13.
Selected traits in stepwise regression analysis.
4. Discussion
4.1. Effect of N Application on Stem Characteristics of Rice under Dry Cultivation
Rice lodging primarily occurs owing to an imbalance between the upper and lower parts of the plant [24,25], and it is primarily the stems that lodge. Previous studies have shown that the excessive application of N fertilizer leads to the elongation of rice culm at all the internodes, particularly the basal internode, and reduces the dry weight per unit culm, increases plant height, center of gravity height, and reduces the culm diameter, which, in turn, affects its ability to resist lodging [6,12,26,27]. However, the conclusions regarding the effect of N fertilizer on culm wall thickness were not consistent. In this study, the primary manifestations of the weak resistance to lodging in rice under dry cultivation were the long basal internodes of the stem, higher plant height, higher center of gravity, smaller basal internode thickness, and the increased dry weight of the upper three leaves and panicle weight, which were not related to the culm wall thickness. This is generally consistent with the results of Li et al. (2011) [28].
In this study, an increase in the level of N applied reduced the ability of rice under dry cultivation to resist lodging. This is primarily because an increase in the level of N applied induces an increase in the number of tillers during the early growth stage of rice under dry cultivation, and the expansion of rice under dry cultivation population intensifies the competition of plants for nutrients, which leads to a smaller internode thickness at the base of the stem and the elongation of the internodes. This is accompanied by an increase in plant height and center of gravity height and the PW and SL, which result in a decrease in M and BS. These factors result in a decrease in the resistance of rice under dry cultivation. Zhang et al. (2014) concluded that increasing the level of N applied increased the WP and FW, reduced BS, and increased LI [6]. Combined with the correlation analysis, this study suggests that the key to improving the resistance of rice under dry cultivation to collapse in terms of stem characteristics still lies in the length of the basal internode, plant height, center of gravity height, and the balance between the basal internode and the top of the panicle. The application of appropriate levels of N are a technique to regulate the management of nutrients to ensure a thick internode at the base of the stem and a balance between the upper and lower parts of the plant in rice under dry cultivation. Only one variety of rice under dry cultivation was used as a test material in this study, and the response of different rice varieties to N varies, so multiple varieties could be selected for future studies at multiple ecological sites.
4.2. Effect of N Application on the Chemical Properties of Internodes at the Base of Stem in Rice under Dry Cultivation
Stem quality is also one of the important factors that determines the ability of rice stems to resist lodging when under dry cultivation. Studies have found that the content of chemical components, including carbohydrates, inorganic elements, and trace elements, among others, in the stem of rice under dry cultivation at the late reproductive stages are all related to the ability of rice to resist lodging [27,29,30,31]. Nutrient regulation changes the distribution of chemical components in the stem and, thus, affects the ability of rice to withstand [31], which is consistent with the results of this study. In this study, the ability of rice under dry cultivation to resist lodging was related to the content of carbohydrates in the stem. An increase in the application of N reduced the contents of lignin, cellulose, and NSC in the basal internodes of rice under the dry cultivation stems, decreased the stem M, increased the LI, and reduced the resistance to lodging. This could be owing to the fact that a higher supply of N causes excessive cell growth and the thinning of cell walls, while consuming large amounts of carbohydrates leads to a loosening of the stem mechanical tissues and reduces their ability to resist lodging. This is consistent with the findings of Wu et al. (2015) [32]. However, in this study, the chemical composition of the stems was only determined at the stage of susceptibility to collapse in rice under dry cultivation, while the specific processes of changes in these components in the stems are not yet clear. Therefore, the dynamics of contents of lignin, cellulose and NSC of the stems and their related enzymes after nodulation in rice under dry cultivation under N fertilizer management will be studied in greater degree in the future to elucidate their relationship with the ability of rice to resist lodging under dry cultivation.
4.3. Effect of N Application on the Yield of Rice under Dry Cultivation
Previous studies have found that with the increase in the level of N applied, the effective panicles gradually increased, and the spikelets per panicle and grain yield increased at first and then decreased, thus improving the grain yield [33,34]. In this study, with the increase in the level of N applied, the effective panicles, spikelets per panicle and grain yield of rice under dry cultivation also increased at first and then decreased, and the effective panicle number increased with the increase in the level of N applied. This is primarily because the application of the appropriate level of N can ensure the N supply to rice under dry cultivation, promote the growth and development of rice under dry cultivation, and finally increase grain yield. However, the application of excessive amounts of N will lead to an increase in the number of ineffective tillers during the early growth stage of rice under dry cultivation. The expansion of rice under dry cultivation population will intensify the competition for nutrients, which results in low yields. In this study, the highest yield of rice under dry cultivation was obtained under levels of 210–227.55 kg ha−1 of N applied. Therefore, the grain yield was more desirable and resistant to lodging with 3.90–10.27% and an LI of 34.20–36.33% when N was applied at 210–227.55 kg ha−1. In addition, higher spikelets per panicle and a higher filled grain rate were the primary ways to increase the high grain in rice under dry cultivation (Table 14).
Table 14.
Correlation between yield and yield components.
5. Conclusions
This study showed that with the increase in N applied, the plant height increased, and the basal internodes elongated; the center of gravity height shifted upwards; dry weight per unit culm decreased; carbohydrate content, BS and M decreased, LI gradually increased, and resistance to stem lodging decreased, while the grain yield tended to increase at first and then decrease. The LI of basal internodes of the stem highly significantly positively correlated with the application of N. Quadratic regression model between N application rates and grain yield showed that better grain yield could be achieved under N application rate ranged from 210 to 228 kg ha−1. Therefore, the N application rate of (i.e., 210–228 kg N ha−1) could be recommended for the Suijing18 variety under dry cultivation in central Jilin Province for achieving a high grain yield and great lodging resistance.
Author Contributions
Formal analysis, writing-original draft preparation, M.W. and H.J.; Methodology, Z.W. (Zhiheng Wei); Conceptualization, W.L.; Software, K.G.; Investigation, M.W., Z.W. (Zhiheng Wei) and H.J.; Data curation, M.W.; Writing-review and editing, M.Y. and Z.W. (Zhihai Wu); Supervision, Y.D., J.C. and D.W.; Funding acquisition, P.T., X.W. and Z.W. (Zhihai Wu). All authors have read and agreed to the published version of the manuscript.
Funding
This study was supported by the following funding sources: Jilin Science and Technology development plan project (20220101184JC, 20210509013RQ, 20210101045JC).
Institutional Review Board Statement
Not applicable.
Informed Consent Statement
Not applicable.
Data Availability Statement
The data reported in this study are contained within the article.
Conflicts of Interest
The authors declare that they have no conflict of interest.
References
- Gupta, A.; Rico-Medina, A.; Cano-Delgado, A.I. The physiology of plant responses to drought. Science 2020, 368, 266–269. [Google Scholar] [CrossRef] [PubMed]
- Wen, H.J.; Yi, W.J.; Fei, C.H.; Xing, Z.Z.; Xun, F.C.; Hong, S.C.; Wei, L.W.; Ying, W.P.; Khan, M.U.; Xiong, L.W. Optimal management of nitrogen fertilizer in the main rice crop and its carrying-over effect on ratoon rice under mechanized cultivation in Southeast China. J. Integr. Agr. 2022, 21, 351–364. [Google Scholar] [CrossRef]
- Zhang, H.C.; Hu, Y.J.; Yang, J.C.; Dai, Q.G.; Huo, Z.Y.; Xu, K.; Wei, H.Y.; Gao, H.; Guo, B.W.; Xing, Z.P.; et al. Development and Prospect of Rice Cultivation in China. Sci. Agric. Sin. 2021, 54, 1301–1321. [Google Scholar]
- Jiang, H.; Thobakgale, T.; Li, Y.Z.; Liu, L.W.; Su, Q.W.; Cang, B.F.; Bai, C.Y.; Li, J.Y.; Song, Z.; Wu, M.K.; et al. Construction of dominant rice population under dry cultivation by seeding rate and nitrogen rate interaction. Sci. Rep. 2021, 11, 7189. [Google Scholar] [CrossRef]
- Li, X.H.; Wang, W.K.; Yang, T.W.; Zhou, Q.; Xia, F.Z. Development status, advantages and main problems to be solved of water-saving and drought resistant rice. J. Huazhong Agr. Univ. 2022, 41, 84–91. [Google Scholar]
- Zhang, W.J.; Li, G.H.; Yang, Y.M.; Li, Q.; Zhang, J.; Liu, J.Y.; Wang, S.H.; Tang, S.; Ding, Y.F. Effects of Nitrogen Application Rate and Ratio on Lodging Resistance of Super Rice with Different Genotypes. J. Integr. Agr. 2014, 13, 63–72. [Google Scholar] [CrossRef]
- Jiang, M.J.; Wang, H.Y.; He, Y.; Wang, C.Y.; Li, N.; Yang, Z.Y.; Ma, J. Effects of Nitrogen Management on Lodging Resistance of Direct-seeded Rice. J. Nucl. Agr. Sci. 2020, 34, 157–168. [Google Scholar]
- Ma, P.; Yang, Z.Y.; Li, Y.; Lin, C.; Sun, Y.J.; Ma, J. Effects of nitrogen reduction in wheat/ rape season and nitrogen fertilizer management in rice season on crop yield and nitrogen uptake in crop rotation system. Acta Agr. Zhejiangensis 2019, 31, 1769–1778. [Google Scholar]
- Chen, T.; Hu, Y.; Wu, F.; Zhao, X.; Wang, M.R.; Zhao, C.K.; Yang, G.T.; Hu, Y.G. Effects of nitrogen and phosphorus regulation on lodging resistance and yield of Jingyou 781 hybrid rice. J. Yunnan Univ. 2020, 42, 1190–1201. [Google Scholar]
- Xiao, N.; Dong, L.Q.; Cong, L.; Sun, X.S.; Zhou, C.C.; Wang, Y.Z.; Jia, B.Y.; Huang, Y.C.; Wang, S. Effect of Nitrogen Application on Lodging Resistance and Yields of Japonica Rice under Drill Seeding. J. Shenyang Agr. Univ. 2017, 48, 647–653. [Google Scholar]
- Zhang, W.J.; Wu, L.M.; Ding, Y.F.; Yao, X.; Wu, X.R.; Weng, F.; Li, G.H.; Liu, Z.H.; Tang, S.; Ding, C.Q.; et al. Nitrogen fertilizer application affects lodging resistance by altering secondary cell wall synthesis in japonica rice (Oryza sativa). J. Plant Res. 2017, 130, 859–871. [Google Scholar] [CrossRef] [PubMed]
- Fang, X.T.; He, H.R.; Xie, Z.Q.; Zhang, J.N.; Zhuo, C.Y.; Cai, G.J.; Yang, H.J. The Effect of Different Nitrogen Rates on Culm Traits and Lodging Resistance of Hybrid Rice. Fujian J. Agr. Sci. 2016, 31, 1034–1038. [Google Scholar]
- Lv, R.J.; Zhang, W.J.; Xie, X.B.; Wang, Q.J.; Gao, K.G.; Zeng, Y.H.; Zeng, Y.J.; Pan, X.H.; Shang, Q.Y. Foliar application uniconazole enhanced lodging resistance of high-quality indica rice (Oryza sativa L.) by altering anatomical traits, cell structure and endogenous hormones. Field Crop. Res. 2022, 277, 108425. [Google Scholar] [CrossRef]
- Li, W.Q.; Han, M.M.; Pang, D.W.; Chen, J.; Wang, Y.Y.; Dong, H.H.; Chang, Y.L.; Jin, M.; Luo, Y.L.; Li, Y.; et al. Characteristics of lodging resistance of high-yield winter wheat as affected by nitrogen rate and irrigation managements. J. Integr. Agr. 2022, 21, 1290–1309. [Google Scholar] [CrossRef]
- Wang, Y.Y.; Jin, M.; Luo, Y.L.; Chang, Y.L.; Zhu, J.K.; Li, Y.; Wang, Z.L. Effects of irrigation on stem lignin and breaking strength of winter wheat with different planting densities. Field Crop. Res. 2022, 282, 108518. [Google Scholar] [CrossRef]
- Chen, L.; Yang, Y.; Cui, C.G.; Lu, S.; Lu, Q.M.; Du, Y.Y.; Su, R.; Chai, Y.M.; Li, H.J.; Chen, F.Z.; et al. Effects of Vrn-B1 and Ppd-D1 on developmental and agronomic traits in Rht5 dwarf plants of bread wheat. Field Crop. Res. 2018, 219, 24–32. [Google Scholar] [CrossRef]
- Du, Y.Y.; Chen, L.; Wang, Y.S.; Yang, Z.Y.; Saeed, I.; Daoura, B.G.; Hu, Y.G. The combination of dwarfing genes Rht4 and Rht8 reduced plant height, improved yield traits of rainfed bread wheat (Triticum aestivum L.). Field Crop. Res. 2018, 215, 149–155. [Google Scholar] [CrossRef]
- Huang, G.; Liu, Y.; Guo, Y.; Peng, C.; Tan, W.; Zhang, M.; Li, Z.; Zhou, Y.; Duan, L. A novel plant growth regulator improves the grain yield of high-density maize crops by reducing stalk lodging and promoting a compact plant type. Field Crop. Res. 2021, 260, 107982. [Google Scholar] [CrossRef]
- Chen, X.G.; Shi, C.Y.; Yin, Y.P.; Wang, Z.L.; Shi, Y.H.; Peng, D.L.; Ni, Y.L.; Cai, T. Relationship between lignin metabolism and lodging resistance in wheat. Acta Agron. Sin. 2011, 37, 1616–1622. [Google Scholar] [CrossRef]
- Ookawa, T.; Ishihara, K. Varietal difference of the cell-wall components affecting the bending stress of the culm in relation to the lodging resistance in paddy rice. Japan. J. Crop. Sci. 1993, 62, 378–384. [Google Scholar] [CrossRef]
- Ookawa, T.; Hobo, T.; Yano, M.; Murata, K.; Ando, T.; Miura, H.; Asano, K.; Ochiai, Y.; Ikeda, M.; Nishitani, R.; et al. New approach for rice improvement using a pleiotropic QTL gene for lodging resistance and yield. Nat. Commun. 2010, 1, 132. [Google Scholar] [CrossRef]
- Yoshida, S.; Forno, D.A.; Cock, J. Laboratory Manual for Physiological Studies of Rice; International Rice Research Institute: Los Baños, Philippines, 1971. [Google Scholar]
- Ishimaru, K.; Togawa, E.; Ookawa, T.; Kashiwagi, T.; Madoka, Y.; Hirotsu, N. New target for rice lodging resistance and its effect in a typhoon. Planta 2008, 227, 601–609. [Google Scholar] [CrossRef] [PubMed]
- Fan, C.F.; Li, Y.; Hu, Z.; Hu, H.Z.; Wang, G.Y.; Li, A.; Wang, Y.M.; Tu, Y.Y.; Xia, T.; Peng, L.C.; et al. Ectopic expression of a novel OsExtensin-like gene consistently enhances plant lodging resistance by regulating cell elongation and cell wall thickening in rice. Plant Biotechnol. J. 2018, 16, 254–263. [Google Scholar] [CrossRef] [PubMed]
- Zhang, W.J.; Wu, L.M.; Ding, Y.F.; Weng, F.; Wu, X.R.; Li, G.H.; Liu, Z.H.; Tang, S.; Ding, C.Q.; Wang, S.H. Top-dressing nitrogen fertilizer rate contributes to decrease culm physical strength by reducing structural carbohydrate content in japonica rice. J. Integr. Agr. 2016, 15, 992–1004. [Google Scholar] [CrossRef]
- Wu, W.; Shah, F.; Ma, B.L. Understanding of crop lodging and agronomic strategies to improve the resilience of rapeseed production to climate change. Crop. Environ. 2022, 1, 133–144. [Google Scholar] [CrossRef]
- Wu, W.; Ma, B.L.; Fan, J.J.; Sun, M.; Yi, Y.; Guo, W.S.; Voldeng, H.D. Management of nitrogen fertilization to balance reducing lodging risk and increasing yield and protein content in spring wheat. Field Crop. Res. 2019, 241, 107584. [Google Scholar] [CrossRef]
- Li, G.H.; Zhong, X.H.; Tian, K.; Huang, N.R.; Pan, J.F.; He, T.H. Effect of Nitrogen Application on Stem Lodging Resistance of Rice and Its Morphological and Mechanical Mechanisms. Sci. Agric. Sin. 2013, 46, 1323–1334. [Google Scholar]
- Sun, J.W.; Li, N.; Wang, C.Y.; Zhao, J.H.; Zhang, S.W.; Jiang, M.J.; Sun, Y.J.; Ma, J. Effects of Transplanting Methods and Potassium Rates on Lodging Resistance of Hybrid Rice. J. Nucl. Agric. Sci. 2017, 31, 2408–2417. [Google Scholar]
- Yang, Y.H.; Zhu, Z.; Zhang, Y.D.; Chen, T.; Zhao, Q.Y.; Zhou, L.H.; Yao, S.; Wang, C.L. Changes of Stem Biochemical Components in Different Growth Stages of Rice and Their Relationship with Lodging Resistance. Plant Physiol. Commun. 2011, 47, 1181–1187. [Google Scholar]
- Zhang, M.C.; Liu, Y.Y.; Luo, S.G.; Peng, X.L.; Chen, L.N.; Li, Z.Y.; Li, J. Effects of Integrated Nutrient Management on Lodging Resistance of Rice in Cold Area. Sci. Agric. Sin. 2010, 43, 4536–4542. [Google Scholar]
- Wu, X.R.; Zhang, W.J.; Wu, L.M.; Weng, F.; Li, G.H.; Liu, Z.H.; Tang, S.; Ding, C.Q.; Wang, S.H.; Ding, Y.F. Characteristics of Lodging Resistance of Super-Hybrid Indica Rice and Its Response to Nitrogen. Sci. Agric. Sin. 2015, 48, 2705–2717. [Google Scholar]
- Li, Z.J.; Liu, F.C.; Wu, W. Optimising nitrogen management strategies to minimise lodging risk while sustaining high seed yield in rapeseed. Eur. J. Agron. 2023, 142, 126671. [Google Scholar] [CrossRef]
- Wu, W.; Ma, B.L. Understanding the trade-off between lodging resistance and seed yield, and developing some non–destructive methods for predicting crop lodging risk in canola production. Field Crop. Res. 2022, 288, 108691. [Google Scholar] [CrossRef]


Disclaimer/Publisher’s Note: The statements, opinions and data contained in all publications are solely those of the individual author(s) and contributor(s) and not of MDPI and/or the editor(s). MDPI and/or the editor(s) disclaim responsibility for any injury to people or property resulting from any ideas, methods, instructions or products referred to in the content. |
© 2023 by the authors. Licensee MDPI, Basel, Switzerland. This article is an open access article distributed under the terms and conditions of the Creative Commons Attribution (CC BY) license (https://creativecommons.org/licenses/by/4.0/).