Article

Responses of Crop and Soil Phosphorus Fractions to Long-Term Fertilization Regimes in a Loess Soil in Northwest China

1
Key Laboratory of Plant Nutrition and the Agri-Environment in Northwest China, Ministry of Agriculture, College of Natural Resources and Environment, Northwest A & F University, Yangling, Xianyang 712100, China
2
College of Resources and Environment, Southwest University, Beibei District, Chongqing 400715, China
*
Author to whom correspondence should be addressed.
Agronomy 2023, 13(12), 3072; https://doi.org/10.3390/agronomy13123072
Submission received: 9 November 2023 / Revised: 9 December 2023 / Accepted: 13 December 2023 / Published: 15 December 2023
(This article belongs to the Section Soil and Plant Nutrition)

Abstract

:
Contrasting fertilization modifies soil phosphorus (P) transformation and bioavailability, which impact crop P uptake and P migration in the soil profile. A long-term (25-year) fertilizer experiment was employed to investigate crop yield, P uptake and changes in sequentially extracted P fractions in the soil profile, and their relationships on a calcareous soil derived from loess material under a winter wheat and summer maize double-cropping system. The experiment involved seven nutrient management treatments: control (CK, no nutrient input), N, NK, NP, and NPK, representing various combinations of synthetic nitrogen (N), phosphate (P), and potassium (K) applications, as well as combinations of NPK fertilizers with either crop residues (SNPK, where S refers to maize stalk or wheat straw) or manure (MNPK, where M refers to dairy manure). Wheat and maize yields were significantly higher with P input fertilizer relative to the P-omitted treatments. Long-term application of P-containing fertilizers markedly raised the contents of inorganic (Pi) and organic (Po) P fractions at 0–20 cm depth compared with the P-omitted treatments. Moreover, both Pi and Po fractions were markedly higher under MNPK than under NPK and SNPK treatments. For achieving high yield for wheat and maize, the critical contents of labile P were 54 and 63 mg kg−1, and those of moderately labile P were 48 and 49 mg kg−1, respectively, defined by the linear plateau model. In addition, the change points of labile P and moderately labile P were 99 and 70 mg kg−1, above which CaCl2-P content significantly increased. Moreover, long-term P input significantly accumulated different P fractions in the deeper soil layers up to 100 cm, with large portions of organic P being a composite of labile and moderately labile P, especially in MNPK treatment. Our results suggest that excessive P supply with organic manure resulted in massive P accumulation in the topsoil and promoted soil P fraction transformation and availability in the deep soil layers, especially in an organic P form that has often been neglected.

1. Introduction

Phosphorus (P) is recognized as one of the main nutrients that restricts plant growth; however, the growing global food demand has led to a considerable increase in chemical P fertilizer inputs [1], particularly in intensive farming [2]. In China, chemical P fertilizers were consumed at a rate of 1.83 million tons to 6.85 million tons from 1986 to 2015, but the P recovery efficiency for major cereal crops is only 11.6% [3]; consequently, a large amount of available P accumulated in the surface layer (Olsen-P, 7.4 to 24.7 mg kg−1) [2]. Moreover, excess P fertilizer due to long-term P addition also provides valuable evidence regarding changes in soil P transformations in the soil profile [4,5,6]. Hence, understanding soil P transformation and its environmental effect after P application is fundamental to interpreting soil P availability [7].
Inorganic P is the dominant form in mineral soils with low organic matter content like calcareous soils, and it occupies up to 80% of the total phosphorus [8]. Plenty of research has focused on the transformation of inorganic P and its bioavailability [9,10]. However, with the full return of crop residues and the addition of organic manure and fertilizers, soil organic matter content markedly increased [11], and subsequently, soil organic P also rose [12]. In this context, using the sequential fractionation scheme of soil P is an effective method for determining the changes in the amount of Pi and Po compounds in the soil [13]. It allows soil P to be classified into different P fractions (i.e., labile P, moderately labile P, and non-labile P) based on its bioavailability to plants [14]. In order to better comprehend P behavior in the soil profile, the P fraction scheme was previously adapted to focus on soil P transformation in intensive vegetable cropping, concluding that it is imperative to examine the status of P fractions following long-term P fertilization [5,6]. Therefore, further information is needed about how long-term contrasting fertilization regimes in cereal cropping modified soil P transformation in surface and subsurface soils to obtain insight into the P dynamics and develop sustainable P management strategies to guarantee crop production and environmental security.
In addition, although P applied in the form of chemical fertilizer or manure can be readily immobilized by soil colloids [5], previous studies have demonstrated that P leaching in the soil profile has become an important research focus [2,6]. The movement of P to the deep soil profiles has also been reported in many fields or lysimeter studies in coarse and fine-textured soils [15,16]. Indeed, P leaching varied in different soils which received continuous P fertilization that exceeded crop P requirements [17]. Based on the relationship of Olsen-P and CaCl2-extractable P, the potential of P release from soils has been predicted [18,19], which influences the P fractions transformation [20]. Previously, the critical P values estimated in the relationship between Olsen-P and CaCl2-P as reported in the literature on different soils varied from 17.7 to 156 mg kg−1 [19,21]. However, when soil organic P is high, the relationship between Olsen-P and CaCl2-extractable P might contain some uncertainty or bias in predicting P leaching since organic P is not considered.
In addition, determining critical levels of Olsen-P is essential to sustain the efficient use of P and maximize agronomic yields [22]. Although the various extraction methods are designed to estimate plant-available P, they extract P from different fractions and to varying degrees which do not necessarily match the current availability of the plant [23]. Notably, Appelhans et al. [24] proposed a methodology by which to measure the bioavailability of P fraction that enables us to only account for either Pi or Po, and they presented it as a predictor of the P nutritional status of the crops. Although the various extraction methods are intended to approximate the quantity of P that is accessible to the plant, the authors extract P from different fractions and to varying degrees, which may not accurately reflect the current availability of P for the plant [23]. Consequently, the quantity of P extracted from a given soil sample differs greatly depending on the method used, leading to diverse values of soil test P [18]. This discrepancy can be attributed to the fact that the P extracted using different methods undergoes different chemical reactions with soil variables, including CaCO3 and SOC contents, soil pH, Fe and Al oxides, and clay content [25]. Indeed, there is a lack of discussion about the critical value that could be considered in both Pi and Po sources to improve the accuracy of P fertilizer recommendations based on the relationship between soil P fractions and crop yield, and, analyzing the relationship between CaCl2-P and P fractions, there is a lack of proven evidence as to whether a critical level of P fractions exists for leaching through. Thus, this study will seek to address these issues by measuring the leaching change points for different P fractions in response to P fertilization, which is beneficial for analyzing soil P loss risk and regional P availability management. We hypothesized that long-term contrasting fertilization, especially organic manure, and crop residue return, would change the soil properties and consequently affect P transformation and bioavailability in the soil, which are associated with crop P uptake and P movement in the soil profile. To test this hypothesis, this study investigated crop yield, P uptake, P budget, the sequentially extracted Pi and Po fractions at surface and subsurface soils, and their relationships through a long-term fertilizer experiment under wheat–maize crop rotation in northwest China.

2. Materials and Methods

2.1. Study Site & Experimental Design

The long-term field experiment was set up in 1990 in Yangling, Shaanxi Province, China (34°17′51″ N and 108°00′48″ E, 524.7 m above sea level), belonging to the Chinese National Soil Fertility and Fertilizer Efficiency Monitoring Base of Loess soil. The experimental site has a mean annual temperature of 12.9 °C and mean annual precipitation of 550 mm, which mainly falls from July to September. The soils have a silty clay loam texture (with 16% clay, 52% silt and 32% sand) derived from loess materials and were classified as Anthrosols or a cumuli-Orthic Anthrosols according to IUSS Working Group WRB [26] and Chinese soil classification [27]. Based on an international soil texture classification system, Zhang et al. [28] observed silt clay loam at 0–80 cm depth and loamy clay at 80–140 cm depth in the soil profile. At the establishment time of the experiment, the mean values of the plough (0−20 cm) layer characteristics were as follows: SOC of 7.44 g kg−1; CaCO3 content of 92.5 g kg−1; pH (soil /H2O, 1:1) of 8.62; total N of 0.93 g kg−1; Olsen-P of 9.57 mg kg−1; and exchangeable K of 191 mg kg−1.
The experiment had a winter wheat and summer maize double-cropping system with nine nutrient management treatments. The plot size was 14 m × 14 m. In the current study, seven treatments were selected, i.e., CK, N, NK, NP, and NPK, NPK plus wheat or maize straw (SNPK, S refers to maize stalk or wheat straw), and NPK with dairy manure (MNPK). In the SNPK treatment, 4.5 t ha−1 of wheat straw (dry weight) was incorporated into the soil from 1990 to 1998, and then about 4.39 t ha−1 of maize stalk has been incorporated into the soil since 1999 each year before sowing winter wheat. In the MNPK treatment, for winter wheat, the applied N rate was 70% from the dairy manure and 30% from the chemical fertilizer, and manure with dry weight of about 2.6–36.0 t ha−1 was incorporated before sowing winter wheat. Table 1 gives more details about the doses of nutrient input in each treatment. All synthetic fertilizers before winter wheat sowing or approximately one month after maize sowing were incorporated into the soil to a plowing depth of about 20 cm. The synthetic fertilizers (N, P, and K) applied were urea (CO(NH2)2), single super-phosphate (Ca(H2PO4)2), and potassium sulfate (K2SO4), respectively. During the winter wheat season, the plots were irrigated once or twice with approximately 90 mm of groundwater on each occasion and between two and four times during the summer maize season, relying on precipitation. Winter wheat (Xiao Yan 22) was planted in October at a seeding rate of 375 seeds m−2 and harvested approximately three months later (end of September or early October). Summer maize (Zheng Dan 958) was then planted immediately with a density of 67,500 plants per hectare and harvested approximately three months later in late September or early October. A rototiller was used to conventionally till the fields after harvesting if specified, and the residue of all above-ground crops was removed.

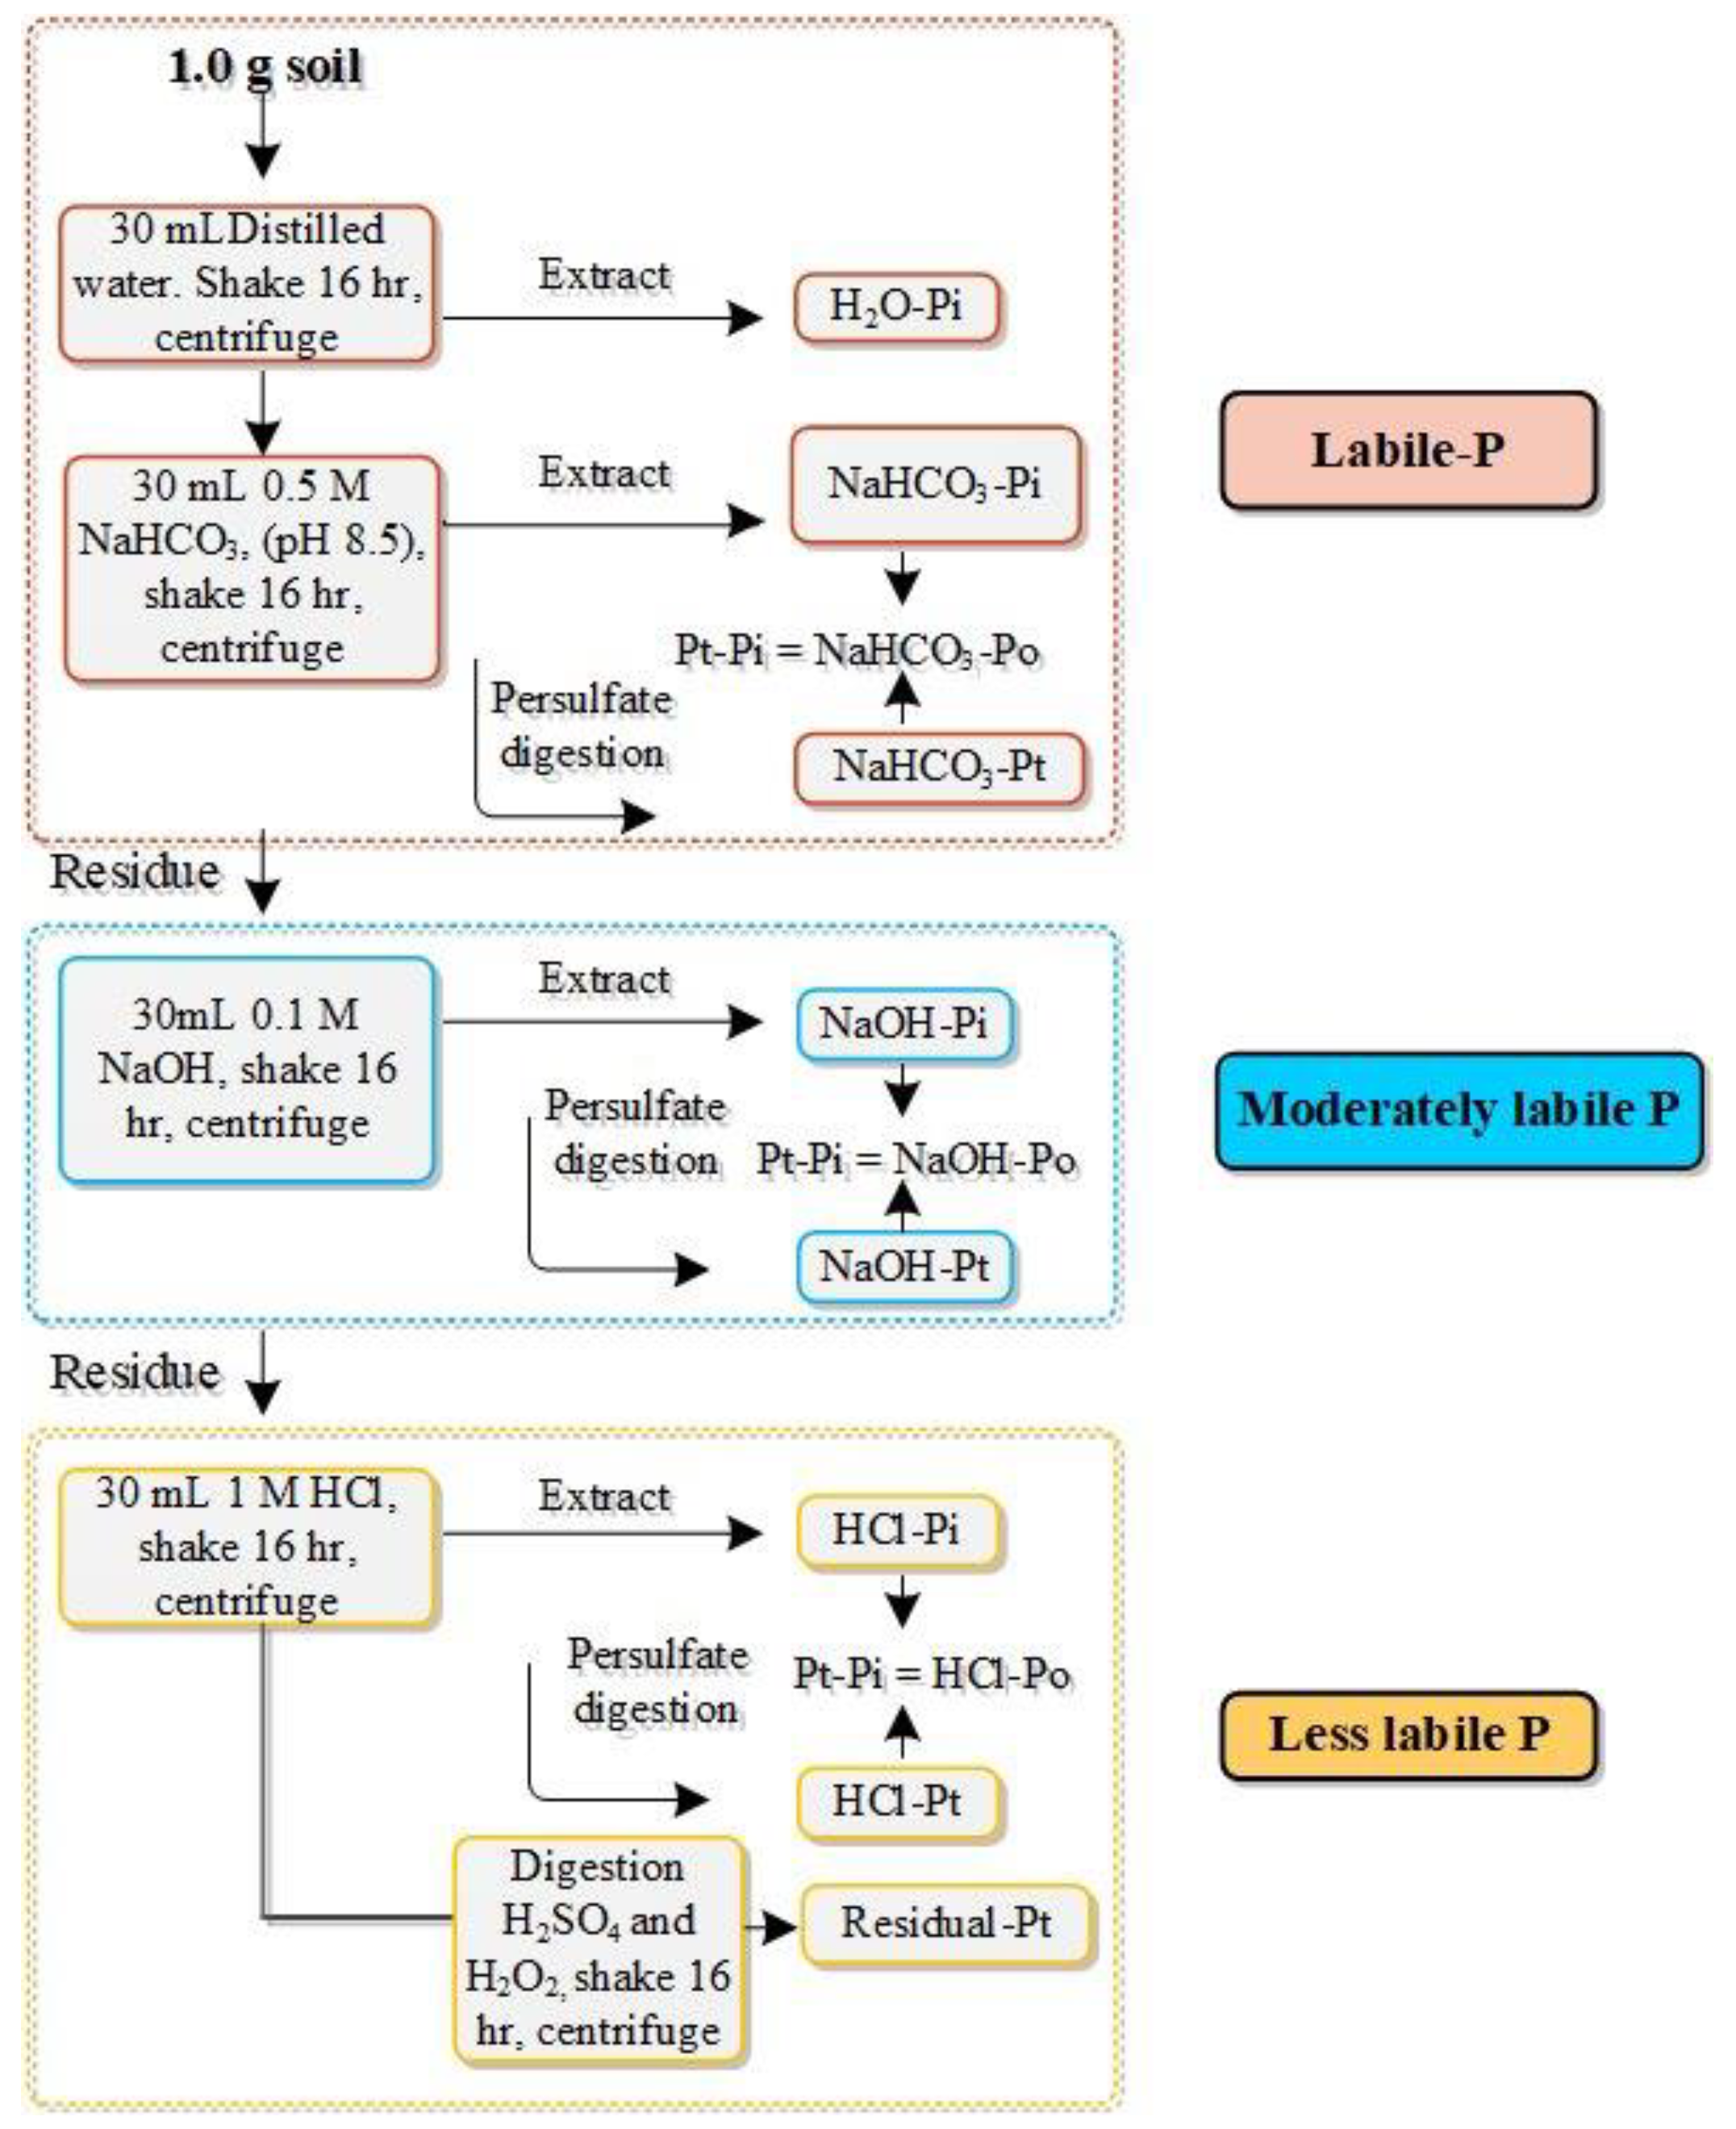
2.2. Soil Sampling and Analysis

Each year, within 15 days of the winter wheat harvest, soil in a plough layer (0–20 cm) was sampled using a 2.5 cm diameter auger. As for three pseudo-replicates, each plot was divided into three sections of equal size and then six to eight soil cores were homogenously composited into one sample for each treatment. In June 2014, we also took soil samples from a depth of 0–100 cm with a 20-cm increment as 0–20, 20–40, 40–60, 60–80, and 80–100 cm, respectively, where one composite sample was made from three soil profiles and pooled to create three composite samples for each soil layer of the four plots (CK, NPK, SNPK, and MNPK). After transporting the samples to the laboratory, the composite soil samples were mixed thoroughly, removed of all stones, roots, and undegraded fertilizer, air dried, and stored. Then, subsamples were screened until they could pass through a 1 mm for chemical analysis.
We measured the Olsen-P and CaCl2-P contents for samples taken in 2010 and 2014 that were determined via extraction of 0.5 mol L−1 NaHCO3, adjusting pH (8.5) and 0.01 mol L−1 CaCl2 solution and measuring the extract using the molybdate–ascorbic acid method [29,30].
Simultaneously, the fractionation of inorganic P (Pi) and organic P (Po) was determined via a modified sequential extraction method proposed by Tiessen and Moir [31]. With this procedure, the following fractions were obtained: (i) H2O-Pi, 0.5 M NaHCO3-Pi and Po (labile P); (ii) 0.1 M NaOH-Pi and Po (moderately labile P); and (iii) 1 M HCl-Pi and Po and residual P (less-labile P), mostly composed of stable Ca-bound P (Figure 1).
The Pi in the extractant was determined via the molybdate colorimetric method at 880 nm [29]. The content of total P (TP) in NaHCO3, NaOH, and HCl (sum of Pi and Po) was determined in a 5-mL aliquot of each extract after digestion with sulphuric acid (H2SO4) and potassium persulfate in an autoclave at 121 °C [32]. The content of TPo in alkali extract (NaHCO3-Po, NaOH-Po, and HCl-Po) was obtained via the difference between TP and Pi. The content of Po in the deionized water (H2O-P) fractions was not determined due to preliminary investigations showing value below the detection limit. In addition, P fractions were also grouped as defined by Cross and Schlesinger [33] into geochemical (Geo-P) and biological P (Bio-P) pools, where the sum of all Pi extractants (H2O-Pi + NaHCO3-Pi + NaOH-Pi + HCl-Pi) and residual P represent Geo-P and the Po extractants (NaHCO3-Po + NaOH-Po + HCl-Po) represent Bio-P.

2.3. Crop Measurements

At the maturity stage, to estimate the crop yields for each plot of the applied treatments, the crops were harvested manually with sickles to the ground surface from three areas, each measuring areas of 2 m × 4 m and 5 m × 4 m for the wheat and maize, respectively. In addition, the subsamples of grain and straw were collected and oven-dried to pass a mess sieve size of 0.5 mm, and we analyzed P concentration via digestion with concentrated H2SO4 and H2O2, determined via the molybdate colorimetric method [29].

2.4. Data Processing

Based on the content and biomass of various treatments, P uptake (grain + straw) at the maturity stage was calculated.
The relative yield was calculated via the formula described in Equation (1) [34]:
Relative   yield   ( % ) = A n n u a l   c r o p   y i e l d k g / h a o f   a   t r e t a m e n t   ( Y f ) M a x i m u m   y i e l d k g / h a   i n   t h e   y e a r   a m o n g   t h e   t r e a t m e n t   ( Y m ) × 100
P budget (Pb, kg ha−1) was estimated via the formula in Equation (2):
Pb = FP − UP,
where FP is the P input and UP is the P uptake by the crop each year, accordingly. The calculation made for the P budget was the P input minus the P uptake from 1990 to 2010 and from 1990 to 2014, respectively.
The association related to the soil P budget (x) and changes in the P fractions (y) based on linear regression follows in Equation (3):
Y = ax + b.
The two-segment linear–linear (LLP) model was applied to relate soil P fraction to Olsen-P and CaCl2-P using Equations (4) and (5):
y1 = a1x + b1, x ≤ T,
y2 = a2x + b2, x > T,
where a1 and a2 are the intercept parameters and b1 and b2 are the slope parameters. T represent the critical value of soil P fraction.
Critical soil P fraction concentrations were determined via linear plateau (LP) and quadratic plateau (QP) models to fit the relationships between relative yield and soil P fractions (labile P, moderately labile P, and less-labile P) [35]. The critical concentration (CC) determined via LP and QP models are soil P fraction values at which the linear or quadratic portions of each model joined the predicted plateau yield.

2.5. Statistical Analysis

All the values reported in the table and figures are the mean (+SD) of the measured variables. The data for each measured variable depending on fertilization were evaluated using one-way analysis of variance (ANOVA). Significant differences were performed using the LSD test at 5% significance levels. A paired t-test was applied for evaluating significant differences in various variables for the same treatment between 2010 and 2014. The above analysis was performed with SAS ver. 8.01 for Windows (SAS Institute, Cary, NJ, USA). In addition, the Nonlinear Model (PROC NLIN) procedure was applied to fit relationships between Olsen-P and soil P fractions via a two-segment linear-linear model and relationships between relative crop yield and soil P fractions via LP and QP models using Sigma plot 12.5. In order to make the figures more transparent, the error bar was not included in the figures except for showing P fraction contents in the soil profile.

3. Results

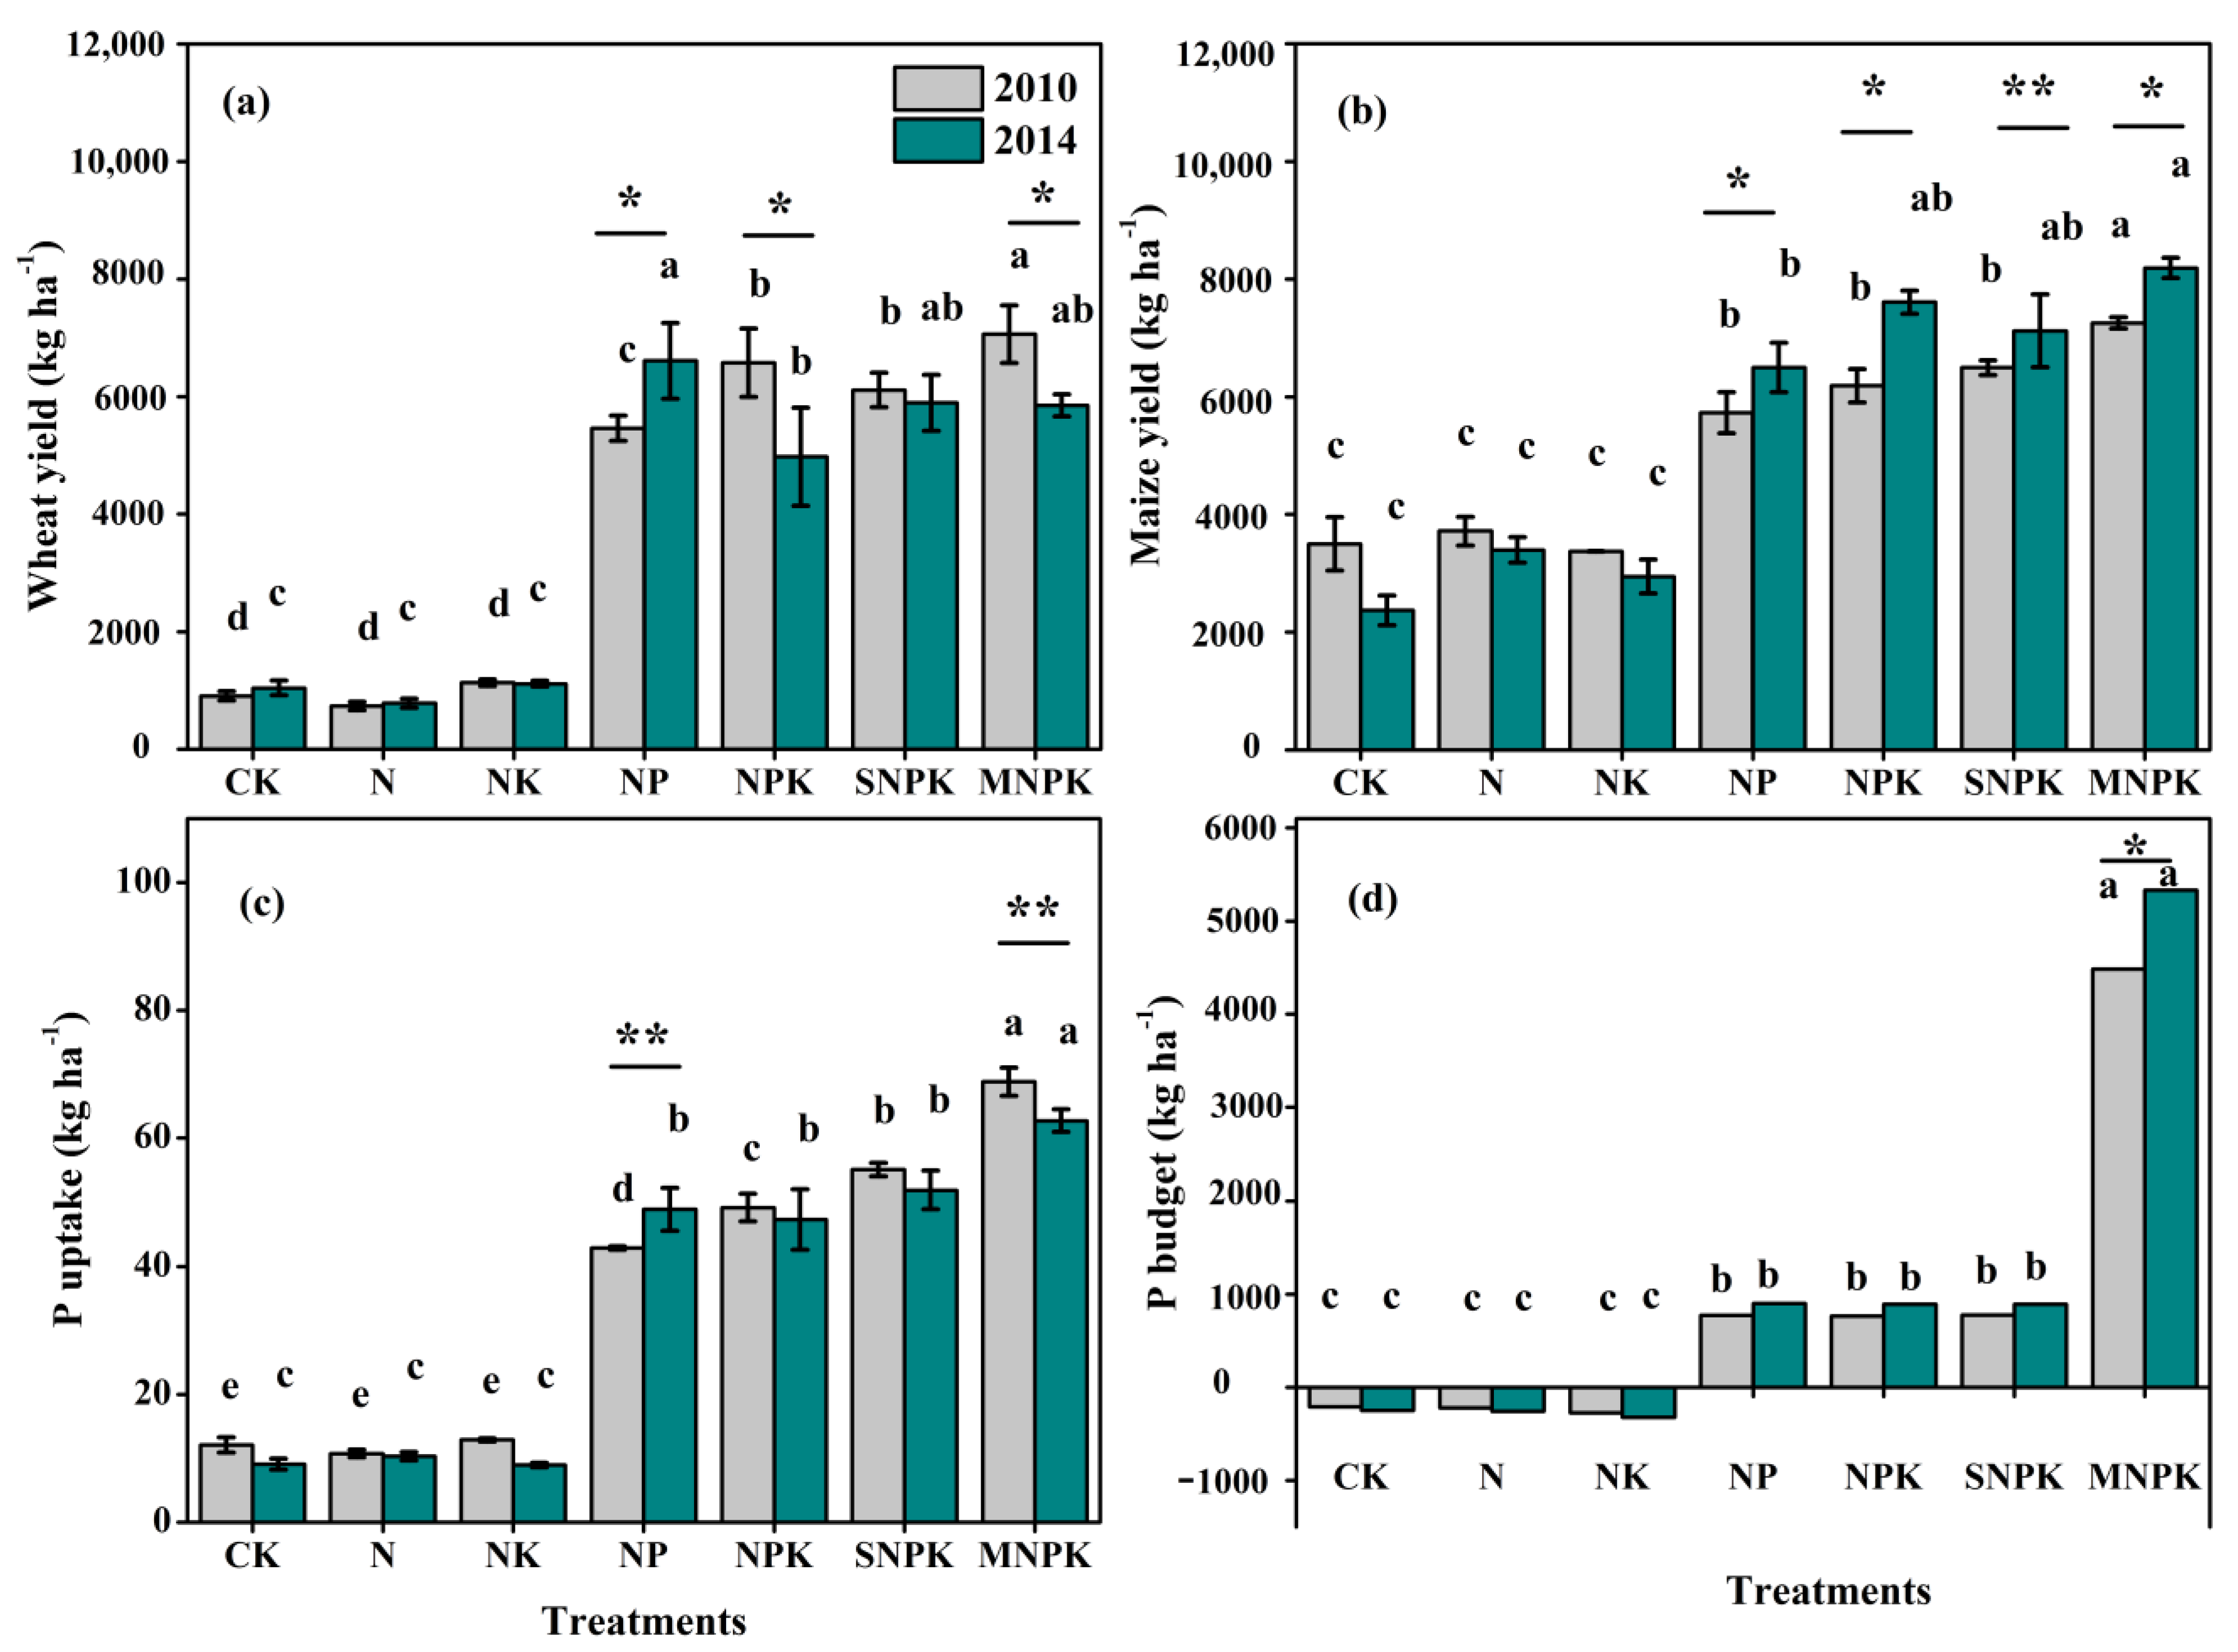
3.1. Crop Yield, P Uptake, and P Budget

The effects of long-term fertilization on crop yield, P uptake, and P budget determined in 2010 and 2014 are shown in Figure 2. The average grain yield of winter wheat and summer maize under P-fertilized treatments significantly differed between 2010 and 2014 (Figure 2a,b), and P uptake under NP and MNPK treatments also showed significant differences between the two years (Figure 2c). However, the P budget was similar between the two years for all the applied treatments (Figure 2d).
The average grain yield of winter wheat and summer maize varied from 733 to 7061 kg ha−1 and 3373 to 7254 kg ha−1 in 2010 and from 780 to 5894 kg ha−1 and 2372 to 8187 kg ha−1 in 2014. Long-term P-containing fertilization significantly increased winter wheat and summer maize yield in 2010 and 2014 over the P-omitted treatments (Figure 2a,b).
The amount of P uptake in the CK, N, NK, NP, NPK, SNPK, and MNPK treatments was 11.8, 10.4, 12.4, 42.3, 47.8, 53.3, and 67.9 kg ha−1 in 2010 and 9.1, 10.3, 9.0, 49.0, 47.3, 52.3, and 60.8 kg ha−1 in 2014, respectively (Figure 2c). The annual P uptake by the crops was significantly greater in the treatment with P fertilizer added than in the P-omitted or CK treatments. In addition, there were variations in annual P uptake between NP, NPK, and SNPK treatments in the two years tested (Figure 2c).
Long-term P-applied treatments significantly affected the soil P budget in 2010 and 2014 (Figure 2d). The P budget in MNPK (4484 and 5333 kg ha−1) was significantly greater than those in NP (774 and 903 kg ha−1), NPK (767 and 893 kg ha−1), and SNPK (778 and 891 kg ha−1) treatments.

3.2. Phosphorus Fraction at Surface Soil Layer

Compared with CK and P-omitted treatments, P fertilization practices significantly increased the contents of soil P fractions at the surface soil layer (0–20 cm), especially in MNPK treatment in both years (Table 2). The contents of Pi in the labile P, moderately labile P, and less-labile P under P fertilization practices significantly increased by 36–117, 23–41, and 456–784 mg kg−1, respectively, relative to CK and P-omitted treatments in 2010 (Table 2). The contents of Po fractions also increased by 15–38, 29–45, and 42–155 mg kg−1, respectively.
A similar trend was also found among the treatments determined in 2014. In the P input treatments, soil Pi contents for the labile P, moderately labile P, and less-labile P increased in the ranges of 42–155, 34–65, and 493–1155 mg kg−1, respectively, compared to the CK and P-omitted treatments (Table 2). Likewise, soil Po contents raised in the ranges of 37–72, 95–159, and 142–169 mg kg−1 for the labile P, moderately labile P, and less-labile P, respectively.

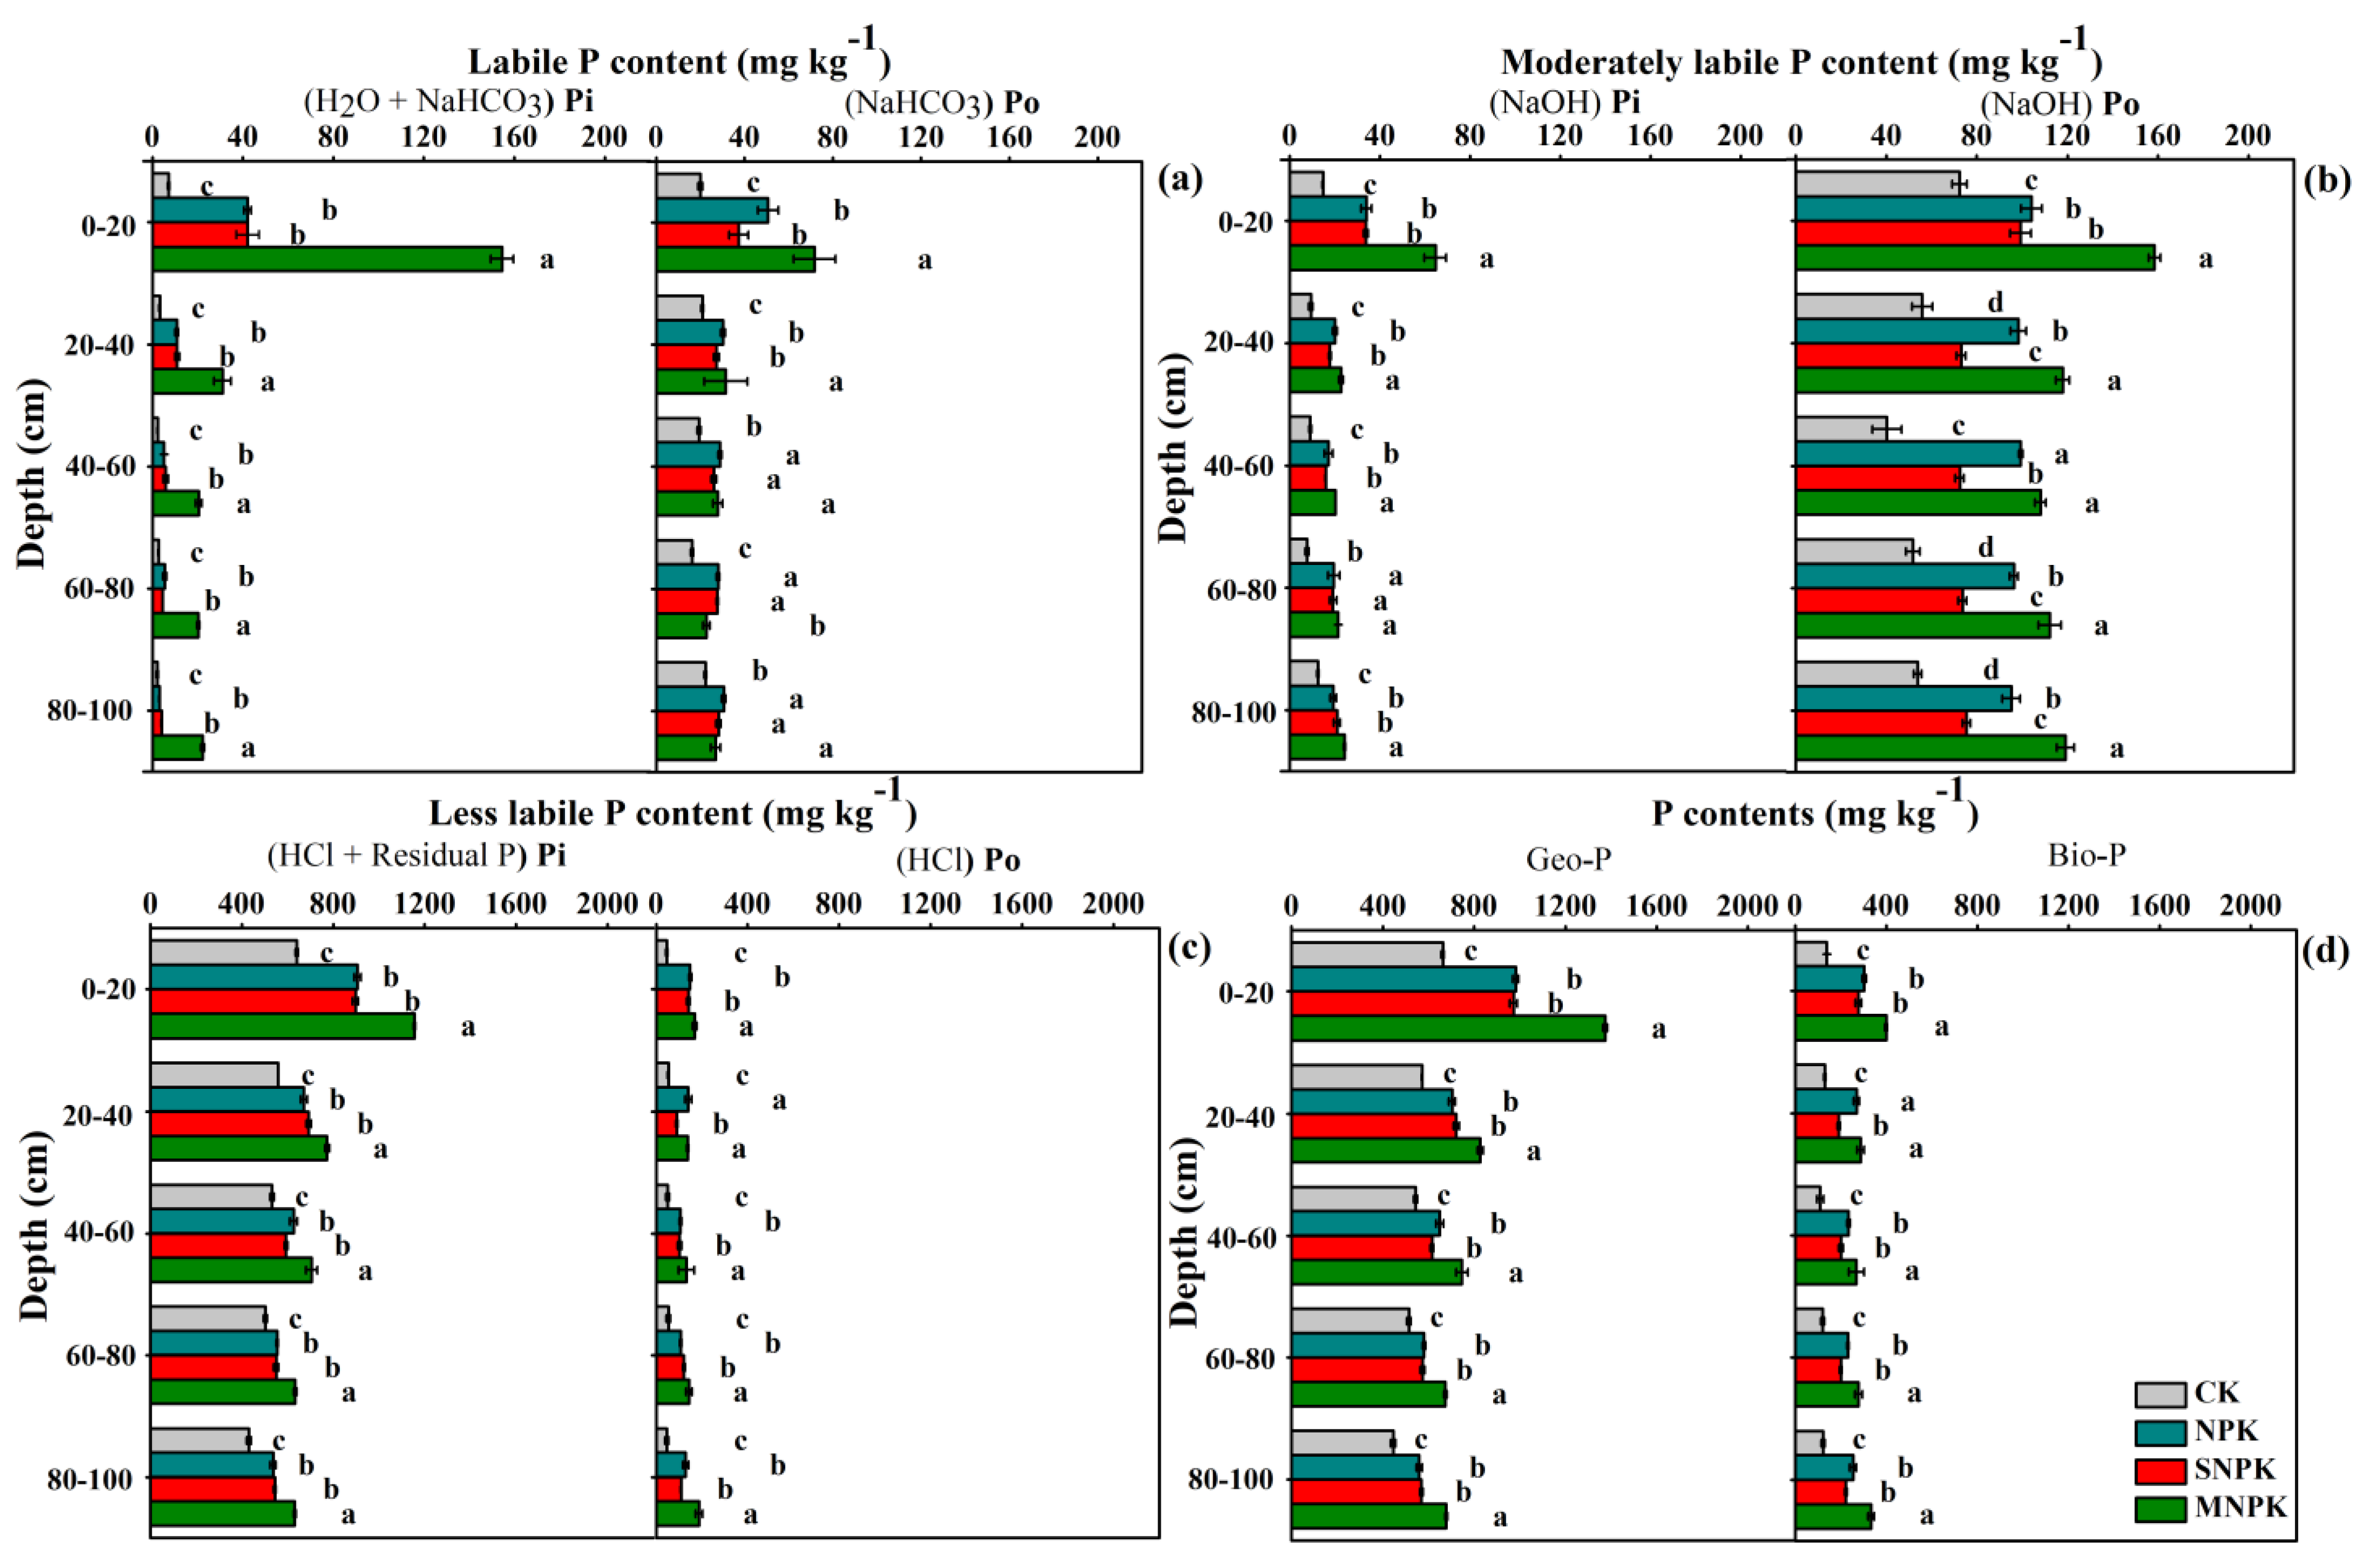
3.3. Phosphorus Fractions in the Soil Profile

The content and proportion of labile P (Pi and Po) in fertilization treatments significantly increased relative to CK in NPK, SNPK, and MNPK treatments at surface layer (Figure 3a and Figure S1a). In the subsoils, fertilization treatment under NPK, SNPK, and MNPK had statistically similar values of labile Po content at depths of 40–60 cm and 80–100 cm (Figure 3a). While the MNPK treatment had a significantly higher content of labile P at depths of 20–100 cm over CK.
In addition, fertilization treatments also significantly increased the content and proportion of moderately labile P (Pi and Po) in the whole profile relative to the CK (Figure 3b and Figure S1a). Moreover, significant differences in moderately labile P content were also observed between MNPK, NPK, and SNPK treatments except for moderately labile Pi at 60−80 cm depth (Figure 3b).
The Pi and Po components of less-labile P in P fertilizer treatment significantly increased compared to the CK treatment (Figure 2c), but their proportions to the TP decreased (Figure S1a) at whole soil profile (0–100 cm). In addition, the differences observed in less-labile P content between MNPK, NPK, and SNPK treatments were also significant in the whole soil profile, where the MNPK presented the highest value.
The contents of Geo-P and Bio-P obtained in the P input treatments were significantly higher than those in the CK treatment in the whole soil profile (Figure 3d). Furthermore, Geo-P and Bio-P contents under MNPK were obviously greater than those under NPK and SNPK treatments. Compared with CK, the proportion of Bio-P increased in the fertilization treatments, but the proportion of Geo-P decreased in the soil profile (Figure S1b).
Compared with CK, the content and proportion of Bio-P increased in the fertilization treatments, but the proportion decreased in Geo-P in the soil profile (0–100 cm) (Figure 3d and Figure S1b). Among the treatments, the contents of Geo-P and Bio-P obtained in the P fertilizer application were significantly higher than in the CK treatment in the soil depth of 0–100 cm, especially in the MNPK treatment (Figure 3d). In addition, a significant increasing trend in the Geo-P and Bio-P content under MNPK was also observed compared to the NPK and SNPK treatments. However, there were no differences between NPK and SNPK treatments with respect to the soil profile, except for the Bio-P in the 20–40 cm depth.

3.4. Relationships among Soil Olsen-P, CaCl2-P, and P Fractions

The relationships between Olsen-P and P fractions were well-fitted by the two-segment linear–linear model (Table 3). The change-points were 93, 85, and 635 mg kg−1 for labile P, moderately labile P, and less-labile P, respectively. Above the thresholds, soil Olsen-P sharply increased with increasing contents of labile P, moderately labile P, and less-labile P. Similarly, the association between CaCl2-P and P fractions was explained by using the two-segment linear–linear model, where the change-points for labile P, moderately labile P, and less-labile P contents were 99 mg kg−1, 70 mg kg−1, and 474 mg kg−1, respectively (Table 3).

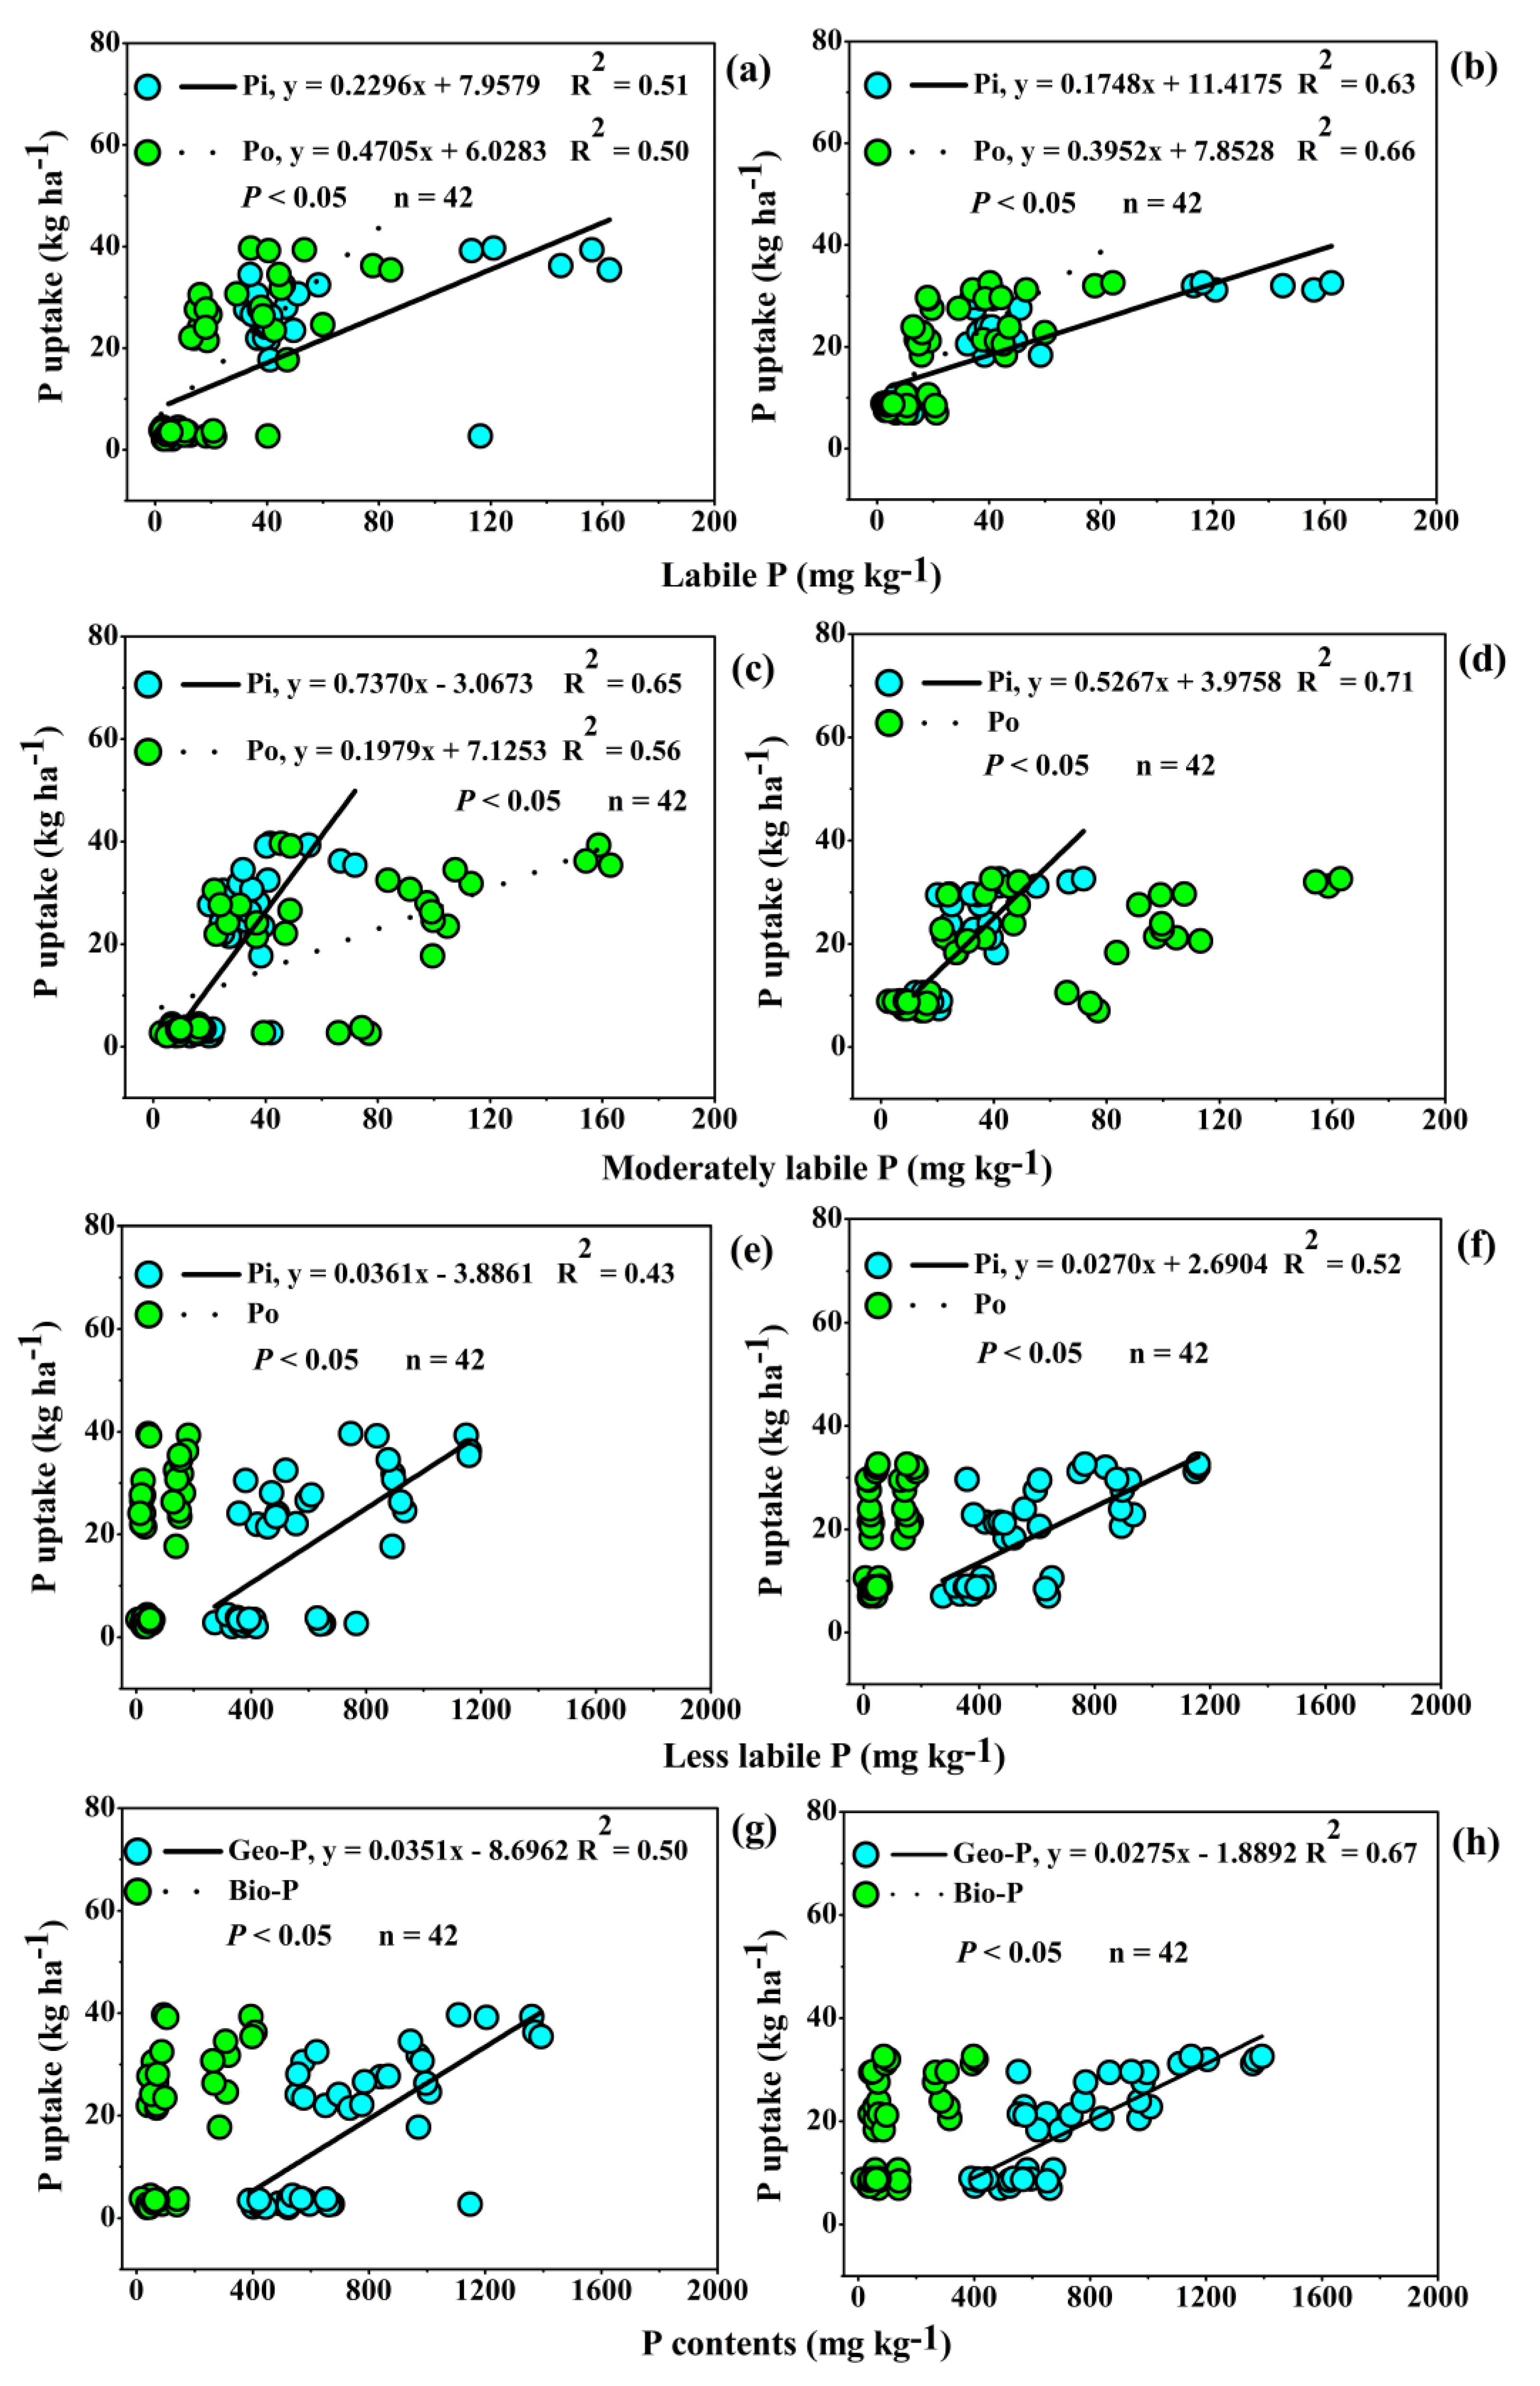
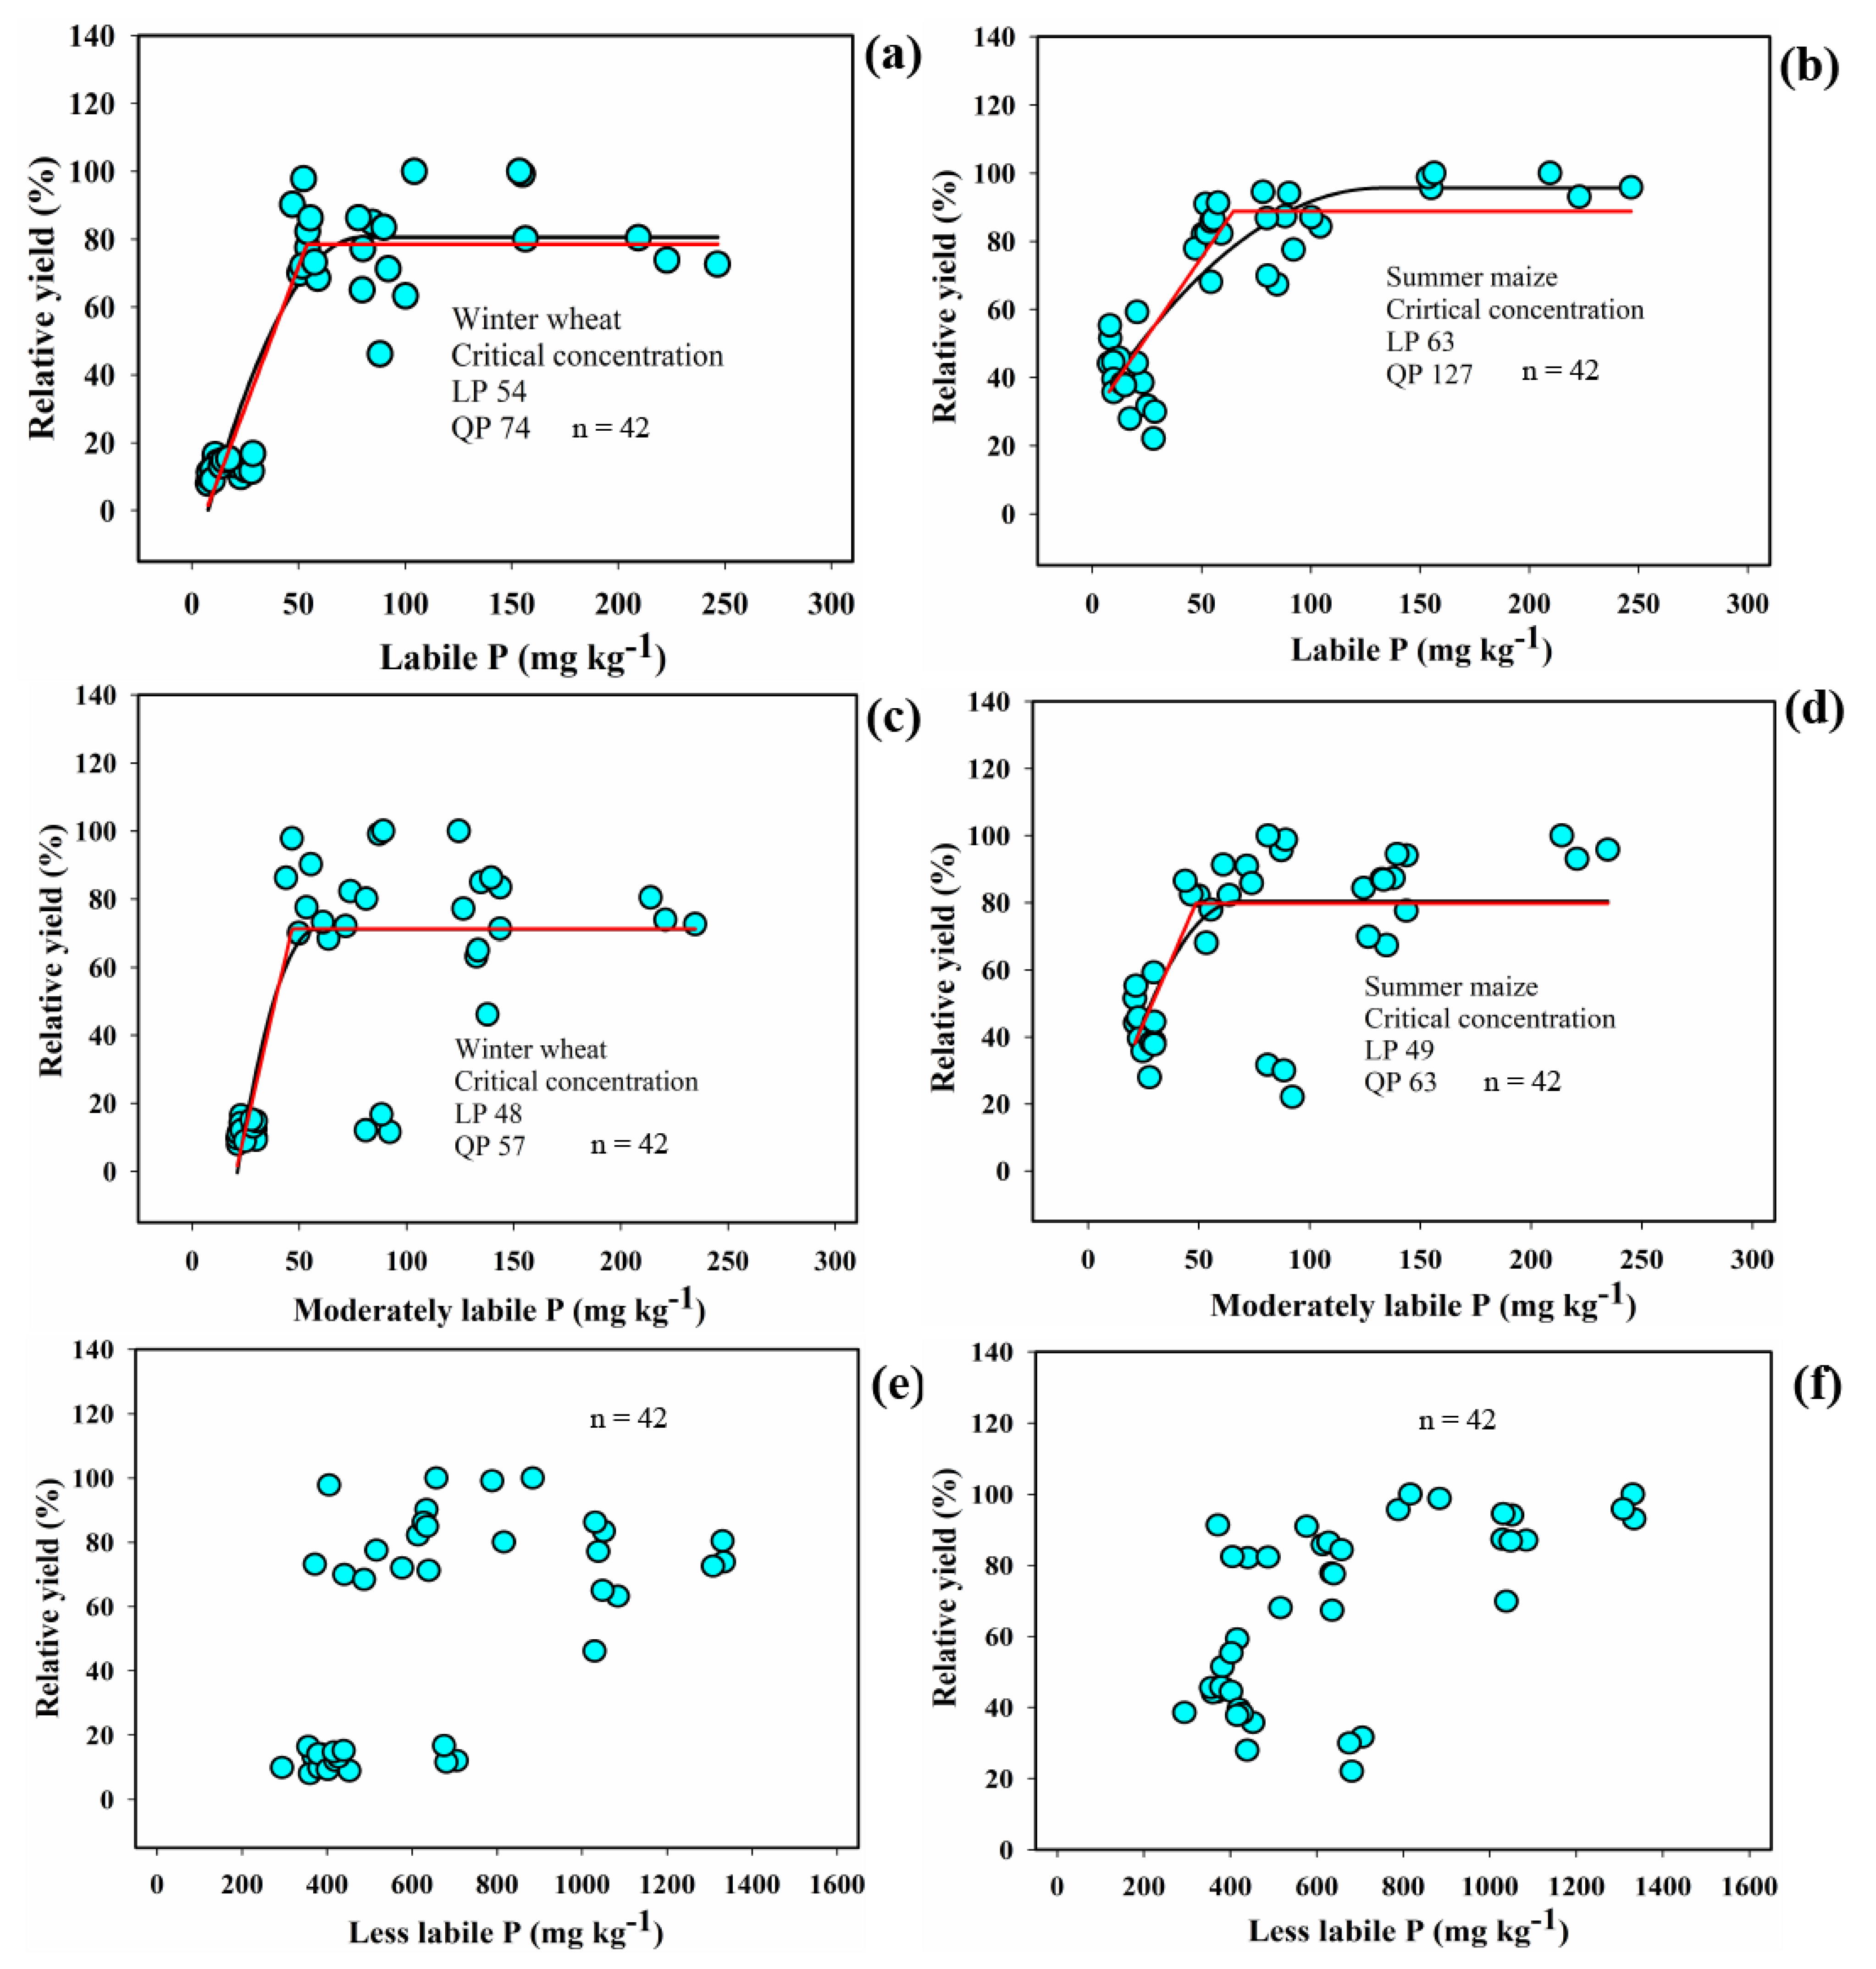
3.5. Relationship between P Uptake, Crop Yield, and P Fractions

Regression analysis between P uptake by wheat and the Pi and Po components of labile P and moderately labile P showed significant linear relationships (Figure 4a,c). There were also significant and positive correlations between P uptake by the wheat crop and less-labile Pi and Geo-P fractions (Figure 4e,g). In addition, the Pi component of labile P, moderately labile P, less-labile P, and the Geo-P fraction also showed a significant relationship with the P uptake of maize crop (Figure 4b,d,f,h). Moreover, the association between P uptake by summer maize and the labile Po fraction was also markedly and positively correlated (Figure 4b).
The critical contents of labile P defined by the LP and QP models were 54 and 74 mg kg−1 for winter wheat and 63 and 127 mg kg−1 for summer maize, respectively, to achieve high yield (Figure 5a,b, Table 4). Similarly, the mean critical contents of moderately labile P were 48 and 57 mg kg−1 for wheat (Figure 5c) and 49 and 63 mg kg−1 for maize (Figure 5d). As expected, there was no significant correlation between less-labile P fractions and crop yield (Figure 5e,f).

4. Discussion

4.1. Crop Yield, P Uptake, and Critical Soil P Content

Fertilization is an essential agronomic measure that can promote growth and enhance the production and quality of crops. This study demonstrated that following 24 years of contrasting fertilization, mean wheat and maize yields differed significantly (Figure 2a,b), and the highest yield was measured in the MNPK treatment. Our results agree with the findings of other individual studies and meta-analyses conducted in different environmental conditions and agricultural systems [36,37]. This might be attributed to the effect of higher levels of soil organic matter (SOM) gained under the input of inorganic fertilizer together with organic manure, which greatly improves the soil environment (i.e., its physical, chemical, and biological properties) and provides a stable supply of both macro- and micronutrients [38] and thus benefits crop growth [39]. In addition, the increasing trends in crop yield under NP, NPK, and SNPK treatments were also observed compared with CK and P-omitted treatments, indicating that N and P are essential nutrients for crop production in the tested soil. Straw incorporation also helped to improve the SOM content, soil structure, and biological environment of the soil; these positive effects favored crop yield [40].
Linear regression revealed that the soil Pi components of labile P and moderately labile P were positively related to the plant P uptake of both wheat and maize crops (Figure 4), which emphasizes the significance of these P fractions on P consumption and plant development. This is also in agreement with the results of previous researchers [41,42]. Our result also found that the degree of correlation with respect of P uptake was highest with moderately labile Pi (R2 = 0.65–0.71 (Figure 4c,d), indicating that Fe-P- and Al-P-associated P (being P extracted by 0.1 M NaOH) were the important forms of Pi and contributed mainly towards the P uptake in calcareous soils [43]. Moreover, less labile Pi is assumed to be of low availability to plants, although it was found to be significantly correlated with the P uptake of wheat and maize crop (Figure 4e), indicating that particulate organic matter might be responsible for the P fraction, which is easily bioavailable but not alkali extractable, likely observed by many authors [44]. Related to Po fractions, P uptake by wheat crops was also significantly associated with labile and moderately labile P (Figure 4a,c), suggesting that these components may play a vital role in contributing to wheat P uptake. This behavior has been previously reported by many authors [45,46]; for example, Wang et al. [46] suggested a possible mechanism by which straw returning promotes P uptake by modifying the soil microbial biomass C and P cycles, which ultimately increased the NaHCO3-Po and NaOH-Po components. Furthermore, P uptake by maize with the labile Po also showed a linear relationship (Figure 4b), suggesting that it serves as a useful index by which to predict potential Po mineralization, which is susceptible to crop management practices following long-term P fertilizer application because mineralization of Po fractions during the growing season of the crop was expected to be an important [47].
To recommend the use of P fertilizer, the interaction between relative crop yield and soil-available P measured via various soil test methods has been assessed [48]. Among the various soil P assays recommended [49], Olsen-P is the most common and widespread available soil-P index in China that gave good results for both acidic and alkaline soils [34,50]. Apart from this, soil P fractions showed a promising result for improving the diagnosis of P soil fertility based on measuring both the Pi and Po sources of available P for crops [51]. In the soil tested here, critical concentrations of labile P and moderately labile P defined by the LP model were 54 and 48 mg kg−1 for winter wheat yield and 63 and 49 mg kg−1 for summer maize, where these values were lower than those defined by the QP model (Figure 5). The R2 values of regression for the LP model were higher than those for the QP model (Table 4), indicating that the former might be a better recommendation regarding P fertilization when soil legacy P is relatively high. In comparison with our results, the reported change points obtained from P indices of labile Pi and Po with maize and soybean yield ranged from 8.0 to 39.5 mg kg−1 in a wide agricultural region of Argentina [51,52]. Certainly, the critical P values observed in different studies for different crops depend on several factors such as soil condition, sampling depths [18], rainfall [53], and the statistical model employed [48]. Our result proposed the Pi and Po fraction jointly in a new soil-test P that showed a better fit with respect to wheat and maize relative yield, which improved the prediction of the wheat and maize response to P fertilization compared to the Pi or Po fractions alone, as has been previously suggested by Appelhans et al. [52] for maize crop. Nevertheless, it should be acknowledged that Po is a prospective P source for crops, which may undergo a mineralization process during the growing season [51], and its impact on the availability of P is contingent upon the presence of favorable environmental conditions for P mineralization [54]. Dodd and Mallarino [22] and Mallarino and Atia [55] have discussed the implications of these differences for fertilizer recommendations and the profitability of fertilization. Our results imply that the recommendation of P fertilizer may need to take both Pi and Po into consideration in soils rich in organic P to avoid the likely underestimation of soil-available P, i.e. those estimated with simple methods like Olsen P, thereby reducing P overuse and potential P losses to environment. In this sense, our results may provide impetus for the improvement of the soil P test method to make it more accurate under the circumstances mentioned above.

4.2. Soil P Transformation and Migration

Our result revealed that long-term P fertilization in the topsoil was preferentially accumulated in the labile and moderately labile Pi and Po pools relative to the CK, particularly in MNPK treatment (Table 2). The substantial increase in soil Pi following the application of chemical P fertilizer with organic manure has been confirmed by numerous studies [7,56]. This is ascribed to that the addition of organic substances increasing the soil P bioavailability by increasing the organic matter mineralization and exchangeable organic ions with layered silicate hydroxylation surface ligands [57], which, in turn, improves the release of Pi in the surface soil [2,7]. At the same time, applying organic manures could increase the level of SOC, which may drive soil microbes to allocate energy from catabolic labile C to synthesizing soil phosphatase and suppress mineralization processes [57], thereby favoring Po fractions in the soil (Table 2). Po cycling through the mineralization process via enzymes and soil microbes plays an important role in increasing soil P accumulation, which is the ultimate source of soil-available P [58]. In addition, the transformation of P in the less labile P was more obvious, possibly regulated by oxalic acid due to the formation of high Ca-associated P and dissolved phosphate P in calcareous soil [59], which tended to build up due to their transformation from other fractions and became fixed as a stable P over time after long-term P fertilizer coupled with organic manures.
Our results also displayed that the long-term P fertilizer input resulted in a substantial surplus of the P budget and profoundly affected the transformation of the P fraction in the soil profile (Figure S2). Studies involving long-term fertilization experiments across the globe have shown that with a P surplus of 100 kg ha−1 yr−1, soil Olsen-P increased significantly, varying from 1.4 to 7.3 mg kg−1 yr−1 in China [60,61], India [62], and southwestern France [63]. In our study, for instance, per 100 kg ha−1 P accumulated in the soil, the content of labile P and moderately labile P fractions greatly increased by 9.2 and 13.4 mg kg−1, respectively, in the surface soil (Figure S2). We also found that labile P beyond 93 mg kg−1 and moderately labile P beyond 85 mg kg−1 could directly transformed into soil Olsen-P, which agreed with the findings of other [19]. The variation in P transformation can be attributed to influencing factors like crop systems, soil characteristics, and P extraction methods [64]. But the P transfers between the surface layer and lower layers and the P uptake by plant roots from the soil layers after long-term P fertilization and the cropping system might also influence the results [65]. In addition, P transformed from a labile form to a less-labile form may depend on the availability of sorption sites [2,66]. In this study, with the application of P fertilizer, the transfer of Pi fractions through the soil profile (0–100 cm) differed markedly in the various fractions, including labile P, moderately labile P, less-labile P, and Geo-P (Figure 3), indicating that soil Pi transformation could be accelerated by P fertilization in cropland soil. The results of our study are consistent with those of previous studies tested in calcareous soil [4] and other soil types [15,67]. The observed substantial increase in the Pi forms of labile P and moderately labile P can be attributed to the discharge of the fast-acting components of chemical P fertilizer, which instantly transformed the available Pi fraction [2,64]. There is some evidence to suggest that organic anion and acid chemical fertilizer coupled with organic manures reduces the soil P sorption strength of mineral soil particles via competing organic molecules with orthophosphate for P retention sites [68], encouraging soil-stable P dissolution through the secretion of organic acids and mediating soil Po transformation via SOC and microorganisms, leading to the rise of labile-P and moderately labile Pi in the soil [68,69]. All Po fractions in the soil profile were significantly increased with P fertilization application, especially in MNPK (Figure 3). There might be several reasons: (1) direct input of Po forms contained in the organic manures, which led to greater activation of soil P; and (2) encouraging the enzyme synthesis and development of microorganisms [68], thereby facilitating the transformation of soil Pi into Po pools, especially noted in the moderately labile Po fraction (Figure 3b), which is primarily composed of monoester phosphates and most likely derived from the formation of Fe-P complexes with humic substances, thereby supplying labile P for a longer period of time [70,71]. A direct relationship between the Po and SOC has also been confirmed by many previous studies [69], suggesting a lead role in the buildup of moderately labile P in the soil profile. The lower pH in the study site [72] in MNPK might be expected to promote the solubility of CaCO3 and could possibly induce the leaching loss of Ca ions, which could contribute to P transformation and release in the alkaline soil [5]. Furthermore, we also found that the average proportion of labile P and moderately labile P increased with P fertilization in the 0–100 cm soil profile compared with CK, accounting for about 4–13% and 11–14% of the TP, respectively (Figure S1), but that of the less-labile P fraction decreased after P fertilization. This result may be attributed to organic molecules released via the microbial decomposition of organic matter, which hindered the complexation of P with iron, aluminum, and calcium in soil [73] and therefore substantially promoted the transformation of inactive P into moderately labile and labile P pools over the time [74].
To assess the probability risk of P losses, an analysis of the relationship between Olsen-P and CaCl2-P was previously undertaken in various soils. Whereas information about the relationships between labile or moderately labile P and CaCl2-P have not been reported, in the present study, CaCl2-P content increased dramatically with contents of labile P and moderately labile P beyond 70 mg kg−1 and 99 mg kg−1 (Table 3), which equaled the P budget of 153.0 kg ha−1. This would provide useful information for optimizing the P supply and minimizing the P losses as reported by others [2,3].

5. Conclusions

Present study demonstrated that winter wheat–summer maize cropping systems could deliver high yield when the labile P and moderately labile P reach 54 and 48 mg kg−1 for wheat and 63 and 49 mg kg−1 for maize at topsoil. Additionally, long-term excessive P fertilization significantly promoted P transformation, as demonstrated by soil P accumulation in the soil profile, as well as an increase in the proportions of labile P and moderately labile P and a decrease in the proportion of non-labile P. When labile P and moderately labile P contents were above 99 and 70 mg kg−1 or 153 kg P·ha−1, P leaching loss would significantly increase. Our results could help plan sustainable P management by considering both inorganic and organic soil P sources to ensure crop yield and environmental security in agroecosystems.

Supplementary Materials

The following supporting information can be downloaded at: https://www.mdpi.com/article/10.3390/agronomy13123072/s1, Figure S1: The relative contribution of various soil phosphorus pools to total P; Figure S2: Relationships between P budget (kg ha−1) and inorganic and organic P components of P fraction contents at surface (0–20 cm) layer (mg kg−1); Table S1: Soil physio-chemical properties (mean ± SD) measured in different fertilization treatments under the Winter wheat–summer maize cropping systems at 0−20 cm depth.

Author Contributions

Conceptualization, A.K., S.Z. and X.Y.; methodology, A.K. and S.Z.; software, A.K.; validation, A.K., S.Z. and X.Y.; resources and data curation, S.Z. and X.Y.; writing—original draft preparation, A.K. writing—review and editing, A.K., S.Z., X.Y., B.S. and B.H.; supervision, S.Z.; funding acquisition, S.Z. and X.Y.; Project administration, X.Y. All authors have read and agreed to the published version of the manuscript.

Funding

This study was supported financially by the Special funds for the operation and maintenance of scientific research facilities of Ministry of Agriculture and Rural Affairs of P.R. China (G2023-07-2) and Shaanxi Provincial Field Scientific Observation and Research Station on Loessial Soil in Yangling.

Data Availability Statement

Data can be made available from the corresponding author upon reasonable request.

Acknowledgments

We are grateful to all colleagues for their great efforts on the running and setting up of the long-term trials.

Conflicts of Interest

The authors declare no conflict of interest.

References

  1. Tian, X.Y.; Engel, B.A.; Qian, H.Y.; Hua, E.; Sun, S.K.; Wang, Y.B. Will reaching the maximum achievable yield potential meet future global food demand? J. Clean. Prod. 2021, 294, 126285. [Google Scholar] [CrossRef]
  2. Chen, X.; Yan, X.; Wang, M.; Cai, Y.; Weng, X.; Su, D.; Guo, J.; Wang, W.; Hou, Y.; Ye, D.; et al. Long-term excessive phosphorus fertilization alters soil phosphorus fractions in the acidic soil of pomelo orchards. Soil Till. Res. 2022, 215, 105214. [Google Scholar] [CrossRef]
  3. Yan, X.J.; Yang, W.H.; Chen, X.H.; Wang, M.K.; Wang, W.Q.; Ye, D.L.; Wu, L.Q. Soil phosphorus pools, bioavailability and environmental risk in response to the phosphorus supply in the red soil of Southern China. Int. J. Environ. Res. Public Health. 2020, 17, 7384. [Google Scholar] [CrossRef]
  4. Pizzeghello, D.; Berti, A.; Nardi, S.; Morari, F. Relationship between soil test phosphorus and phosphorus release to solution in three soils after long-term mineral and manure application. Agric. Ecosyst. Environ. 2016, 233, 214–223. [Google Scholar] [CrossRef]
  5. Yan, Z.; Chen, S.; Biswanath, D.; Debjani, S.; Chen, Q. Phosphorus transformation response to soil properties changes induced by manure application in a calcareous soil. Geoderma 2018, 322, 163–171. [Google Scholar] [CrossRef]
  6. Zhang, W.; Zhang, Y.; An, Y.; Chen, X. Phosphorus fractionation related to environmental risks resulting from intensive vegetable cropping and fertilization in a subtropical region. Environm. Pollut. 2021, 269, 116098. [Google Scholar] [CrossRef]
  7. Yan, X.; Wei, Z.; Hong, Q.; Lu, Z.; Wu, J. Phosphorus fractions and sorption characteristics in a subtropical paddy soil as influenced by fertilizer sources. Geoderma 2017, 295, 80–85. [Google Scholar] [CrossRef]
  8. Lu, R.K. Soil and Agro-Chemistry Analytical Methods; China Agricultural Science and Technology Press: Beijing, China, 1999; Volume 29, pp. 166–185. (In Chinese) [Google Scholar]
  9. Shen, Y.; Duan, Y.; McLaughlin, N.; Huang, S.; Guo, D.; Xu, M. Phosphorus desorption from calcareous soils with different initial Olsen-P levels and relation to phosphate fractions. J. Soils Sediments 2019, 19, 2997–3007. [Google Scholar] [CrossRef]
  10. Luo, G.W.; Ling, N.; Nannipieri, P.; Chen, H.; Raza, W.; Wang, M.; Guo, S.W.; Shen, Q.R. Long-term fertilization regimes affect the composition of the alkaline phosphomonoesterase encoding microbial community of a vertisol and its derivative soil fractions. Biol. Fertil. Soils 2017, 53, 375–388. [Google Scholar] [CrossRef]
  11. Xie, L.H.; Lv, J.L.; Zhang, Y.P.; Liu, X.W.; Liu, L.H. Influence of long-term fertilization on phosphorus fertility of calcareous soil II. Inorganic and organic phosphorus. Chin. J. Appl. Ecol. 2004, 15, 790–794. (In Chinese) [Google Scholar]
  12. Liu, J.; Li, C.Y.; Xing, Y.W.; Wang, Y.; Xue, Y.L.; Wang, C.R.; Dang, T.H. Effects of long-term fertilization on soil organic phosphorus fractions and wheat yield in farmland of Loess Plateau. Chin. J. Appl. Ecol. 2020, 31, 157–164. (In Chinese) [Google Scholar]
  13. Aulakh, M.S.; Kabba, B.S.; Baddesha, H.S.; Bahl, G.S.; Gill, M.P.S. Crop yields and phosphorus fertilizer transformations after 25 years of applications to a subtropical soil under groundnut-based cropping systems. Field Crops Res. 2003, 83, 283–296. [Google Scholar] [CrossRef]
  14. Zhu, X.; Fang, X.; Wang, L.; Xiang, W.; Alharbi, H.A.; Lei, P.; Kuzyakov, Y. Regulation of soil phosphorus availability and composition during forest succession in subtropics. For. Ecol. Manag. 2021, 502, 119706. [Google Scholar] [CrossRef]
  15. Tian, J.; Boitt, G.; Black, A.; Wakelin, S.; Condron, L.M.; Chen, L. Accumulation and distribution of phosphorus in the soil profile under fertilized grazed pasture. Agric. Ecosyst. Environ. 2017, 239, 228–235. [Google Scholar] [CrossRef]
  16. Liu, X.; Bi, Q.; Qiu, L.; Li, K.; Yang, X.; Lin, X. Increased risk of phosphorus and metal leaching from paddy soils after excessive manure application: Insights from a mesocosm study. Sci. Total Environ. 2019, 666, 778–785. [Google Scholar] [CrossRef] [PubMed]
  17. Qiong, W.; Qin, Z.; Zhang, W.; Chen, Y.; Zhu, P.; Peng, C.; Wang, L.P.; Zhang, S.; Gilles, C. Effect of long-term fertilization on phosphorus fractions in different soil layers and their quantitative relationships with soil properties. J. Integr. Agric. 2022, 21, 2720–2733. [Google Scholar] [CrossRef]
  18. Johnston, A.E.; Poulton, P.R.; White, R.P. Plant-available soil phosphorus. Part II: The response of arable crops to Olsen P on a sandy clay loam and a silty clay loam. Soil Use Manag. 2013, 29, 12–21. [Google Scholar] [CrossRef]
  19. Hua, K.; Zhang, W.; Guo, Z.; Wang, D.; Oenema, O. Evaluating crop response and environmental impact of the accumulation of phosphorus due to long-term manuring of vertisol soil in northern China. Agric. Ecosyst. Environ. 2015, 219, 101–110. [Google Scholar] [CrossRef]
  20. Manschadi, A.M.; Kaul, H.P.; Vollmann, J.; Eitzinger, J.; Wenzel, W. Reprint of Developing phosphorus-efficient crop varieties—An interdisciplinary research framework. Field Crops Res. 2014, 165, 49–60. [Google Scholar] [CrossRef]
  21. Wang, R.; Guo, S.; Li, N.; Li, R.; Zhang, Y.; Jiang, J.; Wang, Z.; Liu, Q.; Wu, D.; Sun, Q. Phosphorus accumulation and sorption in calcareous soil under long-term fertilization. PLoS ONE 2015, 10, e0135160. [Google Scholar] [CrossRef]
  22. Dodd, J.R.; Mallarino, A.P. Soil-test phosphorus and crop grain yield responses to long-term phosphorus fertilization for corn-soybean rotations. Soil Sci. Soc. Am. J. 2005, 69, 1118–1128. [Google Scholar] [CrossRef]
  23. Steinfurth, K.; Hirte, J.; Morel, C.; Buczko, U. Conversion equations between Olsen-P and other methods used to assess plant available soil phosphorus in Europe—A review. Geoderma 2021, 401, 115339. [Google Scholar] [CrossRef]
  24. Appelhans, S.C.; Ricardo, J.M.; Pedro, A.B.; Leonardo, E.N. Assessing Organic Phosphorus Contributions for Predicting Soybean Response to fertilization. Soil Sci. Soc. Am. J. 2016, 80, 1688–1697. [Google Scholar] [CrossRef]
  25. Steinfurth, K.; Gunnar, B.; Pascal, D.; Bettina, E.; Wolfgang, G.; Johannes, H.; Juliane, H.; Bruno, H.; Claire, J.; Dierk, K.; et al. Thresholds of target phosphorus fertility classes in European fertilizer recommendations in relation to critical soil test phosphorus values derived from the analysis of 55 European long-term field experiments. Agric. Ecosyst. Environ. 2022, 332, 107926. [Google Scholar] [CrossRef]
  26. IUSS Working Group WRB. World Reference Base for Soil Resources: International Soil Classification System for Naming Soils and Creating Legends for Soil Maps; IUSS Working Group WRB: Rome, Italy, 2014. [Google Scholar]
  27. Cooperative Research Group on Chinese Soil Taxonomy (CRGCST). Chinese Soil Taxonomy; Science Press: Beijing, China, 2001; pp. 246–247. [Google Scholar]
  28. Zhang, S.L.; Tong, Y.A.; Liang, D.L.; Lu, D.Q.; Emteryd, O. Nitrate-N movement in the soil profile as influenced by rate and timing of nitrogen application. Acta Pedol. Sin. 2004, 41, 270–277. (In Chinese) [Google Scholar]
  29. Murphy, J.; Riley, J.P. A modified single solution method for the determination of phosphate in natural waters. Anal. Chim. Acta 1962, 27, 31–36. [Google Scholar] [CrossRef]
  30. Hesketh, N.; Brookes, P.C.; Sharpley, A.N. Development of an indicator for risk of phosphorus leaching. J. Environ. Qual. 2000, 29, 105–110. [Google Scholar] [CrossRef]
  31. Tiessen, H.; Moir, J.O. Characterization of available P by sequential extraction. Soil Sample Methods Anal. 1993, 7, 5–229. [Google Scholar]
  32. Environmental Protection Agency. Methods of Chemical Analysis of Water and Wastes; Environmental Protection Agency: Cincinnati, OH, USA, 1997. [Google Scholar]
  33. Cross, A.F.; Schlesinger, W.H. A literature review and evaluation of the Hedley fractionation: Applications to the biogeochemical cycle of soil phosphorus in natural ecosystems. Geoderma 1995, 64, 197–214. [Google Scholar] [CrossRef]
  34. Khan, A.; Lu, G.; Ayaz, M.; Zhang, H.; Wang, R.; Lv, F.; Yang, X.; Sun, B.; Zhang, S. Phosphorus efficiency, soil phosphorus dynamics and critical phosphorus level under long-term fertilization for single and double cropping systems. Agric. Ecosyst. Environ. 2018, 256, 1–11. [Google Scholar] [CrossRef]
  35. Waugh, D.L.; Cate, R.B.; Nelson, L.A. Discontinuous models for rapid correlation, interpretation, and utilization of soil analysis and fertilizer response data. In Tech. Bull. 7. International Soil Fertility Evaluation and Improvement Program; North Carolina State University: Raleigh, NC, USA, 1973. [Google Scholar]
  36. Luo, G.; Li, L.; Friman, V.-P.; Guo, J.; Guo, S.; Shen, Q.; Ling, N. Organic amendments increase crop yields by improving microbe-mediated soil functioning of agroecosystems: A meta-analysis. Soil Biol. Biochem. 2018, 124, 105–115. [Google Scholar] [CrossRef]
  37. Cai, A.; Xu, M.; Wang, B.; Zhang, W.; Liang, G.; Hou, E.; Luo, Y. Manure acts as a better fertilizer for increasing crop yields than synthetic fertilizer does by improving soil fertility. Soil Till. Res. 2019, 189, 168–175. [Google Scholar] [CrossRef]
  38. Yang, S.; Li, F.; Malhi, S.S.; Wang, P.; Suo, D.; Wang, J. Long-Term Fertilization Effects on Crop Yield and Nitrate Nitrogen Accumulation in Soil in Northwestern China. Agron. J. 2004, 96, 1039–1049. [Google Scholar] [CrossRef]
  39. Diacono, M.; Montemurro, F. Long-term effects of organic amendments on soil fertility. A review. Agron. Sustain. Dev. 2010, 30, 401–422. [Google Scholar] [CrossRef]
  40. Qaswar, M.; Li, D.; Huang, J.; Han, T.; Waqas, A.; Muhammad, A.; Zhang, L.; Du, J.; Zulqarnain, H.K.; Sami, U.; et al. Interaction of liming and long-term fertilization increased crop yield and phosphorus use efficiency (PUE) through mediating exchangeable cations in acidic soil under wheat–maize cropping System. Sci. Rep. 2020, 10, 19828. [Google Scholar] [CrossRef]
  41. Guo, F.; Yost, R.S.; Hue, N.V.; Evensen, C.I.; Silva, J.A. Changes in phosphorus fractions in soils under intensive plant growth. Soil Sci. Soc. Am. J. 2000, 64, 1681–1689. [Google Scholar] [CrossRef]
  42. Mahmood, M.; Tian, Y.; Ma, Q.; Ahmed, W.; Mehmood, S.; Hui, X.; Wang, Z. Changes in phosphorus fractions and its availability status in relation to long term P fertilization in loess plateau of China. Agronomy 2020, 10, 1818. [Google Scholar] [CrossRef]
  43. Samadi, A.; Gilkes, R.J. Phosphorus transformations and their relationships with calcareous soil properties of southern western Australia. Soil Sci. Soc. Am. J. 1999, 63, 809–815. [Google Scholar] [CrossRef]
  44. Cajuste, L.J.; Laird, R.J.; Cruz, D.J.; Cajuste, J.L. Phosphate availability in tropical soils as related to phosphorus fractions and chemical tests. Commun. Soil Sci. Plant Anal. 1994, 25, 1881–1889. [Google Scholar] [CrossRef]
  45. Zheng, Z.M.; Macleod, J.A.; Sanderson, J.B.; Lafond, J. Soil phosphorus dynamics after ten annual applications of mineral fertilizers and liquid dairy manure: Fractionation and path analyses. Soil Sci. 2004, 169, 449–456. [Google Scholar] [CrossRef]
  46. Wang, K.; Ren, T.; Yan, J.; Zhu, D.; Liao, S.; Zhang, Y.; Lu, Z.; Cong, R.; Li, X.; Lu, J. Straw returning mediates soil microbial biomass carbon and phosphorus turnover to enhance soil phosphorus availability in a rice-oilseed rape rotation with different soil phosphorus levels. Agric. Ecosyst. Environ. 2022, 335, 107991. [Google Scholar] [CrossRef]
  47. Wyngaard, N.; Cabrera, M.L.; Jarosch, K.A.; Bünemann, E.K. Phosphorus in the coarse soil fraction is related to soil organic phosphorus mineralization measured by isotopic dilution. Soil Biol. Biochem. 2016, 96, 107–118. [Google Scholar] [CrossRef]
  48. Jordan-Meille, L.; Rubæk, G.H.; Ehlert, P.A.I.; Genot, V.; Hofman, G.; Goulding, K.; Recknagel, J.; Provolo, G.; Barraclough, P. An overview of fertilizer-P recommendations in Europe: Soil testing, calibration and fertilizer recommendations. Soil Use Manag. 2012, 28, 419–435. [Google Scholar] [CrossRef]
  49. Sucunza, F.A.; Flavio, H.G.; Fernando, O.G.; Miguel, B.; Gerardo, R. Long-term phosphorus fertilization of wheat, soybean and maize on Mollisols: Soil test trends, critical levels and balances. Eur. J. Agron. 2018, 96, 87–95. [Google Scholar] [CrossRef]
  50. Xi, B.; Zhai, L.M.; Liu, S.; Wang, H.Y.; Luo, C.Y.; Ren, T.Z.; Liu, H.B. Long-term phosphorus accumulation and agronomic and environmental critical phosphorus levels in Haplic Luvisol soil, northern China. J. Integr. Agric. 2016, 15, 200–208. [Google Scholar] [CrossRef]
  51. Appelhans, S.C.; Pedro, A.B.; Ricardo, J.M.M.; Flavio, G.B. Assessing soil P fractions changes with long- term phosphorus fertilization related to crop yield of soybean and maize. Soil Use Manag. 2020, 56, 524–535. [Google Scholar] [CrossRef]
  52. Appelhans, S.C.; Pedro, A.B.; Ricardo, J.M.M.; Flavio, H.G.B.; Octavio, P.C. Is the lack of response of maize to fertilization in soils with low Bray1-P related to labile organic phosphorus? J. Soil Sci. Plant Nutr. 2021, 21, 612–621. [Google Scholar] [CrossRef]
  53. Gao, Z.; Cao, H.; Huang, M.; Bao, M.; Qiu, W.; Liu, J. Winter wheat yield and soil critical phosphorus value response to yearly rainfall and P fertilization on the Loess Plateau of China. Field Crops Res. 2023, 296, 108921. [Google Scholar] [CrossRef]
  54. Condron, L.M.; Turner, B.L.; Cade-Menun, J. Chemistry and dynamics of soil organic phosphorus. In Phosphorus: Agriculture and the Environment; Sims, J.T., Sharpley, A.N., Eds.; American Society of Agronomy: Madison, WI, USA, 2005; pp. 87–121. [Google Scholar]
  55. Mallarino, A.P.; Atia, A.M. Correlation of a Resin Membrane Soil Phosphorus Test with Corn Yield and Routine Soil Tests. Soil Sci. Soc. Am. J. 2005, 69, 266–272. [Google Scholar] [CrossRef]
  56. Luo, G.; Sun, B.; Li, L.; Li, M.; Liu, M.; Zhu, Y.; Guo, S.; Ling, N.; Shen, Q. Understanding how long-term organic amendments increase soil phosphatase activities: Insight into phoD- and phoC-harboring functional microbial populations. Soil Biol. Biochem. 2019, 139, 107632. [Google Scholar] [CrossRef]
  57. Reddy, D.D.; Rao, A.S.; Takkar, P.N. Effects of continuous use of cattle manure and fertilizer phosphorus on crop yields and soil organic phosphorus in a Vertisol. Bioresour. Technol. 2000, 75, 113–118. [Google Scholar] [CrossRef]
  58. Li, J.B.; Xie, T.; Zhu, H.; Zhou, J.; Li, X.Z. Alkaline phosphatase activity mediates soil organic phosphorus mineralization in a subalpine forest ecosystem. Geoderma 2021, 404, 115376. [Google Scholar] [CrossRef]
  59. Liao, D.; Zhang, C.; Li, H.; Lambers, H.; Zhang, F. Changes in soil phosphorus fractions following sole cropped and intercropped maize and faba bean grown on calcareous soil. Plant Soil 2020, 448, 587–601. [Google Scholar] [CrossRef]
  60. Cao, N.; Chen, X.; Cui, Z.; Zhang, F. Change in soil available phosphorus in relation to the phosphorus budget in China. Nutr. Cycl. Agroecosystems 2012, 94, 161–170. [Google Scholar] [CrossRef]
  61. Tang, X.; Li, J.; Ma, Y.; Hao, X.; Li, X. Phosphorus efficiency in long-term (15 years) wheat-maize cropping systems with various soil and climate conditions. Field Crops Res. 2008, 108, 231–237. [Google Scholar] [CrossRef]
  62. Aulakh, M.S.; Garg, A.K.; Kabba, B.S. Phosphorus accumulation, leaching and residual effects on crop yields from long-term applications in the subtropics. Soil Use Manag. 2007, 23, 417–427. [Google Scholar] [CrossRef]
  63. Messiga, A.J.; Ziadi, N.; Plénet, D.; Parent, L.E.; Morel, C. Long-term changes in soil phosphorus status related to P budgets under maize monoculture and mineral P Fertilization. Soil Use Manag. 2010, 26, 354–364. [Google Scholar] [CrossRef]
  64. Audette, A.; Ivan, P.O.; Les, J.E.; Voroney, R.P. Preliminary validation of a sequential fractionation method to study phosphorus chemistry in a calcareous soil. Chemosphere 2016, 152, 369–375. [Google Scholar] [CrossRef]
  65. Boniface, R.; Trocmé, S. Enseignements fournis par divers essaies de longue durée sur la fumure phosphatée et potassique: Essais sur la fumure phosphatéeIn: Phosphore et Potassium dans les Relations Sol-plante: Conséquences surla Fertilisation. In Ouvrage Collectif Sous la Direction de Louis Gachon; INRA Editions: Paris, France, 1988; pp. 279–402. [Google Scholar]
  66. Zhou, Y.L.; Deng, J.; He, W.Y.; Yi, Y.H.; Wang, L.Y.; Zhang, P.C.; Chen, T.G.; Zhao, X.L. Effects of Organic Materials on Organic Phosphorus content in purple soil and phosphorus uptake of corn seedlings. J. Soil Water Conserv. 2015, 29, 6. (In Chinese) [Google Scholar]
  67. Chakraborty, D.; Rishi, P. Stratification of soil phosphorus forms from long-term repeated poultry litter applications and its environmental implication. Environ. Chall. 2021, 5, 100374. [Google Scholar] [CrossRef]
  68. Wei, L.; Chen, S.; Cui, J.; Ping, H.; Yuan, C.; Chen, Q. A meta-analysis of arable soil phosphorus pools response to manure application as influenced by manure types, soil properties, and climate. J. Environ. Manag. 2022, 313, 115006. [Google Scholar] [CrossRef]
  69. Malik, M.A.; Marschner, P.; Khan, K.S. Addition of organic and inorganic P sources to soil—Effects on P pools and microorganisms. Soil Biol. Biochem. 2012, 49, 106–113. [Google Scholar] [CrossRef]
  70. Redel, Y.D.; Rosa, R.; Juan, L.R.; Fernando, B. Phosphorus bioavailability affected by tillage and crop rotation on a Chilean volcanic derived Ultisol. Geoderma 2017, 139, 388–396. [Google Scholar] [CrossRef]
  71. Chen, G.; Yuan, J.; Zhao, X.; Wang, S.; Zhu, Y.; Wang, Y. Animal manures promoted soil phosphorus transformation via affecting soil microbial community in paddy soil. Sci. Total Environ. 2022, 831, 154917. [Google Scholar] [CrossRef]
  72. Zhang, S.L.; Li, H.; Yang, X.; Sun, B. Effects of soil management regimes on biochemical properties of a loess soil. J. Soil Sci. Plant Nutr. 2015, 15, 711–725. [Google Scholar] [CrossRef]
  73. Sato, S.; Solomon, D.; Hyland, C.; Ketterings, Q.M.; Lehmann, J. Phosphorus speciation in manure and manure-amended soils using XANES spectroscopy. Environ. Sci. Technol. 2005, 39, 7485–7491. [Google Scholar] [CrossRef]
  74. Cao, N.; Zhi, M.; Zhao, W.; Pang, J.; Hu, W.; Zhou, Z.; Meng, Y. Straw retention combined with phosphorus fertilizer promotes soil phosphorus availability by enhancing soil P-related enzymes and the abundance of phoC and phoD genes. Soil Till. Res. 2022, 220, 105390. [Google Scholar] [CrossRef]
Figure 1. Flow chart of Hedley P sequential fractionation scheme as modified by Tiesson and Moir [31].
Agronomy 13 03072 g001
Figure 2. Mean wheat yield (a), mean maize yield (b), annual P uptake (c), and total P budget (d) as influenced by different fertilization treatments in 2010 and 2014. Different lowercase letters indicate statistically significant differences within each variable among fertilization treatments (p < 0.05). Asterisks (*, p < 0.05; **, p < 0.01) above the different columns in the same treatment represent significant differences between 2010 and 2014. Abbreviations: Control refers to no fertilizer or manure input (CK); N indicates the treatments that received only synthetic nitrogen fertilizer; NK indicates the treatments that received synthetic nitrogen and potassium (K); NP indicates the treatments that received synthetic nitrogen and phosphorus; NPK indicates the treatments that received synthetic nitrogen, phosphorus, and potassium; SNPK indicates the treatments that received synthetic NPK fertilizers and crop stalk return (S); MNPK indicates the treatments that received incorporation of NPK plus organic manure.
Agronomy 13 03072 g002
Figure 3. Concentrations of inorganic and organic soil phosphorus pools: labile phosphorus (a), moderately labile phosphorus (b), less-labile phosphorus (c), and geo-biochemical phosphorus (d) in the 0–100 cm profile under different fertilization treatments determined in year 2014. Error bars denote the standard error of the mean. Means followed by different letters within the same depth differ significantly (p < 0.05) between treatments. Abbreviations: Control refers to no fertilizer or manure input (CK); N indicates the treatments that received only synthetic nitrogen fertilizer; NK indicates the treatments that received synthetic nitrogen and potassium (K); NP indicates the treatments that received synthetic nitrogen and phosphorus; NPK indicates the treatments that received synthetic nitrogen, phosphorus, and potassium; SNPK indicates the treatments that received synthetic NPK fertilizers and crop stalk return (S); MNPK indicates the treatments that received incorporation of NPK plus organic manure.
Agronomy 13 03072 g003
Figure 4. Correlations between P uptake and the content of soil Pi and Po components of P fractions at surface layer (0–20 cm) for winter wheat (a,c,e,g) and summer maize (b,d,f,h) across fertilization treatments determined in 2010 and 2014. All fitted lines indicate significance at the p < 0.05 probability level (n = 42).
Agronomy 13 03072 g004
Figure 5. Relationship between soil P fraction at the surface layer and relative yield of winter wheat (a,c,e) and summer maize (b,d,f) across fertilization treatments determined in the years 2010 and 2014 of the long-term experiment (LP, linear plateau; QLP quadratic plateau). The red and black lines indicate statistical significance for the linear plateau and quadratic plateau (p < 0.0001), respectively. All fitted red and black lines indicate significance at the p < 0.0001probability level (n = 42).
Agronomy 13 03072 g005
Table 1. Details of fertilizer application rates (kg ha−1) associated with different treatments under winter wheat–summer maize cropping system.
Cropping SystemCropTreatmentN (kg ha−1)P (kg ha−1)K (kg ha−1)
Winter wheat–summer maizeWheatCK000
N165.000
NK165.0068.5
NP165.057.668.5
NPK165.057.668.5
SNPK165.0 + 40.4 a57.6 + 3.8 a68.5 + 85.5 a
MNPK74.3 + 173.2 a86.4 + 159.4 a102.8 + 208.9 a
MaizeCK000
N187.500
NK187.5077.8
NP187.524.60
NPK187.524.677.8
SNPK187.524.677.8
MNPK187.524.677.8
a The amount of N/P/K elements contained in the added crop straw or organic supplement. Abbreviations: Control refers to no fertilizer or manure input (CK); N indicates the treatments that received only synthetic nitrogen fertilizer; NK indicates the treatments that received synthetic nitrogen and potassium (K); NP indicates the treatments that received synthetic nitrogen and phosphorus; NPK indicates the treatments that received synthetic nitrogen, phosphorus, and potassium; SNPK indicates the treatments that received synthetic NPK fertilizers and crop stalk return (S); MNPK indicates the treatments that received incorporation of NPK plus organic manure.
Table 2. Analysis of variance for soil phosphorus pools (labile P, moderately labile P and less-labile P, mg kg−1) at surface soil layer (0–20 cm) in different fertilization treatments (mean ± SD).
YearsItems Treatments
CKNNKNPNPKSNPKMNPK
2010Labile PPi11 ± 2 c5 ± 0.2 d9 ± 1 cd39 ± 2 b36 ± 3 b37 ± 3 b117 ± 4 a
Po10 ± 2 d3 ± 0.2 e3 ± 0.4 e16 ± 2 bc15 ± 9 c19 ± 0.3 b38 ± 3 a
Moderately
labile P
Pi13 ± 1 e16 ± 3 d16 ± 0.2 d27 ± 0.2 b25 ± 0.1 bc23 ± 0.1 c41 ± 1 a
Po16 ± 6 cd6 ± 3 d7 ± 0.3 d29 ± 10 bc33 ± 13 b36 ± 12 b45 ± 9 a
Less-labile PPi342 ± 68 c354 ± 17 c340 ± 20 c456 ± 35 bc515 ± 119 b521 ± 141 b784 ± 48 a
Po17 ± 10 c27 ± 8 bc32 ± 6 bc25 ± 5 bc23 ± 3 bc17 ± 3 c46 ± 4 a
2014Labile PPi7 ± 1 c6 ± 0.2 c11 ± 1 c52 ± 6 b42 ± 3 b42 ± 9 b155 ± 9 a
Po20 ± 2 d4 ± 0.2 e5 ± 1 e42 ± 2 bc51 ± 8 b37 ± 8 c72 ± 16 a
Moderately labile PPi15 ± 1 c19 ± 2 c20 ± 2 c39 ± 2 b34 ± 4 b34 ± 2 b65 ± 8 a
Po72 ± 6 c7 ± 2 d9 ± 1 d95 ± 9 b104 ± 8 b99 ± 8 b159 ± 4 a
Less-labile PPi641 ± 11 c 394 ± 21 e377 ± 18 e493 ± 25 d906 ± 25 b898 ± 22 b1155 ± 27 a
Po46 ± 6 cd30 ± 5 d50 ± 7 c151 ± 14 ab149 ± 9 b142 ± 13 b169 ± 17 a
Different lower-case letters in the same row indicate significant differences between different treatments (p < 0.05). Abbreviations: Control refers to no fertilizer or manure input (CK); N indicates the treatments that received only synthetic nitrogen fertilizer; NK indicates the treatments that received synthetic nitrogen and potassium (K); NP indicates the treatments that received synthetic nitrogen and phosphorus; NPK indicates the treatments that received synthetic nitrogen, phosphorus, and potassium; SNPK indicates the treatments that received synthetic NPK fertilizers and crop stalk return (S); MNPK indicates the treatments that received incorporation of NPK plus organic manure.
Table 3. Two-segment models identified the relationships between soil variables (Olsen-P and CaCl2-P) and soil P fraction at the surface soil layer (0–20 cm) and determined the critical soil-test concentrations (CC).
VariablesP FractionsEquationsCC
(mg kg−1)
R2
Olsen-PLabile PY1 = 0.3585x − 0.4893
Y2 = 1.4139x + 145.0223
930.83
Moderately labile PY1 = 0.3010x − 1.8653
Y2 = 1.3621x + 85.1152
850.86
Less-labile PY1 = 0.0417x − 4.4318
Y2 = 0.6525x − 85.1152
6350.84
CaCl2-PLabile PY1 = 0.0030x − 0.1935
Y2 = 0.0254x + 3.0358
990.86
Moderately labile PY1 = 0.0017x − 0.1848
Y2 = 0.0395x + 2.6699
700.74
Less-labile PY1 = 0.0001x − 0.1948
Y2 = 0.0049x + 2.1916
4740.69
The model applies for the X value of the critical concentration shown, which is the value at which the two portions of the model join. Note: Equation R2 is shown when functions were significant at the p < 0.0001 probability level (n = 42).
Table 4. Regression models for relationships between relative grain yield and soil P fractions for winter wheat and summer maize at the surface soil layer (0–20 cm) and the determined critical soil P fraction concentrations.
CropsP FractionsModel aEquationsCC b
(mg kg−1)
R2
Winter wheatLabile PLPY = 25.7442 + 0.3864x540.93
QPY = 65.807 + 2.890x − 0.018x2740.83
Moderately labile PLPY = 23.6223 + 0.3425x480.66
QPY = 62.708 + 16.101x − 0.502x2570.63
Less-labile PLLN/A c
QPN/A
Summer maizeLabile PLPY = 47.5525 + 0.3032x630.78
QPY = 81.485 + 0.303x − 0.076x21270.76
Moderately labile PLPY = 46.5243 + 0.2615x490.49
QPY = 83.446 + 12.708x − 0.086x2630.46
Less-labile PLLN/A
QPN/A
a All statistical models (LP, linear plateau; QP quadratic plateau) were significant at p < 0.0001. b CC was calculated at 95% of relative yield. c N/A = not applicable. Note: Equation R2 is shown when functions were significant at the p < 0.0001probability level (n = 42).
Disclaimer/Publisher’s Note: The statements, opinions and data contained in all publications are solely those of the individual author(s) and contributor(s) and not of MDPI and/or the editor(s). MDPI and/or the editor(s) disclaim responsibility for any injury to people or property resulting from any ideas, methods, instructions or products referred to in the content.

