Abstract
The dynamics of amylose (AM) and total starch content (TSC) have been studied in several apple varieties; however, their responses to environmental variables and rootstocks are less understood in new low-climacteric varieties. In addition, the pertinence of AM and TSC to fruit dry matter content (DMC), fruit quality at harvest, and quality retention after storage is little understood. In this study, we investigated the seasonal changes in AM and TSC of ‘Ambrosia’ apples grafted onto dwarfing rootstocks Malling 9 (M.9) and Budagovsky 9 (B.9) in two consecutive years, 2016 and 2017, in the Okanagan-Similkameen Valley, British Columbia, Canada. Enzymatic methods with Megazyme® kits were used to analyze the fruit samples collected from four orchards in the growing season. In 2016, the orchard microclimate exhibited cooler nights and greater diurnal temperature ranges (DTRs) compared to 2017. As a result, the AM content and AM portion in TSC were significantly higher in 2016, with levels peaking over 40% compared to the values observed in 2017. However, there were no significant differences in peak values of TSC between the two years. Additionally, the apples grown on the B.9 rootstock consistently showed higher levels of AM and AM percentage compared to those grown on the M.9 rootstock. The study also used Felix 750 Produce Quality Meter, a handheld infrared spectrometer, to assess the dry matter content (DMC) of growing fruit, which showed a strong correlation with AM content (r > 0.8). After being harvested at commercial maturity and stored in controlled atmospheric chambers (CA) for 8 months, fruit quality analysis suggested that the AM level and its percentage in TSC played an important role in determining ‘Ambrosia’ apple quality after long-term storage.
1. Introduction
Starch is a critical carbohydrate storage molecule in plant organs such as fruit [1]. In apple fruit, amylose (AM) and amylopectin (AP) are the two main conformations of starch which determine the overall properties and functionality of starch prior to harvest and can influence various aspects of fruit quality at harvest and after storage [2,3]. Constituting 15–30% of starch, AM is known to improve crispness and firmness of food products, as high-AM starch (resistant starch) has a low water-binding capacity, small particle size, and slow hydrolyzation (resistance to digestion) [4]. These functional properties are linked to potential health benefits of food containing high-AM starch [4]. Starch with a higher AM content, i.e., a higher AM/AP ratio, has a lower glycemic index, and leads to slower and steadier increase in blood sugar level after consumption, which is linked to potential benefits in controlling diabetes and preventing colon cancer [5]. From a food preservation perspective, the use of high-AM starch coatings or edible films has shown promise in extending the shelf life of fruit produce. This is likely due to the ability of these coatings to regulate moisture loss and gas exchange, which can help maintain fruit quality and freshness over an extended period [6,7]. Likewise, a higher internal AM content prior to harvest may contribute to better quality retention in fruits.
Dry matter content (DMC) is an important indicator for fruit quality. A higher DMC has been reported to be associated with fruit maturation and better fruit quality attributes at harvest and after storage [8,9,10]. Temperature conditions, such as summer temperature [11], night degree hours, and diurnal temperature range (DTR) [10,12], influence photosynthesis, photosynthate accumulation and partitioning, and fruit development. These processes determine the timing of apple fruit maturation and fruit quality at harvest and quality retention after storage [8,10,12,13]. For example, warm postbloom temperature conditions were associated with higher soluble solids content (SSC) and more yellow background color, which suggested more progression in ripening [12]. Similarly, lower night-temperature accumulations and a higher day–night temperature difference (DTR accumulation) were related to dry matter accumulation, relative starch contents, and onset of starch clearing [10,13]. In addition to the above-mentioned temperature variables, recent studies have demonstrated the significant impacts of rootstocks on DMC accumulation during the growing season, and on fruit mass, DMC, SSC, and color coverage and intensity at maturation [14,15,16,17]. These impacts could be attributed to the alteration of scion hydraulics and photosynthetic capacity by rootstocks [18,19]. As the rootstock–scion interaction and its effects on fruit quality can be subject to climatic conditions, it is critical to investigate the interactive effects of climatic conditions and rootstocks on the formation of fruit quality attributes, in pursuit of fruit quality optimization.
During fruit growth and development, starch is the main component of DMC which can be most affected by the temperature profiles in the growing season [13,20]. In mature apple fruits, carbohydrates comprise 90% of DMC; about ¾ of total carbohydrates are digestible, whereas starch content is sometimes arguably considered as negligible [21,22]. Due to this impression, preharvest starch metabolism in fruit has been investigated in several apple varieties with low and high climacteric features [2,23,24,25,26]; however, its role in influencing at-harvest fruit quality and quality retention has not been well elucidated, and such knowledge is particularly lacking in new apple varieties.
The ‘Ambrosia’ apple (Malus domestica var. Ambrosia) is the most promoted and rapidly growing variety in Canada and is becoming popular on the global fresh fruit market [8,27], attributed to its rich fruity taste of sweet juicy flesh and fine crisp texture at harvest, and its great quality retention after storage [27,28]. Consequently, there has been an increasing demand in long-term marketing availability for this apple that encourages extensive studies on preharvest determinants for fruit quality. Different from many apple varieties, ‘Ambrosia’ does not exhibit an on-tree climacteric ethylene rise [29,30], and its fruit maturation cannot be reliably predicted according to the starch–iodine (I2-KI) index in a starch clearing test [2,30]. This physiological feature associated with fruit texture and the changes in starch conformation was also shown in crispy and low-climacteric apple varieties such as ‘Fuji’ [2]. To improve the accuracy of fruit maturation assessment and provide ‘Ambrosia’ apples with optimum quality to the market, it is important to understand the variety-specific starch metabolism, the roles of starch compositions in determining fruit quality attributes, and the environmental factors which influence starch compositions during apple ripening.
Diiodine (I2) and potassium iodide (KI) solution has been widely used to stain starch residues in apple flesh to determine apple maturation based on simple starch clearing index [2,31,32]. Developed from simple a starch–iodine test, Magel has refined a spectrophotometric method utilizing the absorbance at 530 nm and 606 nm [33]. The test can reflect apple maturation in the typical climacteric and quick-ripening varieties such as Jonagold’ [3], in which AM degrades quicklier in the last two weeks of maturation [34]. However, it may not provide an accurate assessment of fruit maturation in low-climacteric varieties, because their AM content does not exhibit a straightforward decrease during the later stages of fruit maturation [2]. Furthermore, a starch–iodine test is not accurate for a compositional assay, because only AM can efficiently react with the I2-KI solution to produce the dark blue/black color for absorbance measurement, whereas the AP–polyiodine complex can develop a measurable pigment only at high AP concentration [2]. This is because AM forms helixes and binds the iodine molecules to assemble long polyiodide chains; the helix-forming branches of AM are much longer than those of AP. Consequently, the binding capacity of iodine to starch depends on the starch composition and is determined by the AM concentration [1]. A simple iodide staining method cannot distinguish AM from total starch and therefore is insufficient to accurately reveal the changes in AM concentration in total starch and the differential effects of AM and AP on fruit quality. In comparison, the Megazyme® AM/AP method has been reported as a reliable procedure based on the specific precipitation of AP by concanavalin-A (Con A) lectin [35,36,37]. This AP precipitation procedure enables accurate assessments of AM content in total starch content (TSC) [37]. Despite the complexity and time commitment of the Megazyme® procedure [35], with proper modification, the protocol can be practically adapted in apple fruit assessment.
Overall, starch metabolism and its pertinence to the changes in fruit quality under the interactive effects of temperature and rootstock is an intricate subject, particularly in the context of the unique characteristics of ‘Ambrosia’ apples. It is necessary to further our understanding of this important pomological subject, in order to help horticultural practitioners improve orchard management to achieve desired fruit quality and enhance shelf life. With this in mind, we conducted a two-year study in commercial orchards to (1) reveal the changes in AM and TSC of ‘Ambrosia’ apple over the growing season using the modified Megazyme® protocol, the changes in DMC using nondestructive vis/NIR spectroscopy [10,38], and the relation between AM and DMC; (2) investigate the effects of rootstocks and temperatures on the changes in AM, TSC, and DMC; and (3) assess the influence of the AM percentage in TSC at harvest on quality attributes in long-term CA storage.
2. Materials and Methods
2.1. Orchard Profiles and Investigations
The investigations were conducted during the 2016 and 2017 growing seasons with 13–14-year-old apple trees (Malus domestica var. Ambrosia) in commercial orchards in the semi-arid climate of Cawston, Similkameen Valley, British Columbia, Canada. The ‘Ambrosia’ trees grafted onto dwarfing rootstocks Malling 9 (M.9) and Budagovsky 9 (B.9) were selected. Each rootstock with two plots were located on the north and the south of the valley, respectively, marked as M.9-N, M.9-S, B.9-N, and B.9-S. The plots were maintained according to the standard of the BC Tree Fruits Cooperative (BCTF). The trees were trained as Super Spindle Axis structure along a four-wire trellis, with 0.5 m tree spacing and 3.0 m row spacing. A total of thirty trees were divided into three replicates of ten trees each for each plot. The same trees were used in both 2016 and 2017. Unless stated otherwise, plot stands for each replicated experimental unit per rootstock per orchard.
Orchard temperature data were collected from early June (31 days after full bloom (DAFB)) to the middle of September near harvest. Air temperature was monitored with HOBO® U-23 Pro v2 Temperature/Relative Humidity built-in data loggers (Onset Co., Bourne, MA, USA) at a 10 min interval. Device was installed on supports at 1.5 m high in shade in the central plot in the middle experimental row at each site. A warmer temperature (over 28 °C) profile was referred to as a method for estimating orchard air temperature [39,40] and was calculated by subtracting 28 °C from the average hourly temperature in °C. The average hourly temperature was calculated by averaging the hourly maximum and minimum temperatures measured in each individual hour. Seasonal degree hours over 28 °C (date ranges as shown in the figures) was calculated as Equation (1):
where T includes values >0 °C only.
Season degree hours > 28 °C = ∑hourly ((Tmax − Tmin)/2 − 28 °C)
Accumulated night degree hours were calculated from hourly temperature data from July to September in both 2016 and 2017. Accumulated degree hours above 15 °C were calculated at nighttime (hours between sunset and sunrise) [10]. The accumulated DTR (day–night temperature difference range) in the growing season was calculated by accumulating the daily temperature differences (during the data collection), where the minimum hourly degree was subtracted from the maximum hourly degree in the day [10].
2.2. Sample Collections and Processes
This experiment was conducted to determine if there was a differential pattern for changes in starch components in apple tissue from plots subjected to the rootstock M.9 versus the plots with rootstock B.9 in different years. Each plot was divided into three separate blocks each containing four trees. Apples for the starch analysis were collected at the selected orchard on nine dates (in order of DAFB, 59, 66, 79, 88, 98, 106, 115, 127, and 134 d in 2016 and 54, 65, 77, 90, 101, 112, 122, 133, and 146 d in 2017). The size and growth stage at each time of sample collection between the two years were comparable, and the last days of sampling in both years were the same as the commercial harvest stage. Four apples were collected from each of four trees within an experimental block, resulting in a combined sample containing twelve apples. Once collected and returned to the laboratory, apples were peeled, cored, sliced and the slices of cortex tissue were weighed and immediately flash frozen in liquid nitrogen. The frozen tissue was further powdered using a liquid nitrogen freezer mill (SPEX Certiprep, Metuchen, NJ, USA). The frozen powder was transferred into a sealed container which was kept in a −80 °C freezer until use.
2.3. Analysis of Amylose (AM), Amylopectin (AP), and Total Starch Content (TSC)
2.3.1. Reagents and Working Solutions
The reagents provided in the Megazyme® AM/AP assay kit (K-AMYL Megazyme®, Bray Co., Wicklow, Ireland) were used for the analyses in accordance with the manufacturer’s protocol with the minor procedure modification detailed below.
2.3.2. Starch Extraction and Purification
Five hundred milligrams of frozen apple flesh tissue powder from Step 2.2 was quickly transferred into a 30 mL Nalgene® centrifuge tube containing 5 mL of dimethyl sulphoxide (DMSO, BDH Analar cat. no. 10323). The tube was capped and placed in a boiling water bath for 15 min with intermittent high-speed stirring on a vortex mixer. Twenty milliliters of 95% (v/v) ethanol was added into the tube twice with continuous stirring on a vortex mixer until starch precipitation. The tube was subsequently centrifuged at 20,000× g for 10 min. The supernatant was discarded. The tube with the pellet was then refilled with 5 mL of DMSO and placed in a boiling water bath for 15 min with intermittent shaking. Twenty milliliters of Con A solvent was added twice to form the starch extract.
2.3.3. AM, AP Isolation, and Enzyme Hydrolyzation
A one-milliliter aliquot of starch extract was transferred to a 2.0 mL microcentrifuge tube that contained 0.50 mL of Con A solution. The tube was capped, and the contents were gently mixed by repeated inversion. After incubation at room temperature for 1 h, the tube was centrifuged at 14,000× g for 10 min for AP precipitation. The supernatant was reserved for the AM assay.
2.3.4. Hydrolyzation and Determination
A one-milliliter extract (total starch and AM, respectively) was subsequently transferred to a 15 mL centrifuge tube with mixture of 3.0 mL of 100 mM sodium acetate buffer at pH 4.5. The tube was covered with a marble stopper and then placed in a boiling water bath for 5 min to denature the Con A. After equilibration at 40 °C in a water bath for 5 min, 0.1 mL of amyloglucosidase/α-amylase enzyme mixture (Solution 2 in Megazyme® kit) was added into the tube. The solution was incubated at 40 °C for 30 min. The tube was then centrifuged at 2000× g for 5 min. A one-milliliter aliquot of the extract was transferred to a test tube, mixed with 4 mL of GOPOD Reagent, and incubated at 40 °C for 20 min. The tubes for the blank and the D-Glucose standards were incubated as well. The absorbance of each sample and the D-glucose controls at 510 nm against the reagent blank were used to calculate AM and TSC, respectively. AM was subtracted from TSC to calculate AP.
2.4. Prediction of Fruit Dry Matter Content
On each date of sample collection, DMC was predicted using the Felix F-750 Produce Quality Meter (Felix Instruments, Camas, WA, USA), a handheld visible–near-infrared spectrometer for nondestructive fruit DMC assessment. The device was loaded with an apple DMC model developed by Summerland Research and Development Centre [10]. The fruits on the tree were measured on the transition zone between sunlit and shaded sides, with the sensor lens of F-750 tightly placed against the fruit surface [8,14]. In each plot, three replications (blocks) of 20 fruits were measured on each day of the investigation (totaling 240 fruits per investigation).
2.5. Blush Color Assessment
Red blush coverage on the surface of fruit was assessed visually and was presented as a percentage [15]. Foreground color (red-blushed overcolor) was recorded as CIE L*a*b* with a Minolta colorimeter (Minolta CR-300 Chroma meter, Konica Minolta, Tokyo, Japan). L* is the lightness coefficient that ranges from 0 (black) to 100 (white); a* is the major red chroma coefficient which represents red when a* > 0 and represents green when a* < 0; b* > 0 represents yellow, and b* < 0 represents blue. A blush color index (to quantify the intensity of the red blush color) was calculated as Equation (2):
where BCI is the blush color index, ‘L’ is the measured L* value, ‘a’ is the measured a* value and ‘b’ is the measured b* value [8].
2.6. Harvest, Storage, and Quality Assessment of Fruit
Fruit for postharvest assessment were prepared as commercial harvest. A total of twelve totes of samples including four plots of three blocks were held in a 15 °C room for three days [14]. All totes were then placed into a six-bushel capacity CA cabinet [10]. which was set for a low-oxygen atmosphere of 1.0% O2 + 0.5% CO2 and held in a room set at a temperature of 0.5 °C [10]. At the end of storage, fruit were moved to 20 °C for 7 days to ripen before being evaluated.
Flesh firmness, titratable acid (TA), and soluble solids content (SSC) of fruit were measured after 7 months of CA storage. At the end of storage, fruit were moved to 20 °C for 7 d to ripen, then were provided for compositional evaluations [10]. Flesh firmness was measured with an 11 mm diameter plunger mounted on an Instrument of Fruit Texture Analyzer (FTA) (Model GS-15, Güss Manufacturing Ltd., Strand, South Africa). Two punches were made on opposite sides of each apple in the sun/shade transition zone. The plunger was punched into the flesh with crosshead speed of 200 mm/min to a depth of 8 mm. Two measurements were recorded per fruit, on two peeled areas on opposite sides of the equatorial region of the apple fruit. FTA values were recorded in units of Newton (N). After the firmness was determined, the apple was then sectioned using hand-operated Food Prep bench-top corer and wedger (Dito Dean, Rocklin, CA, USA), fitted with an eight-slice wedging and coring head. One wedge taken from each of 10 applies in a batch replicate was combined and juiced using a Champion Juicer (Plastaket Manufacturing Co., Lodi, CA, USA). Fifteen milliliters of the clear juice was diluted to 60 mL with distilled/deionized water. This solution was then titrated with an automatic titrator with a 0.1 N NaOH solution using an automated titrator (Model 719S, Titrino-Metrohm, Brinkmann, Mississauga, ON, Canada) and reported as mg/L of malic acid. With the apple juice from the same extract as the TA test, SSC was measured using the Refracto 30PX refractometer (Mettler Toledo, Columbus, OH, USA) and reported in percent (% w/v).
2.7. Statistical Analyses
The experiment was designed as 2 types of rootstock × 2 plots × 3 blocks (reps) with 9 samplings in each year, a multiple analysis was applied to analyze the output data. A statistical significance analysis (one-way ANOVA or three-way ANOVA, Tukey’s pairwise comparisons, p ≤ 0.05), Principal Component Analysis, and data plotting were conducted in OriginPro 8.0 (OriginLab, Northampton, MA, USA). Principal Component Analysis was conducted to explore the correlation between starch components and fruit quality attributes of two rootstocks in two years. The correlation between the changes in AM and DMC during fruit development (Table 1) were analyzed using the Pearson function of Microsoft 365, and the linear regression coefficient (r) and r-square are presented. Statistical analyses are presented within the text as graphs and tables, respectively.

Table 1.
Correlation between amylose (AM) and dry matter content (DMC) amongst four orchard plots * during maturation of ‘Ambrosia‘ apple in 2016 and 2017.
3. Results and Discussion
3.1. Changes in Starch Components under Rootstock Effects
Seasonal and interannual variations in starch components were significant (p < 0.001). The amounts of AM and TSC drastically increased during the middle of June (from 54–59 DAFB to 65–66 DAFB) in both years (Figure 1A,B). In 2016, AM peaked at 66 DAFB then steadily decreased, whereas in 2017, AM gradually increased and plateaued at 101–112 DAFB. The average peak value of AM from M.9 plots was 19.5 mg/g.f.w. in 2016, which was 41.8% higher than that value (13.8 mg/g.f.w.) observed in 2017; in B.9 plots, the peak value of AM was 22.9 mg/g.f.w. in 2016, which was 42.6% higher than the value 15.8 mg/g.f.w. in 2017 (Figure 1A). TSC exhibited two peak values during the growing season in both years, with higher values in B.9 than M.9 on most of the days under investigation (Figure 1B). Overall, there was no consistent difference in TSC based on the peak values between the two years.
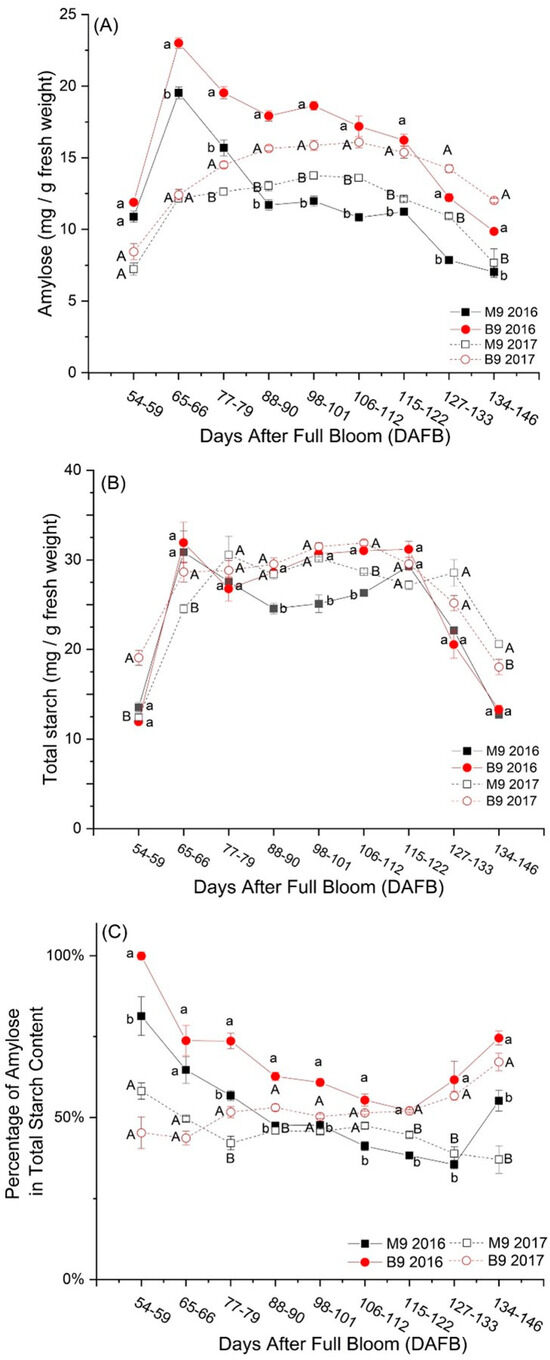
Figure 1.
Changes in amylose (AM) (A), total starch content (TSC) (B), and percentage of amylose in total starch content (C) of ‘Ambrosia’ apple during the growing season in 2016 and 2017. Symbols and error bars are mean and standard errors (n = 6). Different lowercase letters stand for a significant difference between Malling 9 (M9) and Budagovsky 9 (B9) in 2016; different uppercase letters stand for a significant difference between the two rootstocks in 2017 (one-way ANOVA, p ≤ 0.05).
It was observed that apple trees grafted onto the B.9 rootstock consistently showed higher values for AM throughout the growth season in both years (Figure 1A; p < 0.001). This suggests that B.9 rootstock may have a positive effect on AM accumulation and metabolism in the fruit. In addition, fruits on B.9 had a higher firmness (Table 2), suggesting that a higher AM might be related to a delay in fruit maturation. Fruits on B.9 also had a lower mass (in 2016, 215.3 ± 3.6 g for B.9, 236.5 ± 5.3 g (mean ± standard error) for M.9, F(1, 39) = 10.41, p = 0.003; in 2017, 206.4 ± 3.1 g for B.9, 219.3 ± 3.1 g for M.9, F(1, 43) = 8.70, p = 0.005; data not graphed), indicating that a higher AM might be a consequence of a higher concentration of AM in smaller fruits. The percentage of AM in TSC in the fruit from the B.9 rootstock was consistently higher over the season in both years (Figure 1C). This implies that the B.9 rootstock may influence the starch-to-sugar ratio in the fruit, potentially affecting its taste and quality attributes. The findings align with previous research on apple rootstocks, which indicated that B.9 demonstrated a more stable water status under water deficit and better drought tolerance compared to M.9 [14,15]. The improved water status likely contributed to a higher carbon assimilation (the process by which plants convert carbon dioxide into organic compounds) throughout the growing season. This, in turn, could lead to the development of apples with greater quality attributes.
Table 2.
Amylose/amylopectin ratio in ‘Ambrosia’ apple at harvest and fruit quality attributes after 8 months of controlled atmospheric storage in the two years.
The patterns of changes in AM and TSC in ‘Ambrosia’ apples were different compared to other apple varieties reported in previous research [2,34]. Additionally, AM decreased slower than TSC (Figure 1A,B). These differences could be attributed to the longer period of the investigation in this study on ‘Ambrosia’ apples, which spanned the entire summer. This extended timeframe might have influenced the rate of change in these components. Secondly, the method used to measure and analyze the isolated and purified components of starch AM and TSC could have contributed to the observed differences. Thirdly, ‘Ambrosia’ apples may have unique characteristics and responses to environmental factors [8,39]. Despite the differences observed, the overall result suggests that AM plays a significant role as a main component of TSC during the growing season in ‘Ambrosia’ apples. This implies that AM content has a substantial impact on the overall sugar content and quality of ‘Ambrosia’ apples.
In this study, the percentage of AM increased as the apples matured (Figure 1C), presenting a unique pattern in ‘Ambrosia’ apples. The combination of a fast drop in TSC and a relatively slower decline in AM led to a change in the ratio between these components. This implies that the traditional method of using the starch–iodine index as an indicator of apple maturation [2,34] may not be suitable for ‘Ambrosia’ apples. The starch–diiodine method, which relies on measuring AM content, may not accurately reflect the maturity stage of ‘Ambrosia’ apples because of the atypical increase in AM content during maturation.
3.2. Changes in Dry Matter Content (DMC) and Its Relation with Amylose (AM)
Seasonal changes in DMC were not significant in 2016 (p = 0.84) but were significant in 2017 (p < 0.001); DMC in each study plot was significantly higher in 2016 than in 2017 (p < 0.001) (Figure 2). Rootstock effects were significant in both years (p < 0.001) (Figure 2), with lower values in the fruit grown in M.9 plots than in B.9 plots throughout the growing season (Figure 2). Similar to AM, the greater DMC level in B.9 suggests the rootstock effects on carbohydrate accumulation in fruit during the growing season. The variation in DMC levels during fruit development showed a strong correlation with AM content in the same stage amongst the four locations: in 2016, the r values (the Pearson linear regression correlation coefficient) between DMC and AM were 0.85, 0.81, 0.84, 0.85, 0.84, and 0.82 on day (DAFB) 88, 98, 106, 115, 127, and 134, respectively (Table 1); consistently in 2017, the r values were 0.80, 0.77, 0.84, 0.88, 0.93, and 0.83 on DAFB 90, 101, 112, 122, 133, and 146, respectively (Table 1). There were also strong RSQs (>0.9) during fruit maturation in both years (Table 1), which may suggest that AM is the main active compound in DMC in ‘Ambrosia’ apple. The difference in DMC between the two years seemed to be associated with different orchard climates.
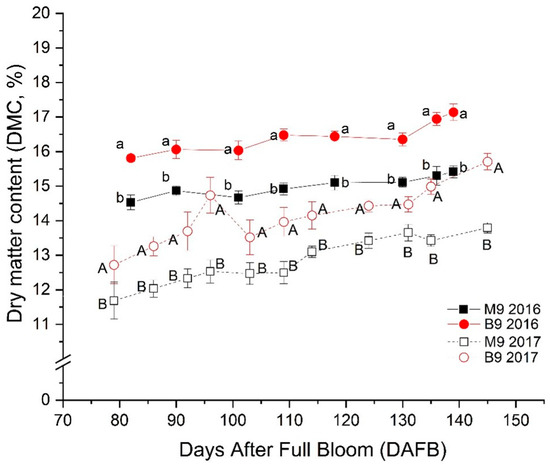
Figure 2.
Changes in dry matter content (DMC) of ‘Ambrosia’ apple during the growing season in 2016 and 2017. Symbols and error bars are mean and standard errors (n = 6). Different lowercase letters stand for a significant difference between Malling 9 (M9) and Budagovsky 9 (B9) in 2016; different uppercase letters stand for a significant difference between the two rootstocks in 2017 (one-way ANOVA, p ≤ 0.05).
3.3. Seasonal Changes in Orchard Temperatures and Their Effects on Fruits
Microclimatic conditions in the orchards were different in the growing season of the two years. In 2016, the orchard experienced ideal conditions including plenty of sunny days with daily maximum temperatures exceeding 28 °C (Figure 3A), a lower accumulation of >15 °C night temperature (Figure 3B), and a higher accumulation of DTR (Figure 3C) indicating greater temperature differences between day and night. In contrast, in 2017, there was inadequate heat accumulation during the day, higher sums of >15 °C night temperature, and lower DTR sums (Figure 3). The comparative analysis indicated that the seasonal accumulations of daily maximum temperatures exceeding 28 °C in 2016 were twice as high as in 2017 (Figure 3A), sums of nighttime > 15 °C temperatures in 2016 were 21% lower than in 2017 (Figure 3B), and the DTR sums in 2016 were 19% higher than in 2017 (Figure 3C).
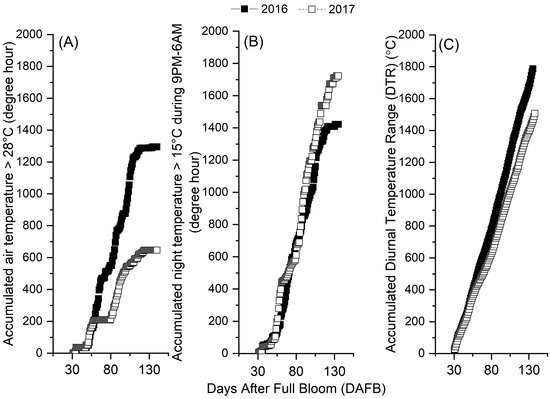
Figure 3.
Accumulated hours for air temperature above 28 °C (A), for night temperature above 15 °C (B), and diurnal temperature range (DTR) (C) during the growing season of ‘Ambrosia’ apple in 2016 and 2017. The degree hours for night temperature above 15 °C were calculated between 9 PM and 6 AM; DTR was calculated as the accumulated daily temperature differences between daily maximum and minimum temperatures during the growing season. N, north; S, south; M9, Malling 9 rootstock; B9, Budagovsky 9 rootstock.
The interannual temperature profiles observed in the orchards (Figure 3) are relevant to the interannual changes in starch compositions (Figure 1) and DMC (Figure 2). This suggests a relationship between temperature conditions and the carbohydrate contents in apple fruit. Warm and sunny days [41], cool nights, and a greater DTR [10,13] are ideal for apple growth and dry matter accumulation, and the production of high-quality and sweeter tasting apples [8,40]. A higher DTR and cooler nights during the growing season cause lower nighttime leaf respirational loss and consequently a greater translocation of photosynthates to the fruit and more starch reserve in the summer, which leads to a greater fruit dry matter content [13,20]. Although apple is known for its tolerance against a wide range of temperature fluctuations [20], daily warm temperatures during the growing season are essential for apple crops, as they are associated with sunny days and a greater DTR, which are required for net carbohydrate gain, fruit growth, and development. On the other hand, apples grow best in regions where the temperature rarely increases above 32.22 °C [41], because extremely hot weather, especially when concurring with water deficit, can inhibit photosynthesis and transpirational cooling and affect fruit, leading to issues such as small fruits, soft scald [39], sunburn, and fruit softening [13]. In 2016, the daily temperatures above 28 °C were mostly within the range of 28–32 °C in the orchards, with significantly higher seasonal accumulation above 28 °C than in 2017 (Figure 3A). This suggests that the orchards had consistently warm but not adversely hot temperatures in 2016. Importantly, there were no extreme high-temperature events, often referred as “heat waves,” experienced in the orchards during 2016 [16,17]. This indicates that the temperatures in 2016 remained within an optimal range for apple production, which contributed to a higher fruit DMC (Figure 2) and higher fruit mass (See Section 3.1) than 2017.
Temperature factors during the growing season have substantial impacts on postharvest physiology and quality retention in apples [13,20]. As discussed above, favorable temperature conditions lead to a higher dry matter content, which is generally linked to a slower starch degradation during storage, contributing to a better quality retention [13].
3.4. Effects of Orchard Temperatures, Rootstocks, and Starch Compositions on Fruit Quality
Fruits with different levels of at-harvest starch compositions were stored in CA cold storage for 8 months. Some quality attributes showed significant differences between years and rootstocks (Figure 4, Table 2; p ≤ 0.05).
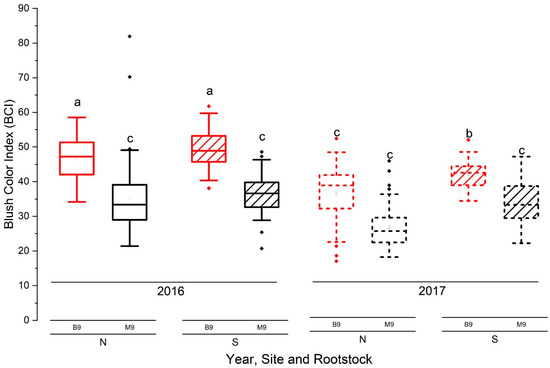
Figure 4.
Red blush color index (BCI) of ‘Ambrosia’ apple from M.9 and B.9 plots in 2016 and 2017. Lines in box plots from bottom to top represent the minimum, lower quartile, median, upper quartile, and maximum values, and central squares represent the mean; different letters indicate significant differences at p ≤ 0.05 (three-way ANOVA, Tukey’s pairwise comparisons, p ≤ 0.05; n = 46).
3.4.1. Blush Red Color
The rootstock effect on blush red color was significant (p < 0.001). Fruits on B.9 had a greater intensity of red color on the fruit surface (expressed as BCI, blush color index) in comparison to those on M.9 (Figure 4). In B.9, fruits at each site had a significantly higher BCI in 2016 than in 2017 (Figure 4, p < 0.001). The percentage of fruits with a 70% red blush coverage in the total samples was 20% higher in 2016 than in 2017, as well as on B.9 than on M.9.
3.4.2. Fruit Quality Attributes after Storage
Rootstock effects were significant on DMC, TA, and SSC after 8 months of controlled atmospheric storage in both years, and on firmness in 2017, with higher values in fruits from B.9 than those from M.9 (p < 0.001, Table 2). This concurred with a higher AM/AP ratio in fruits from B.9. Consequently, fruits with a higher AM portion (AM/AP) had a better retention of these attributes (Table 2). Interannual variations between 2016 and 2017 were significant in DMC (p < 0.001), TA (p = 0.001), and SSC (p = 0.046), but not in firmness (p = 0.37), in fruits from each site (Table 2).
In the Principal Component Analysis (PCA) (Figure 5), the clusters of B.9 (black dot, black line for 95% confidence) and M.9 (red dot, red line) had a clear separation in total starch, amylose, amylopectin, SSC, and TA; the groups of 2016 and 2017 overlapped along both principal component 1 (PC1) and PC2 (Figure 5). This implies that compared to the interannual factor, the rootstocks exerted a stronger influence on the correlations of the analyzed variables. AP, AM, SSC, and TA were the strong influences on PC1, suggesting the starch composition was highly associated with compositional quality in this apple. There was a negative correlation between AP and firmness (r = −0.65), assuming that fruits with a lower AM/AP had poor retention of flesh texture. Overall, AM strongly positively correlated with SSC (r = 0.77). This result suggests that a higher AM portion resulted in a greater flavor and freshness for ‘Ambrosia’ apple.
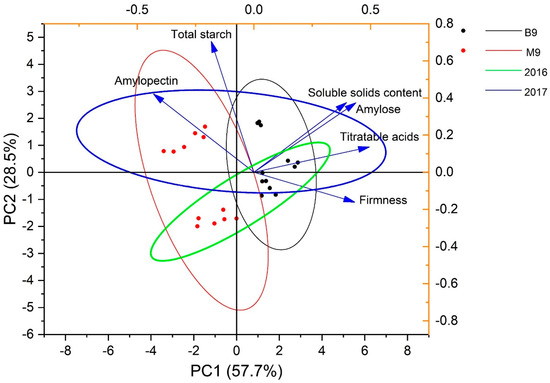
Figure 5.
Principal Component Analysis amongst starch components and fruit quality attributes of ‘Ambrosia’ apple on B.9 and M.9 rootstocks in 2016 and 2017. Black dots and black ellipse: B.9 rootstock; red dots and red ellipse: M.9 rootstock; green ellipse: 2016; blue ellipse: 2017 (n = 3, N = 24).
3.5. Limitations and Future Perspectives
The results from this study were limited to two years, two dwarfing rootstocks, and one apple variety. Although the temperature differences were predominant in 2016 and 2017, the analysis could not rule out the impacts of other potential environmental variables on the interannual variations in starch compositions and quality attributes in the fruit. Future studies should be designed to include more microclimatic variables such as moisture deficit and forest fire smoke intensity, from multiple sites and years. For causal analysis, it is necessary to conduct temperature stress treatments under controlled cultivation conditions and to utilize both dwarfing and semi-dwarfing rootstocks which significantly differ in vigor and carbohydrate partitioning. The relations between AM, DMC, and fruit quality can be further investigated by comparing more apple varieties with different climacteric characteristics, and by grouping samples according to low, medium, and high AM/AP levels.
Furthermore, starch content and compositions in fruit are intrinsically determined by carbohydrate source–sink relation [42]. The quantification of photosynthetic capacity and crop load is essential to elucidate this relation; therefore, it should be integrated into future studies on starch and AM dynamics.
4. Conclusions
In this two-year study, the seasonal changes in starch composition of ‘Ambrosia’ apples were investigated under the effects of rootstocks and orchard temperature conditions in the Okanagan-Similkameen Valley, British Columbia, Canada, in 2016 and 2017. The impacts of the starch compositions on fruit quality retention after storage were further assessed. The Megazyme® AM-AP assay and handheld vis/NIR spectrometer were proven to be reliable methods to assess the AM and DMC of ‘Ambrosia’ apple, respectively.
The seasonal dynamics of TSC, AM, AM percentage in TSC and DMC were impacted by orchard temperature conditions and rootstocks. The orchard exhibited warmer days, cooler nights, and a greater DTR in 2016 than 2017. As a result, the AM content and AM percentage in total starch were significantly higher in 2016. However, there were no significant differences in the peak values of TSC between the two years, suggesting that the AM content was more responsive to interannual temperature variations. The increase in AM percentage in TSC during fruit maturation explained why the starch–iodine index could not provide an accurate maturation assessment in this low-climacteric apple. Additionally, the apples grown on B.9 rootstock consistently showed higher levels of AM content and AM percentage compared to those grown on M.9. There was a strong correlation (r > 0.8) between fruit DMC and AM content during the growing season. The fruits with a higher AM content demonstrated a higher BCI, and higher DMC, TA, and SSC after eight months of storage in controlled atmospheric chambers at 0.5 °C.
Overall, the study sheds light on the seasonal variations in AM and starch profile of ‘Ambrosia’ apples, highlighting the impacts of rootstocks and air temperatures of the growing season on the changes in TSC, AM, DMC, and fruit quality attributes. The correlations between AM and AM/AP, and DMC, TA, and SSC suggest that the AM content may be a valuable indicator for the fruit quality and storage potential of ‘Ambrosia’ apples.
Author Contributions
Research design, management, and draft preparation, C.L.; tree-fruit physiology investigation, data analysis, and manuscript completion, H.X. and C.L.; CA storage system operation and DMC model finalization, B.L.; manuscript revision, H.X., C.L., B.L. and X.Y. All authors have read and agreed to the published version of the manuscript.
Funding
The research was funded by Agriculture and Agri-Food Canada, the New Tree Fruit Varieties Development Council, and the British Columbia Fruit Growers’ Association (CAP; ASP-005 BCFGA Activity #8 J-002066).
Data Availability Statement
The data presented in this study are available on request from the corresponding authors.
Acknowledgments
The authors are grateful to Peter Toivonen for sharing insights on fruit dry matter research and laboratory supports, and to the collaborating growers for supporting the research in their orchards in Cawston, British Columbia, Canada. The 2017–2019 co-op students Sydney Bell, Nikolas Wilson, and Hareet Dhillon from University of British Columbia are also acknowledged for their assistance in sample processing, chemical analysis, and data collection.
Conflicts of Interest
The authors declare no conflict of interest. Hao Xu, the guest editor of Special Issue “Recent Insights in Physiology of Tree Fruit Production”, was blinded from reviewing or making decisions on the manuscript. The peer-review process was handled in accordance with the standard of the journal and independently of this guest editor.
References
- Doerflinger, F.C.; Miller, W.B.; Nock, J.F.; Watkins, C.B. Relationships between starch pattern indices and starch concentrations in four apple cultivars. Postharvest Biol. Technol. 2015, 110, 86–95. [Google Scholar] [CrossRef]
- Fan, X.; Mattheis, J.P.; Patterson, M.E.; Fellman, J.K. Changes in amylose and total starch content in ‘Fuji’ apples during maturation. HortScience 1995, 30, 104–105. [Google Scholar] [CrossRef]
- Bekele, E.A.; Beshir, W.F.; Hertog, L.A.T.M.M.; Nicolai, B.M.; Geeraerd, A.H. Metabolic profiling reveals ethylene mediated metabolic changes and a coordinated adaptive mechanism of ‘Jonagold’ apple to low oxygen stress. Physio. Plant. 2015, 155, 232–247. [Google Scholar] [CrossRef] [PubMed]
- Sharma, A.; Yadav, B.; Yadav, R.B. Resistant starch: Physiological roles and food applications. Food Rev. Int. 2008, 24, 193–234. [Google Scholar] [CrossRef]
- Topping, D. Cereal complex carbohydrates and their contribution to human health. J. Cereal. Sci. 2007, 46, 220–229. [Google Scholar] [CrossRef]
- Gupta, V.; Thakur, R.; Barik, M.; Das, A.B. Effect of high amylose starch-natural deep eutectic solvent based edible coating on quality parameters of strawberry during storage. J. Agric. Food Res. 2023, 11, 100487. [Google Scholar] [CrossRef]
- Calderón-Castro, A.; Odín Vega-García, M.; Zazueta-Morales, J.D.J.; Fitch-Vargas, P.R.; Carrillo-López, A.; Gutiérrez-Dorado, R.; Limón-Valenzuela, V.; Aguilar-Palazuelos, E. Effect of extrusion process on the functional properties of high amylose corn starch edible films and its application in mango (Mangifera indica L.) cv. Tommy Atkins. J. Food Sci. Technol. 2018, 55, 905–914. [Google Scholar] [CrossRef]
- Lu, C. Early summer deficit irrigation increases dry matter content and enhances quality of Ambrosia™ apple at- and post-harvest. Horticulturae 2022, 8, 571. [Google Scholar] [CrossRef]
- Palmer, J.; Diack, R.; Johnston, J.; Boldingh, H. Manipulation of fruit dry matter accumulation and fruit size in ‘Scifresh’apple through alteration of the carbon supply, and its relationship with apoplastic sugar composition. J. Hort. Sci. Biotech. 2013, 88, 483–489. [Google Scholar] [CrossRef]
- Toivonen, P.; Lannard, B. Dry matter content association with time of on-tree maturation, quality at harvest, and changes in quality after controlled atmosphere storage for ‘Royal Gala’ apples. Can. J. Plant Sci. 2021, 101, 98–106. [Google Scholar] [CrossRef]
- Lachapelle, M.; Bourgeois, G.; DeEll, J.R. Effects of preharvest weather conditions on firmness of ‘McIntosh’ apples at harvest time. HortScience 2013, 48, 474–480. [Google Scholar] [CrossRef]
- Warrington, I.J.; Fulton, T.A.; Halligan, E.A.; De Silva, H.N. Apple fruit growth and maturity are affected by early season temperature. J. Am. Soc. Hort. Sci. 1999, 124, 468–477. [Google Scholar] [CrossRef]
- Toivonen, P.M.A. Relation between preharvest conditions, harvest maturity and postharvest performance of apples. Acta Hortic. 2019, 1256, 469–480. [Google Scholar] [CrossRef]
- Xu, H.; Ediger, D. Rootstocks with different vigor influenced scion–water relations and stress responses in Ambrosia™ apple trees (Malus domestica var. Ambrosia). Plants 2021, 10, 614. [Google Scholar] [CrossRef]
- Lu, C.; Xu, H. Summer fruitlet thinning enhanced quality attributes of Ambrosia™ apple at harvest and after 4 months of cold air storage. Can. J. Plant Sci. 2021, 101, 1041–1050. [Google Scholar] [CrossRef]
- Xu, H.; Watanabe, Y.; Ediger, D.; Yang, X.; Iritani, D. Characteristics of sunburn browning fruit and rootstock-dependent damage-free yield of Ambrosia™ apple after sustained summer heat events. Plants 2022, 11, 1201. [Google Scholar] [CrossRef] [PubMed]
- Xu, H.; Blatt, S.; Ediger, D. Tools for climate resilience in tree fruit I: Large-dwarfing rootstocks can alleviate sunburn damage in “Buckeye Gala” apple. Can. J. Plant Sci. 2022, 103, 128–132. [Google Scholar] [CrossRef]
- Jones, H.G. How do rootstocks control shoot water relations? New Phytol. 2012, 194, 301–303. [Google Scholar] [CrossRef]
- Xu, H.; Ediger, D.; Singh, A.; Pagliocchini, C. Rootstock–scion hydraulic balance influenced scion vigor and yield efficiency of Malus domestica cv. Honeycrisp on eight rootstocks. Horticulturae 2021, 7, 99. [Google Scholar] [CrossRef]
- Musacchi, S.; Serra, S. Apple fruit quality: Overview on pre-harvest factors. Sci.Hortic. 2018, 234, 409–430. [Google Scholar] [CrossRef]
- Suni, M.; Nyman, M.; Eriksson, N.A.; Björk, L.; Björck, I. Carbohydrate composition and content of organic acids in fresh and stored apples. J. Sci. Food Agric. 2000, 80, 1538–1544. [Google Scholar] [CrossRef]
- Salo, M.L.; Korhonen, I. Carbohydrate and acid composition of some apple varieties. Agric. Food Sci. 1972, 44, 63–67. [Google Scholar] [CrossRef][Green Version]
- Thammawong, M.; Arakawa, O. Starch degradation of detached apple fruit in relation to ripening and ethylene. J. Jpn Soc. Hortic. Sci. 2007, 76, 345–350. [Google Scholar] [CrossRef]
- Neuwald, D.A.; Streif, J.; Kittemann, D. Fruit starch degradation patterns in apple cultivars on-tree and off-tree at different holding temperatures. In Proceedings of the ISHS Acta Horticulturae 858: III International Conference Postharvest Unlimited, Berlin, Germany, 5 November 2008; pp. 263–266. [Google Scholar]
- Thammawong, M.; Arakawa, O. Starch degradation characteristics in relation to physiological and biochemical properties during growth and maturation of apple fruit. J. Appl. Hortic. 2009, 11, 23–30. [Google Scholar] [CrossRef]
- Doerflinger, F.C. Starch Metabolism in Apple Fruit and Its Relationship with Maturation and Ripening. Ph.D. Thesis, Cornell University, Ithaca, NY, USA, 2015. Available online: https://hdl.handle.net/1813/40631 (accessed on 18 October 2023).
- Cliff, M.A.; Toivonen, P.M. Sensory and quality characteristics of ‘Ambrosia’apples in relation to harvest maturity for fruit stored up to eight months. Postharvest Biol. Technol. 2017, 132, 145–153. [Google Scholar] [CrossRef]
- Cliff, M.A.; Stanich, K.; Lu, R.; Hampson, C.R. Use of descriptive analysis and preference mapping for early-stage assessment of new and established apples. J. Sci. Food Agric. 2016, 96, 2170–2183. [Google Scholar] [CrossRef]
- Cline, J.A. Commercial Production of Ambrosia™ Apples in Ontario Agdex 211/32; Ontario Ministry of Agriculture, Food and Rural Affairs: Guelph, ON, Canada, 2009. Available online: http://www.omafra.gov.on.ca/english/crops/facts/09-041.htm (accessed on 19 November 2019).
- Toivonen, P.M.A. Comparison of IAD and starch-iodine indices at harvest and how they relate to post-storage firmness retention in Ambrosia™ apples over three growing seasons. Can. J. Plant Sci. 2015, 95, 1177–1180. [Google Scholar] [CrossRef]
- Smith, R.B.; Lougheed, E.C.; Franklin, E.W.; McMillan, I. The starch iodine test for determining stage of maturation in apples. Can. J. Plant Sci. 1979, 59, 725–735. [Google Scholar] [CrossRef]
- Brookfield, P.; Murphy, P.; Harker, R.; MacRae, E. Starch degradation and starch pattern indices; interpretation and relationship to maturity. Postharvest Biol. Technol. 1997, 11, 23–30. [Google Scholar] [CrossRef]
- Magel, E. Qualitative and quantitative determination of starch by a colorimetric method. Starch–Stärke 1991, 43, 384–387. [Google Scholar] [CrossRef]
- Magein, H.; Leurquin, D. Changes in amylose, amylopectin and total starch content in Jonagold apple fruit during growth and maturation. Acta Hortic. 2000, 517, 487–491. [Google Scholar] [CrossRef]
- Zhu, T.; Jackson, D.S.; Wehling, R.L.; Geera, B. Comparison of amylose determination methods and the development of a dual wavelength Iodine binding technique. Cereal Chem. 2008, 85, 51–58. [Google Scholar] [CrossRef]
- Gibson, T.S.; Solah, V.A.; McCleary, B.V. A procedure to measure amylose in cereal starches and flours with Concanavalin A. J. Cereal Sci. 1996, 25, 111–119. [Google Scholar] [CrossRef]
- Yun, S.H.; Matheson, N.K. Estimation of amylose content of starches after precipitation of amylopectin by concanavalin-A. Starch/Starke 1990, 42, 302–305. [Google Scholar] [CrossRef]
- Grabska, J.; Beć, K.B.; Ueno, N.; Huck, C.W. Analyzing the Quality Parameters of Apples by Spectroscopy from Vis/NIR to NIR Region: A Comprehensive Review. Foods 2023, 12, 1946. [Google Scholar] [CrossRef] [PubMed]
- Lu, C.; Toivonen, P. Scheduling adequate irrigation mitigates postharvest soft scald disorder of Ambrosia™ apples grown in a semiarid eco-zone. Can. J. Plant Sci. 2022, 102, 884–890. [Google Scholar] [CrossRef]
- Gu, S. Growing degree hours—A simple, accurate, and precise protocol to approximate growing heat summation for grapevines. Int. J. Biometeorol. 2016, 60, 1123–1134. [Google Scholar] [CrossRef]
- Sugiura, T.; Ogawa, H.; Fukuda, N.; Moriguchi, T. Changes in the taste and textural attributes of apples in response to climate change. Sci. Rep. 2013, 3, 2418. [Google Scholar] [CrossRef]
- Belhassine, F.; Martinez, S.; Bluy, S.; Fumey, D.; Kelner, J.J.; Costes, E.; Pallas, B. August. Fruit growth, photosynthesis and starch accumulation are differentially affected by local variation in source/sink ratios. In Proceedings of the ISHS Acta Horticulturae 1281: XXX International Horticultural Congress IHC2018: International Symposium on Cultivars, Rootstocks and Management Systems of Deciduous Fruit and Fruit Tree Behaviour in Dynamic Environments, Istanbul, Turkey, 12–16 August 2018; pp. 455–462. [Google Scholar]


Disclaimer/Publisher’s Note: The statements, opinions and data contained in all publications are solely those of the individual author(s) and contributor(s) and not of MDPI and/or the editor(s). MDPI and/or the editor(s) disclaim responsibility for any injury to people or property resulting from any ideas, methods, instructions or products referred to in the content. |
© 2023 His Majesty the King in Right of Canada, as represented by the Minister of Agriculture and Agri-Food Canada. This article is an open access article distributed under the terms and conditions of the Creative Commons Attribution (CC BY) license (https://creativecommons.org/licenses/by/4.0/).