Article

Impacts of Multi-Strategy Nitrogen Fertilizer Management on Potato Yield and Economic Gains in Northeast China

1
State Key Laboratory of Efficient Utilization of Arid and Semi-Arid Arable Land in Northern China, Institute of Agricultural Resources and Regional Planning, Chinese Academy of Agricultural Sciences, Beijing 100081, China
2
Collaborative Innovation Center on Forecast and Evaluation of Meteorological Disasters, Nanjing University of Information Science & Technology, Nanjing 210044, China
3
Aerospace Information Research Institute, Henan Academy of Sciences, Zhengzhou 450046, China
4
School of Environmental and Resources Science, Zhejiang A & F University, Hangzhou 311300, China
5
School of Environment, Tiangong University, Tianjin 300387, China
6
Agricultural Information Institute, Chinese Academy of Agricultural Sciences, Beijing 100081, China
*
Author to whom correspondence should be addressed.
These authors contributed equally to this work.
Agronomy 2023, 13(12), 2920; https://doi.org/10.3390/agronomy13122920
Submission received: 1 November 2023 / Revised: 15 November 2023 / Accepted: 20 November 2023 / Published: 28 November 2023

Abstract

:
Differentiated nitrogen (N) application styles and dosages can directly affect crop yield and planting costs. To maximize the efficiency of N fertilizer utilization and solve the problem of increasing production without increasing income, the Decision Support Systems for Agrotechnology Transfer (DSSAT) model was used in this study to carry out experiments simulating different N application styles and dosages for potatoes at 15 meteorological observation stations in the northeast region of China during 2013–2017. The present study aims to analyze the relationship among yield, cost, and net gains under different N fertilizer management scenarios by combining the cost-benefit method. The main conclusions are as follows: (1) the staged and incremental application of N fertilizer during the potato growth period can promote a yield increase. The lowest yield was achieved by a one-time basal application of N fertilizer at sowing, and the highest yield was observed when N fertilizer was applied in a 1:1 ratio at sowing and the end of tuber formation, respectively. (2) The range for N fertilizer application to achieve the highest potato yield at each station is 275–330 kg·ha−1. (3) The highest potato yield under sufficient N application treatments did not correspond to the highest net gains. Potato net gains at all stations showed an increasing-then-decreasing trend with the increase in N application. The highest gains were obtained when 220 kg·ha−1, 220 kg·ha−1, and 275 kg·ha−1 of N fertilizer were applied in a 1:1 ratio as a basal fertilizer and supplementary fertilizer at sowing, and the end of tuber formation in Heilongjiang, Jilin, and Liaoning provinces, respectively. This study provides a reference program for potato planting with the highest benefits for regional governments, farmers, and enterprises and aims to improve the status quo of potato planting, increasing production without increasing income.

1. Introduction

Potato was listed as the fourth-largest food crop, following wheat, rice, and maize, with both vegetable and forage functions [1]. The high-yield cultivation of potatoes can, to a certain extent, guarantee world food security [2]. With advancements in agricultural science and technology, various kinds of functional fertilizers have caused environmental pollution and the problem of increasing production without increasing income while also increasing the level of crop yields [3]. As China’s largest commodity grain base, the three northeastern provinces (Liaoning, Jilin, and Heilongjiang) are advantageous potato production areas [4]. Analyzing the yield and economic benefits of potato in this region under different planting management practices holds great practical significance, which can provide theoretical guidance on potato planting to local governments, enterprises, and farmers, promoting the high-quality development of local agriculture [5].
Crop yield is closely related to crop varieties, field management measures, and environmental factors [6]. The rational use of fertilizers, as an important field management measure, is conducive to increasing crop yield [7]. Potato is suitable for growing in fertile conditions, and its growth and yield are closely related to fertilizer content [8]. During the growth and development of potatoes, the crop continuously draws nutrients from the soil. When soil nutrition is insufficient, timely fertilization is needed to avoid stagnant growth and lowered yields [9]. Nitrogen (N) is a critical factor in promoting the formation of potato yield and quality, being one of the most sensitive elements in the growth process of potatoes [10]. Numerous studies have proven that N fertilization application is an effective way to improve potato yield and quality [3,11,12]. However, there is no consensus on how to apply N fertilizer to achieve more desirable planting results and higher yields.
In terms of the N fertilizer application style (N-AS), some research results show that N fertilizer inputs at different periods increase yield by an average of 6.3% compared to basal applications (applied before sowing). In addition to fertilization at the sowing stage, supplemental application of N fertilizer to potato during the tuber expansion stage can enhance the absorption of fertilizer and increase yield [13]. It has also been shown that applying N fertilizer before the peak plant demand for nutrients, i.e., at the end of tuber formation, replenishes the nutrients required for tuber expansion promptly, providing a superior yield increase [14]. Conversely, it was concluded that the potato yield increased with higher N fertilizer application, while additional N fertilizer at all stages of potato did not result in significant yield increases [15]. On the other hand, it was proven that an appropriate reduction in basal fertilizer inputs and the proper supplementation of N fertilizers can improve yield [16].
Potato yield is not only affected by N-AS but also by N fertilizer application levels (N-AL) [17]. Insufficient N fertilizer results in dwarfed, yellowed potato plants and weakened growth, which in turn affects tuber formation and leads to lower yields [18]. On the contrary, abundant N fertilizer leads to luxuriant plant growth, enhanced photosynthesis, and the increased accumulation of organic matter, which contributes to improving the yield and quality of potatoes [19]. Many studies have shown that the rational application of additional N fertilizer can effectively promote the above-ground growth of potatoes, with yield improving with the increase in N [20,21].
The formulation and optimization of management practices for potato cultivation have become key areas of concern for the government and the agricultural sector [22,23]. For farmers, the number of inputs and the level of income determine their decision to plant potatoes and develop field management practices, which also contributes to the implementation of the potato staple food strategy and alleviation of the pressure on food security [5,24]. Currently, most of the research related to potato planting management concentrates on the suitability of the potato growing environment [25,26], potato growth monitoring, and yield estimation [27,28,29]. The main objectives of this study were (i) to clarify the effects of different N-AS and N-AL on potato yield, (ii) to explore N application strategies for maximizing yield and economic benefits, and (iii) to compare the geographic variability of optimal N fertilizer management strategies.

2. Materials and Methods
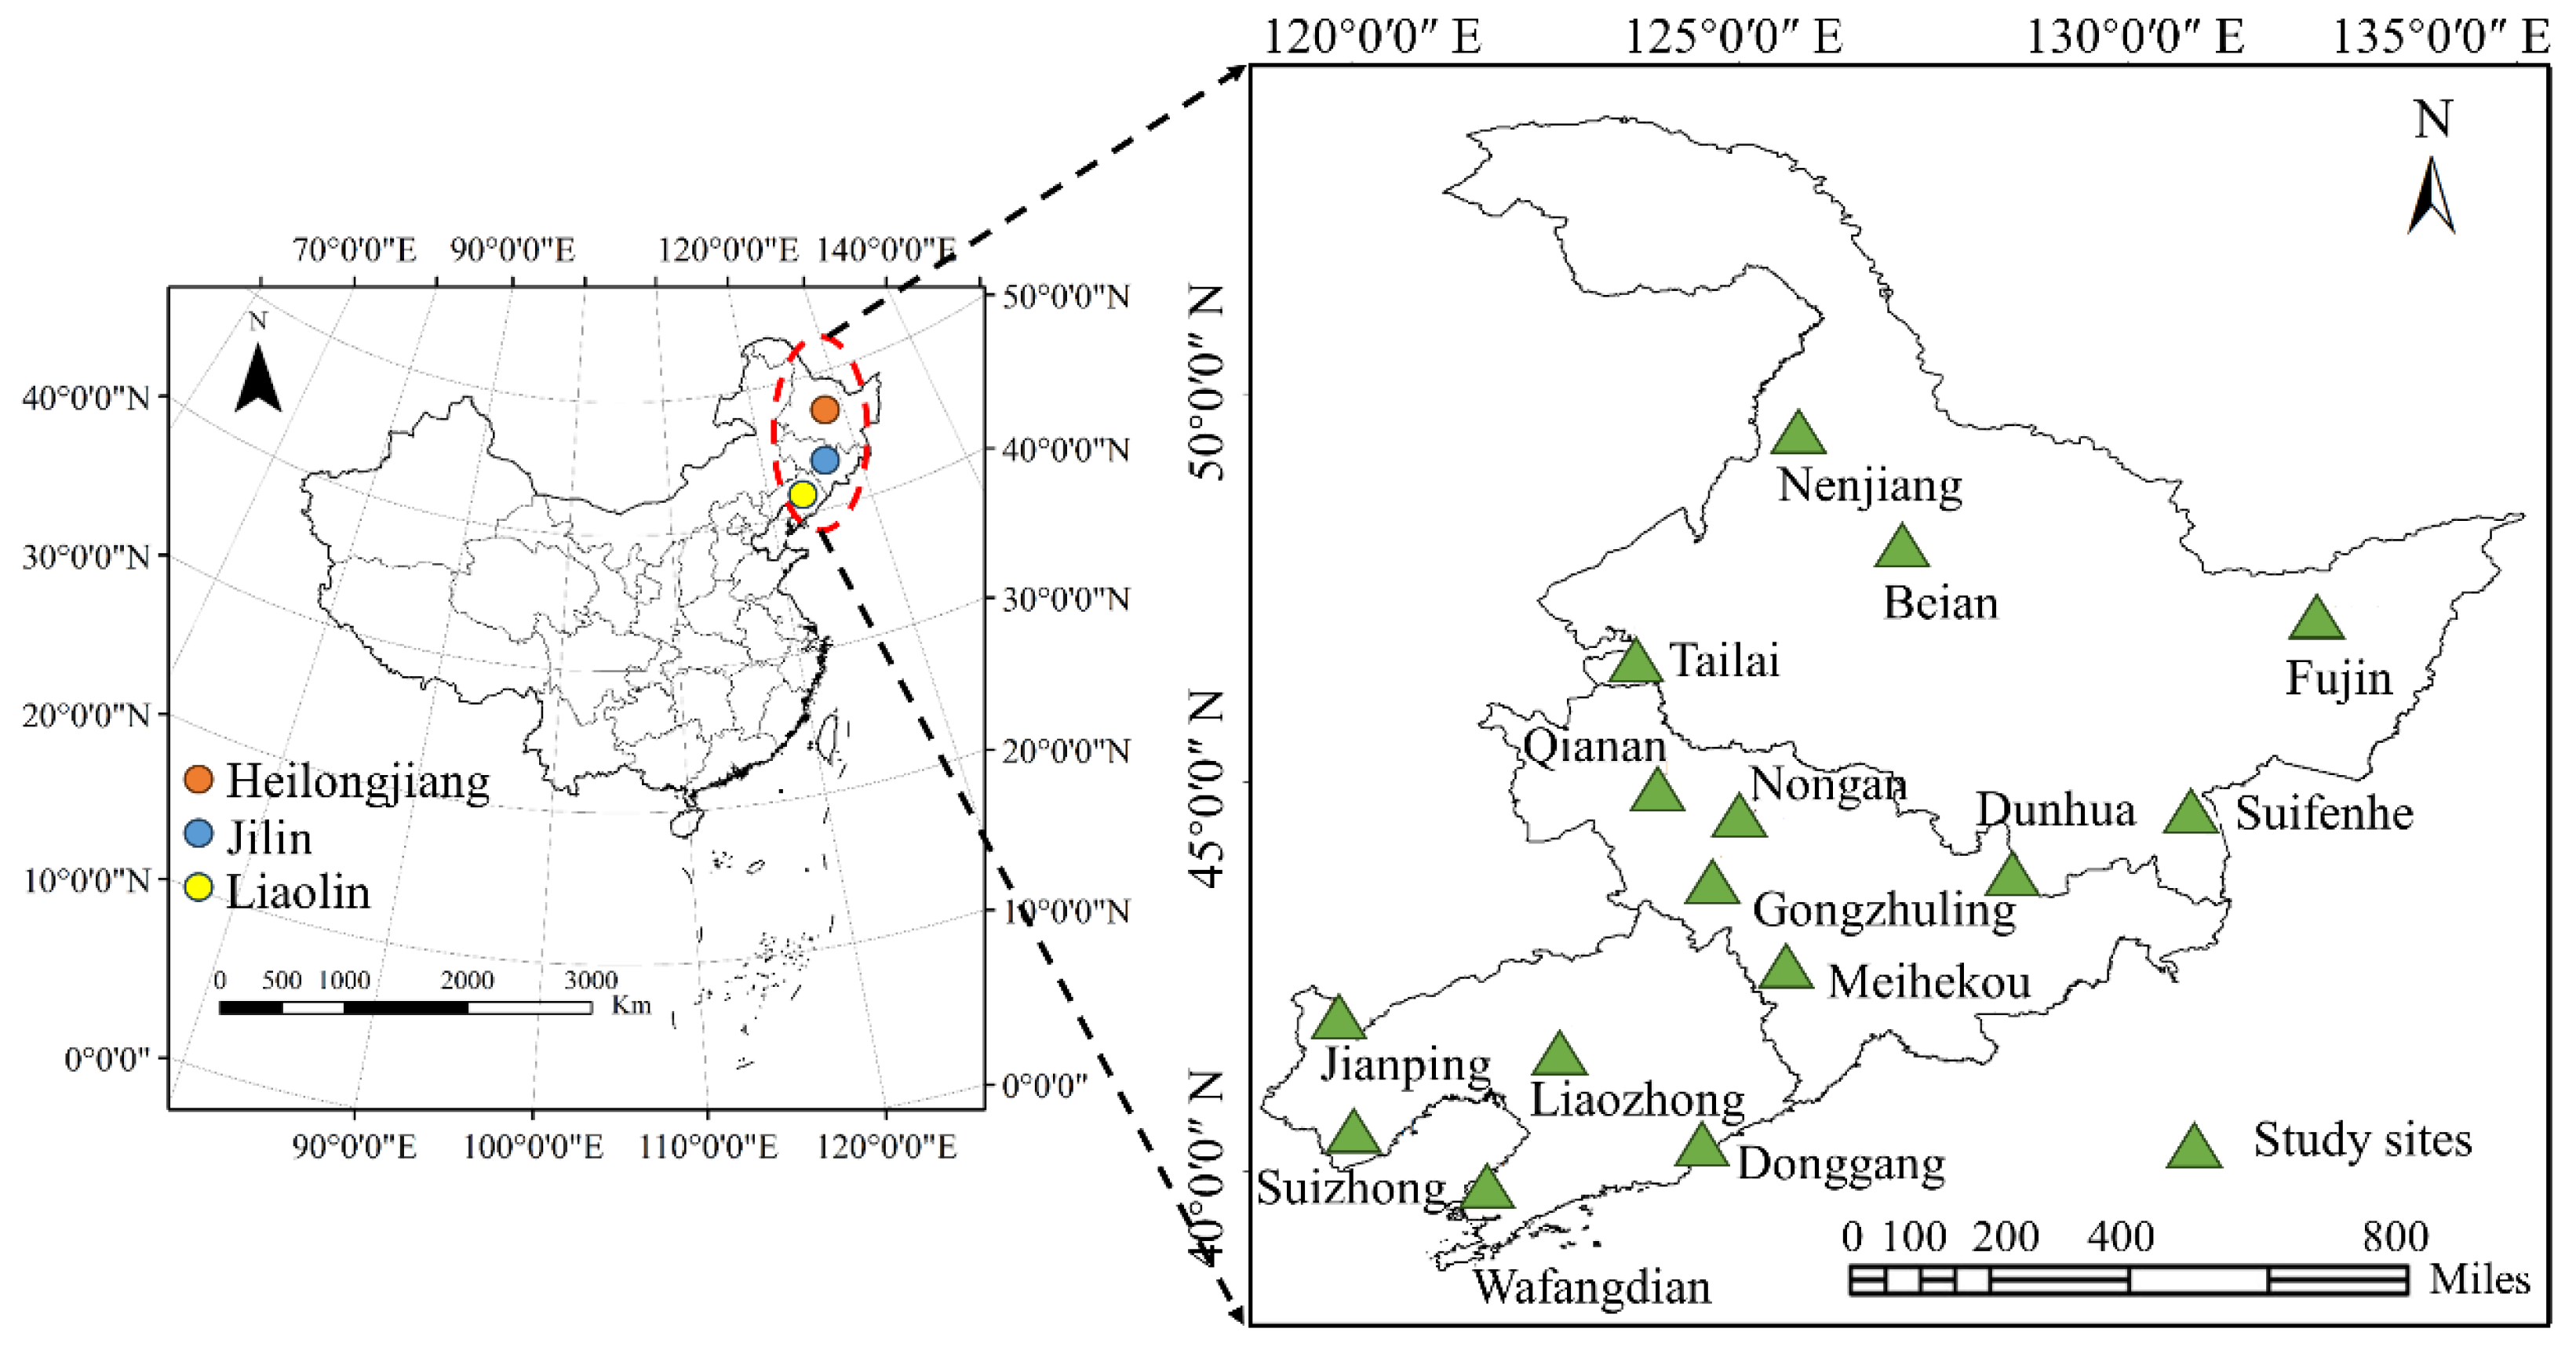
2.1. Study Area

The three northeastern provinces (Heilongjiang, Jilin, and Liaoning) are among the top three black soils in the world. This region is mainly located in the Songliao Plain, the Three Rivers Plain, the pre-mountainous terraces, and the inter-mountainous basins and valleys. The study area is dominated by a temperate continental monsoon climate. Although the latitude is high, most of the area belongs to the temperate monsoon climate zone, with rain and heat at the same time. The region is an important production base for potatoes and one of the most significant potato export destinations in China. In this paper, 15 meteorological observation stations uniformly distributed in potato growing areas in Heilongjiang province (Nenjiang—NJ, Beian—BA, Fujin—FJ, Tailai—TL, Suifenhe—SFH), Jilin province (Qian’an—QA, Nong’an-NA, Dunhua—DH, Meihekou—MHK, Gongzhuling—GZL), and Liaoning province (Donggang—DG, Jianping—JP, Liaozhong—LZ, Suizhong—SZ, and Wafangdian—WFD) were selected as typical stations. The distribution of the stations is shown in Figure 1.

2.2. Experimental Design

In this study, the potato cultivar Yanshu#4, which is widely planted in the northeast region, was selected for simulation experiments with different N-AS and N-AL combination scenarios. The N fertilizer applied in this paper was urea (chemical formula CH4N2O, with an effective N content of 46%). Urea was applied in four types: all basal (CK1); basal + the end of tuber formation (1:1) (M1); basal + the middle of tuber expansion (1:1) (M2); and basal + the end of tuber formation (3:1) (M3). The N fertilizer application amount was set at eight levels (0 kg/hm2 (CK2); 55 kg/hm2 (L1); 110 kg/hm2 (L2); 165 kg/hm2 (L3); 220 kg/hm2 (L4); 275 kg/hm2 (L5); 330 kg/hm2 (L6); 385 kg/hm2 (L7)). As shown in Table 1, the experiments include a total of 32 treatment groups. The CK1 treatment is the control group of N-AS, and the CK2 treatment is the control group of N-AL.

2.3. Data Sources and Processing

2.3.1. DSSAT-SUBSTOR Model

The SUBSTOR model was developed based on the CERES cereal crop model, which simulates a total of five phenological stages of potato, including sowing to germination, germination to sprout elongation, sprout elongation to tuber formation, tuber formation to tuber expansion, and tuber expansion to harvesting of tubers [30]. The outputs of the SUBSTOR potato crop growth model include 12 metrics, such as tuber fresh weight, tuber dry weight, total weight, tuber N content, and maximum N content [31]. In this study, the localized results were used as the genetic parameters of the crop varieties of Yanshu#4, and the parameter adjustment region was located in Changchun City, Jilin province. The mean relative error (MRE) was adopted as the standard to evaluate the applicability of the DSSAT model by comparing the differences between the simulated and measured values of seedling emergence date, tuber initiation date, maximal LAI value, and yield [32].
The minimum meteorological datasets required for the DSSAT model operation include day-by-day maximum temperature (°C), day-by-day minimum temperature (°C), day-by-day precipitation (mm), and day-by-day radiation (MJ·m−2·d−1). In addition, the latitude, longitude, and elevation of the weather station are required. The radiation is converted based on the number of hours of sunshine (h). The meteorological data required for this study were obtained from the China Meteorological Administration Scientific Data Sharing Service Network (http://www.cma.gov.cn/, accessed on 24 August 2023) and were imported and saved through the Weather Man module. The soil data required for the DSSAT-SUBSTOR potato crop growth model mainly include the basic soil hydraulic and nutrient parameters such as soil bulk weight (g/cm3), saturated water content (g/cm3), field water-holding capacity (g/cm3), cation exchange (cmol/kg), organic carbon content (%), wilting coefficient, organic matter content (g/cm3), and soil pH. The necessary soil data were obtained from the measured data of each experimental station and the China Soil Database (http://vdb3.soil.csdb.cn/, accessed on 24 August 2023). The soil data were imported and saved through the SBuild module provided by the DSSAT model. Field management data mainly include crop varieties, sowing methods, amount and date of fertilizer, and irrigation. An area of 700 m2 was set up in each experimental site for management, and the first deep loosening and shallow soil cultivation should be carried out after the flush of seedlings, with a sowing depth of 22 cm, a plant spacing of 30 cm, and a sowing density of 60,000 plants/hm2. All potatoes were sown on 2 May and harvested on 24 September, with a uniform rehydration rate of 2250 m3/hm2 at the early stage of tuber formation. The field management data of the present study was based on the experiment, and the data were input and saved with the help of XBuild module provided by DSSAT.

2.3.2. Potato Cultivation Cost Data

In this study, the experiment was set up at 15 weather stations with a total of 32 treatments at each station. The required seed potato amount and labor time were uniform across treatments at each station, except for eight gradients set for N application, i.e., different amounts of urea. According to the results of the field research, the amount of seed potatoes per hectare was set at 3000 kg, the labor time was calculated according to four labor days, and all costs were calculated according to the current year’s prices in the affiliated places (the prices of potatoes and seed potatoes were from the China Potato Network (http://www.potato.agri.cn/, accessed on 24 August 2023), the National Wholesale Agricultural Product Market Price Information System of the Ministry of Agriculture (http://pfscnew.agri.gov.cn/, accessed on 24 August 2023), and the price of urea and the price of labor days from the National Compendium of Agricultural Products).

2.3.3. Economic Gains Model

Cost-benefit theory is a common analytical approach in microeconomics that can be used to analyze and evaluate the relationship between benefits and costs [33]. In this paper, the economic gains from potato yield are equal to the gross benefit from potatoes minus the total input cost, which is calculated by the Formula (1).
Eb = GP − TC,
where Eb and GP are economic benefits and gross gains, respectively. In this study, the gross gains from potatoes were defined as potato yield multiplied by the price of commercial potatoes. TC is the total costs (CNY), which refers to the cost of engaging in potato cultivation, including the costs of N fertilizer inputs, seed potato inputs, and labor costs.

3. Results

3.1. Effects of Nitrogen Fertilizer Management on Potato Yields

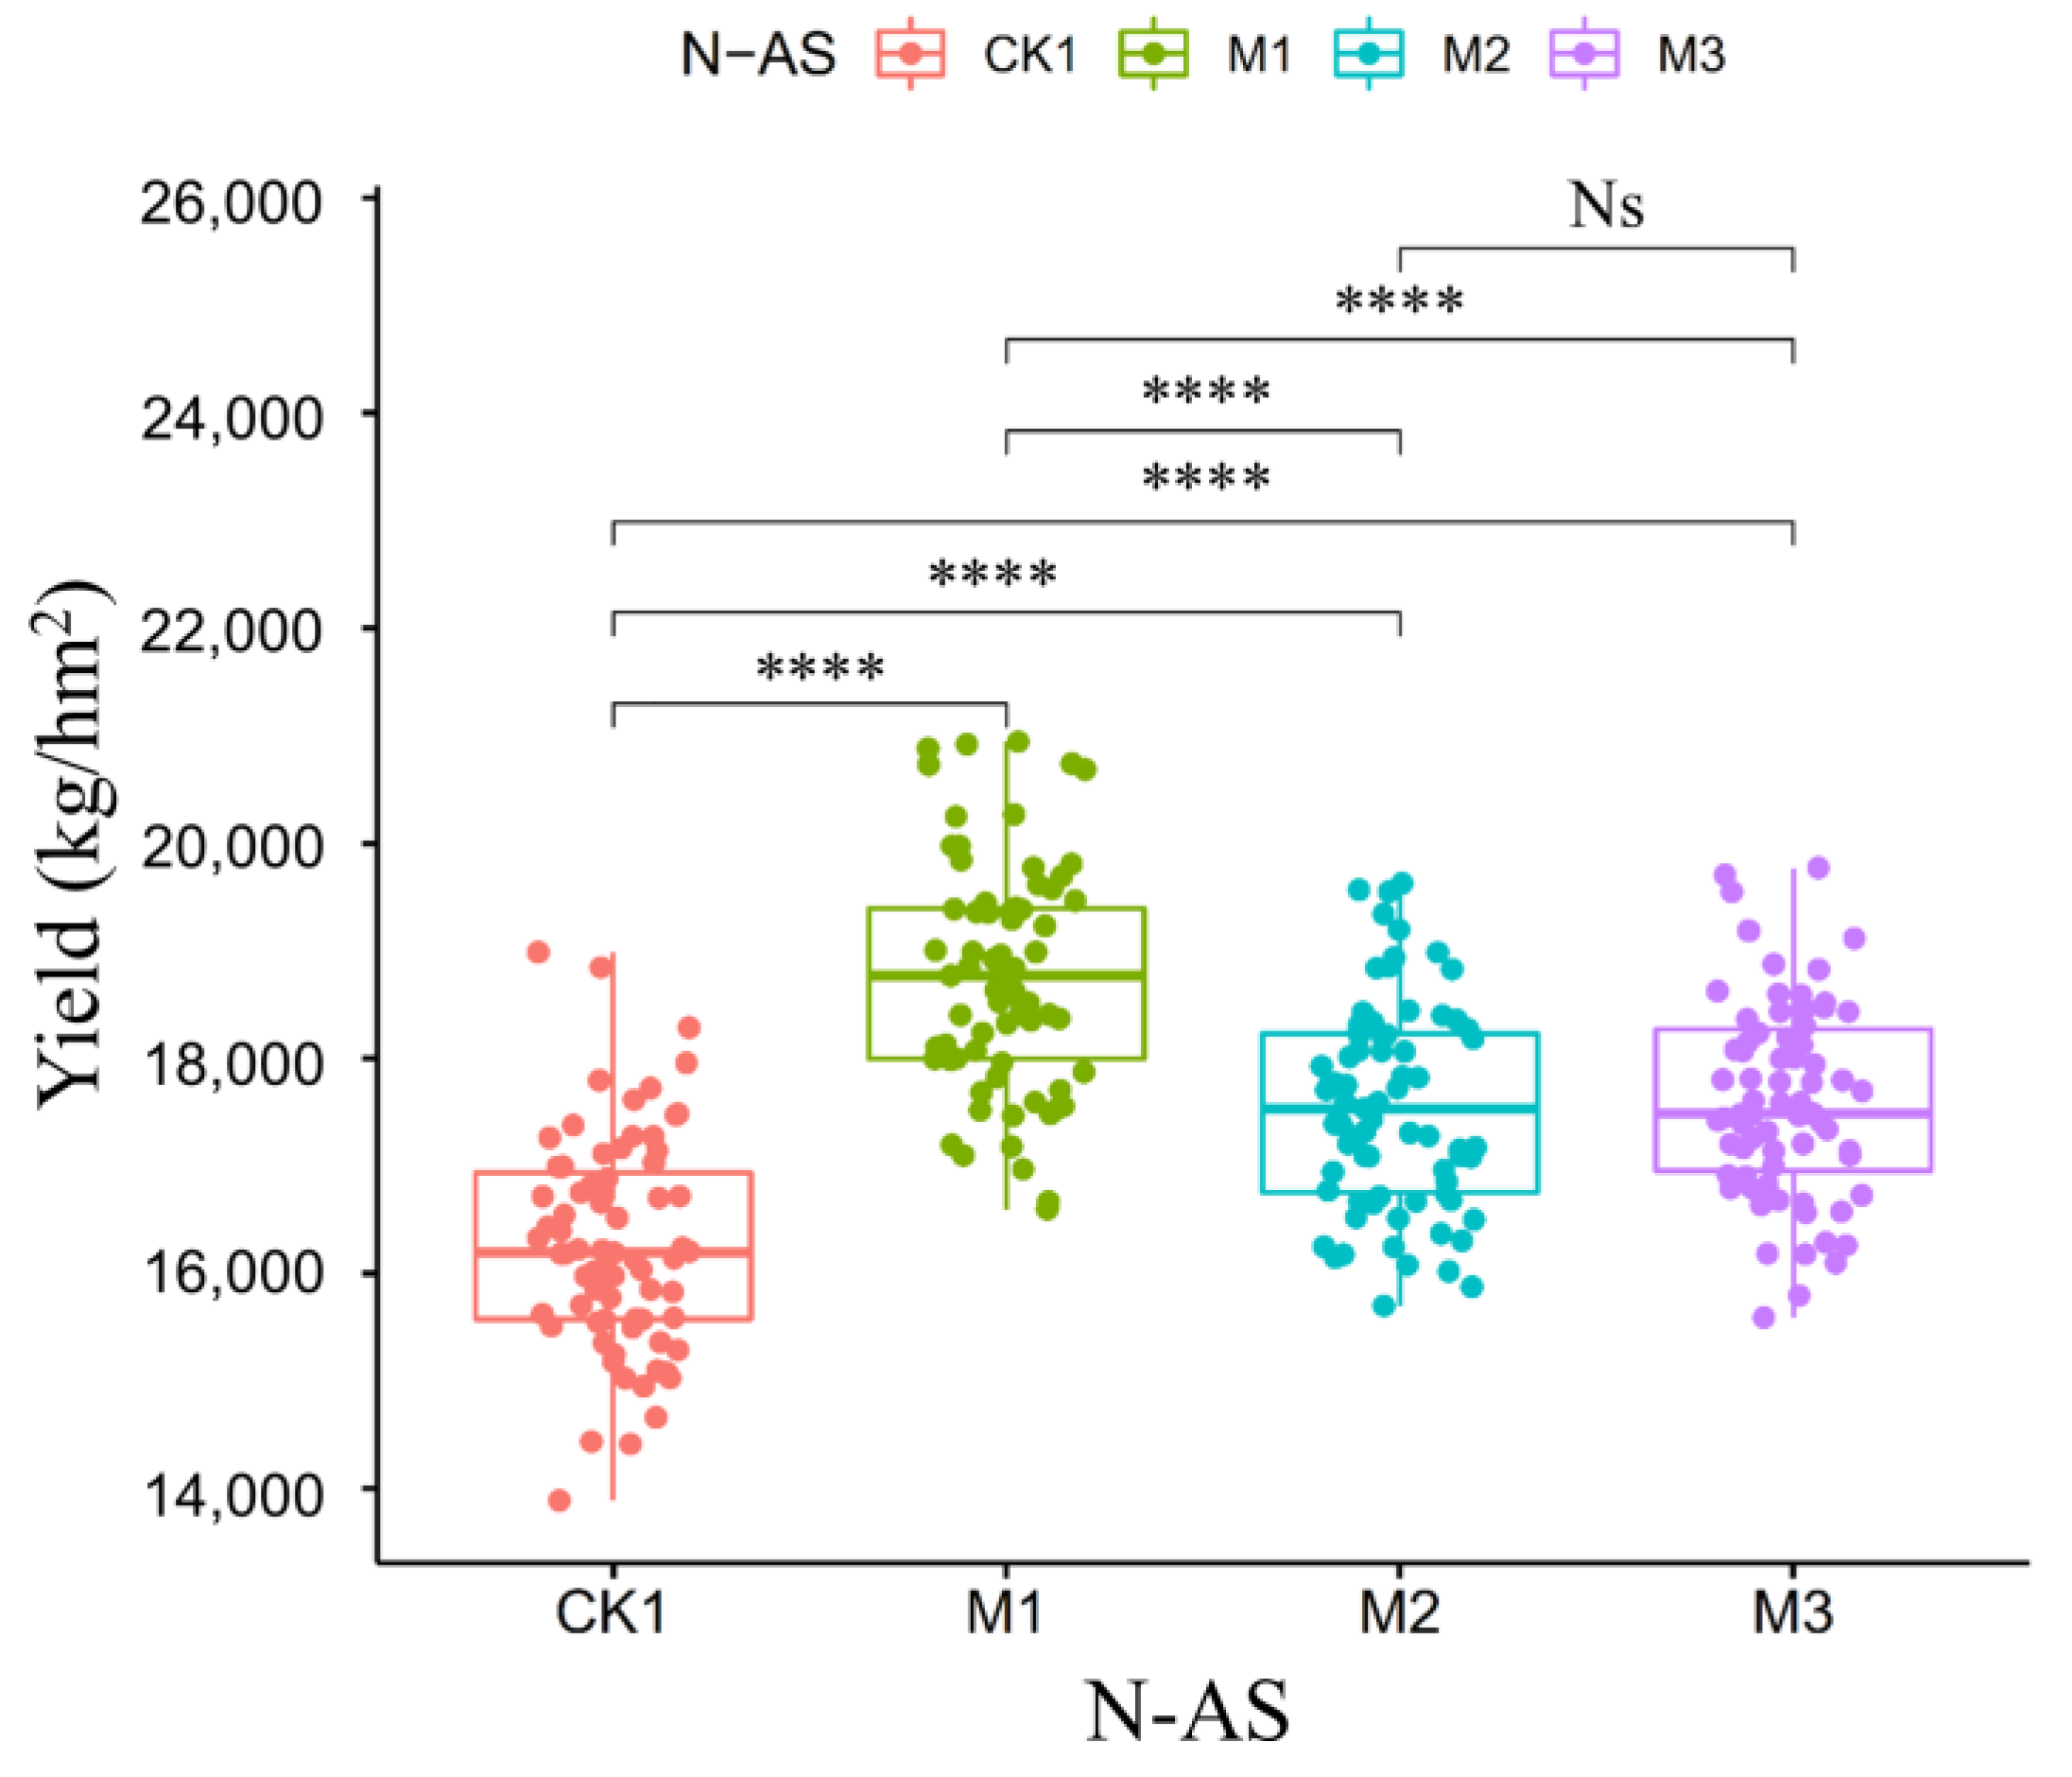
3.1.1. Effects of N-AS

The yield data of potatoes under four different N-AS treatments were analyzed, and the results are shown in Figure 2. It can be seen that potato yields under the M1 treatment were the highest. Compared with CK1, there was a significant increase in potato yields under M1, M2, and M3 treatments (p < 0.001). In addition, there was less difference (p > 0.05) in potato yields under the M2 and M3 treatments. The above results showed that compared with the treatment of total basal application, the application of N fertilizer at different stages could promote the increase in potato yields, and the greatest yield increase was achieved by basal application at the time of sowing and supplementary application at the end of tuber formation with a ratio of 1:1. The yield increase in the 1:1 application at sowing time and at the middle of tuber expansion was closer to that of the 3:1 application at sowing time and at the end of tuber formation.

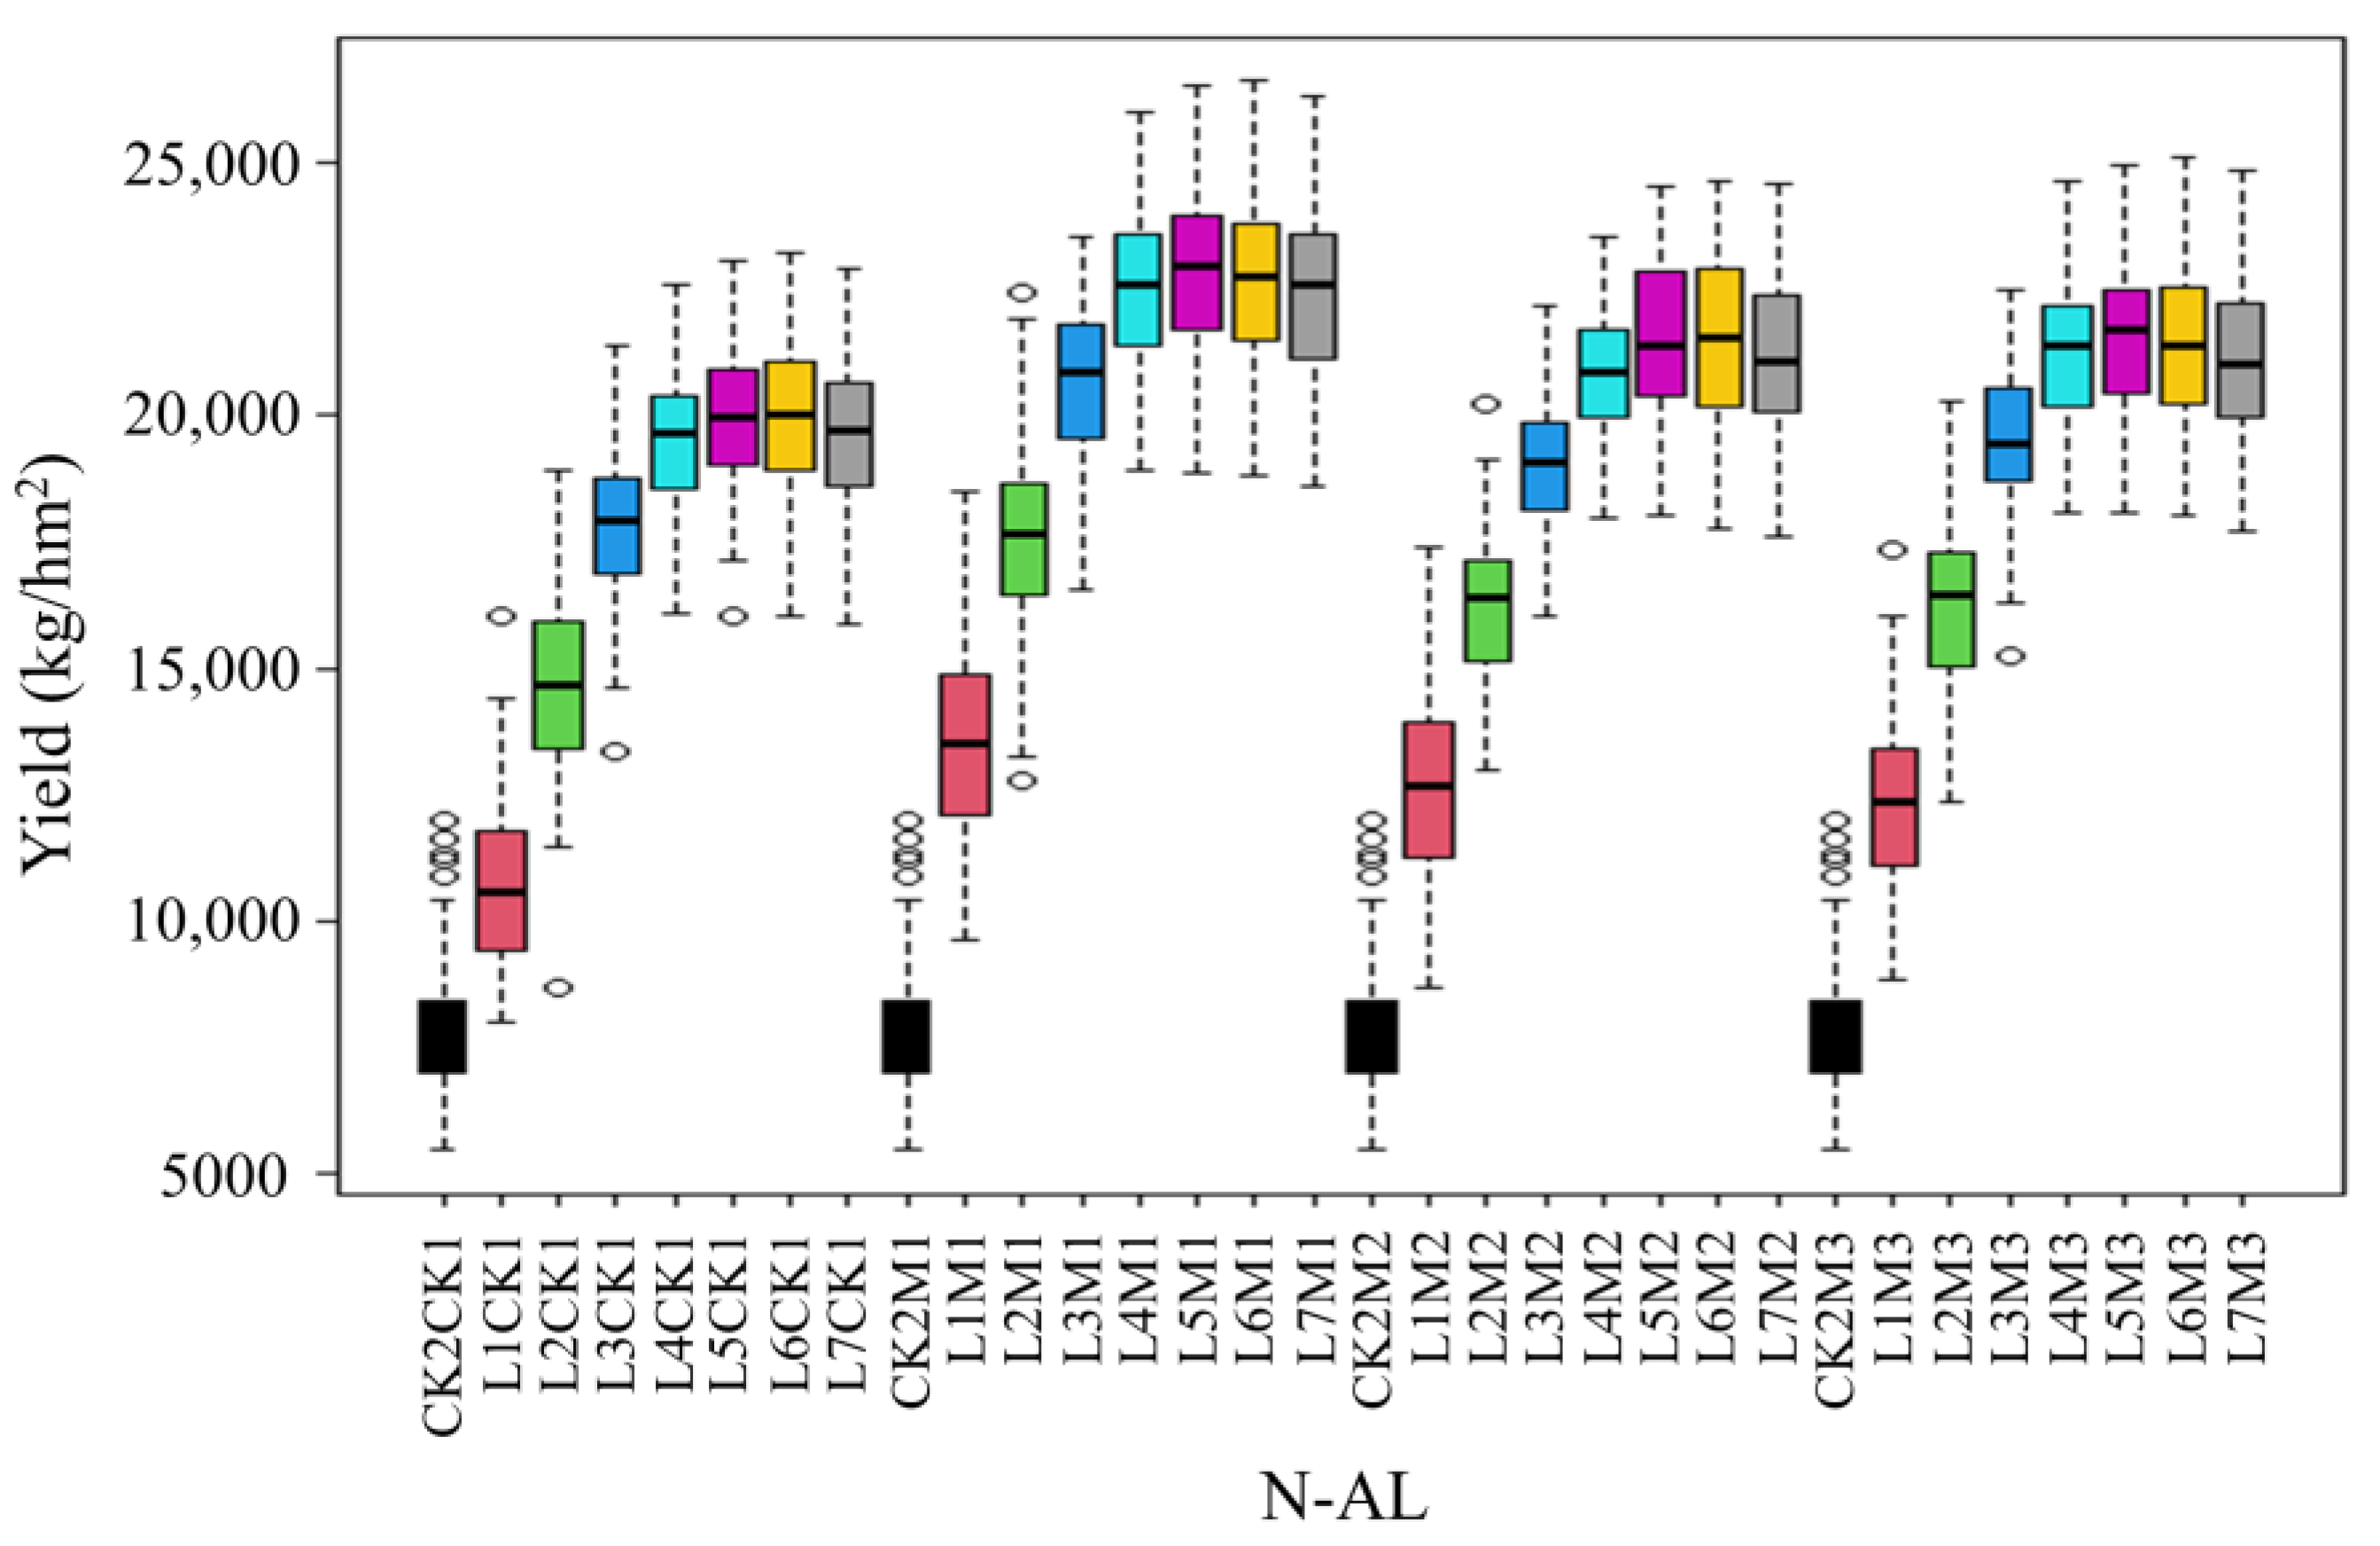
3.1.2. Effects of N-AL

The potato yield data under different N-AL treatments were analyzed, and the results are shown in Figure 3. Figure 3a shows the results of the comparison of overall potato yields under different N-AL treatments at all stations, and the yields under the seven different N-AL treatments reached a highly significant difference level compared with CK2. The above results indicated that the amount of N applied had a significant effect on yield. The L5 treatment reached the highest value of yield, and the four N fertilizer gradients, L4, L5, L6, and L7, showed small differences in yield increase. The statistic analysis of potato yield data at each station under seven different N-AL treatments was performed, and the results are shown in Figure 3b. It is observed that the simulated yield results of each station are consistent with the overall simulated yield results, which indicates that increasing N fertilizer dosage can significantly improve potato yields. When the N fertilizer dosage reaches the L5 gradient, i.e., 275 kg/hm2, the yield reaches the highest value. And when the N fertilizer dosage continues to increase, the yield gradually decreases instead. The yield under the treatments of L4~L7 can reach a higher value, and the range of its N fertilizer dosage is 220–385 kg/hm2.

3.1.3. Effects of N-AS and N-AL Interactions

Figure 4 illustrates the impacts of various N-AS and N-AL interactions on potato production and demonstrates the major influence of the interaction effect on potato output. This demonstrated that the highest yield was obtained under the M1 treatment and that the yield first increased and then progressively decreased with increasing N application. This pattern was consistent with the yield effects of N-AS and N-AL alone on potato yield. Nonetheless, a minor variation in the amount of N applied was observed, which corresponded with the decline in yield. For instance, under all M1 treatments, the highest potato production was found in L5, whereas under M2 treatments, the best yield was found in L6.
Figure 5 displays the matching N-AS and N-AL for the potatoes that had the maximum yield in the research area from 2013 to 2017 at various stations. It demonstrates that the M1 treatment produced the maximum potato yield among the various N-AS and that L4, L5, and L6 produced the highest yield at various stations or in different years among the various N-AL conditions.
Of all the stations and years, almost 5% of the stations had the highest yield under L4 conditions, whereas under L5 and L6 conditions, roughly 51% and 44% of the stations had the highest yield of potatoes, respectively. Among the various provinces, the M1L4, M1L5, and M1L6 treatments at the stations in Heilongjiang province were able to obtain the maximum potato production, accounting for 8%, 60%, and 32% of all N application treatments. In Jilin province, M1L5 accounted for 56% of all applied N treatments, which yielded the maximum yield, while M1L6 accounted for 44%. The percentages of M1L4, M1L5, and M1L6 treatments in all applied N treatments that corresponded to the maximum yield in Liaoning province were, respectively, 8%, 40%, and 52%. According to the aforementioned findings, potatoes are better suited in northeast China for applying N fertilizer at the L5–L6 level and in the M1 way.

3.2. Effects of Nitrogen Fertilizer Management on the Economic Gains of Potato

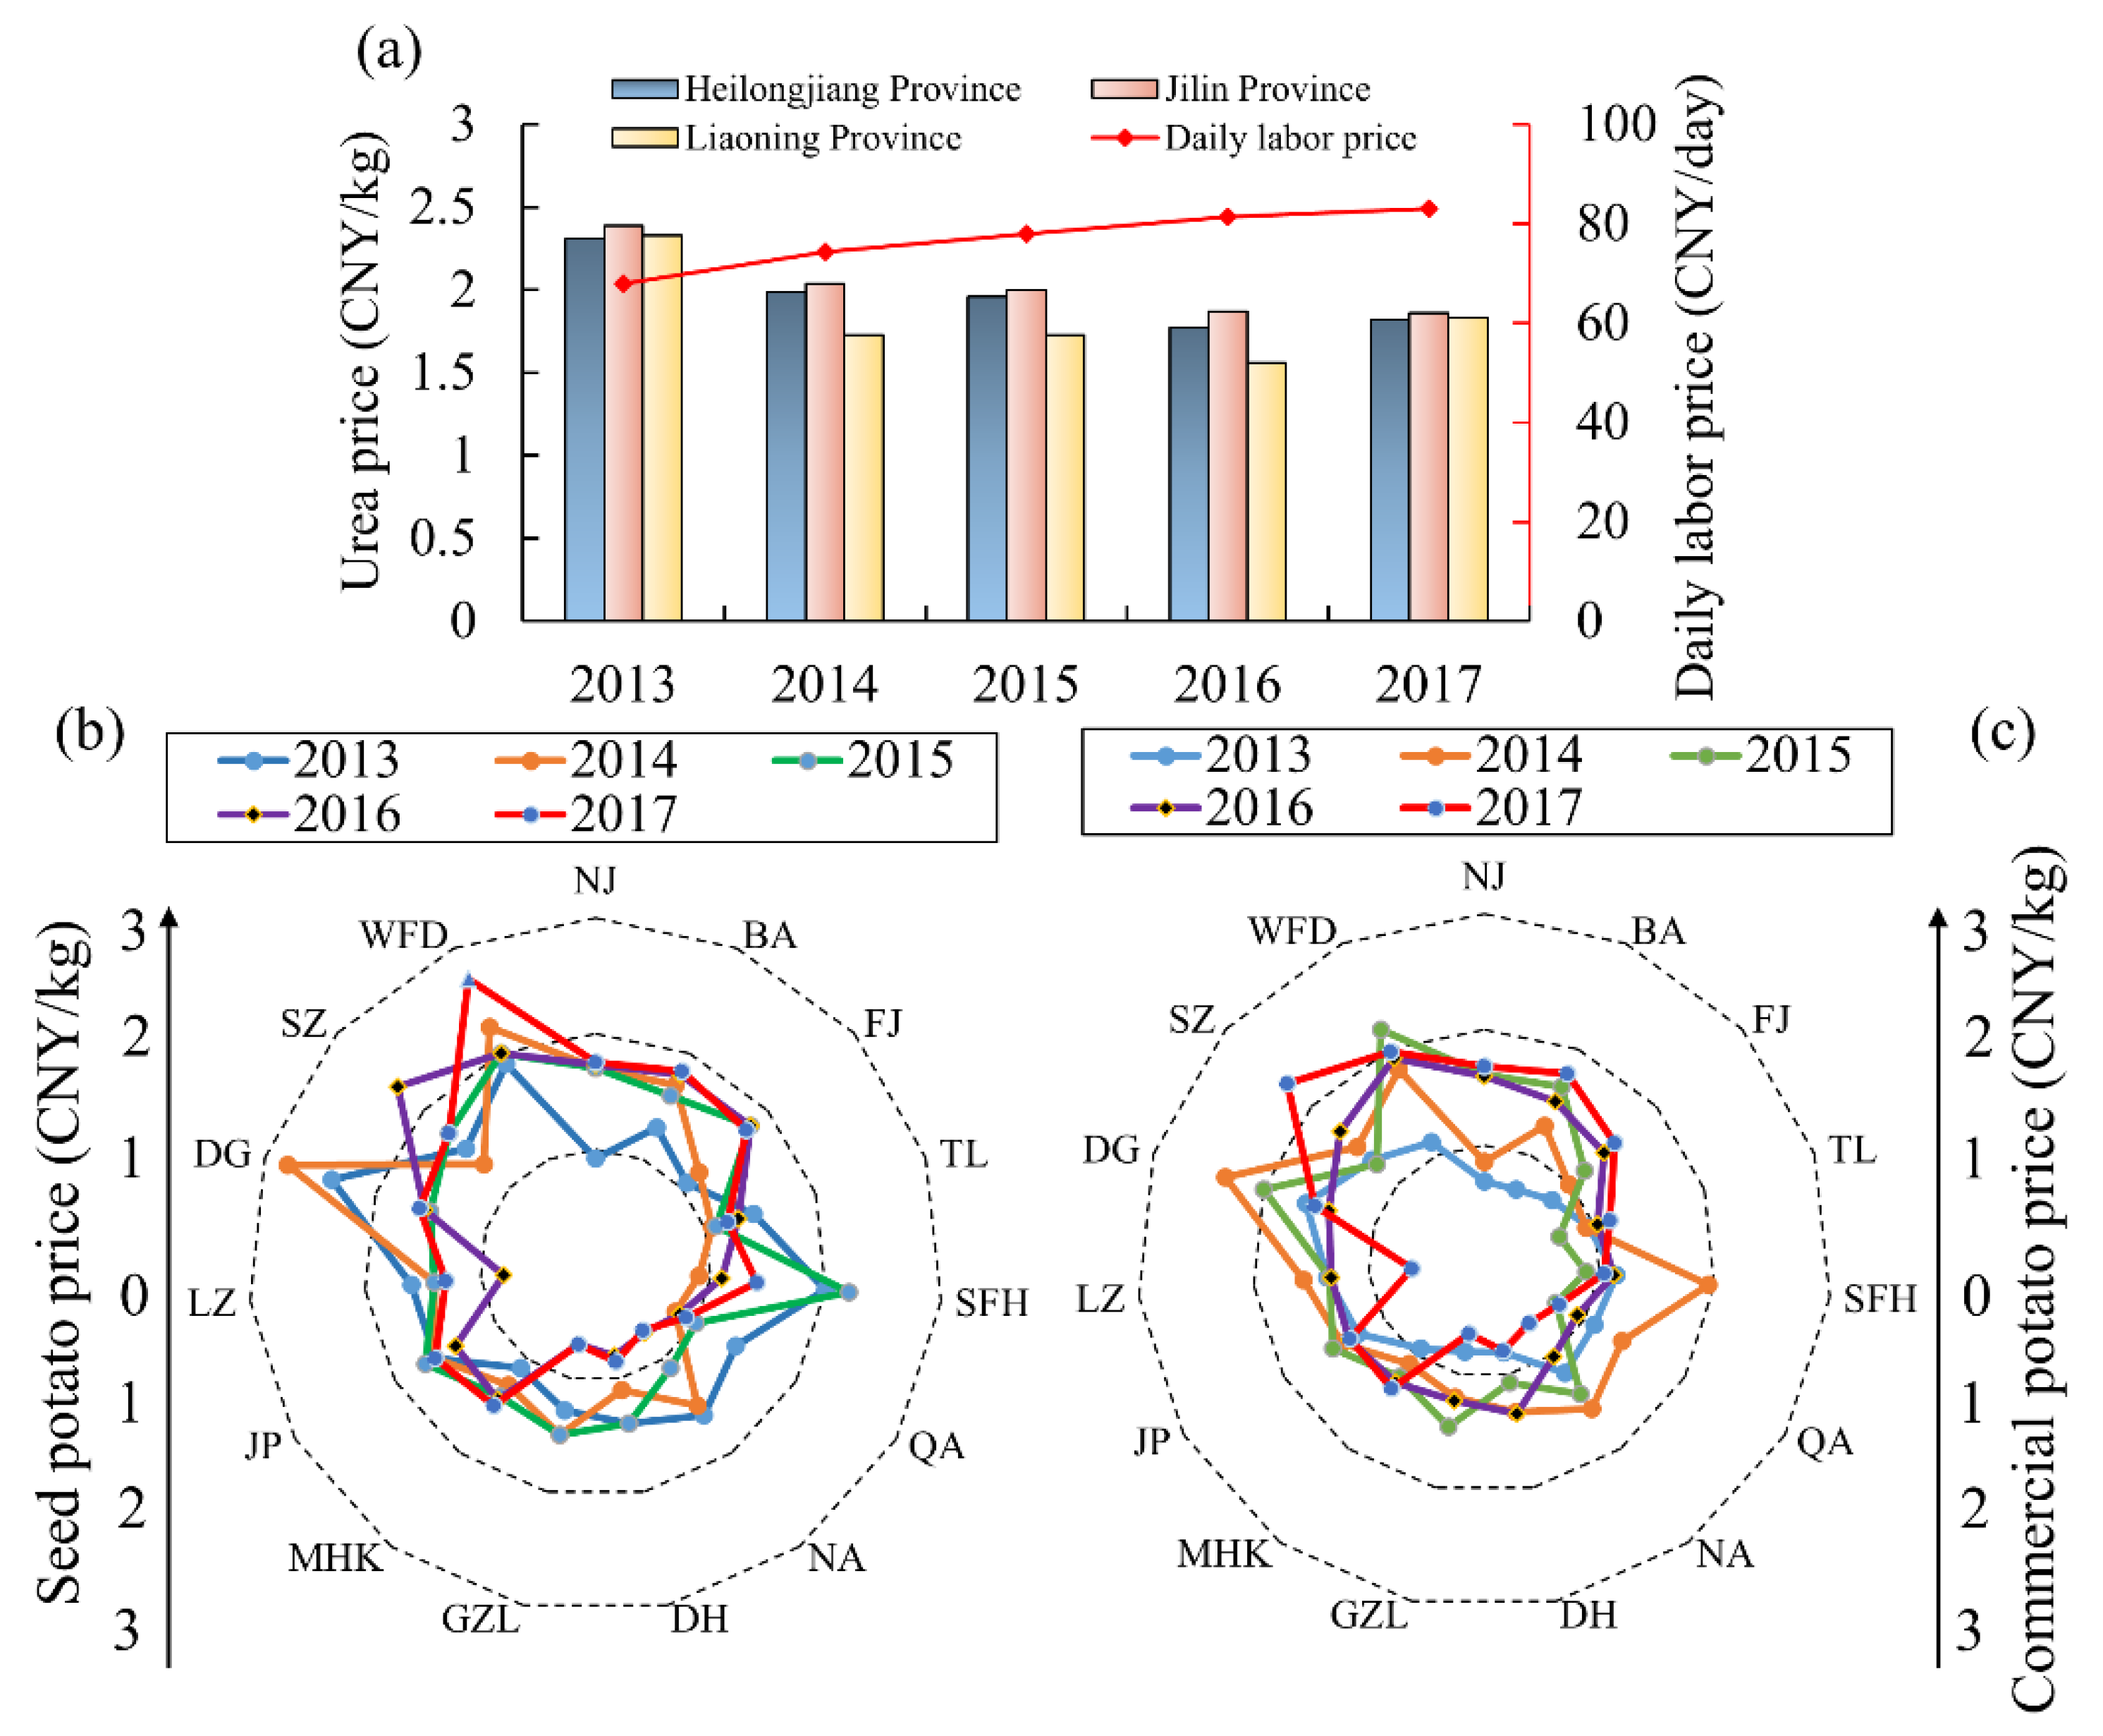
3.2.1. Potato Planting Costs

The cost price of planting potatoes (including labor, fertilizer, and seed potato costs) and the selling price of commercial potatoes, whose inter-annual and inter-regional patterns are displayed in Figure 6, are the primary elements influencing the economic benefits of potatoes. Figure 6a shows that labor prices are rising gradually but at a very tiny amplitude. The three provinces’ urea levels differ somewhat from one another and exhibit less variation over time. The prices of commercial and seed potatoes at each station throughout various years are shown in Figure 6b,c. For the majority of stations, it has been discovered that these two costs vary just slightly over the course of a year, with a smaller number of stations showing more significant variations.

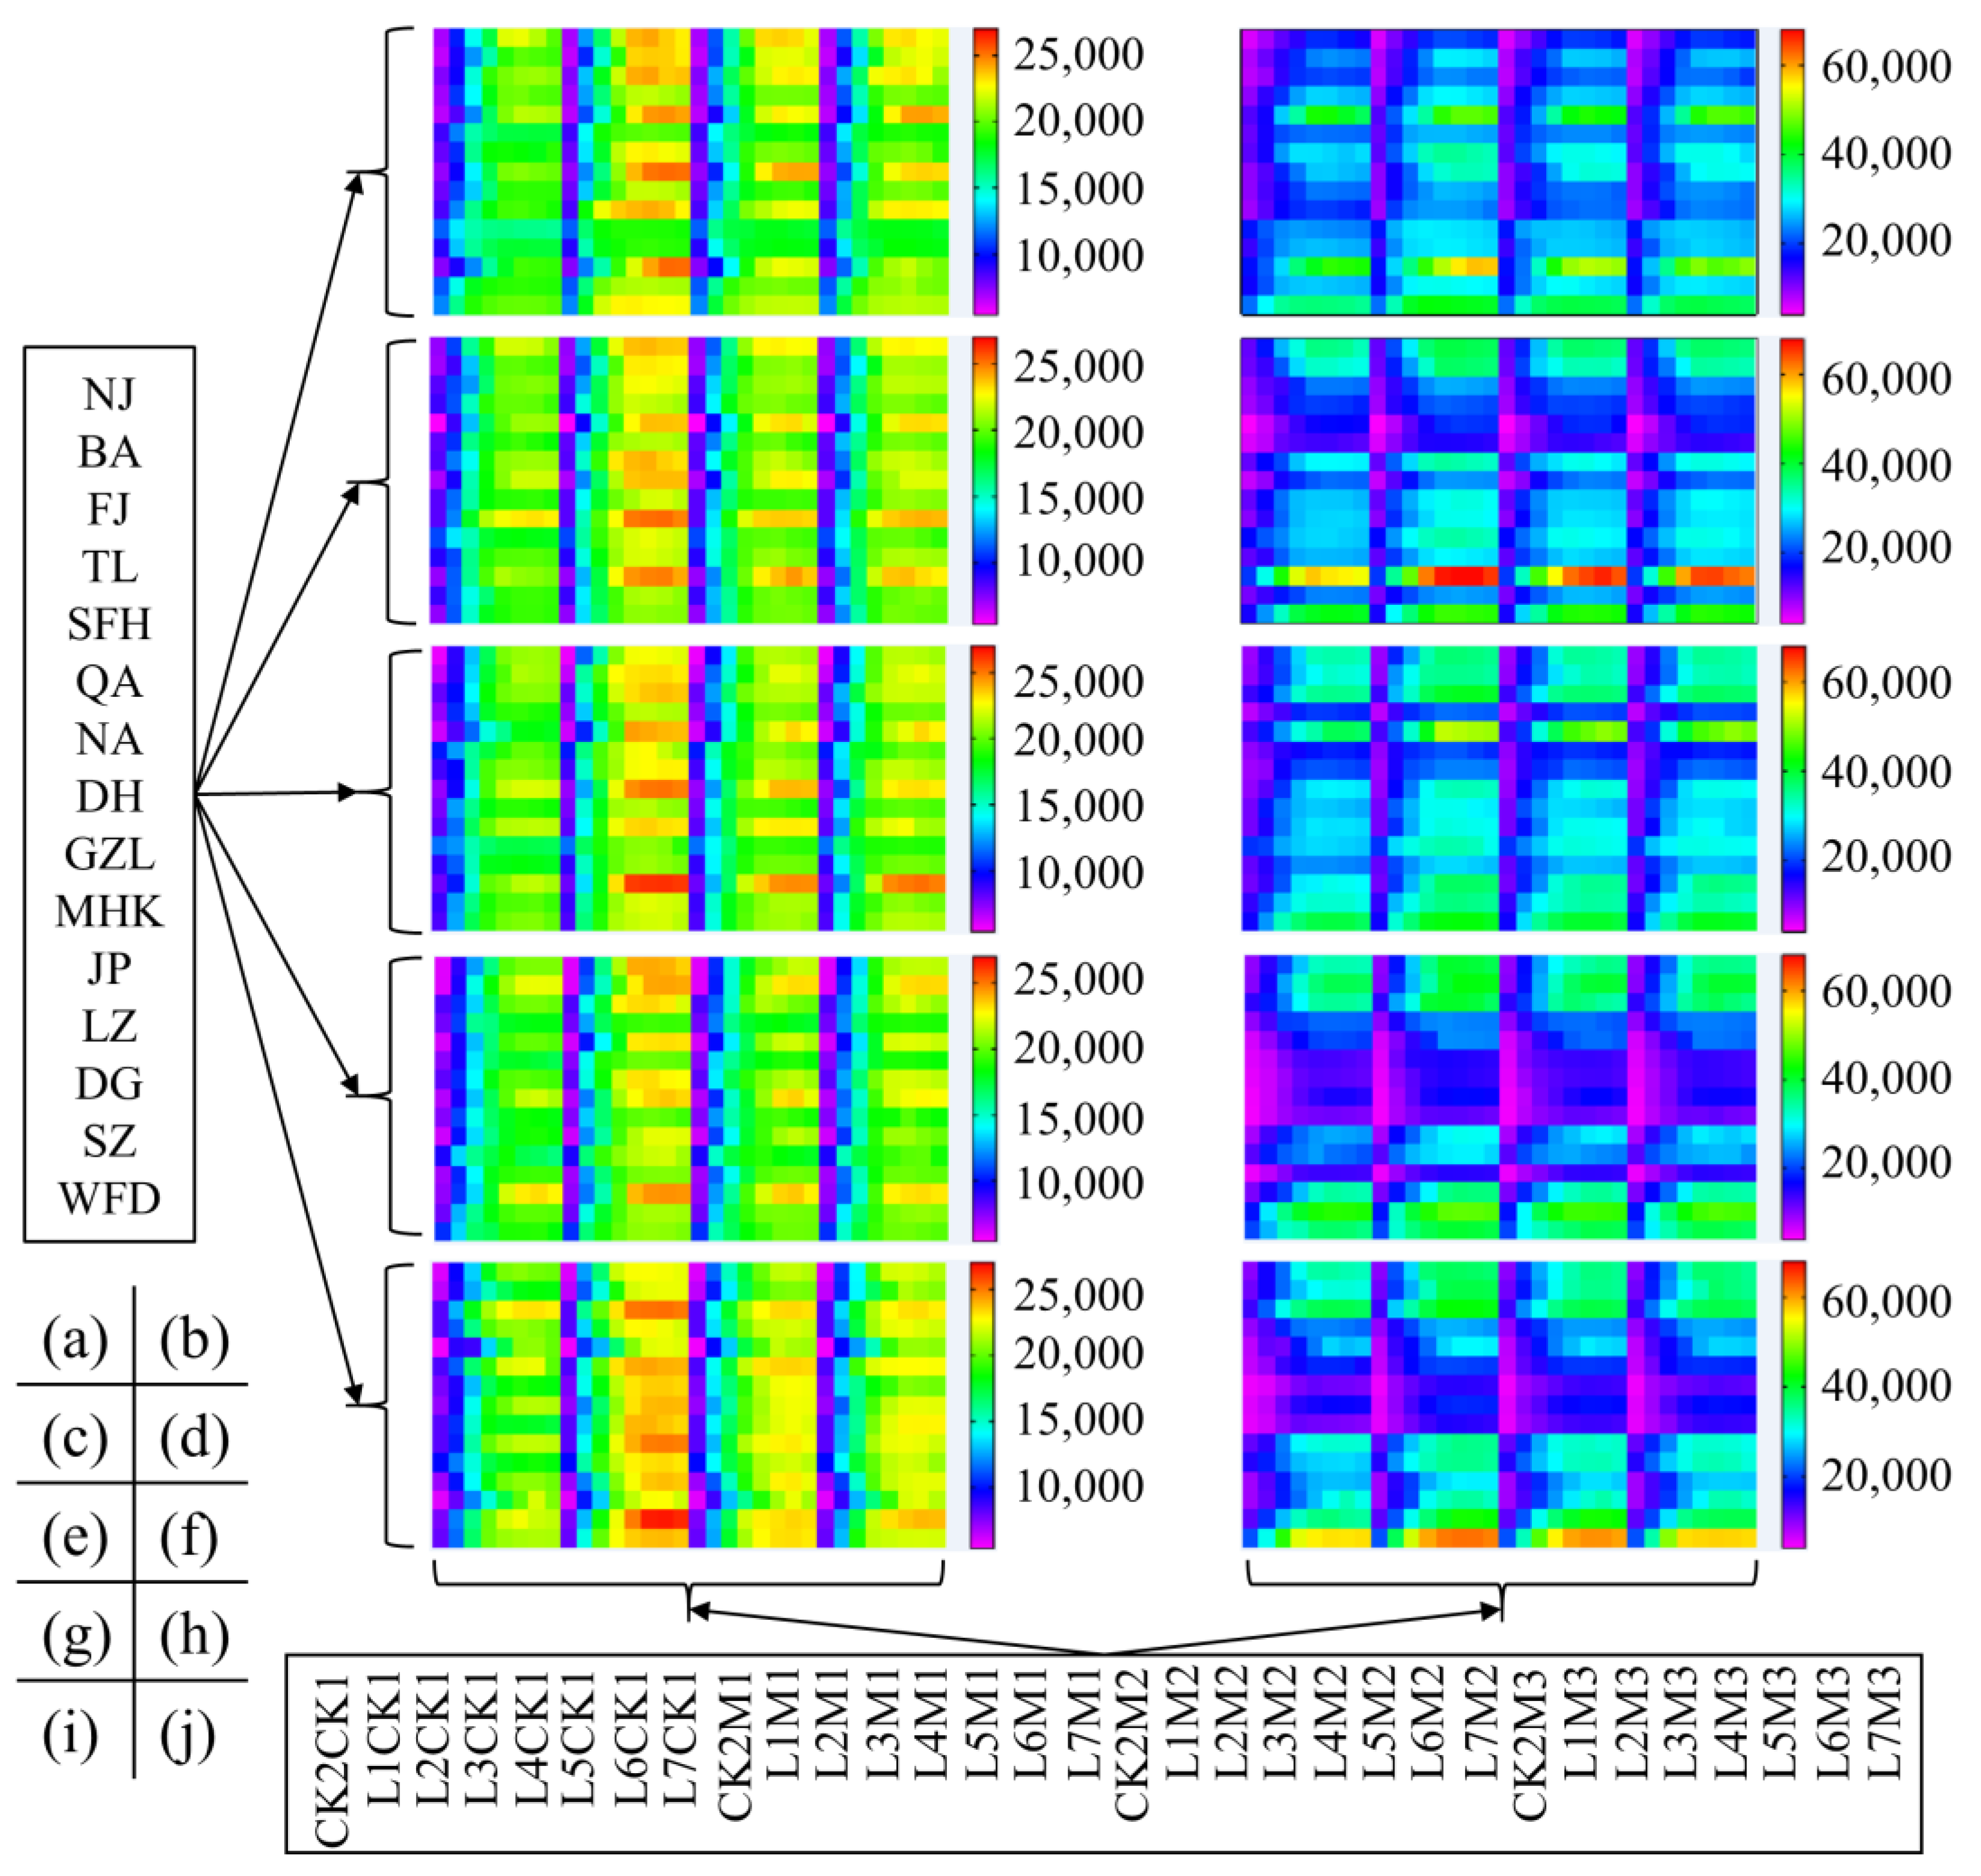
3.2.2. Changes in Potato Yield and Net Gains under Different Nitrogen Fertilizer Management Conditions

In the northeastern region of China, experiments were conducted from 2013 to 2017 on potatoes under various N-AS and N-AL interaction treatments. Thirty-two different modes of N application treatments were applied to each station. The net potato gains under all the N application treatments in the experiments at each station were calculated by combining the cost of potato production in each region (as shown in Figure 6). Figure 7 displays the yield of potatoes and the corresponding economic benefits for each location across various years. Potato yield is displayed in the left column of the heat map in Figure 7, while the corresponding economic gains are displayed in the right column. A variety of values are represented by different hues, where bigger values are indicated by colors closer to red and smaller values are indicated by colors closer to purple.
Comparison with the control trial (CK1) revealed that among the four N-AS, the lowest net gains of potatoes under all basal application treatments corresponded to the lowest potato yield, suggesting that the improved fertilizer application promoted potato yield and, thus, increased net gains. In addition, the benefits under the M1 treatment were higher than those under the other three N-AS treatments. There was no great difference between the benefits under the M2 and M3 treatments, but the benefits of the above three N-AS were higher than those under the CK1 treatment. Comparison with the control experiment CK2 reveals that under each N-AS treatment, the potato economic returns gradually increased with the increase in N-AL, basically consistent with the changing trend of potato yield with the increase in N-AL, which illustrates that the application of N fertilizer helps to enhance the potato yield, thus increasing the economic gains.

3.2.3. Analysis of Differences in Net Potato Gains in Northeastern China

For different provinces, the net gains of potatoes under different treatments in the three northeastern provinces varied, and the minimum net gain, maximum net gain, and maximum growth rate were calculated for each station in different years; the results are shown in Table 2, Table 3 and Table 4.
The net gain of potatoes under all the non-N application treatments at each station in Heilongjiang province is notable, i.e., the range of the minimum net gain is 4226.40–14,500.00 CNY, the range of the maximum net gain under N application treatments is 18,799.66–52,030.41 CNY, and the average value of the maximum net gain at each station is 32,953.02 CNY. The minimum growth rate of net gains under the N application treatment was 126%, and the maximum was 345% compared with the non-N application treatment, with an average increase rate of 241%. In Jilin Province, the net gains of potatoes under all the non-N application treatments at each station ranged from 4646.90 to 12,250.04 CNY, and the highest net gains under the N application treatments ranging from 12,443.05 to 35,693.64 CNY, with the mean value of the highest net gains at each station at 24,614.22 CNY. The minimum value of the increase rate of net gain of the N application treatments was 120% compared to that of the non-N application treatments, and the maximum value was 259%. The average increase rate of gains was 193%. In Liaoning province, the range of net gains from potatoes under all non-N application treatments at the stations was 5010.00–22,271.70 CNY, and the range of maximum net gains under N application treatments was 14,907.91–66,923.81 CNY, with a mean value of the maximum net gains of 37,527.89 CNY at each station, and a minimum net gain rate of 64%, a maximum of 289%, and an average of 164%.
Overall, within the northeastern region from 2013 to 2017, the maximum net gain of potatoes was 52,030.41 CNY, and the average of the maximum net gain across stations was 31,698.38 CNY, with the highest mean value of the maximum net gain of potatoes in Liaoning province, followed by Heilongjiang province, and Jilin province.

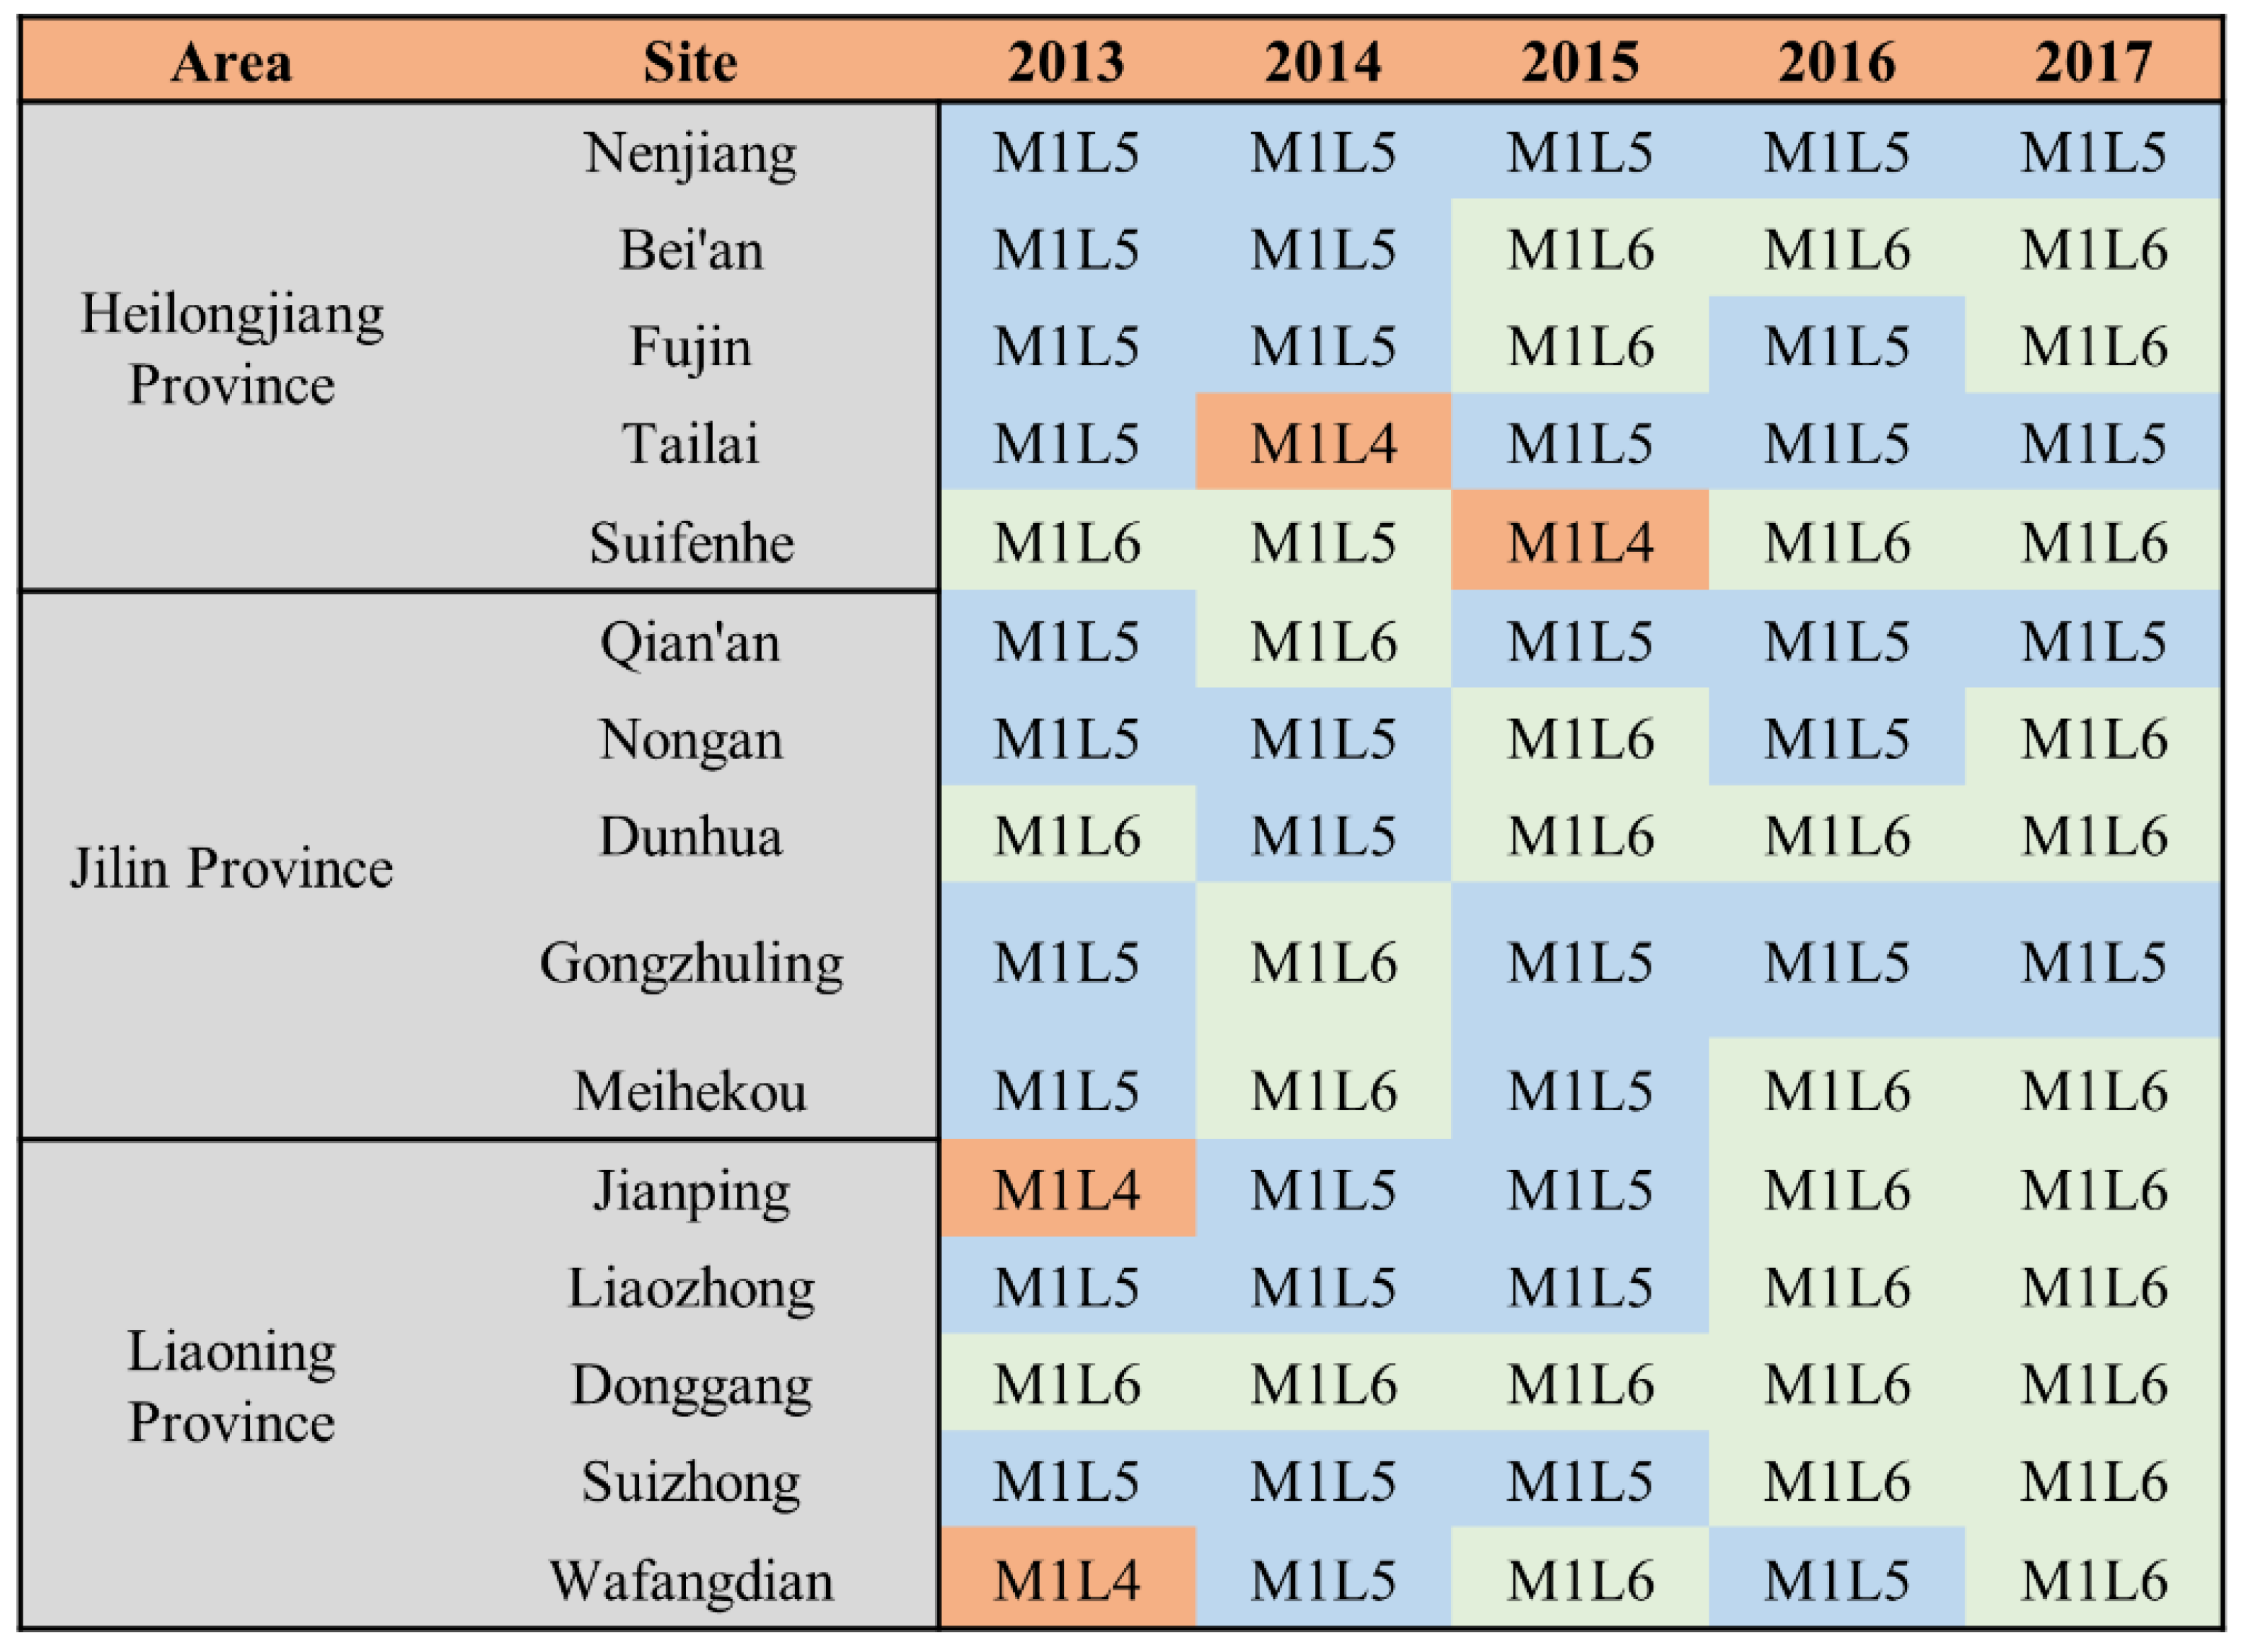
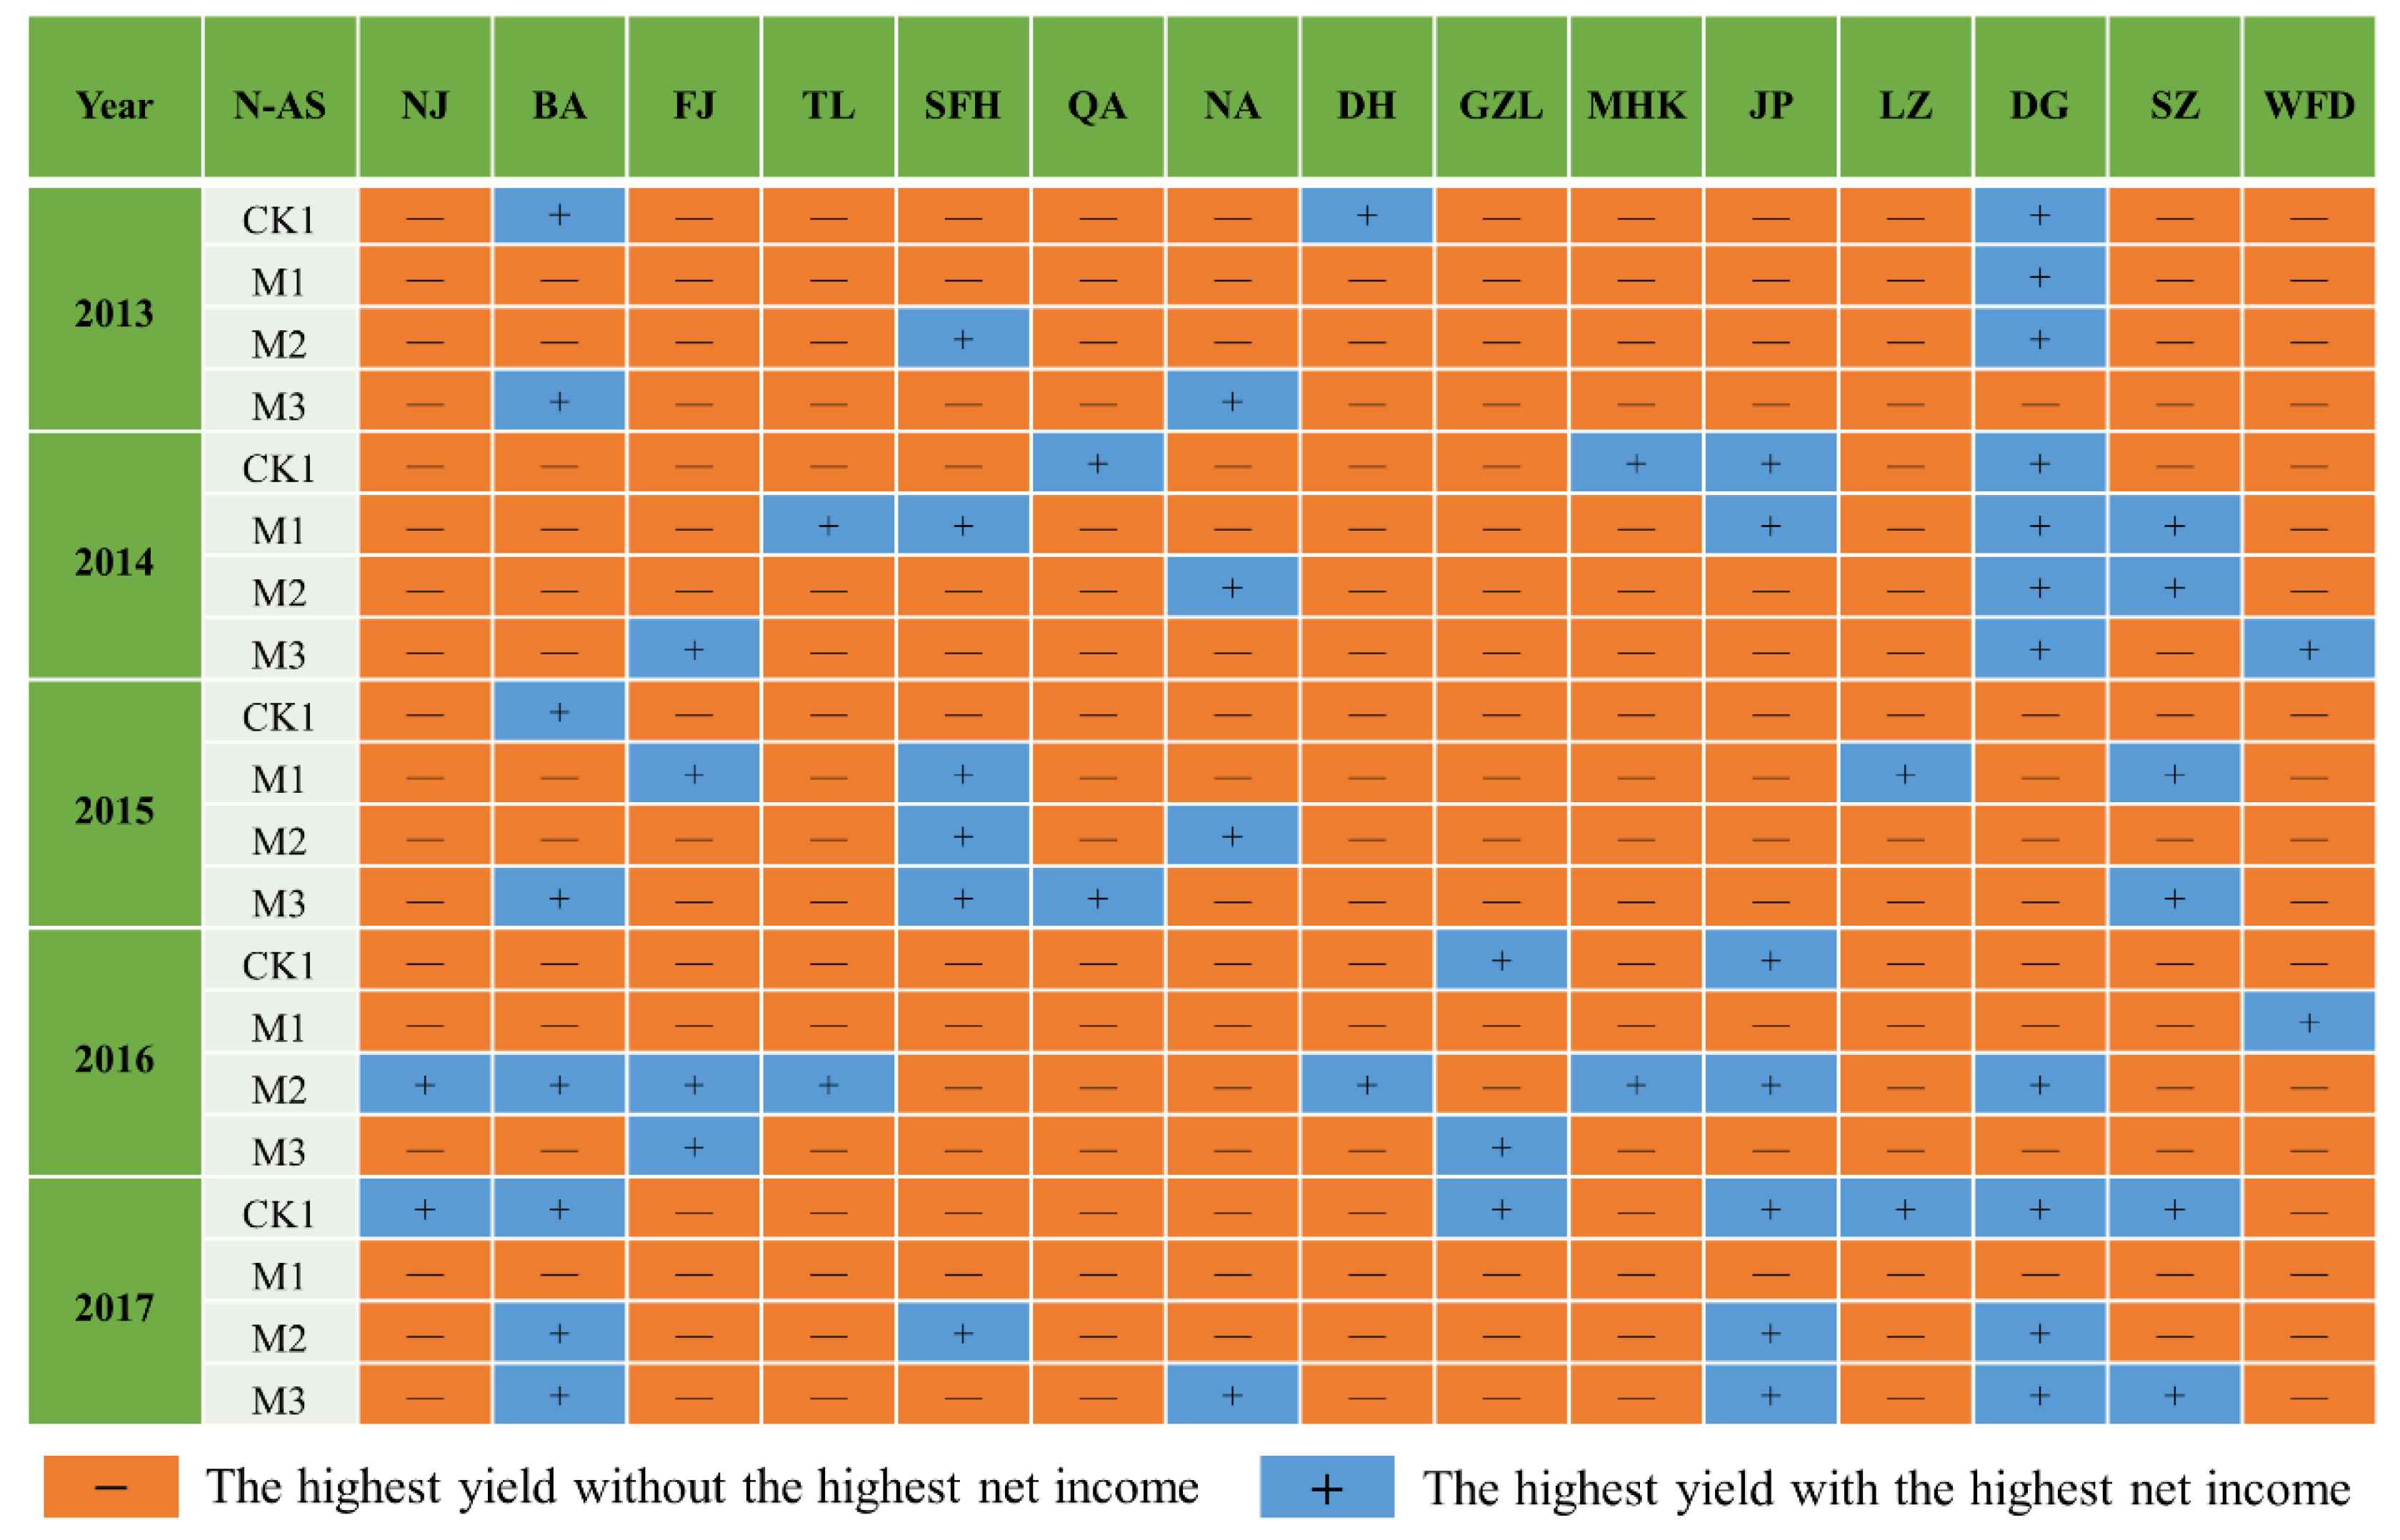
3.3. Nitrogen Application Decisions for Potato

In the northeast, a total of 15 meteorological stations were chosen for N fertilizer trials, with four distinct N application methods tested at each location. There were a total of 20 treatments on N application styles at each location across the five-year experiment period. In the northeast, there were 300 experimental cases in all, and there were eight N application levels for every N application style. In the spatial arrangement of the 300 experimental instances, it was discovered that 79% of the cases did not receive the maximum profits when the highest yield was attained. This information is based on data on the relationship between the highest potato yield and the highest net gains in different cases (Figure 8). Heilongjiang, Jilin, and Liaoning provinces accounted for 78%, 87%, and 71%, respectively. This phenomenon suggests that the failure to obtain the highest net gains at the time of the highest potato yield is not a fortuitous event and that the scenario with the highest percentage of N application treatments corresponding to the highest net gains among all sites in each province can be considered as a reference for the future development or adjustment of potato field planting management decisions in that province.
As shown in Figure 5, in 2013–2017, the N application treatments corresponding to the highest net gains of potatoes among the sites in the three northeastern provinces differed slightly. Among all the treatments corresponding to the highest net gains within the sites in Heilongjiang province, the M1L4 treatment accounted for the largest share, with a weighting of 76%, the M1L5 treatment accounted for 20%, and the M1L6 treatment accounted for 4%. The largest share of all treatments corresponding to the highest gains within each site in Jilin province was also the M1L4 treatment, with a weight of 68%, and the M1L5 treatment, with a weight of 32%. The largest share of all treatments corresponding to the highest gain within each site in Liaoning province was the M1L5 treatment with a weight of 60%, M1L4 with a weight of 28%, M1L3 with a weight of 8%, and M1L6 with a weight of 4%. The study found that the best field management program for potato cultivation produced the highest gains. Treatments M1L4, M1L4, and M1L5 were the best field fertilization management programs for potato cultivation in Heilongjiang, Jilin, and Liaoning provinces, respectively.

4. Discussion

Farmland management has traditionally included N fertilizer management as a critical component. Through crop model simulation, the impacts of N fertilization on potato yield were elucidated in this work, thereby validating the theory and range of applications for N application in potatoes both domestically and internationally. The nutrient intake of potatoes was seen to steadily decrease in the middle and late phases of growth. The peak fertilizer need for potatoes has not yet been met by supplemental fertilizer. An excessive amount of N fertilizer supplementation will cause above-ground stem and leaf extension, often known as the “greedy green” phenomenon. This has an impact on the leaves’ ability to photosynthesize efficiently, which hinders the timely movement of nutrients from the above-ground to the tubers. In this case, the accumulation of dry matter is reduced, leading to limited tuber expansion and lower yield [9]. Therefore, it is necessary to reduce the N fertilizer application at this stage, which also verifies the experimental results that the potato yield decreased due to the treatment of M2. It was thought that increasing the N application led to an increase in the potato’s leaf area, number of leaf blades, and chlorophyll content, as well as an acceleration of photosynthesis. These factors eventually increased the amount of dry matter accumulation in the tubers and increased yield. [34]. However, by depriving the subterranean tubers of nutrients necessary for growth, an overabundance of N fertilizer can cause an overgrowth of above-ground stems and leaves. This event could result in reduced yield, an imbalance in the allocation of dry matter, and delayed potato production. [34,35]. Consistent with the findings of other studies, the current study also revealed that potato production at greater doses of N application displayed a decreasing tendency.
The potato plant is grown for food as well as for financial gain [36]. Thus, while considering its yields, attention should also be paid to the economic benefits. In this study, we examined the effects of various N application treatments on potato yield in China’s northeast and determined the most effective way to apply N fertilizer to increase potato yield and economic gains. Potato yields under M1, M2, and M3 treatments were found to be higher than those under CK1 treatment; therefore, it was determined that administering N fertilizer in the form of "basal application + supplementary application" might increase potato yields. Among them, the M1 treatment’s net benefits exceeded those of the other three N application techniques, and adding more N fertilizer could significantly boost the gains when compared to applying no N at all, which was in line with other research findings. [37,38]. The experimental findings demonstrated that when N application increased, potato net gains first progressively climbed before starting to decline. Additionally, when too much N fertilizer was used, the increase in yield did not balance the rise in planting costs; therefore, the net gains declined under the excessive N application treatment. This means that the net gains obtained at the maximum yield were frequently not the highest [39]. This illustrates that pursuing the highest yield may not be in the best interest of farmers [40]. In real production, achieving the highest yield requires careful consideration of the expenses associated with nitrogen treatment, as high yields and large economic gains are frequently not satisfied at the same time.
The elements influencing the economic benefits of potatoes in different regions and sites may differ due to differences in management and cost levels in terms of spatial layout, which is affected by natural conditions, resource endowment, economic base, and other factors [41]. For this reason, it is crucial to investigate the regional heterogeneity of potatoes under multi-scenario management conditions. In this study, it was found that the highest potato yield could be achieved by applying 275–330 kg/hm2 of N fertilizer in Heilongjiang, Jilin, and Liaoning provinces. And when the application amount continued to increase, it would lead to a decrease in yield, providing theoretical support for the differentiated cultivation of potato in different provinces in China. Varieties of potatoes may account for apparent variations in maximum N application values across China. Other factors that may have an impact include soil type, soil N supply, fertilizer retention capacity, climate, and cultivation and management practices in potato-growing regions [2,42].
This study did not consider the impact of local agricultural policies on the economic benefits of regional potatoes, despite the fact that it examined the economic benefits of the effectiveness of N fertilizer management of potatoes in the northeast region of China, taking into account the variations among cities (counties) and the unevenness of regional development to some extent. Furthermore, the yield of potatoes is the only metric used to assess the effectiveness of N fertilizer management, and the next step needs to quantify potato quality (e.g., content of starch, reducing sugar, total soluble sugar, and vitamins). Additionally, potato growth and development are also affected by a variety of factors such as potassium, phosphorus and other chemical elements, irrigation volume, and planting density [43,44,45], and this study only explored the role of N on potatoes. Future studies on the effects of other elements on potatoes may be taken into account, and the selection of N application programs can be measured from the perspective of environmental protection, which is the next focus of research.

5. Conclusions

The potato in northeastern China was chosen as the research object in this work, and experiments on the impacts of different N-AS and N-AL on potato production and economic gains in 2013–2017 were conducted using the DSSAT model as a tool. In order to determine the best N fertilizer application program, model simulations and experimental data were used to investigate the mechanism underlying the impacts of N fertilizer on potato output and gains. The findings showed that adding N fertilizer helped to increase potato production, but they did not imply that bigger yields would follow from adding more N fertilizer. To obtain a high yield, it should be applied reasonably instead. The potato yield in the northeast region showed an inverted “U” growth trend with the increase in N application. In the specific N application program, the optimal application amount is 275~330 kg/hm2 (L5 and L6 treatments), and applying N fertilizer at different times is better than applying it all at once at the time of sowing to increase yield. In the sowing period and the end of tuber formation, the application of N fertilizer with the ratio of 1:1 (M1 treatment) increased the yield most. When it comes to economic benefits, the highest net gains are frequently not achieved when more N fertilizer is used to encourage higher potato yields. Therefore, in order to prevent needless financial losses brought on by applying more N fertilizer carelessly in the hope of achieving a better yield, the link between yield, cost, and benefits should be fully and appropriately considered. In order to maximize net gains from potato cultivation in the northeast, farmers in Heilongjiang, Jilin, and Liaoning provinces are advised to apply N fertilizer at a ratio of 1:1 at the end of tuber formation and at sowing, respectively, using 220 kg/hm2, 220 kg/hm2, and 275 kg/hm2. This study can serve as a resource for both research on the comprehensive benefits of potatoes and practical field management considerations pertaining to potatoes.

Author Contributions

Conceptualization, Y.H. and S.L.; methodology, Y.H.; software, S.L.; validation, X.W., H.C. and S.H.; investigation, X.W.; resources, Y.H.; writing—original draft preparation, S.L.; writing—review and editing, Y.H., Y.Z. and X.J.; supervision, S.L.; funding acquisition, Y.H. All authors have read and agreed to the published version of the manuscript.

Funding

This research was funded by the National Natural Science Foundation of China “Study on temporally and spatially precise assessment on potato cultivation suitability based on dynamic process-oriented mode”, grant number “41771562”, The Agricultural Science and Technology Innovation Program (ASTIP) and Fundamental Research Funds for Central Non-profit Scientific Institution, grant number G2023-01-27.

Data Availability Statement

The data reported in this study are contained within the article.

Acknowledgments

The authors sincerely thank Ruiyang Xu and Jinpeng Yang for their assistance in the simulation and field experiments of this study.

Conflicts of Interest

The authors declare no conflict of interest.

References

  1. Zhang, H.; Xu, F.; Wu, Y.; Hu, H.-H.; Dai, X.-F. Progress of potato staple food research and industry development in China. J. Integr. Agric. 2017, 16, 2924–2932. [Google Scholar] [CrossRef]
  2. Li, B.; Xu, X.M.; Zhang, L.; Han, J.; Bian, C.; Li, G.; Liu, J.; Jin, L. Above-ground biomass estimation and yield prediction in potato by using UAV-based RGB and hyperspectral imaging. ISPRS J. Photogramm. Remote Sens. 2020, 162, 161–172. [Google Scholar] [CrossRef]
  3. Li, H.R.; Mei, X.R.; Wang, J.D.; Huang, F.; Hao, W.; Li, B. Drip fertigation significantly increased crop yield, water productivity and nitrogen use efficiency with respect to traditional irrigation and fertilization practices: A meta-analysis in China. Agric. Water Manag. 2021, 244, 10. [Google Scholar] [CrossRef]
  4. Bai, Y.J.; Han, S.X.; Gao, Y.L.; Zhang, W.; Fan, G.; Qiu, C.; Nie, X.; Wen, J. Genetic Diversity of Potato virus Y in Potato Production Areas in Northeast China. Plant Dis. 2019, 103, 289–297. [Google Scholar] [CrossRef]
  5. Gitari, H.I.; Gachene, C.K.K.; Karanja, N.N.; Kamau, S.; Nyawade, S.; Sharma, K.; Schulte-Geldermann, E. Optimizing yield and economic returns of rain-fed potato (Solanum tuberosum L.) through water conservation under potato-legume intercropping systems. Agric. Water Manag. 2018, 208, 59–66. [Google Scholar] [CrossRef]
  6. Rieger, S.; Richner, W.; Streit, B.; Frossard, E.; Liedgens, M. Growth, yield, and yield components of winter wheat and the effects of tillage intensity, preceding crops, and N fertilisation. Eur. J. Agron. 2008, 28, 405–411. [Google Scholar] [CrossRef]
  7. Xu, X.P.; He, P.; Chuan, L.M.; Liu, X.-Y.; Liu, Y.-X.; Zhang, J.-J.; Huang, X.-M.; Qiu, S.-J.; Zhao, S.-C.; Zhou, W. Regional distribution of wheat yield and chemical fertilizer requirements in China. J. Integr. Agric. 2021, 20, 2772–2780. [Google Scholar] [CrossRef]
  8. Yin, J.; Song, Z.; Guo, X.S.; Ding, F.; Shen, Y.; Zhang, J.; Zhao, C.; Liu, T.; Ma, X. Adjusting the fertilizer application structure for nutrient saving and yield increase in potato. Int. J. Plant Prod. 2023, 17, 379–387. [Google Scholar] [CrossRef]
  9. Prikaziuk, E.; Ntakos, G.; ten Den, T.; Reidsma, P.; van der Wal, T.; van der Tol, C. Using the SCOPE model for potato growth, productivity and yield monitoring under different levels of nitrogen fertilization. Int. J. Appl. Earth Obs. Geoinf. 2022, 114, 16. [Google Scholar] [CrossRef]
  10. Guo, H.; Pu, X.Q.; Jia, H.; Zhou, Y.; Ye, G.; Yang, Y.; Na, T.; Wang, J. Transcriptome analysis reveals multiple effects of nitrogen accumulation and metabolism in the roots, shoots, and leaves of potato (Solanum tuberosum L.). BMC Plant Biol. 2022, 22, 12. [Google Scholar] [CrossRef]
  11. Plauborg, F.; Motarjemi, S.K.; Nagy, D.; Zhou, Z. Analysing potato response to subsurface drip irrigation and nitrogen fertigation regimes in a temperate environment using the Daisy model. Field Crops Res. 2022, 276, 15. [Google Scholar] [CrossRef]
  12. Grzebisz, W.; Szczepaniak, W.; Bocianowski, J. Potassium fertilization as a driver of sustainable management of nitrogen in potato (Solanum tuberosum L.). Field Crops Res. 2020, 254, 13. [Google Scholar] [CrossRef]
  13. Wang, C.; Zang, H.D.; Liu, J.G.; Shi, X.; Li, S.; Chen, F.; Chu, Q. Optimum nitrogen rate to maintain sustainable potato production and improve nitrogen use efficiency at a regional scale in China. A meta-analysis. Agron. Sustain. Dev. 2020, 40, 14. [Google Scholar] [CrossRef]
  14. Nurmanov, Y.T.; Chernenok, V.G.; Kuzdanova, R.S. Potato in response to nitrogen nutrition regime and nitrogen fertilization. Field Crops Res. 2019, 231, 115–121. [Google Scholar] [CrossRef]
  15. Vashisht, B.B.; Nigon, T.; Mulla, D.J.; Rosen, C.; Xu, H.; Twine, T.; Jalota, S. Adaptation of water and nitrogen management to future climates for sustaining potato yield in Minnesota: Field and simulation study. Agric. Water Manag. 2015, 152, 198–206. [Google Scholar] [CrossRef]
  16. Rosen, C.J.; Bierman, P.M. Potato yield and tuber set as affected by phosphorus fertilization. Am. J. Potato Res. 2008, 85, 110–120. [Google Scholar] [CrossRef]
  17. Ierna, A.; Pandino, G.; Lombardo, S.; Mauromicale, G. Tuber yield, water and fertilizer productivity in early potato as affected by a combination of irrigation and fertilization. Agric. Water Manag. 2011, 101, 35–41. [Google Scholar] [CrossRef]
  18. Liu, Q.J.; Kang, J.H.; Wu, J.R.; Sun, J.B.; Ma, X.Y.; Wang, X.Q.; Jian, T.C. Effects of nitrogen application amount on formation and yield of potato tuber starch in Ningxia arid region. J. Nucl. Agric. Sci. 2021, 35, 1196–1208. [Google Scholar]
  19. Zhang, F.; Chen, M.R.; Fu, J.T.; Zhang, X.; Li, Y.; Shao, Y.; Xing, Y.; Wang, X. Coupling effects of irrigation amount and fertilization rate on yield, quality, water and fertilizer use efficiency of different potato varieties in Northwest China. Agric. Water Manag. 2023, 287, 16. [Google Scholar] [CrossRef]
  20. Zotarelli, L.; Rens, L.R.; Cantliffe, D.J.; Stoffella, P.J.; Gergela, D.; Burhans, D. Rate and timing of nitrogen fertilizer application on potato ‘FL1867′. Part I: Plant nitrogen uptake and soil nitrogen availability. Field Crops Res. 2015, 183, 246–256. [Google Scholar] [CrossRef]
  21. Badr, M.A.; El-Tohamy, W.A.; Zaghloul, A.M. Yield and water use efficiency of potato grown under different irrigation and nitrogen levels in an arid region. Agric. Water Manag. 2012, 110, 9–15. [Google Scholar] [CrossRef]
  22. Koch, M.; Naumann, M.; Pawelzik, E.; Gransee, A.; Thiel, H. The importance of nutrient management for potato production part I: Plant nutrition and yield. Potato Res. 2020, 63, 97–119. [Google Scholar] [CrossRef]
  23. Grados, D.; Garcia, S.; Schrevens, E. Assessing the potato yield gap in the Peruvian Central Andes. Agric. Syst. 2020, 181, 10. [Google Scholar] [CrossRef]
  24. Bohl, W.H.; Stark, J.C.; McIntosh, C.S. Potato seed piece size, spacing, and seeding rate effects on yield, quality and economic return. Am. J. Potato Res. 2011, 88, 470–478. [Google Scholar] [CrossRef]
  25. Wang, C.; Shi, X.Y.; Liu, J.G.; Zhao, J.; Bo, X.; Chen, F.; Chu, Q. Interdecadal variation of potato climate suitability in China. Agric. Ecosyst. Environ. 2021, 310, 11. [Google Scholar] [CrossRef]
  26. He, Y.B.; Zhou, Y.F.; Cai, W.M.; Wang, Z.-Z.; Duan, D.-D.; Luo, S.-J.; Chen, J.-Z. Using a process-oriented methodology to precisely evaluate temperature suitability for potato growth in China using GIS. J. Integr. Agric. 2017, 16, 1520–1529. [Google Scholar] [CrossRef]
  27. Luo, S.; He, Y.B.; Li, Q.; Jiao, W.; Zhu, Y.; Zhao, X. Nondestructive estimation of potato yield using relative variables derived from multi-period LAI and hyperspectral data based on weighted growth stage. Plant Methods 2020, 16, 14. [Google Scholar] [CrossRef]
  28. Bala, S.K.; Islam, A.S. Correlation between potato yield and MODIS-derived vegetation indices. Int. J. Remote Sens. 2009, 30, 2491–2507. [Google Scholar] [CrossRef]
  29. Gayler, S.; Wang, E.; Priesack, E.; Schaaf, T.; Maidl, F.-X. Modeling biomass growth, N-uptake and phenological development of potato crop. Geoderma 2002, 105, 367–383. [Google Scholar] [CrossRef]
  30. Raymundo, R.; Asseng, S.; Prassad, R.; Kleinwechter, U.; Concha, J.; Condori, B.; Bowen, W.; Wolf, J.; Olesen, J.E.; Dong, Q.; et al. Performance of the SUBSTOR-potato model across contrasting growing conditions. Field Crops Res. 2017, 202, 57–76. [Google Scholar] [CrossRef]
  31. St’astna, M.; Toman, F.; Dufkova, J. Usage of SUBSTOR model in potato yield prediction. Agric. Water Manag. 2010, 97, 286–290. [Google Scholar] [CrossRef]
  32. Duan, D.D.; He, Y.B.; Yu, J.K.; Liu, L.; Xu, R.; Li, W. Parameter sensitivity analysis and suitability evaluation of DSSAT-SUBSTOR potato model. J. Anhui Agric. Univ. 2019, 46, 521–527. [Google Scholar]
  33. Ward, W.A. Cost-benefit analysis theory versus practice at the world bank 1960 to 2015. J. Benefit-Cost Anal. 2019, 10, 124–144. [Google Scholar] [CrossRef]
  34. Vos, J. The effects of nitrogen supply and stem density on leaf attributes and stem branching in potato (Solanum tuberosum L.). Potato Res. 1995, 38, 271–279. [Google Scholar] [CrossRef]
  35. Goffart, J.P.; Olivier, M.; Frankinet, M. Potato crop nitrogen status assessment to improve N fertilization management and efficiency: Past-present-future. Potato Res. 2008, 51, 355–383. [Google Scholar] [CrossRef]
  36. Li, Y.; Wang, J.; Chen, R.W.; Wang, E.; Wang, B.; Yu, Q.; Hu, Q.; Pan, Z.; Pan, X. Climate-smart planting for potato to balance economic return and environmental impact across China. Sci. Total Environ. 2022, 850, 11. [Google Scholar] [CrossRef] [PubMed]
  37. Setu, H.; Mitiku, T. Response of potato to nitrogen and phosphorus fertilizers at Assosa, western Ethiopia. Agron. J. 2020, 112, 1227–1237. [Google Scholar] [CrossRef]
  38. Getaneh, L.; Laekemariam, F. Response of potato (solanum tuberosum L.) to NPS fertilizer rates and inter-row spacing in Kechi district, south western Ethiopia. Appl. Environ. Soil Sci. 2021, 2021, 11. [Google Scholar] [CrossRef]
  39. Li, C.; Feng, H.; Luo, X.Q.; Li, Y.; Wang, N.; Wu, W.; Zhang, T.; Dong, Q.; Siddique, K.H. Limited irrigation and fertilization in sand-layered soil increases nitrogen use efficiency and economic benefits under film mulched ridge-furrow irrigation in arid areas. Agric. Water Manag. 2022, 262, 11. [Google Scholar] [CrossRef]
  40. Mushtaq, S.; An-Vo, D.A.; Christopher, M.; Zheng, B.; Chenu, K.; Chapman, S.C.; Christopher, J.T.; Stone, R.C.; Frederiks, T.M.; Alam, G.M. Economic assessment of wheat breeding options for potential improved levels of post head-emergence frost tolerance. Field Crops Res. 2017, 213, 75–88. [Google Scholar] [CrossRef]
  41. Ma, W.J.; Opp, C.; Yang, D.W. Spatiotemporal supply-demand characteristics and economic benefits of crop water footprint in the semi-arid region. Sci. Total Environ. 2020, 738, 12. [Google Scholar] [CrossRef] [PubMed]
  42. Xu, X.P.; He, P.; Qiu, S.J.; Zhao, S.; Ding, W.; Zhou, W. Nutrient management increases potato productivity and reduces environmental risk: Evidence from China. J. Clean. Prod. 2022, 369, 10. [Google Scholar] [CrossRef]
  43. Yuan, B.Z.; Nishiyama, S.; Kang, Y.H. Effects of different irrigation regimes on the growth and yield of drip-irrigated potato. Agric. Water Manag. 2003, 63, 153–167. [Google Scholar] [CrossRef]
  44. Ali, A.M.; Awad, M.Y.M.; Hegab, S.A.; El Gawad, A.M.A.; Eissa, M.A. Effect of potassium solubilizing bacteria (Bacillus cereus) on growth and yield of potato. J. Plant Nutr. 2021, 44, 411–420. [Google Scholar] [CrossRef]
  45. Kahsay, W.S. Effects of nitrogen and phosphorus on potatoes production in Ethiopia: A review. Cogent Food Agric. 2019, 5, 7. [Google Scholar] [CrossRef]
Figure 1. Study area and the distribution of study stations.
Agronomy 13 02920 g001
Figure 2. Differences in potato yields under different nitrogen application styles (**** represents a significant difference at 0.001 level, and Ns represents no significant difference).
Agronomy 13 02920 g002
Figure 3. Variation in potato yield at different N-AL: (a) differences in overall potato yield at different N-AL (**** represents a significant difference at 0.001 level); (b) differences in potato yield at different stations.
Agronomy 13 02920 g003
Figure 4. Box plot of changes in potato yield under different N-AS and N-AL interactions.
Agronomy 13 02920 g004
Figure 5. N-AS and N-AL corresponding to the highest potato yield at different stations during 2013–2017.
Agronomy 13 02920 g005
Figure 6. Main cost prices of potatoes in northeast China, 2013–2017: (a) daily laborer price and urea price; (b) seed potato price; (c) commercial potato price.
Agronomy 13 02920 g006
Figure 7. Potato yield (kg/hm2) and economic gains (CNY) of each station under different N treatments in northeast China, 2013–2017: (a) yield in 2013; (b) economic gains in 2013 (c) yield in 2014; (d) economic gains in 2014; (e) yield in 2015; (f) economic gains in 2015; (g) yield in 2016; (h) economic gains in 2016; (i) yield in 2017; (j) economic gains in 2017.
Agronomy 13 02920 g007
Figure 8. Correspondence between the highest potato yield and maximum net income under each nitrogen application treatment at each site in the northeastern areas.
Agronomy 13 02920 g008
Table 1. Experimental treatments.
Experimental TreatmentsNitrogen Fertilizer Application Styles (N-AS)
CK1M1M2M3
Nitrogen fertilizer application levels (N-AL)CK2 (0 kg/hm2)CK1CK2M1CK2M2CK2M3CK2
L1 (55 kg/hm2)CK1L1M1L1M2L1M3L1
L2 (110 kg/hm2)CK1L2M1L2M2L2M3L2
L3 (165 kg/hm2)CK1L3M1L3M2L3M3L3
L4 (220 kg/hm2)CK1L4M1L4M2L4M3L4
L5 (275 kg/hm2)CK1L5M1L5M2L5M3L5
L6 (330 kg/hm2)CK1L6M1L6M2L6M3L6
L7 (385 kg/hm2)CK1L7M1L7M2L7M3L7
Table 2. Net income in Heilongjiang Province.
YearGainsNJBAFJTLSFH
2013Min net income (CNY)5893.848018.607485.029584.8812,690.00
Max net income (CNY)20,479.6628,894.2223,960.3429,417.7046,937.02
Max growth rate (%)2.472.602.202.072.70
2014Min net income (CNY)11,790.8011,368.509416.408751.124226.40
Max net income (CNY)38,946.8637,535.1625,567.0621,692.8018,799.66
Max growth rate (%)2.302.301.721.263.45
2015Min net income (CNY)9113.809641.2013,834.207475.3013,275.40
Max net income (CNY)36,619.1135,367.8140,846.5122,245.9152,030.41
Max growth rate (%)3.022.671.951.982.92
2016Min net income (CNY)9618.4910,084.2014,500.009607.106227.70
Max net income (CNY)40,174.9341,820.2540,385.2823,863.9823,896.38
Max growth rate (%)3.183.151.791.482.84
2017Min net income (CNY)9835.1011,223.2413,837.859379.207371.00
Max net income (CNY)37,949.9238,933.9142,237.9225,827.1729,395.56
Max growth rate (%)2.862.472.051.752.99
Table 3. Net income in Jilin Province.
YearGainsQANADHGZLMHK
2013Min net income (CNY)11,614.8212,250.049646.299629.518856.46
Max net income (CNY)26,085.9834,801.4033,178.0826,183.7424,646.82
Max growth rate (%)1.251.842.441.721.78
2014Min net income (CNY)5902.5011,814.056943.2311,830.1910,020.36
Max net income (CNY)15,429.2534,388.4024,461.8831,183.1330,455.27
Max growth rate (%)1.611.912.521.642.04
2015Min net income (CNY)9600.968861.869503.2710,934.5910,954.07
Max net income (CNY)21,076.4423,200.8433,280.8230,385.5731,284.55
Max growth rate (%)1.201.622.501.781.86
2016Min net income (CNY)5708.845332.304762.484646.908450.22
Max net income (CNY)15,511.8915,230.0416,960.5412,443.0530,313.24
Max growth rate (%)1.721.862.561.682.59
2017Min net income (CNY)7092.904895.505627.905323.0011,788.60
Max net income (CNY)20,276.6314,870.1418,648.8915,365.3335,693.64
Max growth rate (%)1.862.042.311.892.03
Table 4. Net income in Liaoning Province.
YearGainsJPLZDGSZWFD
2013Min net income (CNY)17,594.413,96817,257.616,239.522,271.7
Max net income (CNY)28,869.0428,916.0558,277.2830,461.1542,011.04
Max growth rate (%)0.641.072.380.880.89
2014Min net income (CNY)16,845.612,118.619,417.610,832.815,709.15
Max net income (CNY)34,096.1629,449.2167,641.3126,170.7645,180.26
Max growth rate (%)1.021.432.481.421.88
2015Min net income (CNY)19,12311,86611,14414,299.416,114
Max net income (CNY)33,673.8127,756.3637,474.2636,085.9641,983.76
Max growth rate (%)0.761.342.361.521.61
2016Min net income (CNY)12,355.8501010,650.0517,418.420,154.4
Max net income (CNY)28,963.7914,907.9136,498.3447,084.9940,035.79
Max growth rate (%)1.341.982.431.700.99
2017Min net income (CNY)15,026.88774.2884612,229.920,809.5
Max net income (CNY)35,383.9829,098.9834,411.1843,216.5862,418.68
Max growth rate (%)1.352.322.892.532.00
Disclaimer/Publisher’s Note: The statements, opinions and data contained in all publications are solely those of the individual author(s) and contributor(s) and not of MDPI and/or the editor(s). MDPI and/or the editor(s) disclaim responsibility for any injury to people or property resulting from any ideas, methods, instructions or products referred to in the content.

